119
P4–1, Concluded
4. a. The multiple-step form of income statement contains various sections
for revenues and expenses, with intermediate balances, and concludes
with net income. In the single-step form, the total of all expenses is
P4–2
1.
AQUA CO.
Income Statement
For the Year Ended June 30, 20Y8
Revenues:
Net sales ……………………………………………………………. $3,567,000
Expenses:
Cost of merchandise sold …………………………………… $2,175,000
2.
AQUA CO.
Retained Earnings Statement
For the Year Ended June 30, 20Y8
Retained earnings, July 1, 20Y7 …………………………………. $253,800
Net income for the year …………………………………………….. $775,000
120
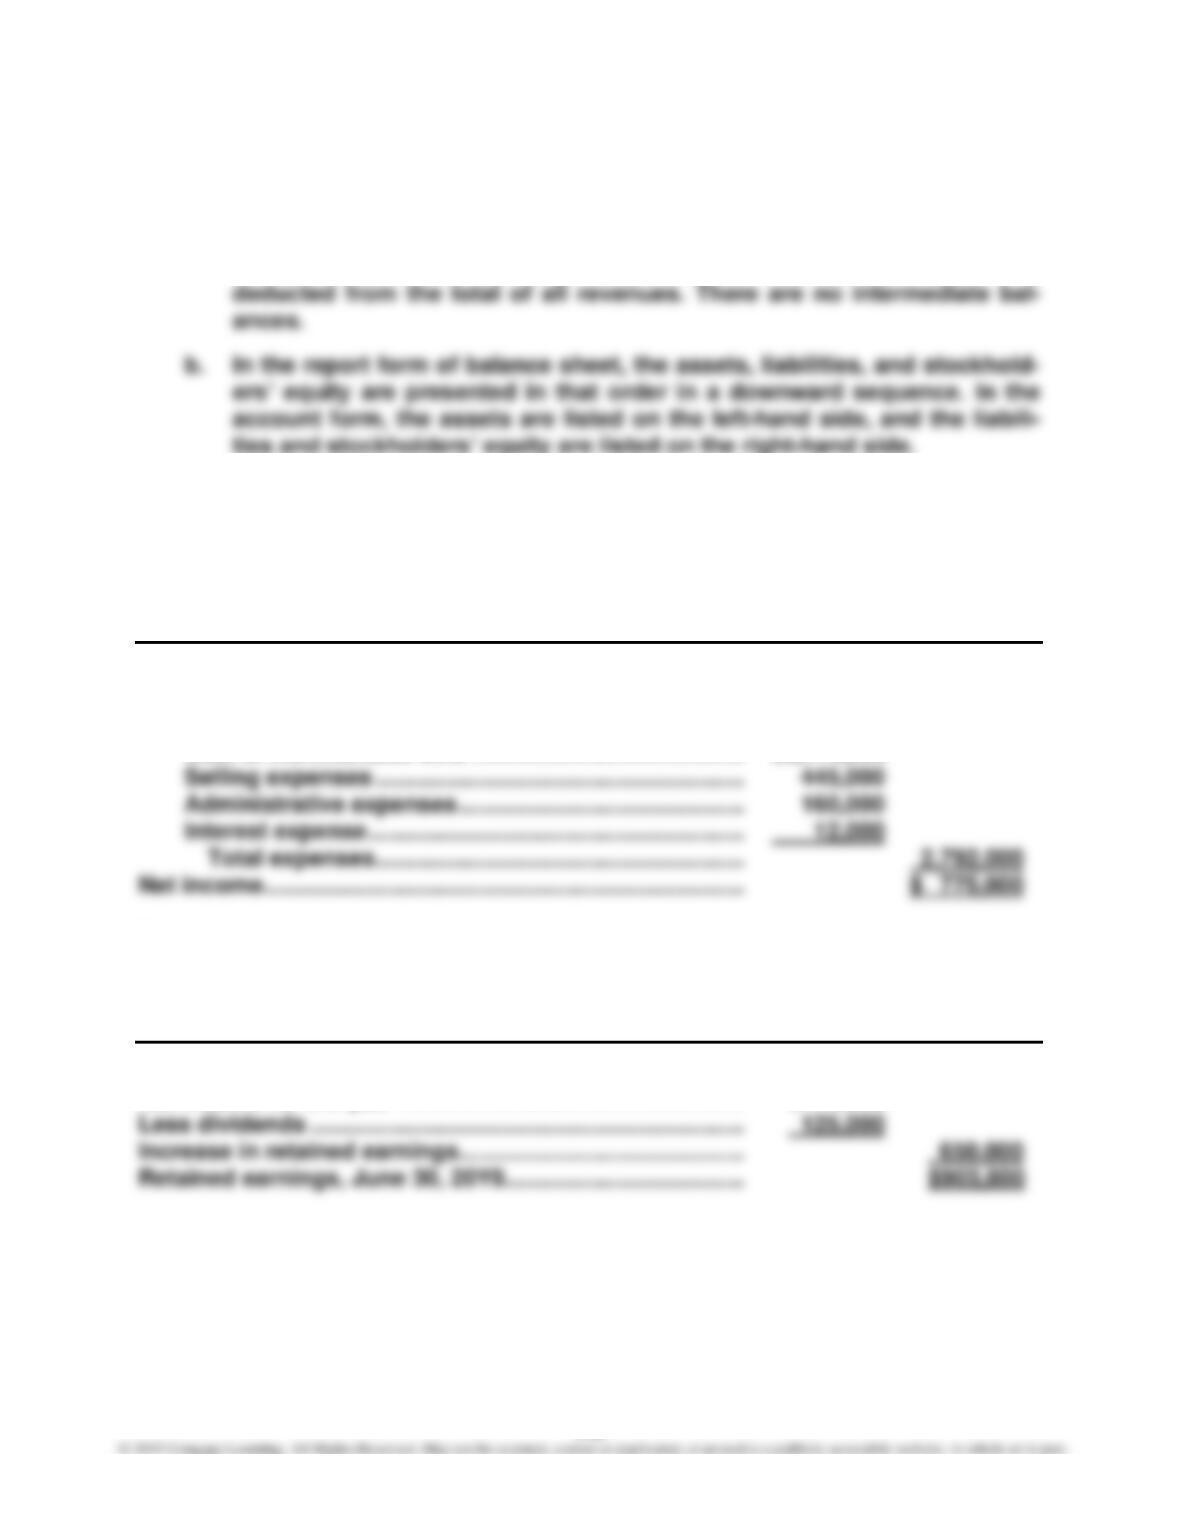
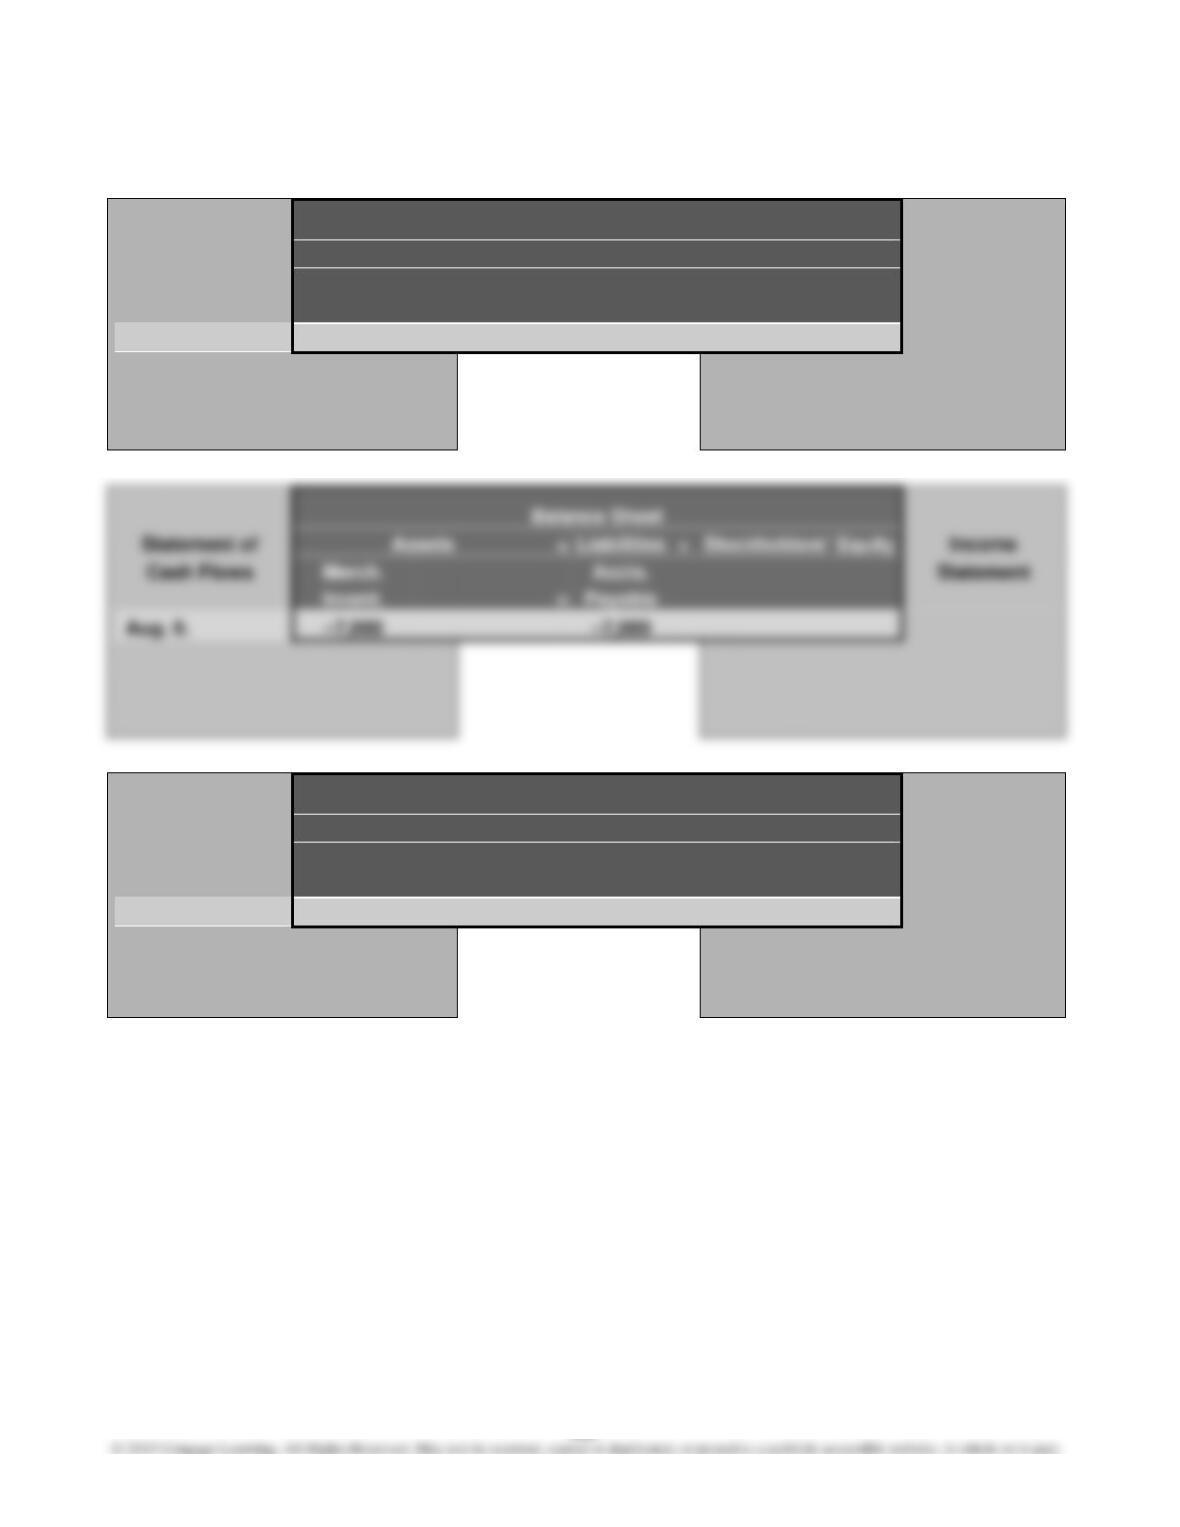
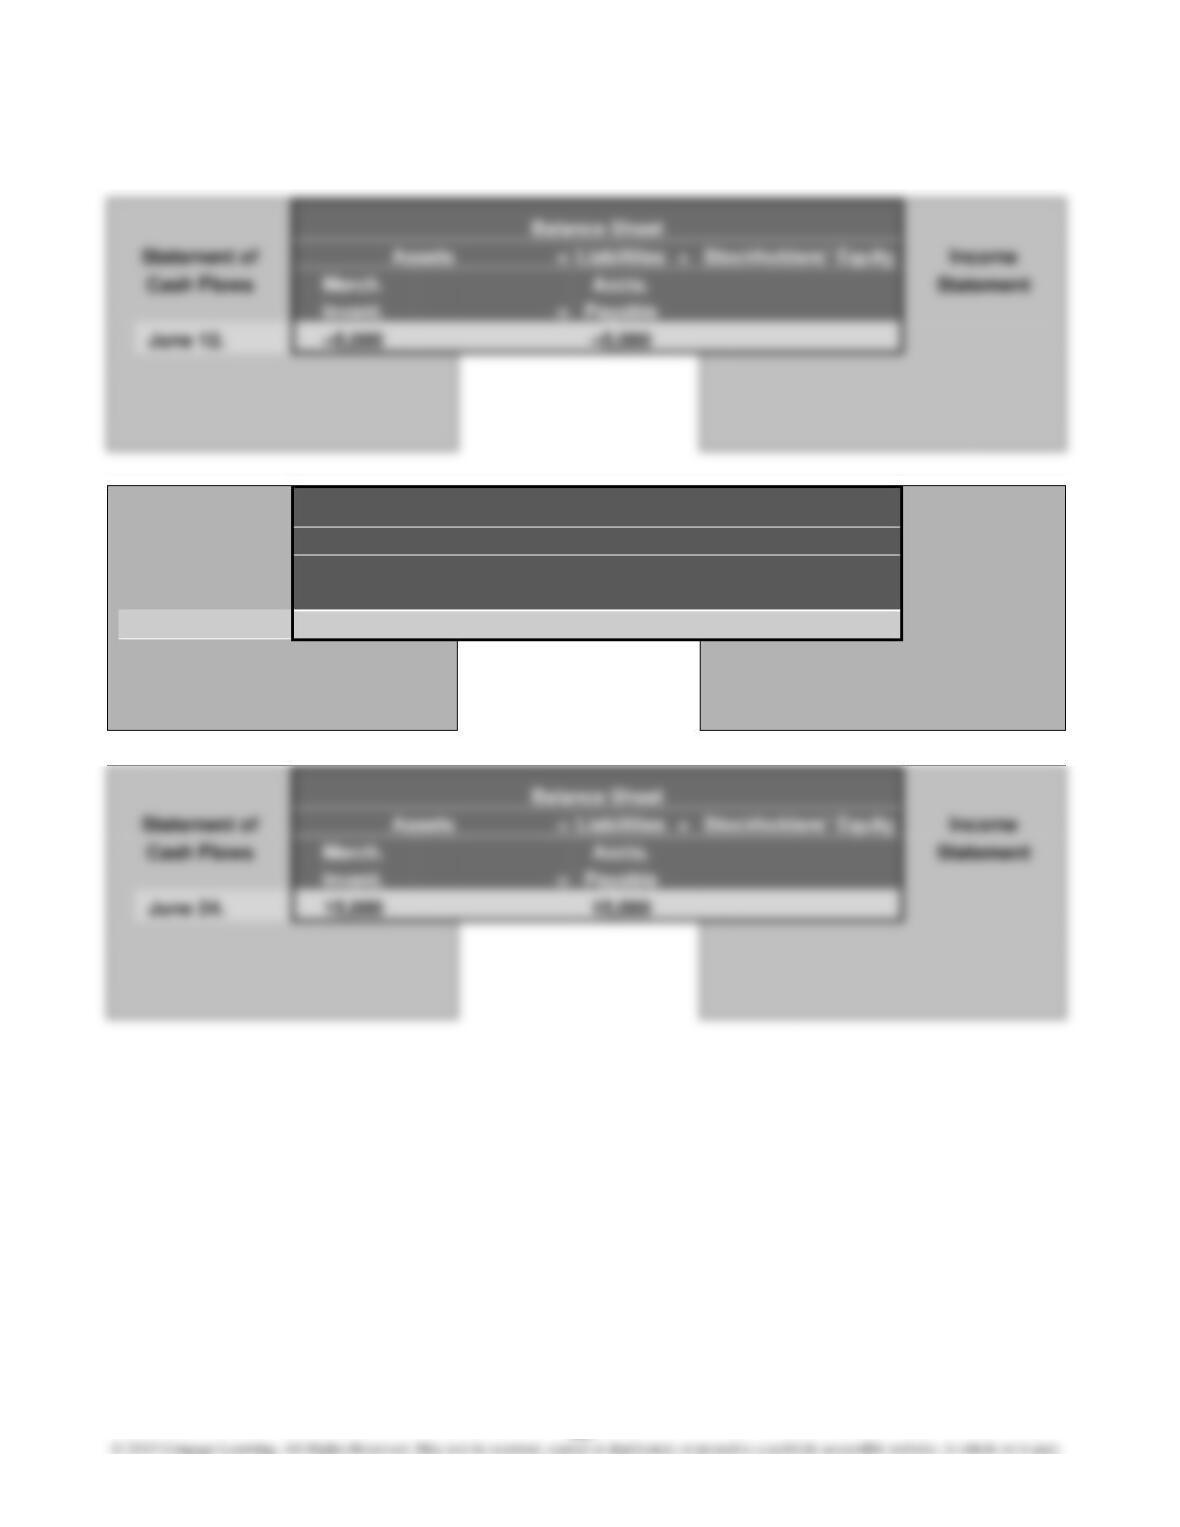
P4–3
Balance Sheet
Statement of
Assets
=
Liabilities
+
Stockholders’ Equity
Income
Cash Flows
Accts.
Merch.
Retained
Statement
Rec.
+
Invent.
=
Earnings
Jan. 6.
Jan. 6.
Income Statement
Jan. 6.
Sales
merch. sold
Balance Sheet
Statement of
Assets
=
Liabilities
+
Stockholders’ Equity
Income
Cash Flows
Accts.
Merch.
Retained
Statement
Rec.
+
Invent.
=
Earnings
Jan. 8.
20,000
–14,000
6,000
Jan. 8.
Income Statement
Jan. 8.
Sales
20,000
Cost of
merch. sold
–14,000
Net income
6,000
Balance Sheet
Statement of
Assets
=
Liabilities
+
Stockholders’ Equity
Income
Cash Flows
Accts.
Merch.
Retained
Statement
Rec.
+
Invent.
=
Earnings
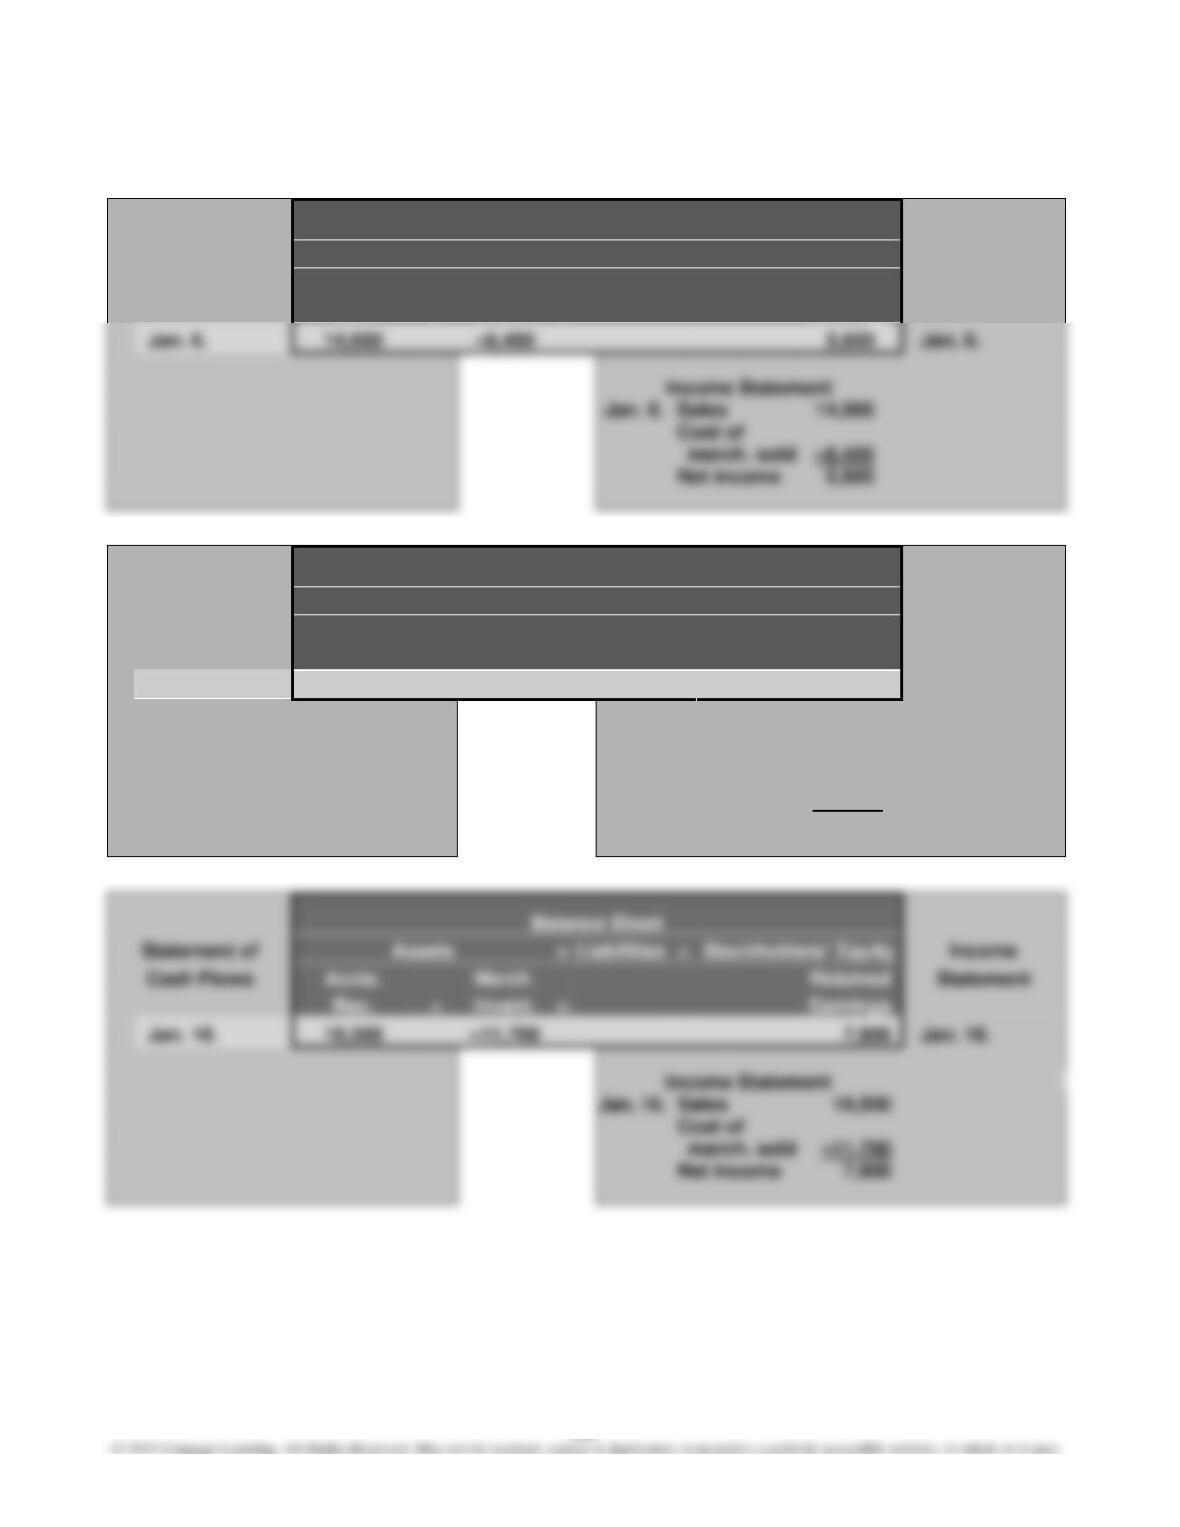
Jan. 16.
–11,700
7,800
Jan. 16.
Income Statement
Jan. 16.
Sales
19,500
merch. sold
Net income
7,800
121
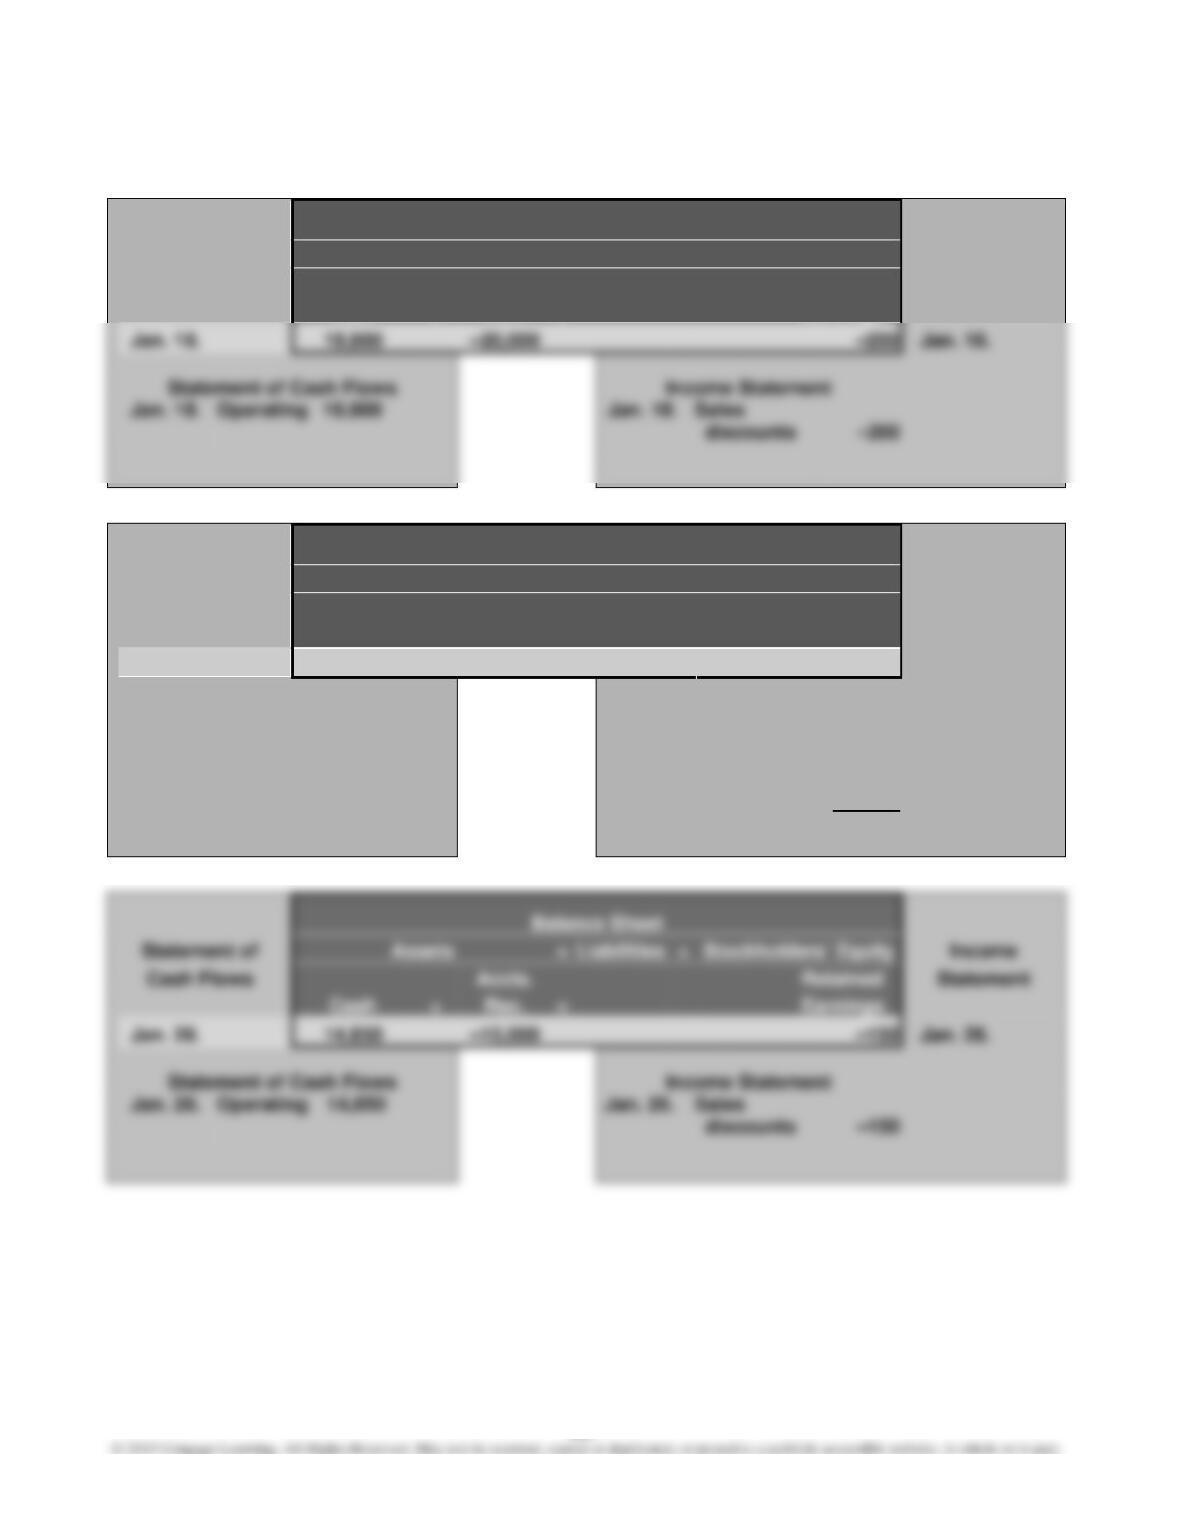
P4–3, Continued
Balance Sheet
Statement of
Assets
=
Liabilities
+
Stockholders’ Equity
Income
Cash Flows
Accts.
Retained
Statement
Cash
+
Rec.
=
Earnings
Jan. 18.
Jan. 18.
Income Statement
Jan. 18.
Operating
Jan. 18.
Sales
discounts
Balance Sheet
Statement of
Assets
=
Liabilities
+
Stockholders’ Equity
Income
Cash Flows
Accts.
Merch.
Retained
Statement
Rec.
+
Invent.
=
Earnings
Jan. 19.
–4,500
2,700
–1,800
Jan. 19.
Income Statement
Jan. 19.
Sales returns
& allow.
–4,500
Cost of
merch. sold
2,700
Net income
–1,800
Balance Sheet
Statement of
Assets
=
Liabilities
+
Stockholders’ Equity
Income
Cash Flows
Accts.
Retained
Statement
Cash
+
Rec.
=
Earnings
Jan. 26.
Jan. 26.
Income Statement
discounts
122
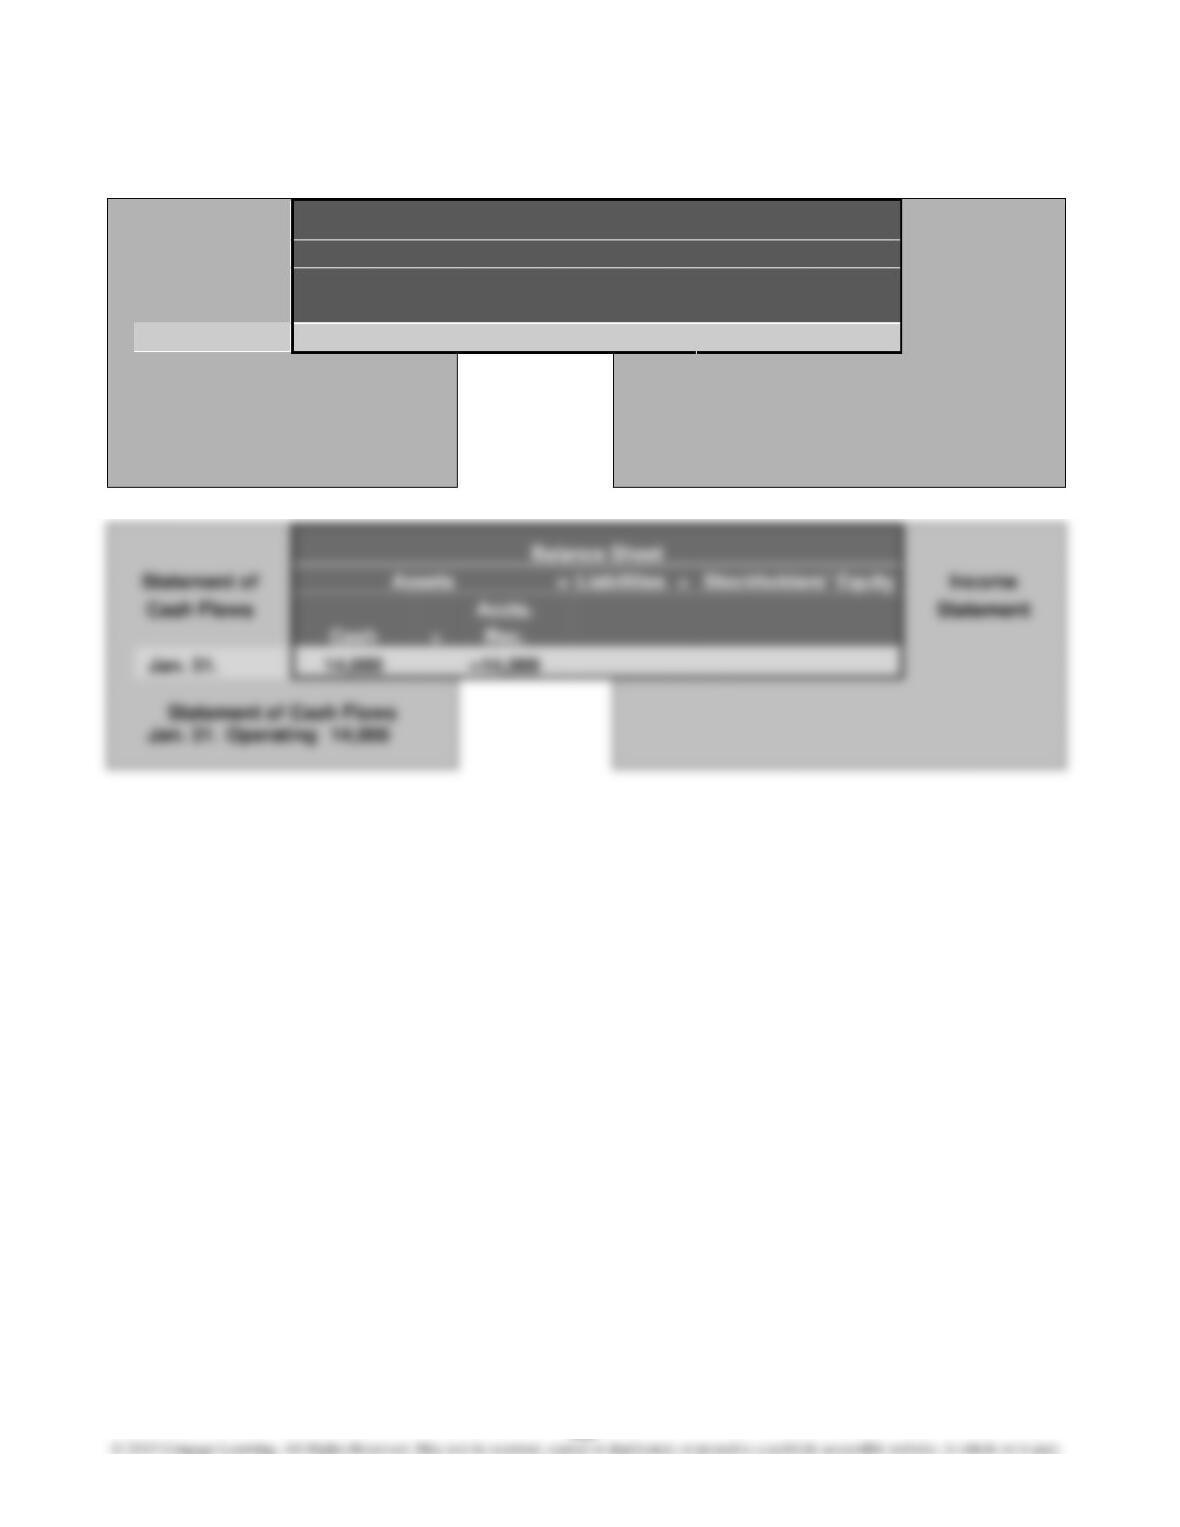
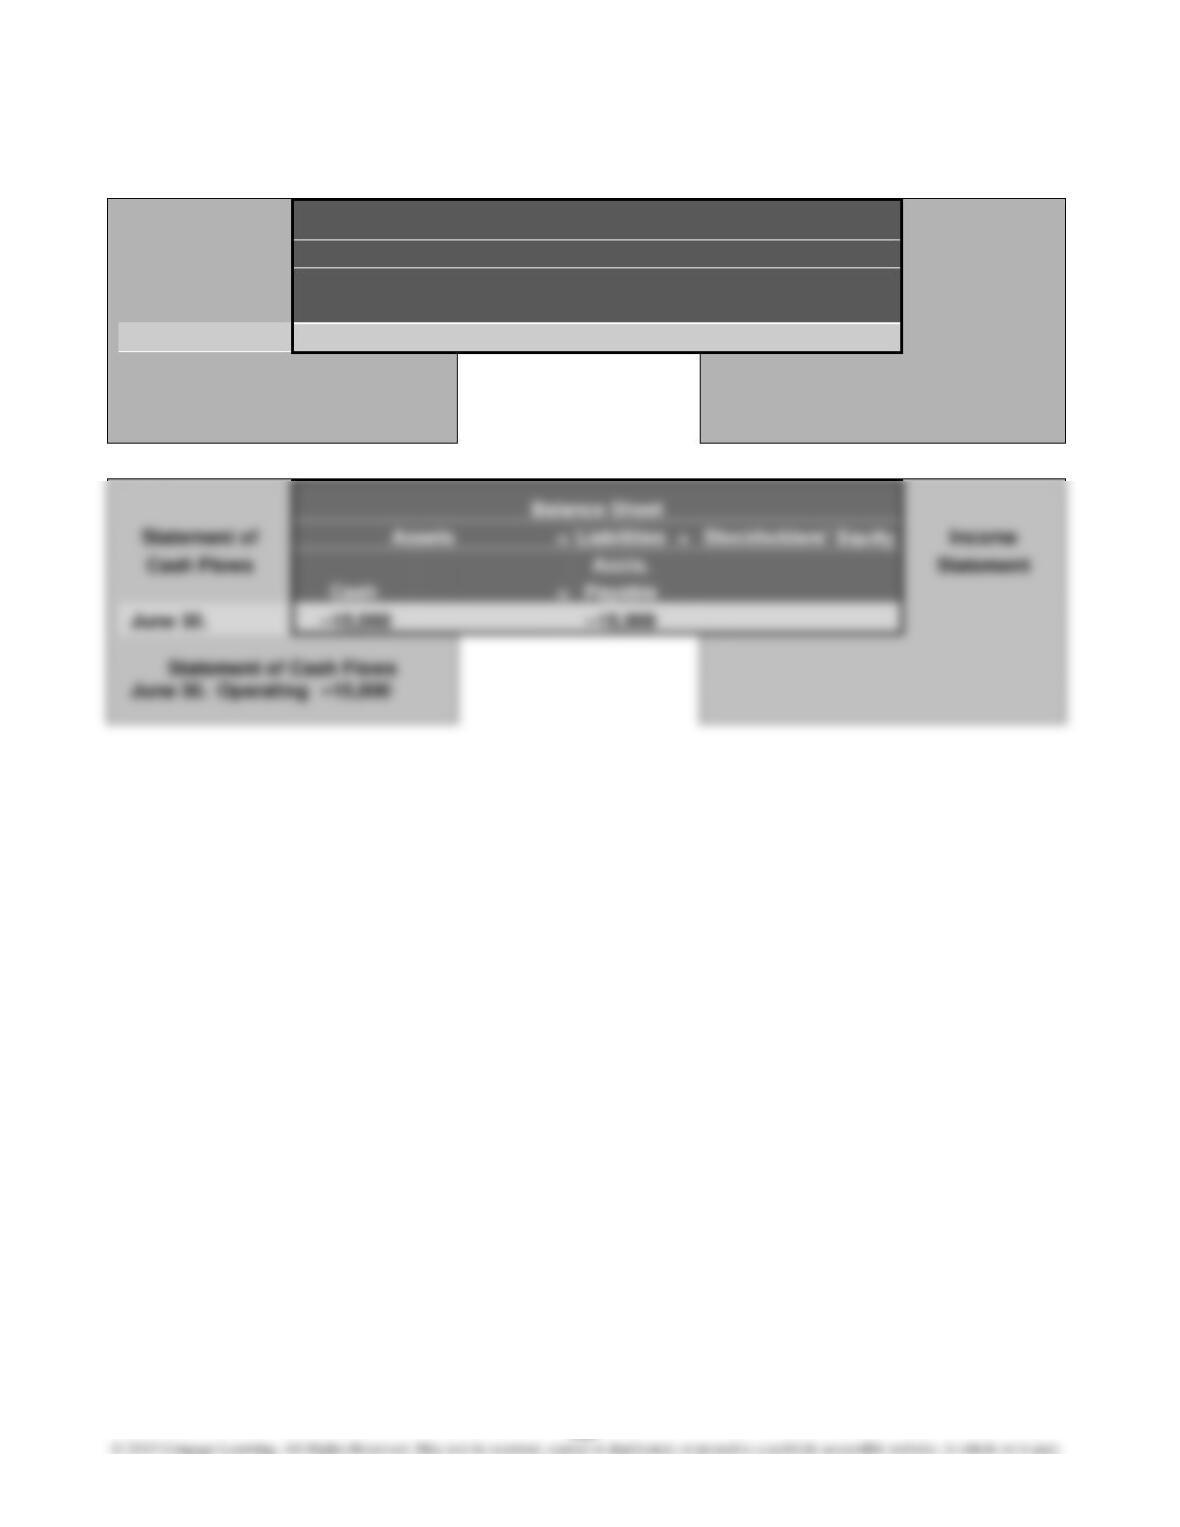
P4–3, Concluded
Balance Sheet
Statement of
Assets
=
Liabilities
+
Stockholders’ Equity
Income
Cash Flows
Retained
Statement
Cash
=
Earnings
Jan. 31.
–3,000
–3,000
Jan. 31.
Statement of Cash Flows
Income Statement
Jan. 31.
Operating
–3,000
Jan. 31.
Delivery
exp.
–3,000
Balance Sheet
Statement of
Assets
=
Liabilities
+
Stockholders’ Equity
Income
Cash Flows
Statement
Cash
Jan. 31.
Statement of Cash Flows
Jan. 31.
Operating
14,000
123
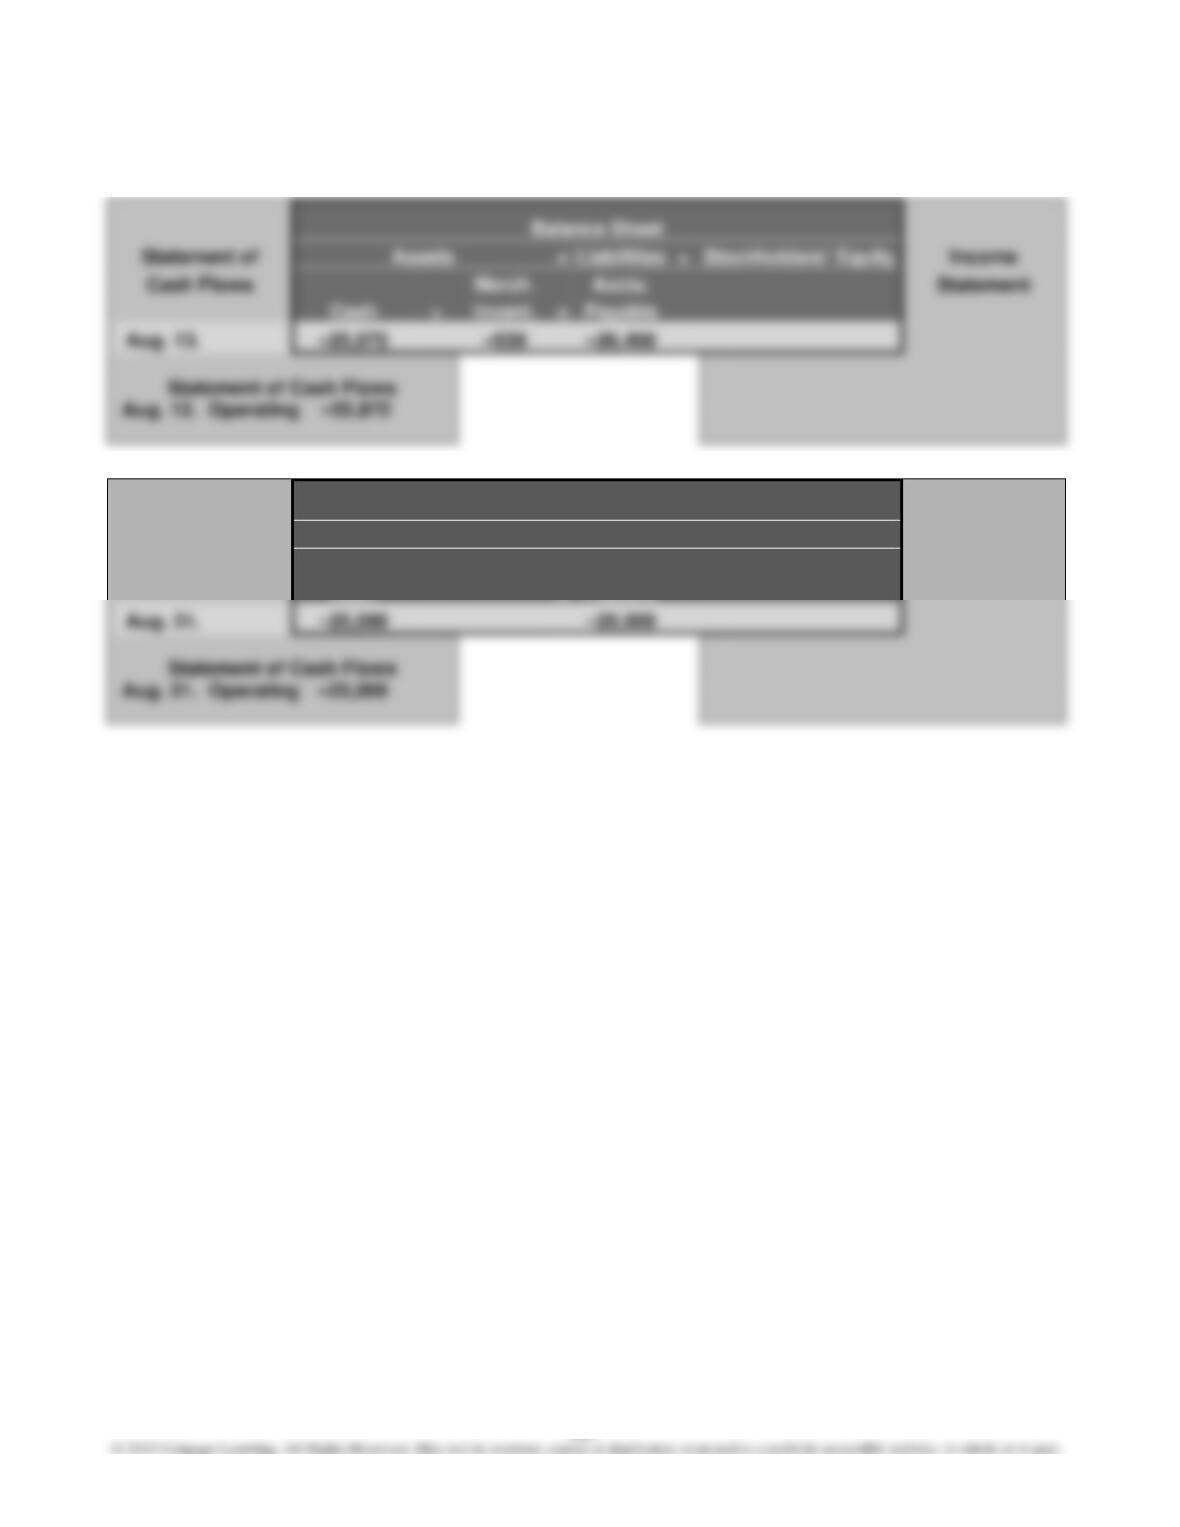
P4–4
Balance Sheet
Statement of
Assets
=
Liabilities
+
Stockholders’ Equity
Income
Cash Flows
Merch.
Accts.
Statement
Invent.
=
Payable
Aug. 3.
33,400
33,400
Balance Sheet
Statement of
Assets
=
Liabilities
+
Stockholders’ Equity
Income
Cash Flows
Merch.
Accts.
Statement
Invent.
=
Payable
Aug. 9.
Balance Sheet
Statement of
Assets
=
Liabilities
+
Stockholders’ Equity
Income
Cash Flows
Merch.
Accts.
Statement
Cash
+
Invent.
=
Payable
Aug. 10.
–600
25,600
25,000
Statement of Cash Flows
Aug. 10.
Operating
–600
124
P4–4, Concluded
Balance Sheet
Statement of
Assets
=
Liabilities
+
Stockholders’ Equity
Income
Cash Flows
Accts.
Statement
Cash
=
Payable
Balance Sheet
Statement of
Assets
=
Liabilities
+
Stockholders’ Equity
Income
Cash Flows
Accts.
Statement
Cash
=
Payable
125
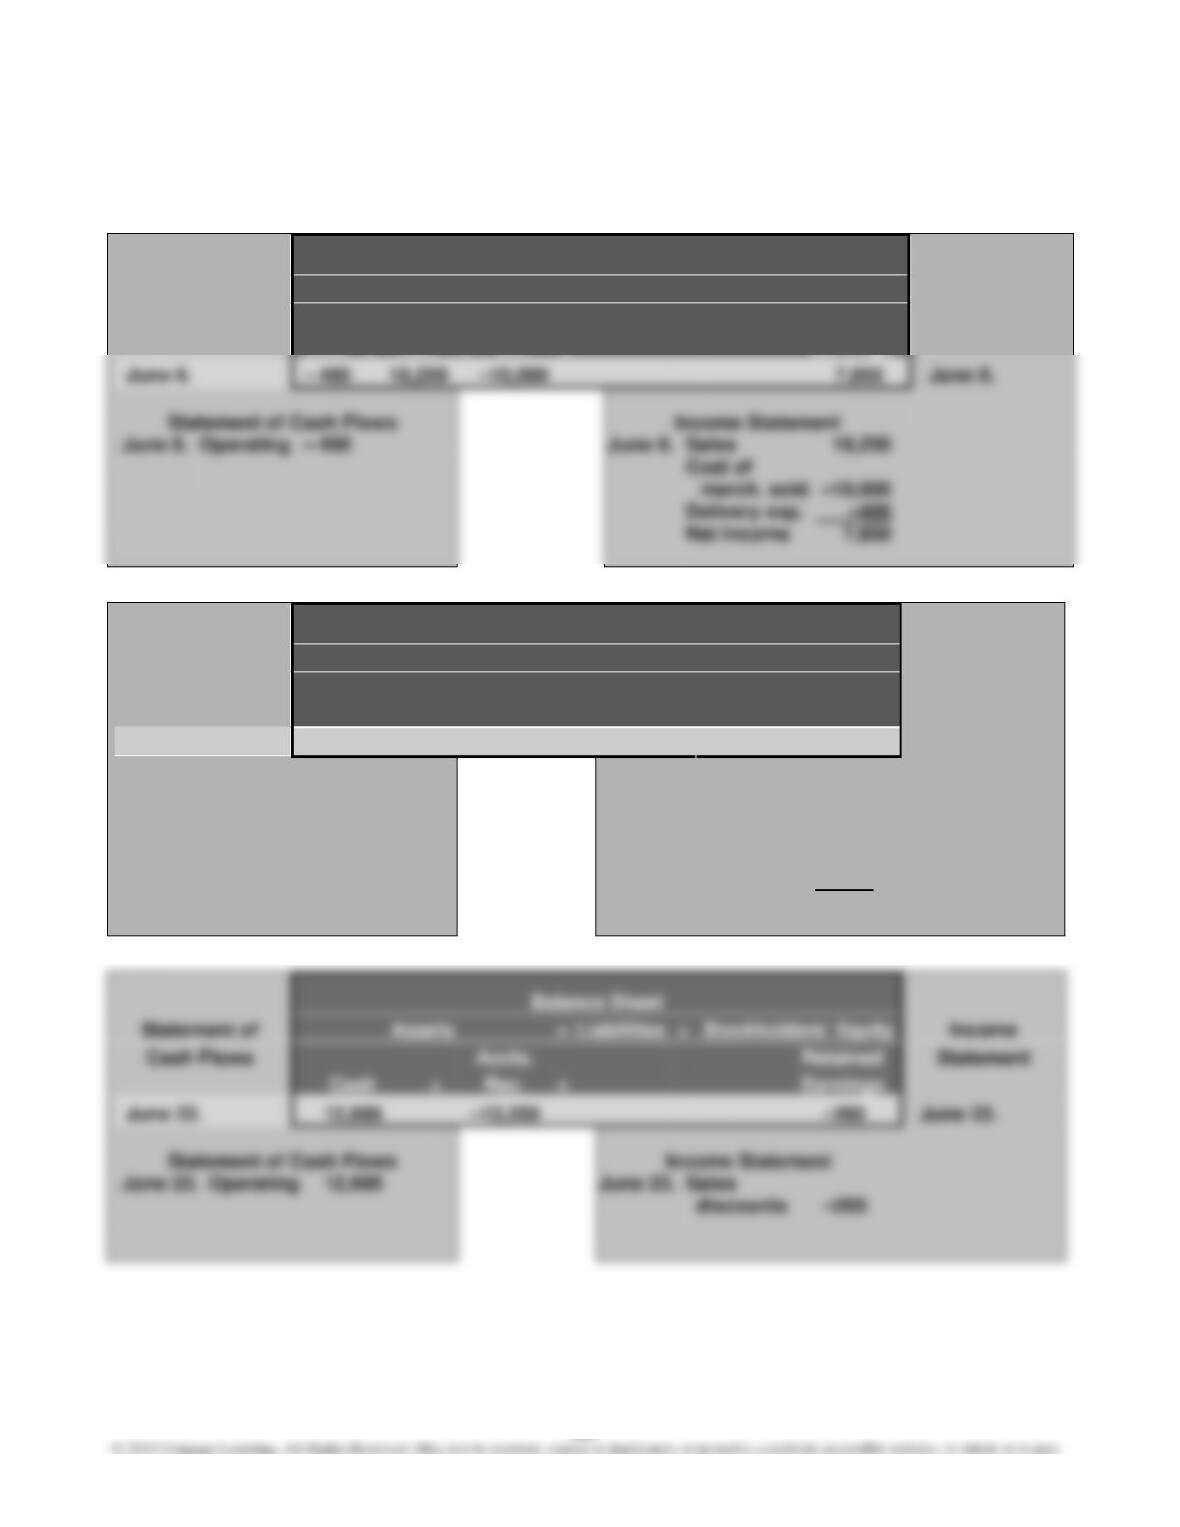
P4–5
1.
Balance Sheet
Statement of
Assets
=
Liabilities
+
Stockholders’ Equity
Income
Cash Flows
Accts.
Merch.
Retained
Statement
Cash
+
Rec.
+
Inv.
=
Earnings
June 8.
June 8.
Income Statement
June 8.
Operating
– 400
June 8.
Sales
Delivery exp.
Net income
7,850
Balance Sheet
Statement of
Assets
=
Liabilities
+
Stockholders’ Equity
Income
Cash Flows
Accts.
Merch.
Retained
Statement
Rec.
+
Invent.
=
Earnings
June 12.
–5,000
3,000
–2,000
June 12.
Income Statement
June 12.
Sales returns
& allow.
–5,000
Cost of
merch. sold
3,000
Net income
–2,000
Balance Sheet
Statement of
Assets
=
Liabilities
+
Stockholders’ Equity
Income
Cash Flows
Accts.
Retained
Statement
+
=
Earnings
June 23.
June 23.
Income Statement
June 23.
Operating
12,985
June 23.
Sales
discounts
–265
126
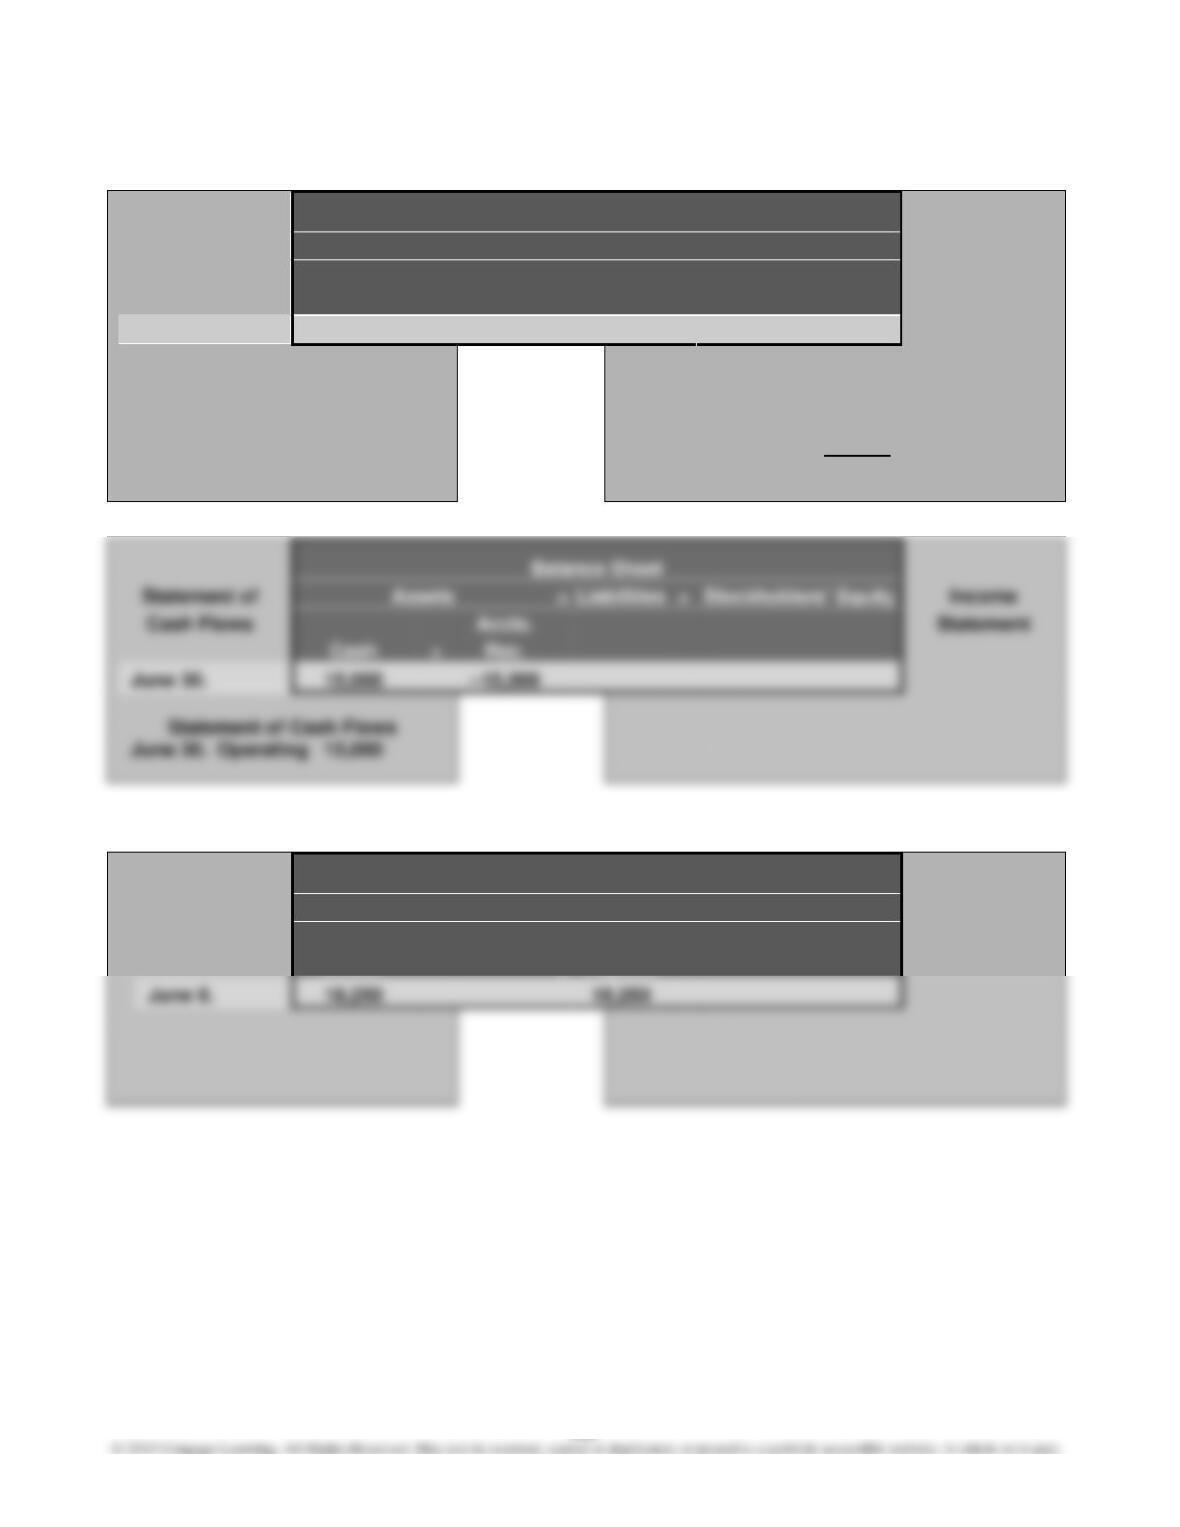
P4–5, Continued
Balance Sheet
Statement of
Assets
=
Liabilities
+
Stockholders’ Equity
Income
Cash Flows
Accts.
Merch.
Retained
Statement
Rec.
+
Inventory
=
Earnings
June 24.
15,000
–9,000
6,000
June 24.
Income Statement
June 24.
Sales
15,000
Cost of
merch. sold
–9,000
Net income
6,000
Balance Sheet
Statement of
Assets
=
Liabilities
+
Stockholders’ Equity
Income
Cash Flows
Statement
+
June 30.
15,000
June 30.
Operating
2.
Balance Sheet
Statement of
Assets
=
Liabilities
+
Stockholders’ Equity
Income
Cash Flows
Merch.
Accts.
Statement
Invent.
=
Payable
June 8.
18,250
127
P4–5, Continued
Balance Sheet
Statement of
Assets
=
Liabilities
+
Stockholders’ Equity
Income
Cash Flows
Accts.
Statement
=
Payable
June 12.
Balance Sheet
Statement of
Assets
=
Liabilities
+
Stockholders’ Equity
Income
Cash Flows
Merch.
Accts.
Statement
Cash
+
Invent.
=
Payable
June 23.
–12,985
–265
–13,250
Statement of Cash Flows
June 23.
Operating
–12,985
Statement of
Assets
=
Liabilities
+
Stockholders’ Equity
Income
Cash Flows
Accts.
Statement
=
Payable
June 24.
128
P4–5, Concluded
Balance Sheet
Statement of
Assets
=
Liabilities
+
Stockholders’ Equity
Income
Cash Flows
Merch.
Statement
Cash
+
Inv.
June 26.
–375
375
Statement of Cash Flows
June 26.
Operating
–375
Balance Sheet
Statement of
Assets
=
Liabilities
+
Stockholders’ Equity
Income
Cash Flows
Statement
Cash
=
Payable
June 30.
Statement of Cash Flows
June 30.
Operating
–15,000
129
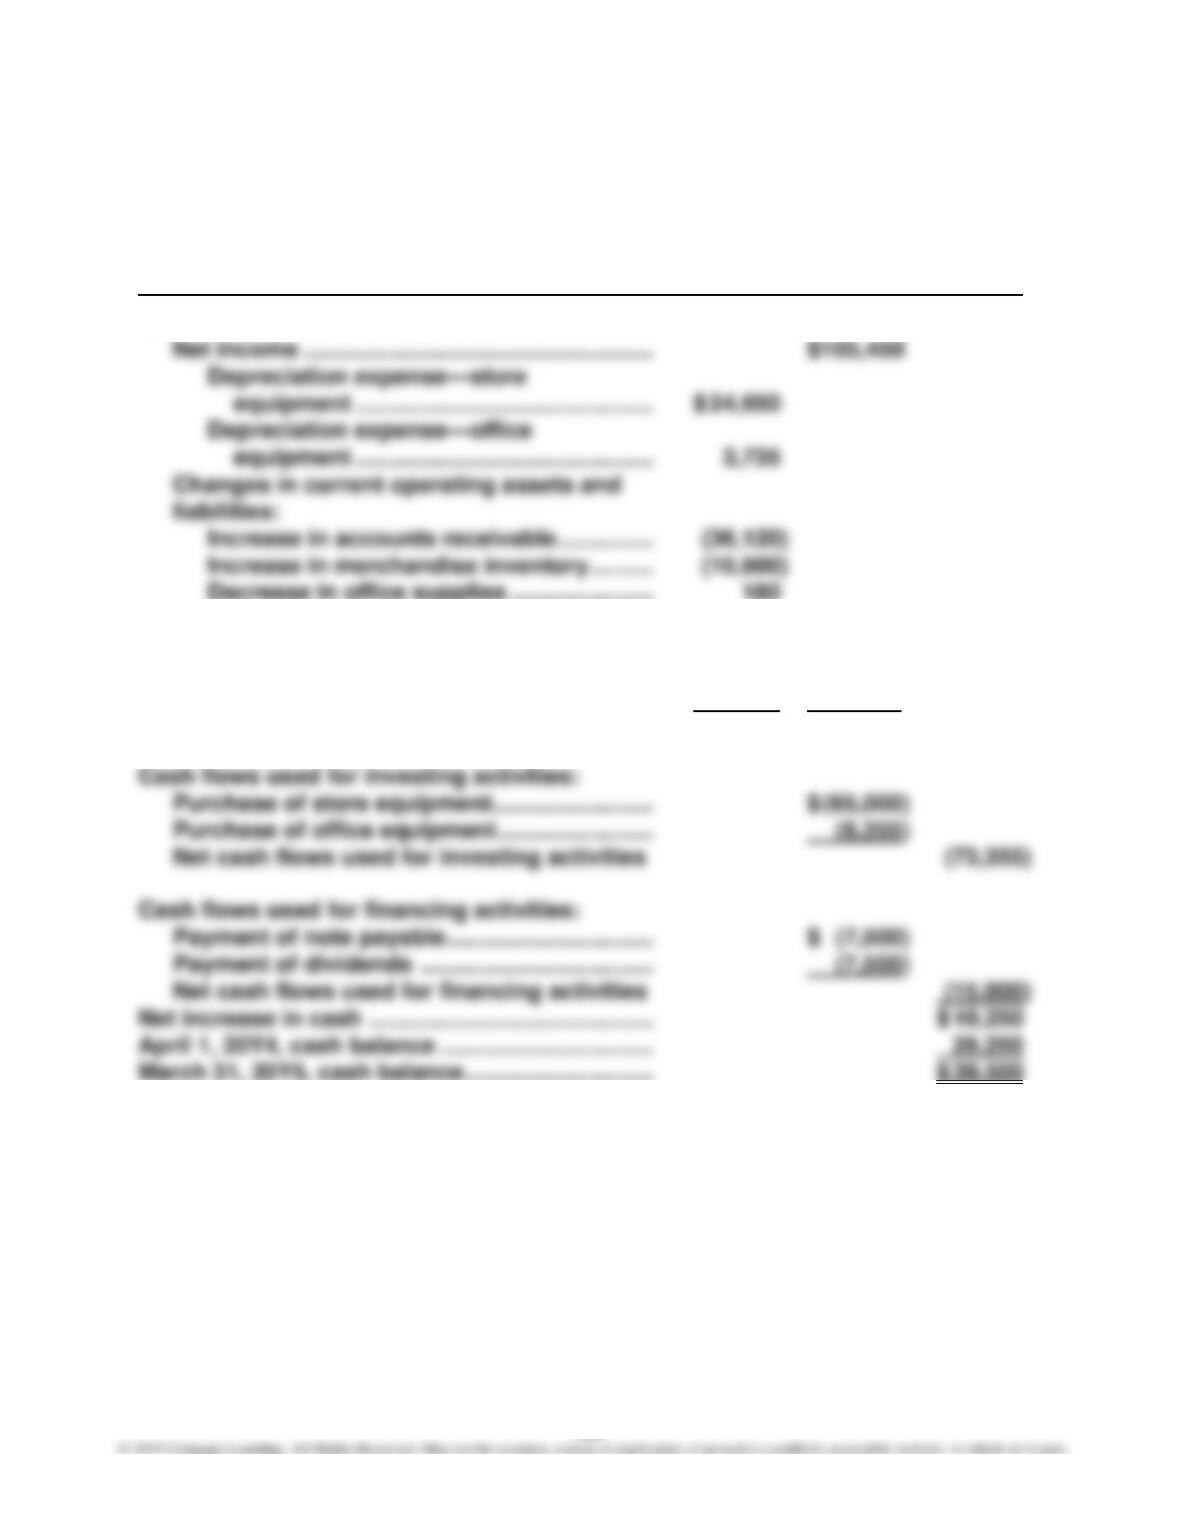
P4–6 (Appendix)
1.
OMEGA SYSTEMS INC.
Statement of Cash Flows
For the Year Ended March 31, 20Y5
Cash flows from operating activities:
Decrease in prepaid insurance …………….. 525
Increase in accounts payable ………………. 12,225
Decrease in salaries payable ………………. (540)
Decrease in unearned rent ………………….. (900) (6,845)
Net cash flows from operating activities …… $ 98,605
2. Depreciation is added to net income in determining net cash flows from op-
erating activities. This is because depreciation is deducted in arriving at net
income, but it does not involve any cash payments.
130
FINANCIAL ANALYSIS
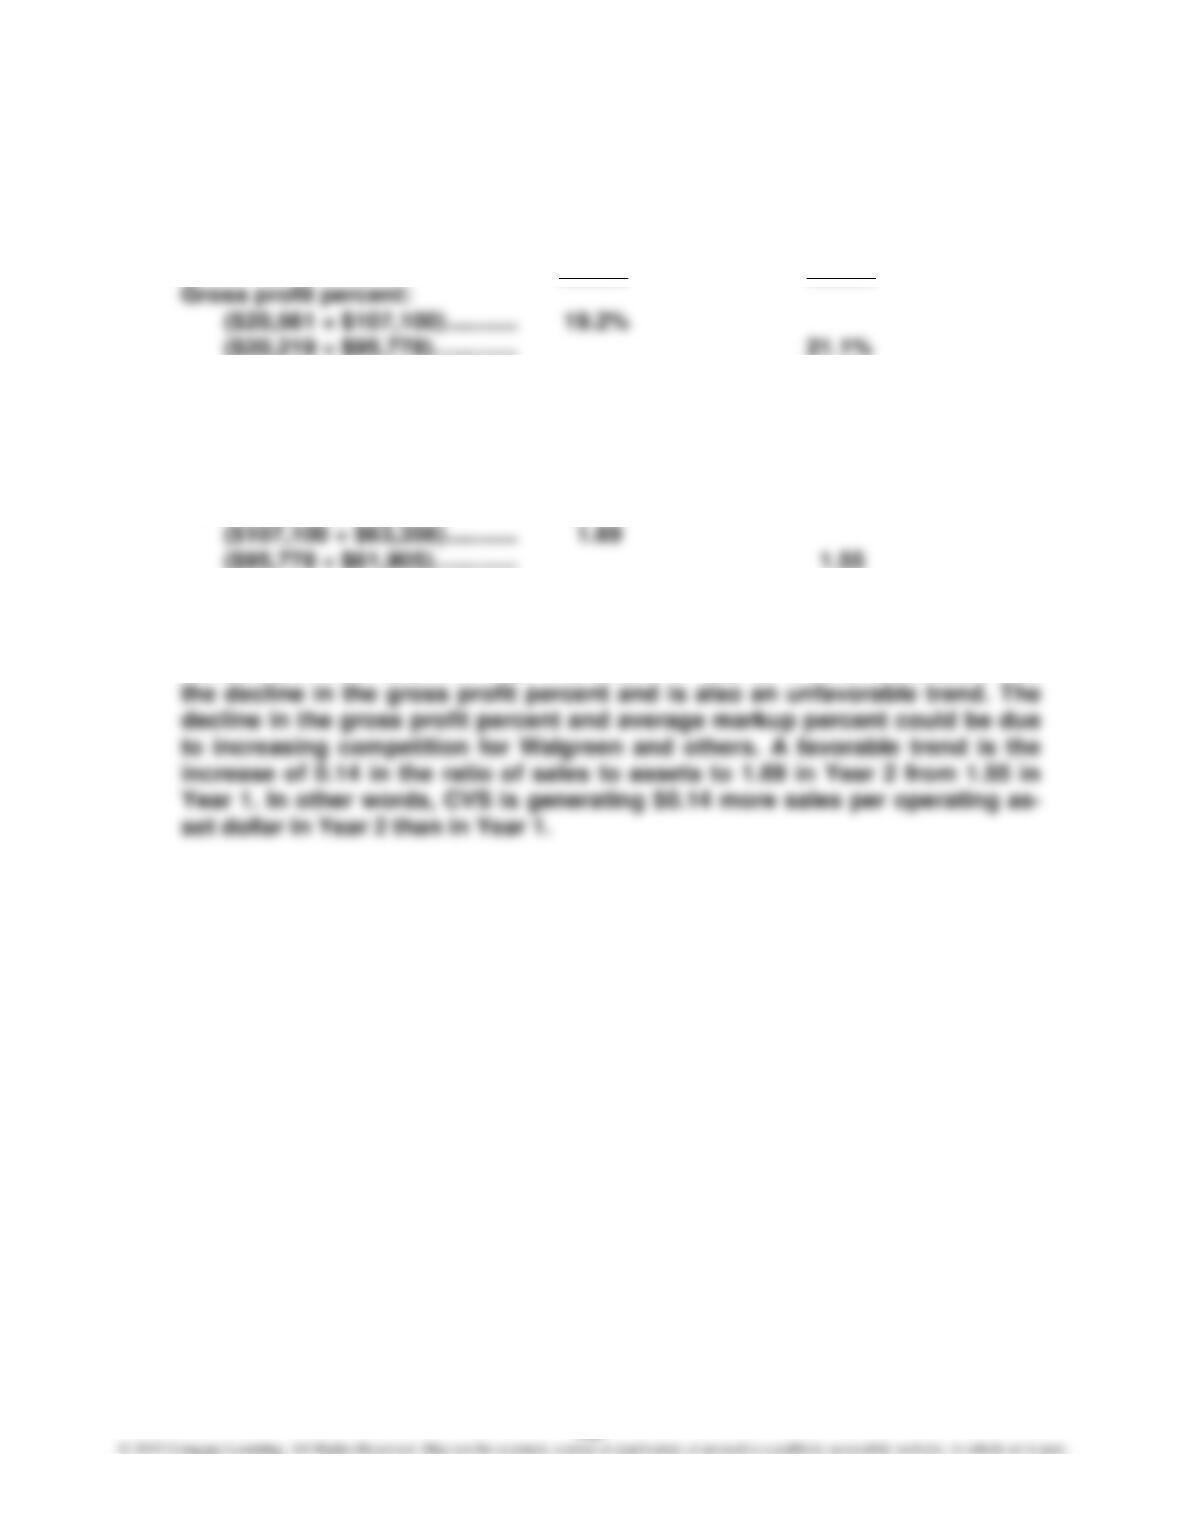
FA4–1
1. Year 2 Year 1
2. Average markup percent:
($20,561 ÷ $86,539) …………. 23.8%
($20,219 ÷ $75,559) …………. 26.8%
3. Ratio of sales to assets:
4. The gross profit percent declined 1.9% from 21.1% in Year 1 to 19.2% in Year
2. This is an unfavorable trend. Likewise, the average markup percent de-
clined 3.0% from 26.8% in Year 1 to 23.8% in Year 2. This is consistent with
131
FA4–2
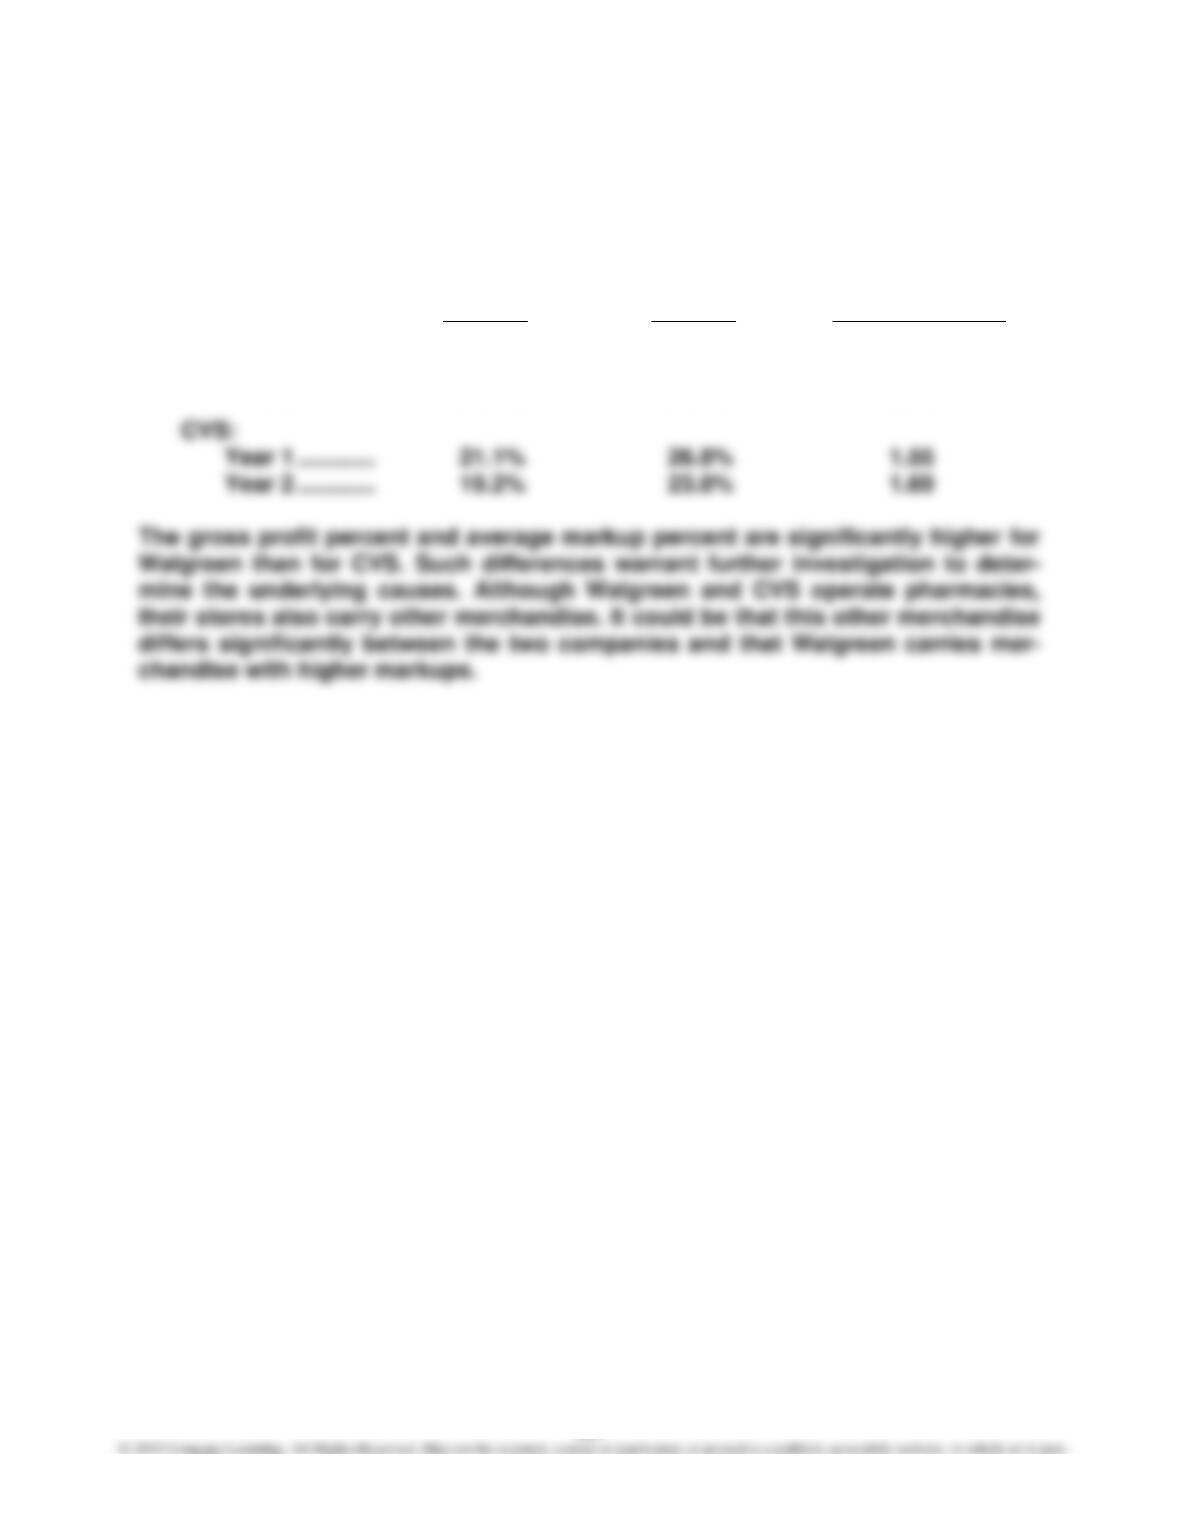
The gross profit percent, average markup percent, and ratio of sales to assets for
CVS and Walgreen are summarized below.
Gross Profit Average Markup Ratio of Sales to
Percent Percent Average Assets
Walgreen:
Year 1 ………… 28.4% 39.6% 2.69
Year 2 ………… 28.4% 39.7% 2.35
Walgreen also uses its assets more efficiently to generate sales than does CVS.
In Year 2, Walgreen generated $2.69 of sales per dollar of invested asset while
CVS generated only $1.55 per invested asset. This could be due to CVS’s rapid
expansion of opening new stores. Sales of new stores could lag initially and then
grow more over time as the stores generate a customer base.
132
FA4–3
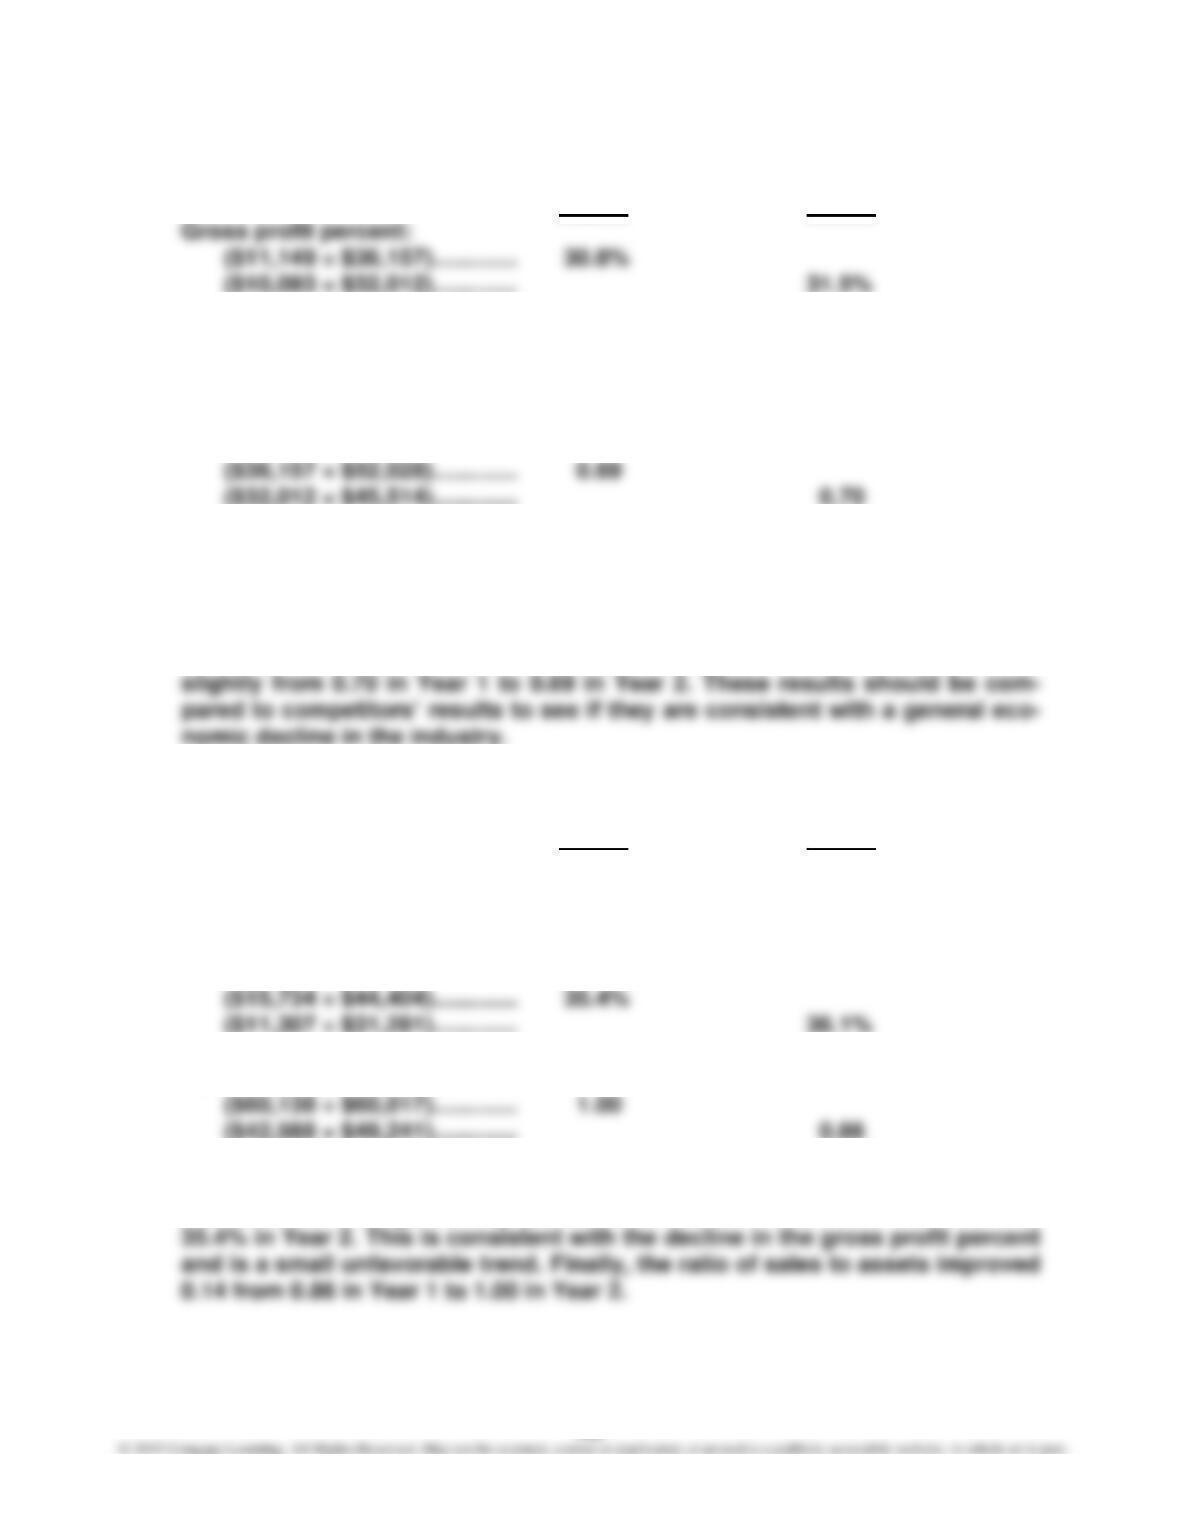
1. Year 2 Year 1
2. Average markup percent:
($11,149 ÷ $25,008) …………. 44.6%
($10,093 ÷ $21,919) …………. 46.0%
3. Ratio of sales to assets:
4. Deere & Company’s financial performance declined slightly from Year 1 to
Year 2. Deere’s gross profit percent decline 0.7% from 31.5% to 30.8%. Like-
wise, the average markup percent declined 1.4% from 46.0% in Year 1 to
44.6% in Year 2. This is consistent with the decline in the gross profit percent
and is a small unfavorable trend. Finally, the ratio of sales to assets declined
FA4–4
1. Year 2 Year 1
Gross profit percent:
($15,734 ÷ $60,138) …………. 26.2%
($11,307 ÷ $42,588) …………. 26.5%
2. Average markup percent:
3. Ratio of sales to assets:
4. Caterpillar Inc.’s gross profit percent declined 0.3% from 26.5% to 26.2%.
Likewise, the average markup percent declined 0.7% from 36.1% in Year 1 to
133
FA4–5
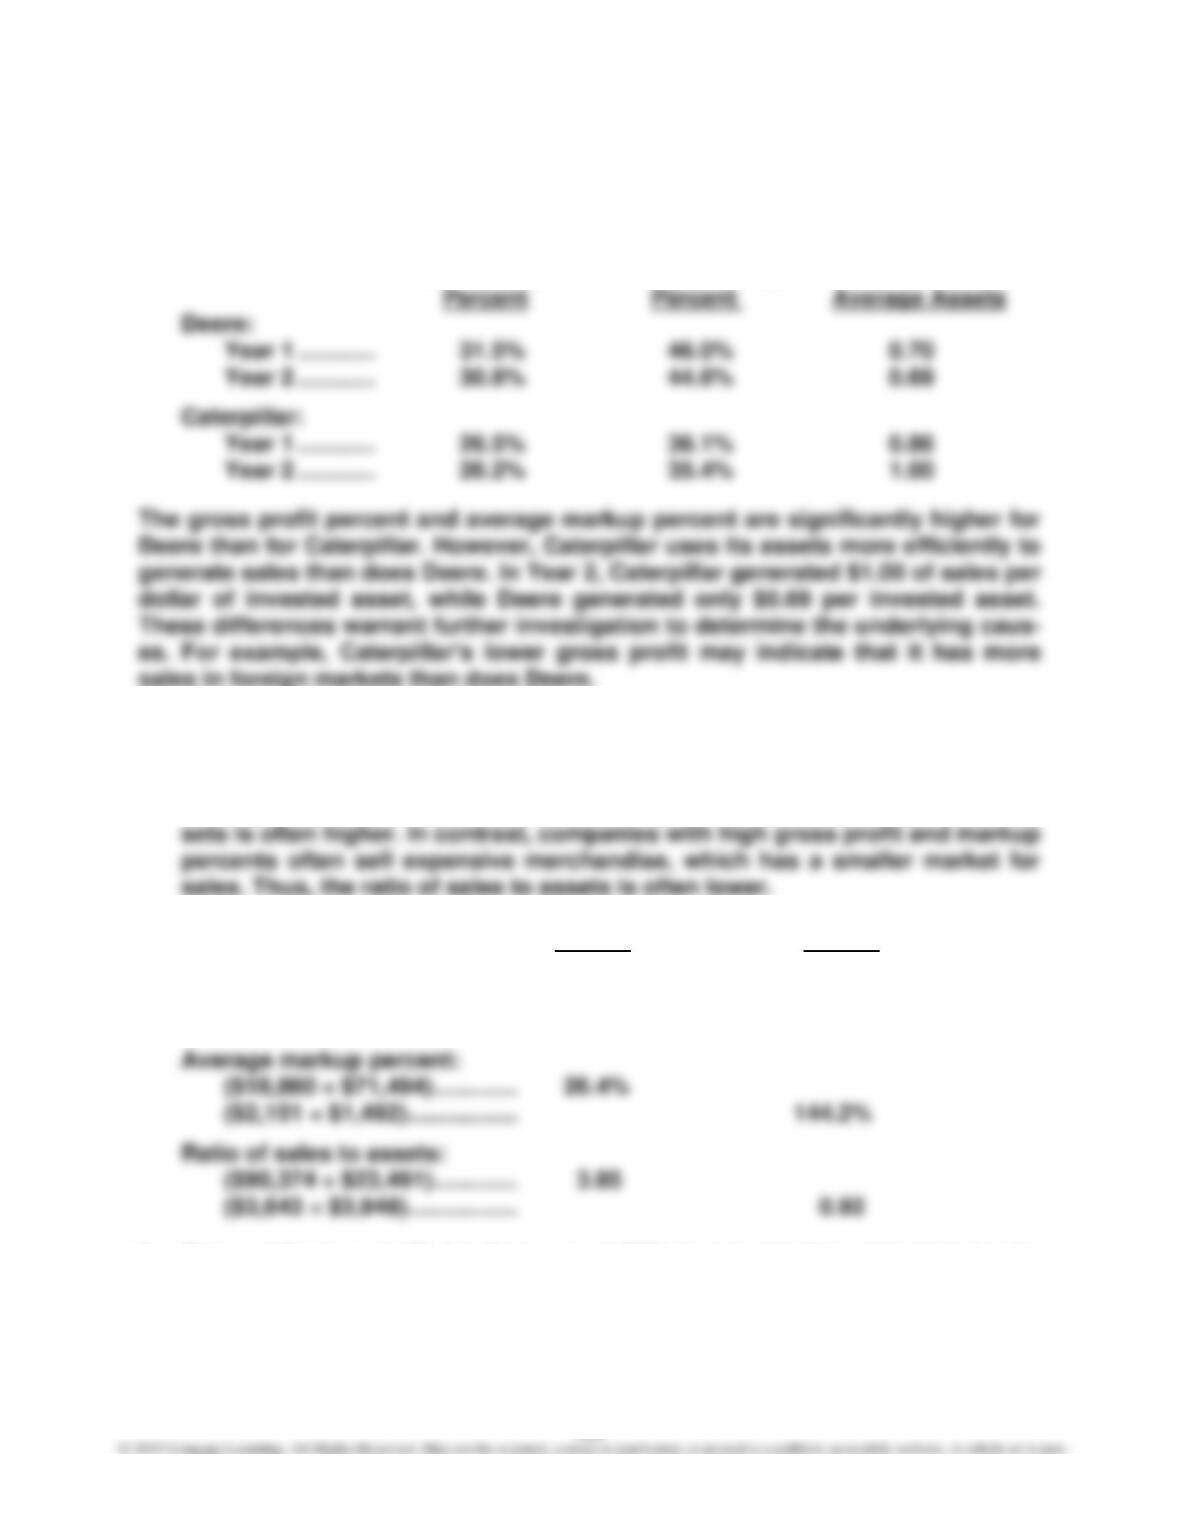
The gross profit percent, average markup percent, and ratio of sales to assets for
Deere and Caterpillar are summarized below.
Gross Profit Average Markup Ratio of Sales to
FA4–6
1. In order to earn a significant profit, companies with low gross profit and
markup percents must sell more merchandise. Thus, the ratio of sales to as-
2. Kroger Tiffany
Gross profit percent:
($18,880 ÷ $90,374) …………. 20.9%
($2,151 ÷ $3,643) …………….. 59.0%
3. The results in part (2) for Kroger and Tiffany support the prior statements.
Kroger has a lower gross profit percent of 20.9% and an average markup per-
cent of 26.4% than does Tiffany which has a gross profit percent of 59.0% and
an average markup percent of 144.2%. Likewise, Kroger has a ratio of sales to
assets of 3.85 compared to Tiffany’s 0.92.
CASES
Case 4–1
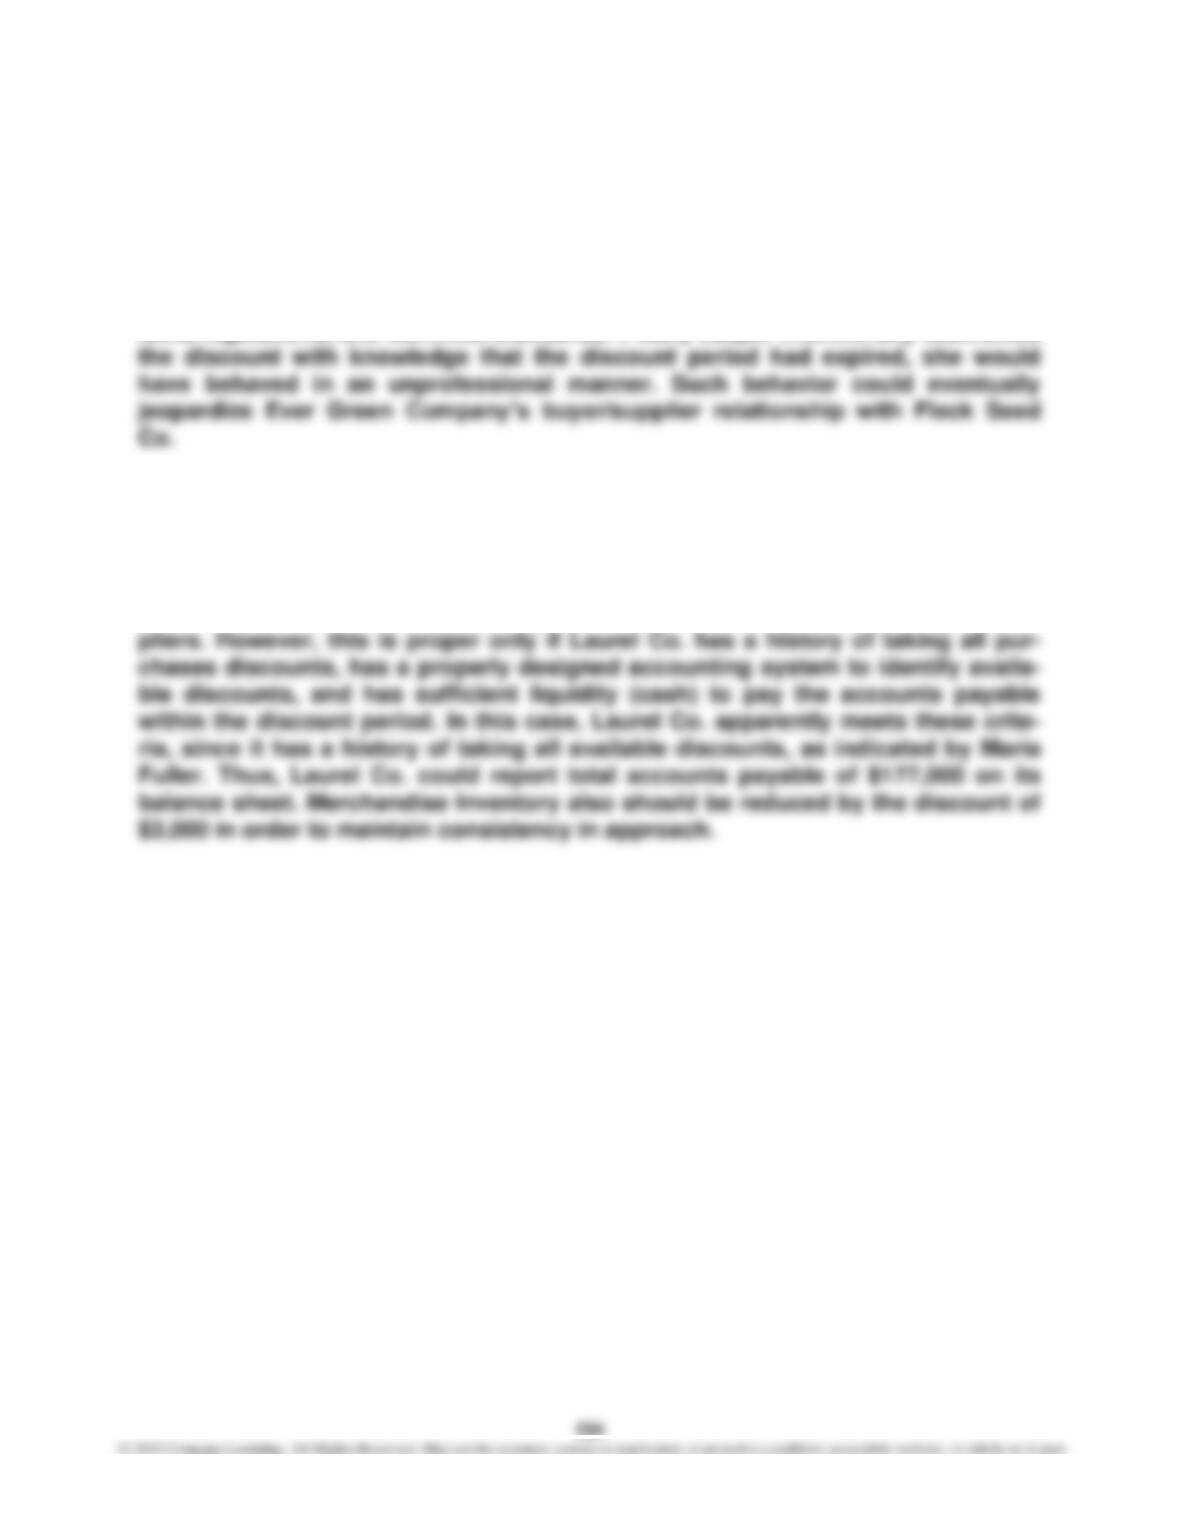
Standards of Ethical Conduct for Management Accountants requires manage-
ment accountants to perform in a competent manner and to comply with relevant
laws, regulations, and technical standards. If Mary Jasper intentionally subtracted
Case 4–2
Paul Laurel is correct. The accounts payable due suppliers could be included on
the balance sheet at an amount of $177,000 ($147,000 + $30,000). This is the
amount that will be expected to be paid to satisfy the obligation (liability) to sup-
Case 4–3
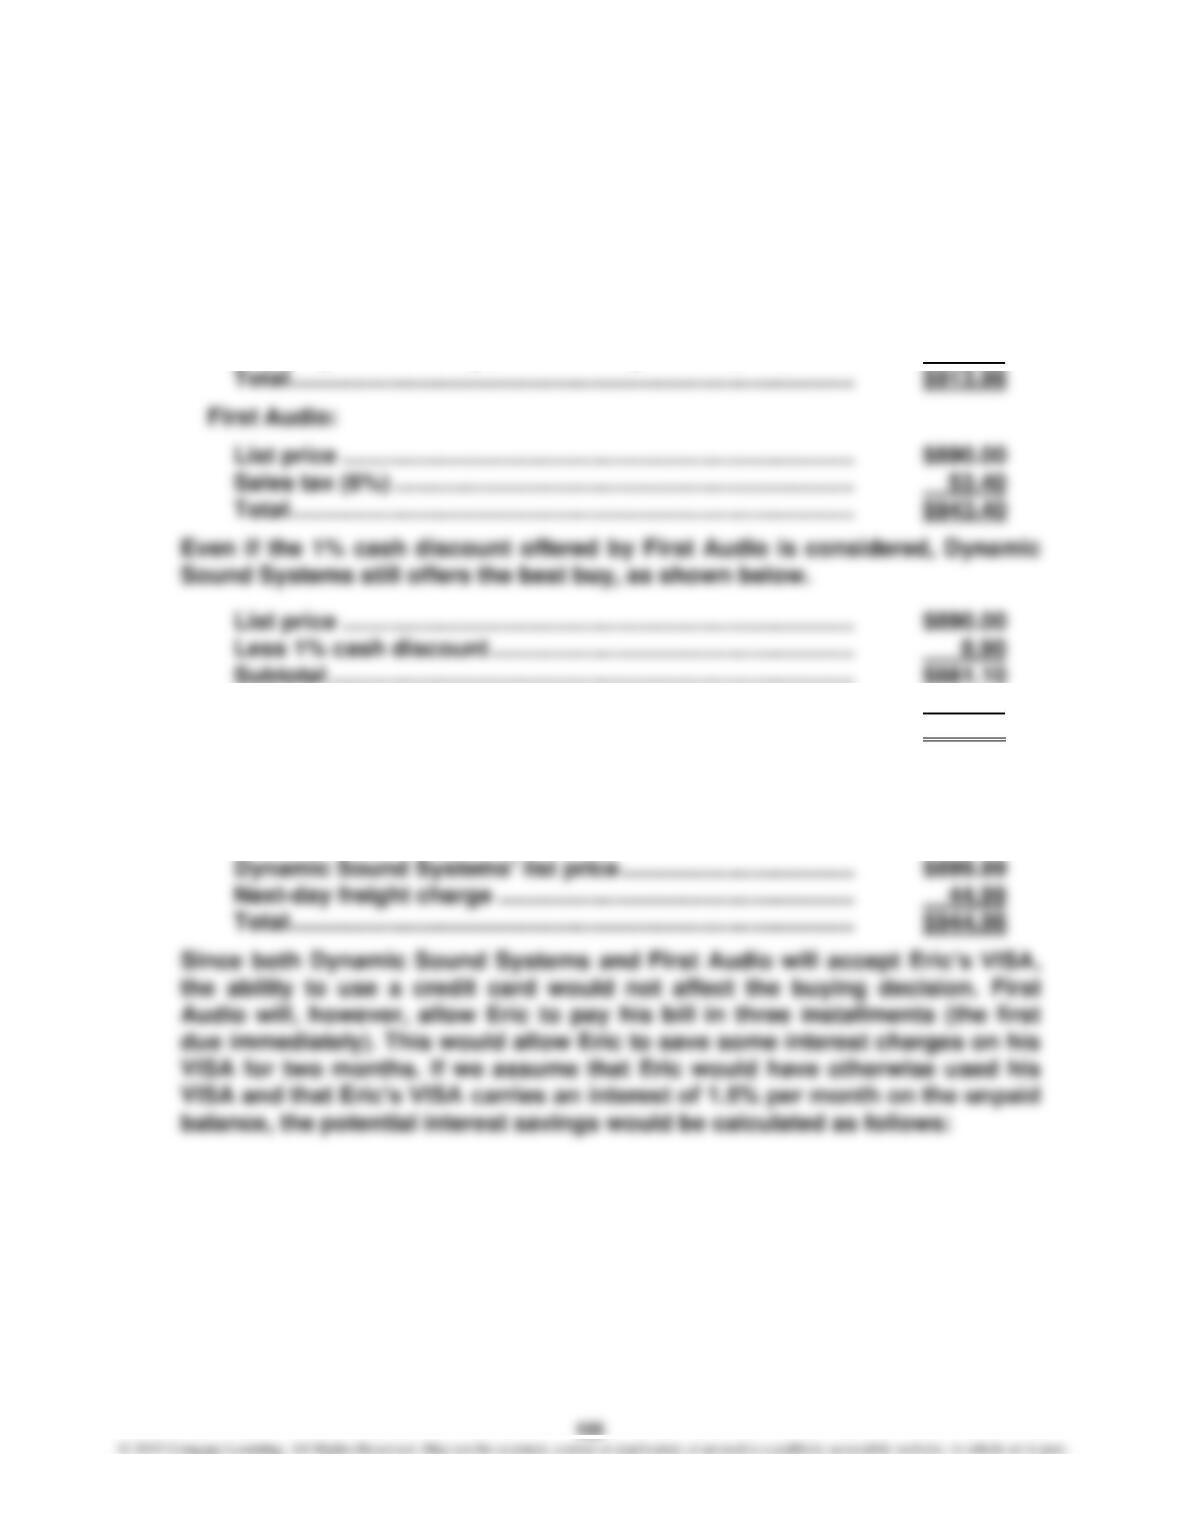
1. If Eric doesn’t need the stereo immediately (by the next day), Dynamic Sound
Systems offers the best buy, as shown below.
Dynamic Sound Systems:
List price ……………………………………………………………………. $899.99
Shipping and handling (not including next-day air) ………. 13.99
Sales tax (6%) …………………………………………………………….. 52.87
Total …………………………………………………………………………… $933.97
If Eric needs the stereo immediately (the next day), then First Audio has the
best price. This is because a shipping and handling charge of $44.99 would
be added to Dynamic Sound Systems’ price, as shown below.
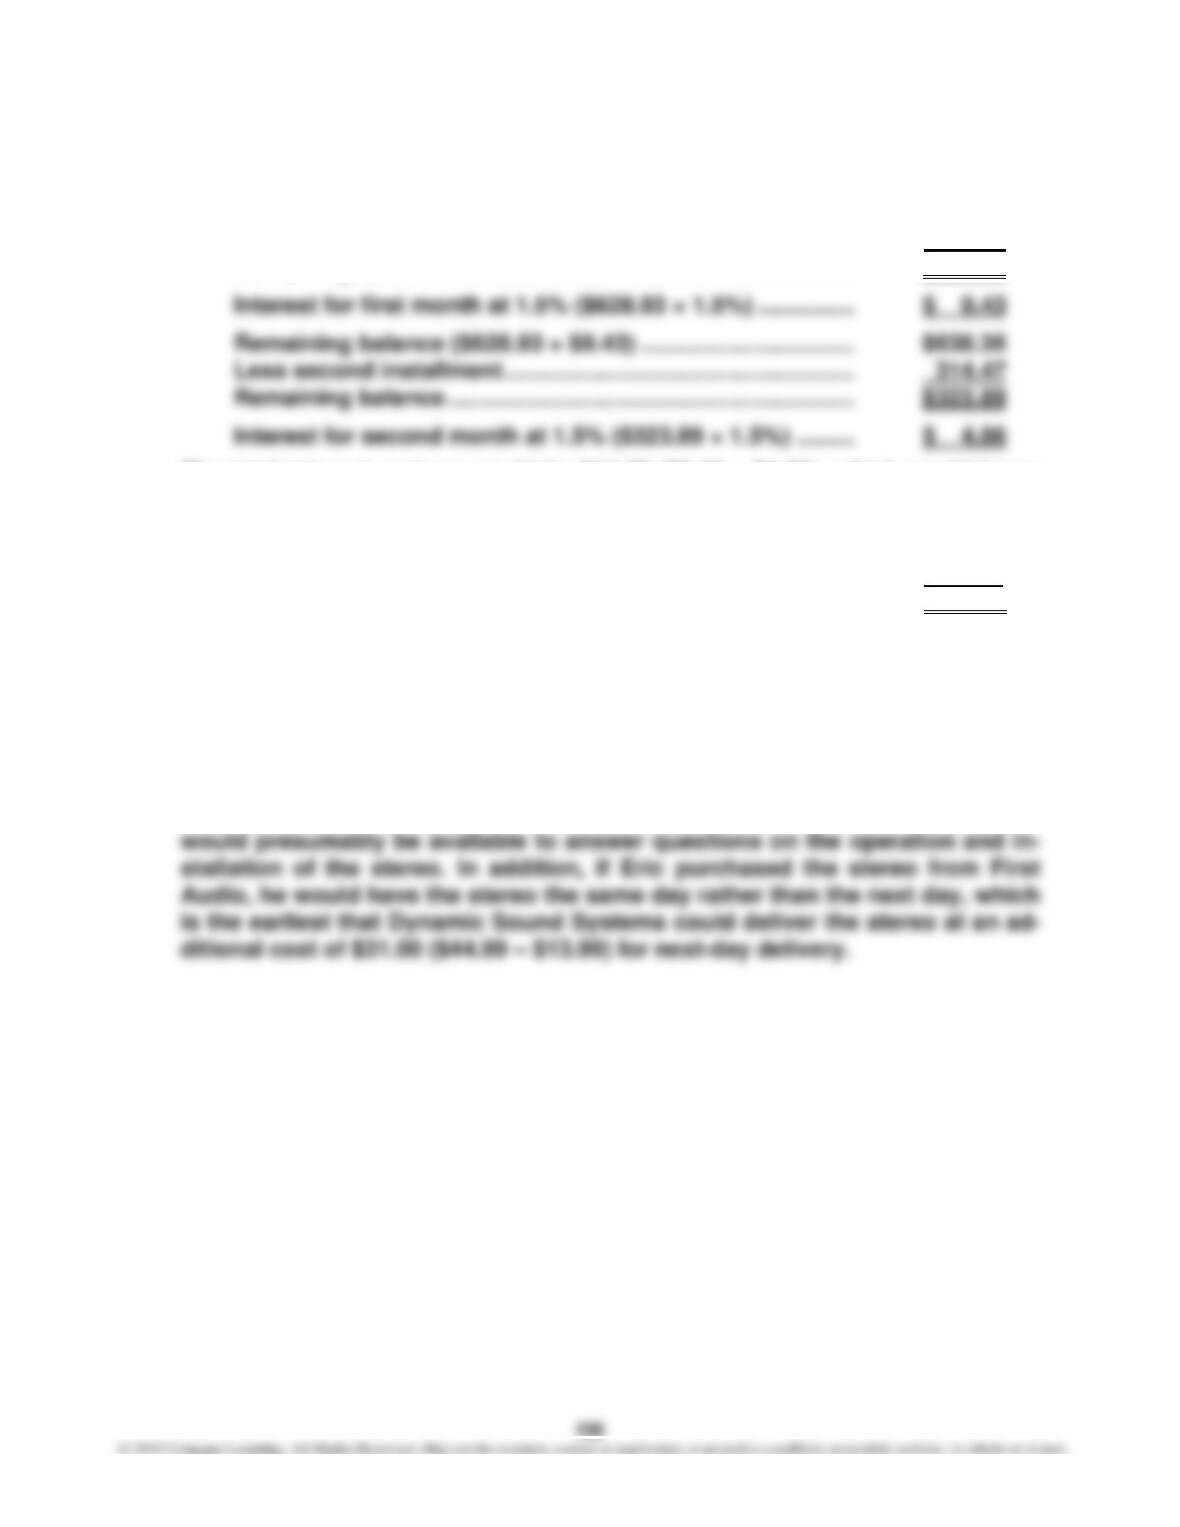
Case 4–3, Concluded
First Audio price (see previous page) ………………………….. $943.40
Less first installment (down payment) …………………………. 314.47
Remaining balance ……………………………………………………… $628.93
The total interest savings would be $14.29 ($9.43 + $4.86), which would lower
First Audio’s price to $929.11, as shown below.
Classic Audio price (see above) …………………………………… $943.40
Less interest savings ………………………………………………….. 14.29
Total …………………………………………………………………………… $929.11
The interest savings, however, would not be enough to just offset the price
advantage of Dynamic Sound Systems. Dynamic Sound Systems still has a
price advantage of $15.13 ($929.11 – $913.98) over First Audio.
2. Other considerations in buying the stereo include the ability to have the
stereo repaired locally by First Audio. In addition, First Audio employees
Case 4–4
1.
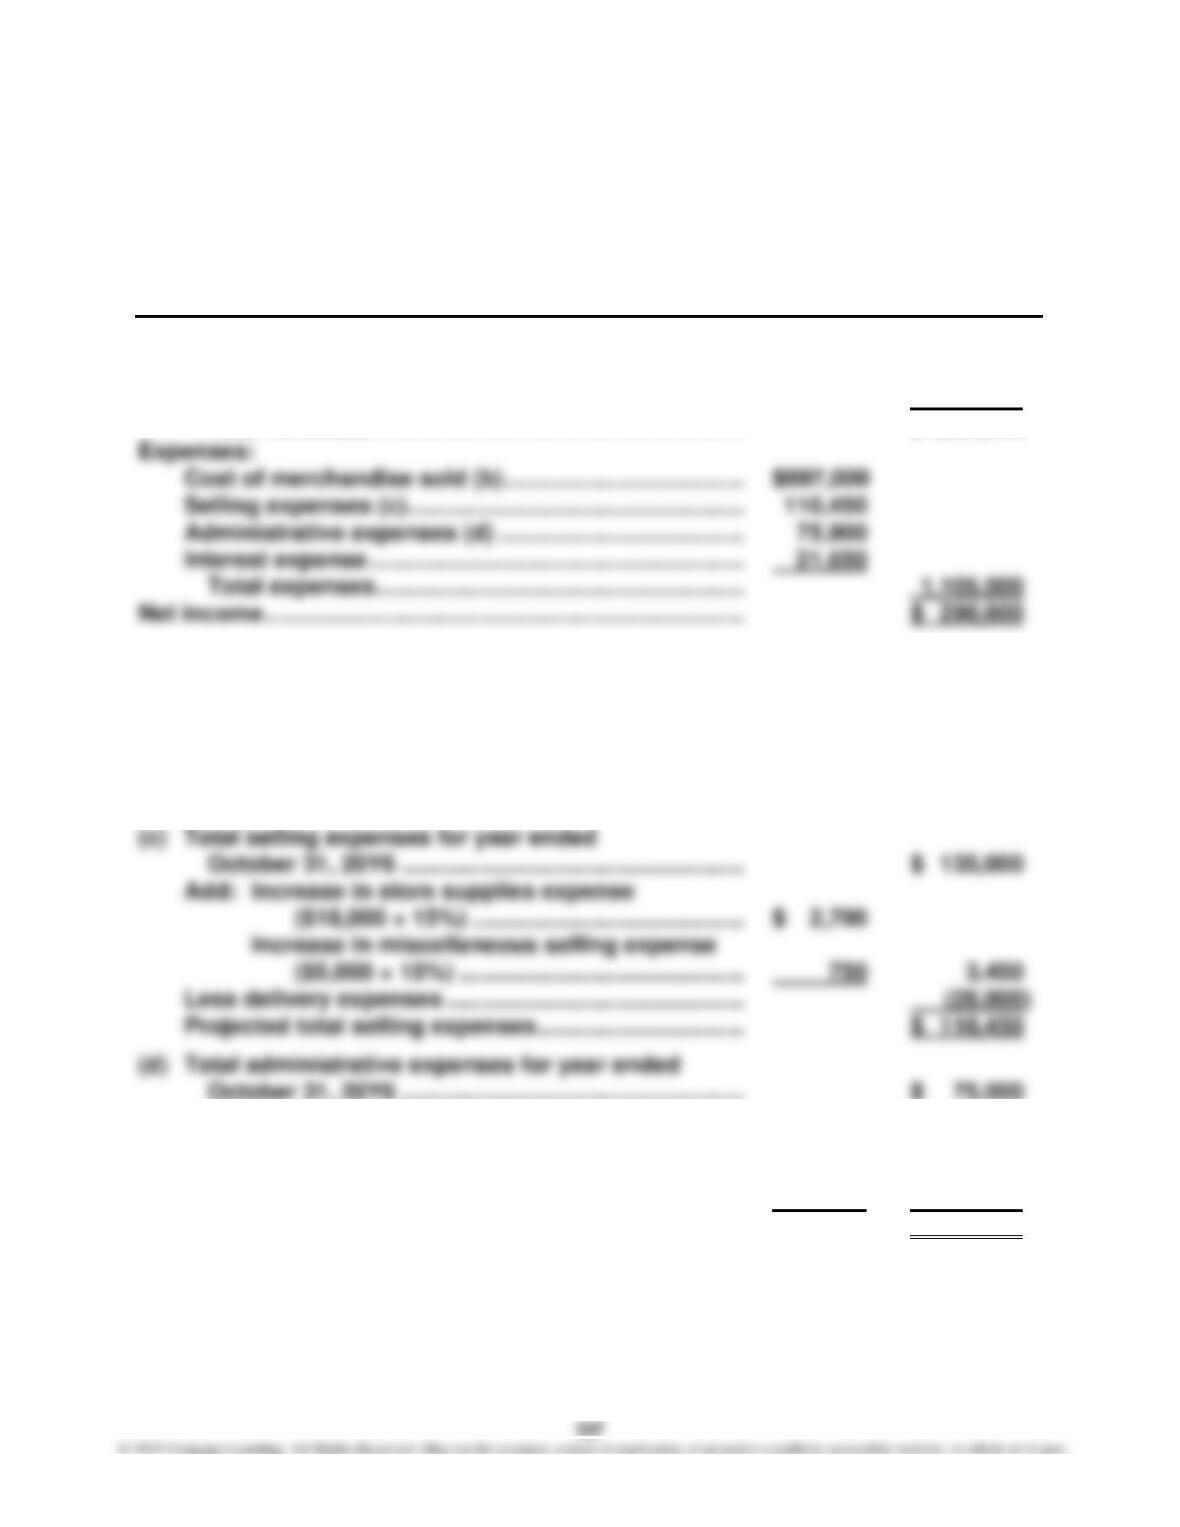
HARBOR READY PARTS COMPANY
Projected Income Statement
For the Year Ended October 31, 20Y7
Revenues:
Net sales (a) ……………………………………………………….. $1,380,000
Interest revenue …………………………………………………. 15,000
Total revenues ………………………………………………… $1,395,000
Notes:
(a) Projected net sales
[$1,200,000 + (15% × $1,200,000)] ……………………… $1,380,000
(b) Projected cost of merchandise sold
($1,380,000 × 65%) …………………………………………… $ 897,000
Add: Increase in office supplies expense
($4,000 × 15%) …………………………………….. $ 600
Increase in miscellaneous administrative
expense ($2,000 × 15%) ……………………….. 300 900
Projected total administrative expenses ………………. $ 75,900
138
Case 4–4, Concluded
2. Yes. The proposed change will increase net income from $183,350 to
$290,000, a change of $106,650.
3. Possible concerns related to the proposed changes include the following:
The primary concern is with the accuracy of the estimates used for projecting
the effects of the proposed changes. If the increase in sales does not materi-
alize, Harbor Ready Parts Company could incur significant costs of carrying
Case 4–5
Note to Instructors: The purpose of this activity is to familiarize students with
the variety of possible purchase prices for a fairly common household item.
Students should report several alternative prices when they consider the
source of the purchase and the other factors that affect the purchase, e.g., de–
livery, financing, warranties, etc.