Chapter 4 Chapter 4
Implementing Accounting Analysis
Discussion Questions
1. Use the templates in Tables 4-1, 4-2, and 4-3 to recast the financial statements for Nordstrom, Inc.
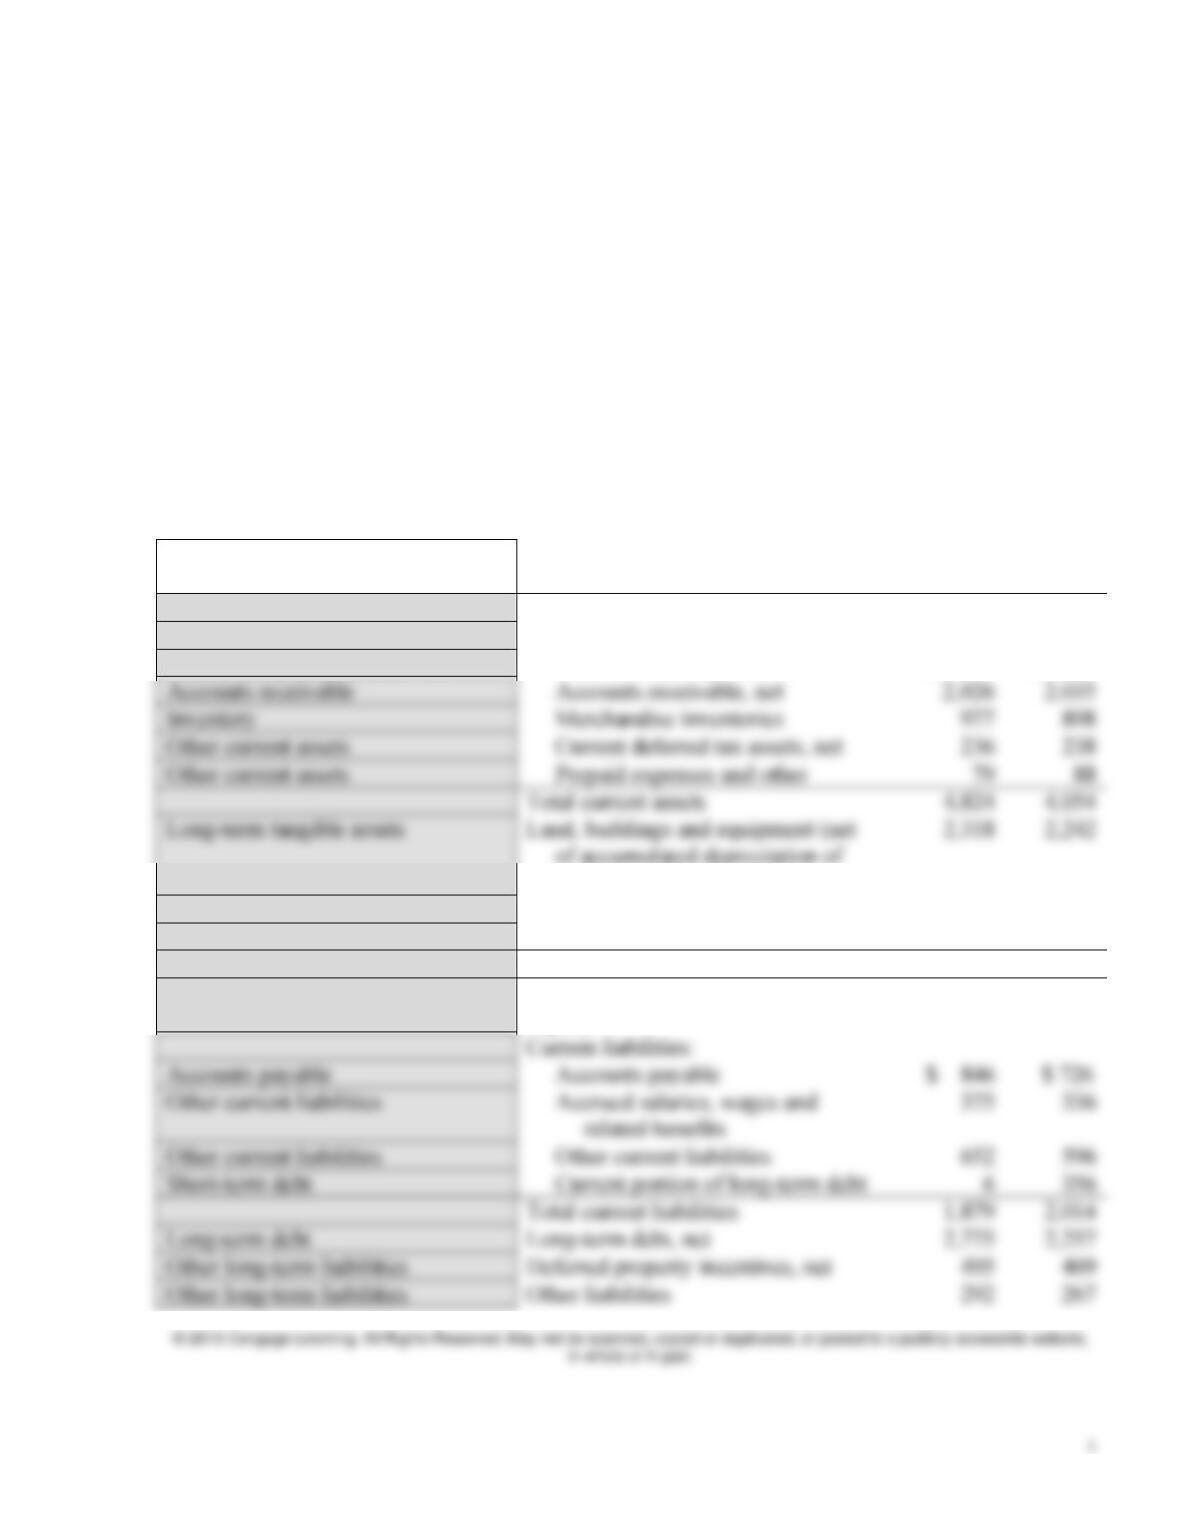
Balance Sheet Standardization
$ in millions
Jan. 29
2011
Jan. 30
2010
Assets
Current assets:
Cash and marketable securities
Cash and cash equivalents
$ 1,506
$ 795
Accounts receivable
Accounts receivable, net
2,026
Inventory
Merchandise inventories
977
898
Other current assets
Current deferred tax assets, net
236
238
Other current assets
Prepaid expenses and other
79
88
Total current assets
$3,520 and $3,316)
Long-term intangible assets
Goodwill
53
53
Other long-term assets
Other assets
267
230
Total assets
$ 7,462
$ 6,579
Liabilities and Shareholders’
Equity
Current liabilities:
Accounts payable
Accounts payable
$ 846
related benefits
Other current liabilities
Other current liabilities
652
596
Short-term debt
Current portion of long-term debt
356
Total current liabilities
Long-term debt
Long-term debt, net
Other long-term liabilities
Deferred property incentives, net
495
469
Other long-term liabilities
Other liabilities
292
267
2 Instructor’s Manual
Commitments and contingencies
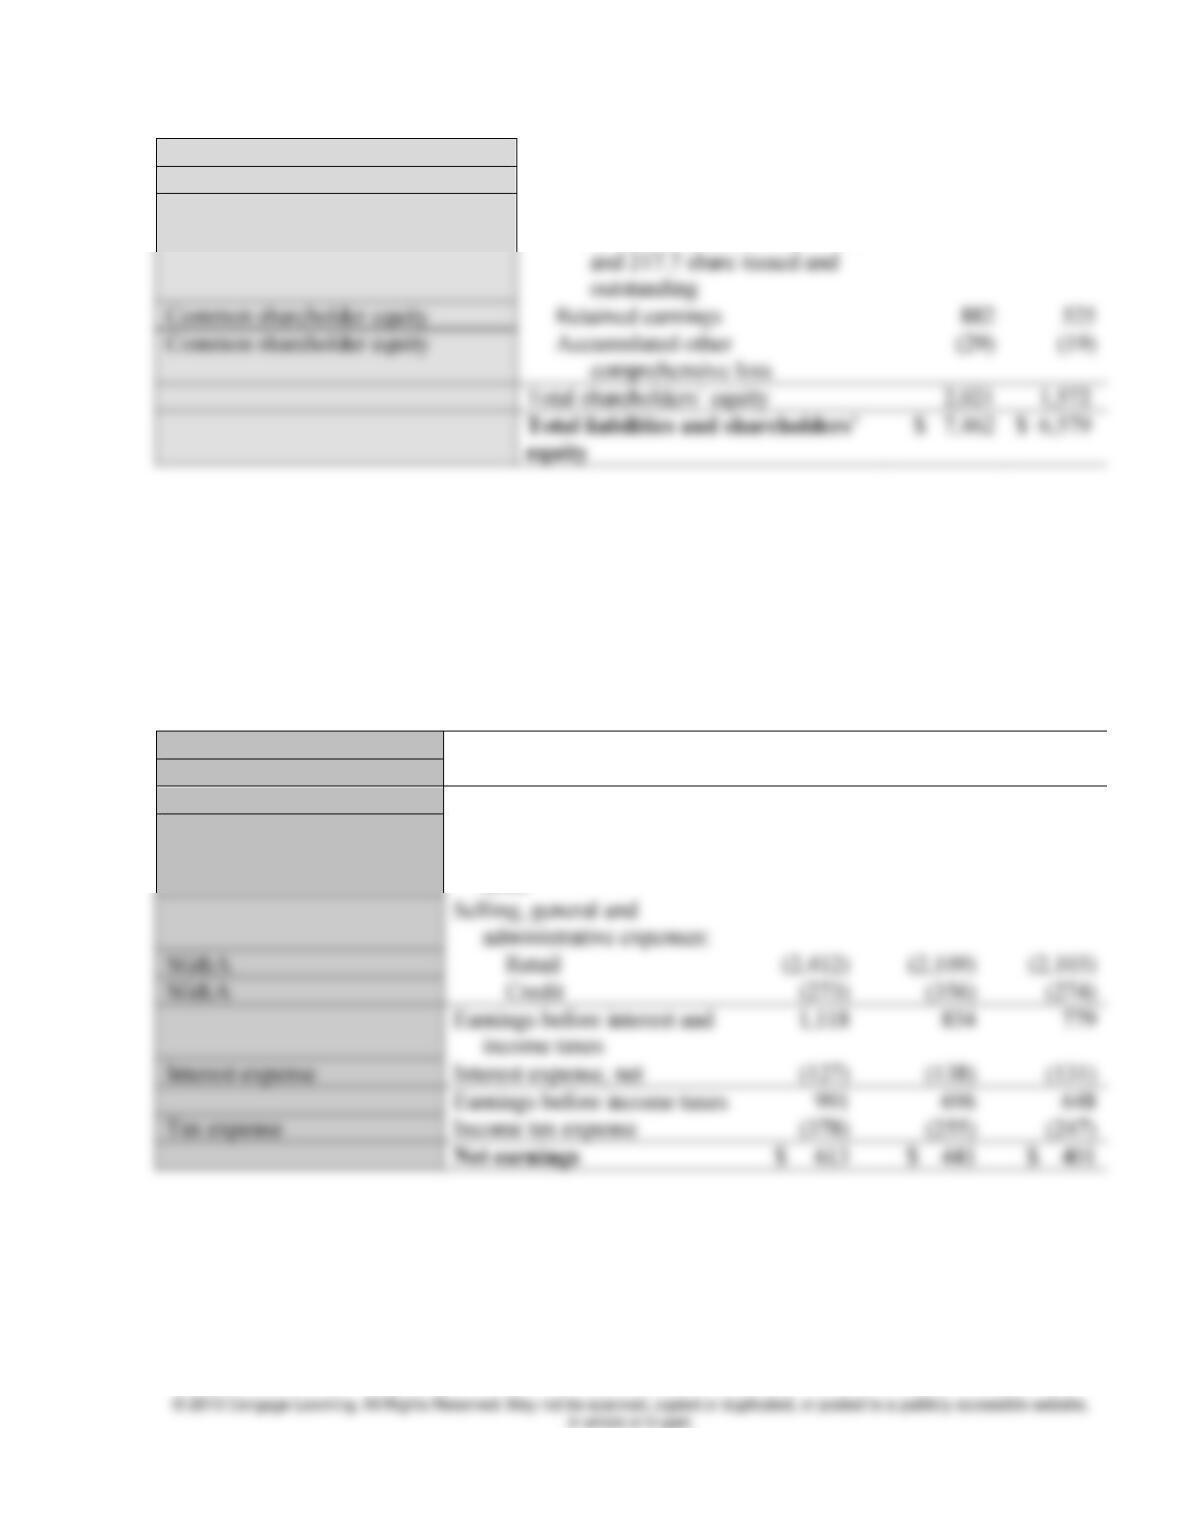
Shareholders’ equity:
Common shareholder equity
and 217.7 share issued and
outstanding
Common shareholder equity
Retained earnings
882
Common shareholder equity
Accumulated other
comprehensive loss
Total shareholders’ equity
2,021
equity
$ 6,579
Common stock, no par value:
1,000 shares authorized; 218.0
1,168
1,066
Income Statement Standardization
$ in millions
Fiscal year
2010
2009
2008
Sales
Net sales
$ 9,310
$ 8,258
$ 8,272
Sales
Credit card revenues
390
369
301
Total revenues
9,700
8,627
8,573
Cost of sales
Cost of sales and related
buying and occupancy
costs
(5,897)
(5,328)
(5,417)
Selling, general and
administrative expenses:
SG&A
Retail
SG&A
Credit
Earnings before interest and
income taxes
Interest expense
Interest expense, net
Earnings before income taxes
991
696
648
Tax expense
Income tax expense
Net earnings
$ 613
Chapter 4 Implementing Accounting Analysis 3
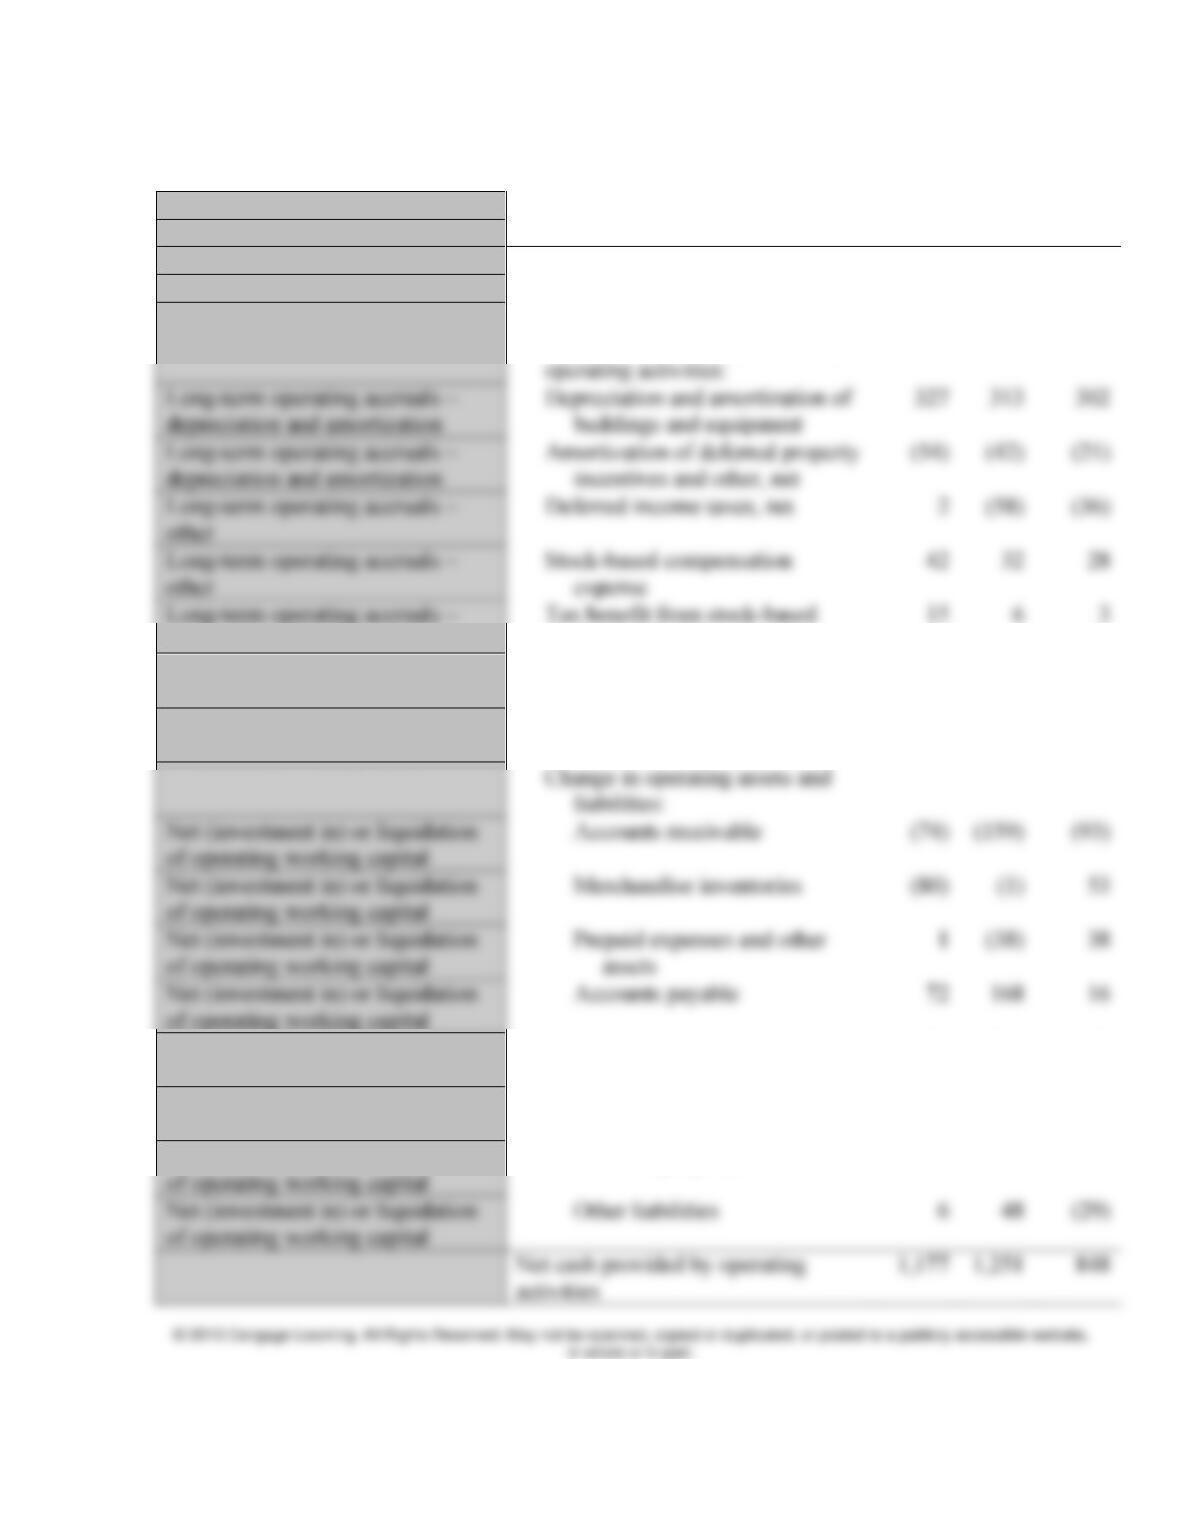
Cash Flow Statement Standardization
$ in millions
Fiscal year
2010
2009
2008
Operating Activities
Net income
Net earnings
$ 613
$ 441
$ 401
operating activities:
Long-term operating accruals –
depreciation and amortization
Depreciation and amortization of
buildings and equipment
327
313
302
Long-term operating accruals –
depreciation and amortization
Amortization of deferred property
incentives and other, net
(21)
Long-term operating accruals –
other
Deferred income taxes, net
(36)
Long-term operating accruals –
other
Stock-based compensation
expense
42
32
Long-term operating accruals –
Tax benefit from stock-based
15
Adjustments to reconcile net
earnings to net cash provided by
other
compensation
Long-term operating accruals –
other
Excess tax benefit from stock-
based compensation
(16)
(7)
(4)
Net (investment in) or liquidation
of operating working capital
Provision for bad debt expense
149
251
173
liabilities:
Net (investment in) or liquidation
of operating working capital
Accounts receivable
(74)
(93)
Net (investment in) or liquidation
of operating working capital
(80)
(1)
Net (investment in) or liquidation
of operating working capital
Prepaid expenses and other
assets
Net (investment in) or liquidation
of operating working capital
Accounts payable
72
168
Net (investment in) or liquidation
of operating working capital
Accrued salaries, wages and
related benefits
37
120
(54)
Net (investment in) or liquidation
of operating working capital
Other current liabilities
42
81
(48)
of operating working capital
Net (investment in) or liquidation
of operating working capital
Other liabilities
48
(29)
Net cash provided by operating
activities
848
Net (investment in) or liquidation
Deferred property incentives
95
96
119
4 Instructor’s Manual
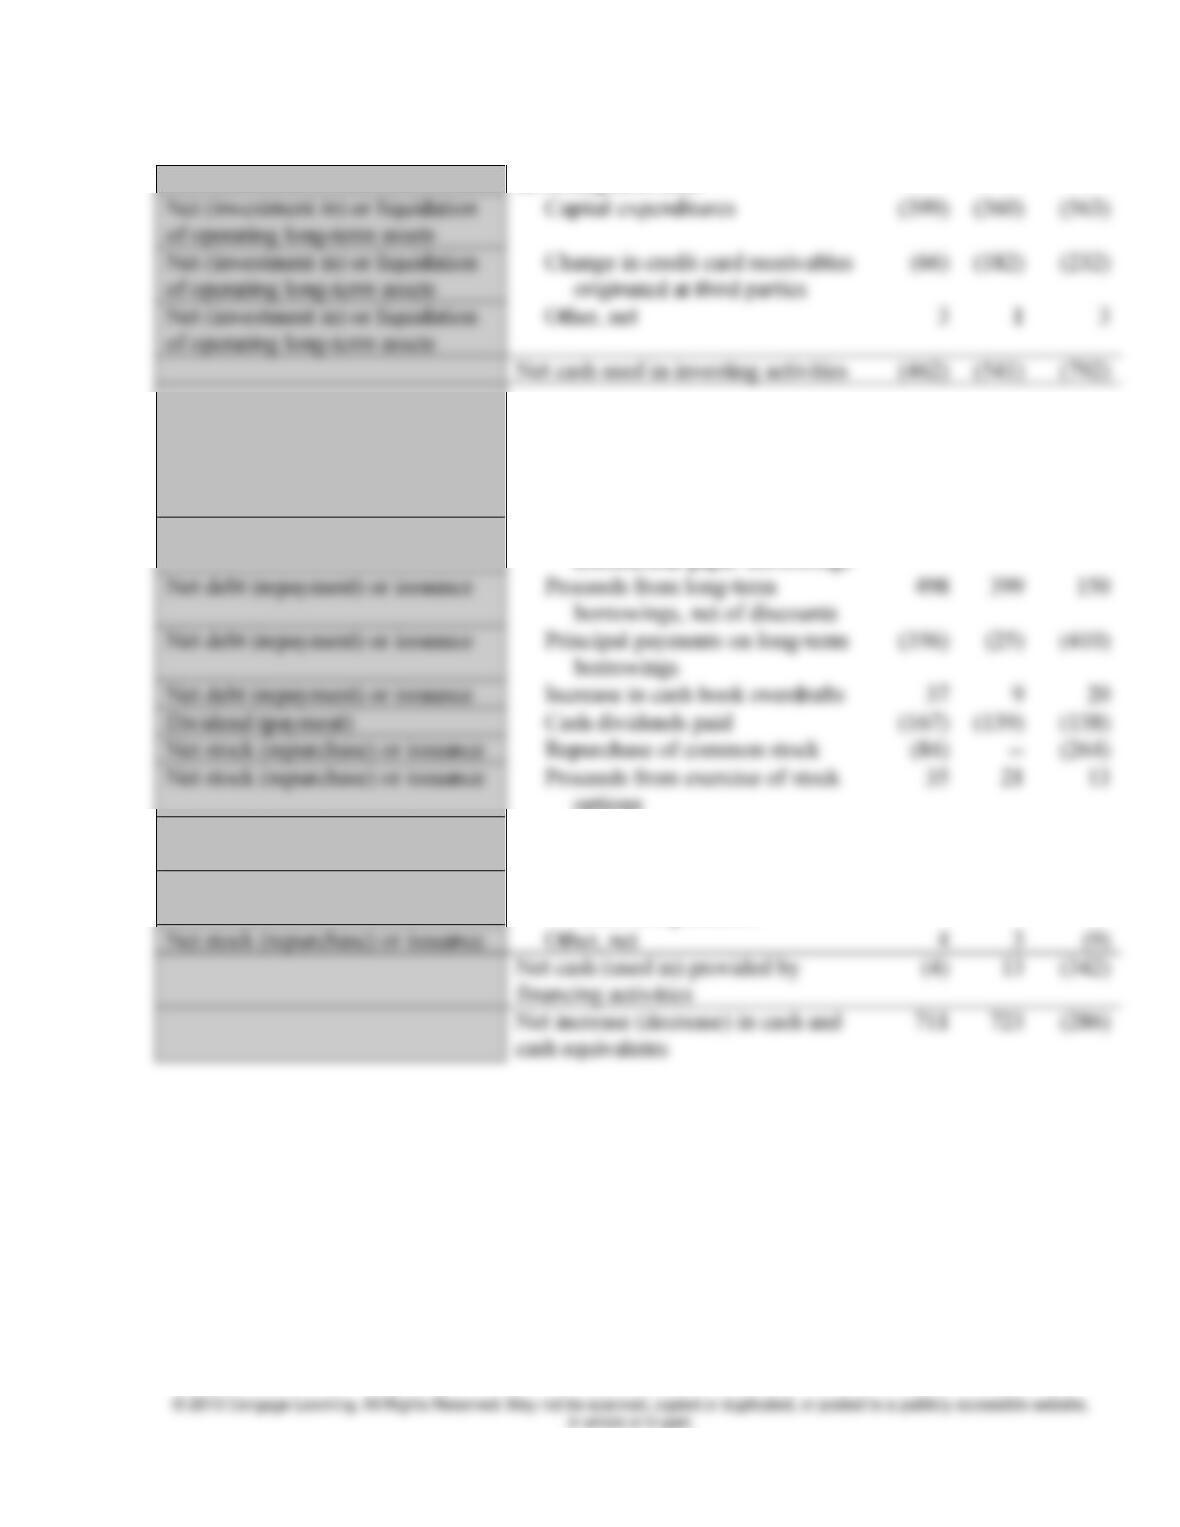
Investing activities
Net (investment in) or liquidation
of operating long-term assets
Capital expenditures
(360)
Net (investment in) or liquidation
of operating long-term assets
Change in credit card receivables
originated at third parties
(182)
Net (investment in) or liquidation
of operating long-term assets
Other, net
3
1
3
Net cash used in investing activities
Financing activities
Net debt (repayment) or issuance
(Repayments) proceeds from
commercial paper borrowings
—
(275)
275
Net debt (repayment) or issuance
Proceeds from long-term
borrowings, net of discounts
150
Net debt (repayment) or issuance
Principal payments on long-term
borrowings
Net debt (repayment) or issuance
Increase in cash book overdrafts
Dividend (payment)
Cash dividends paid
Net stock (repurchase) or issuance
Repurchase of common stock
options
Net stock (repurchase) or issuance
Proceeds from employee stock
purchase plan
13
13
17
Net stock (repurchase) or issuance
Excess tax benefit from stock-
based compensation
16
7
4
Net stock (repurchase) or issuance
Other, net
Net cash (used in) provided by
financing activities
13
Net increase (decrease) in cash and
cash equivalents
Chapter 4 Implementing Accounting Analysis 5
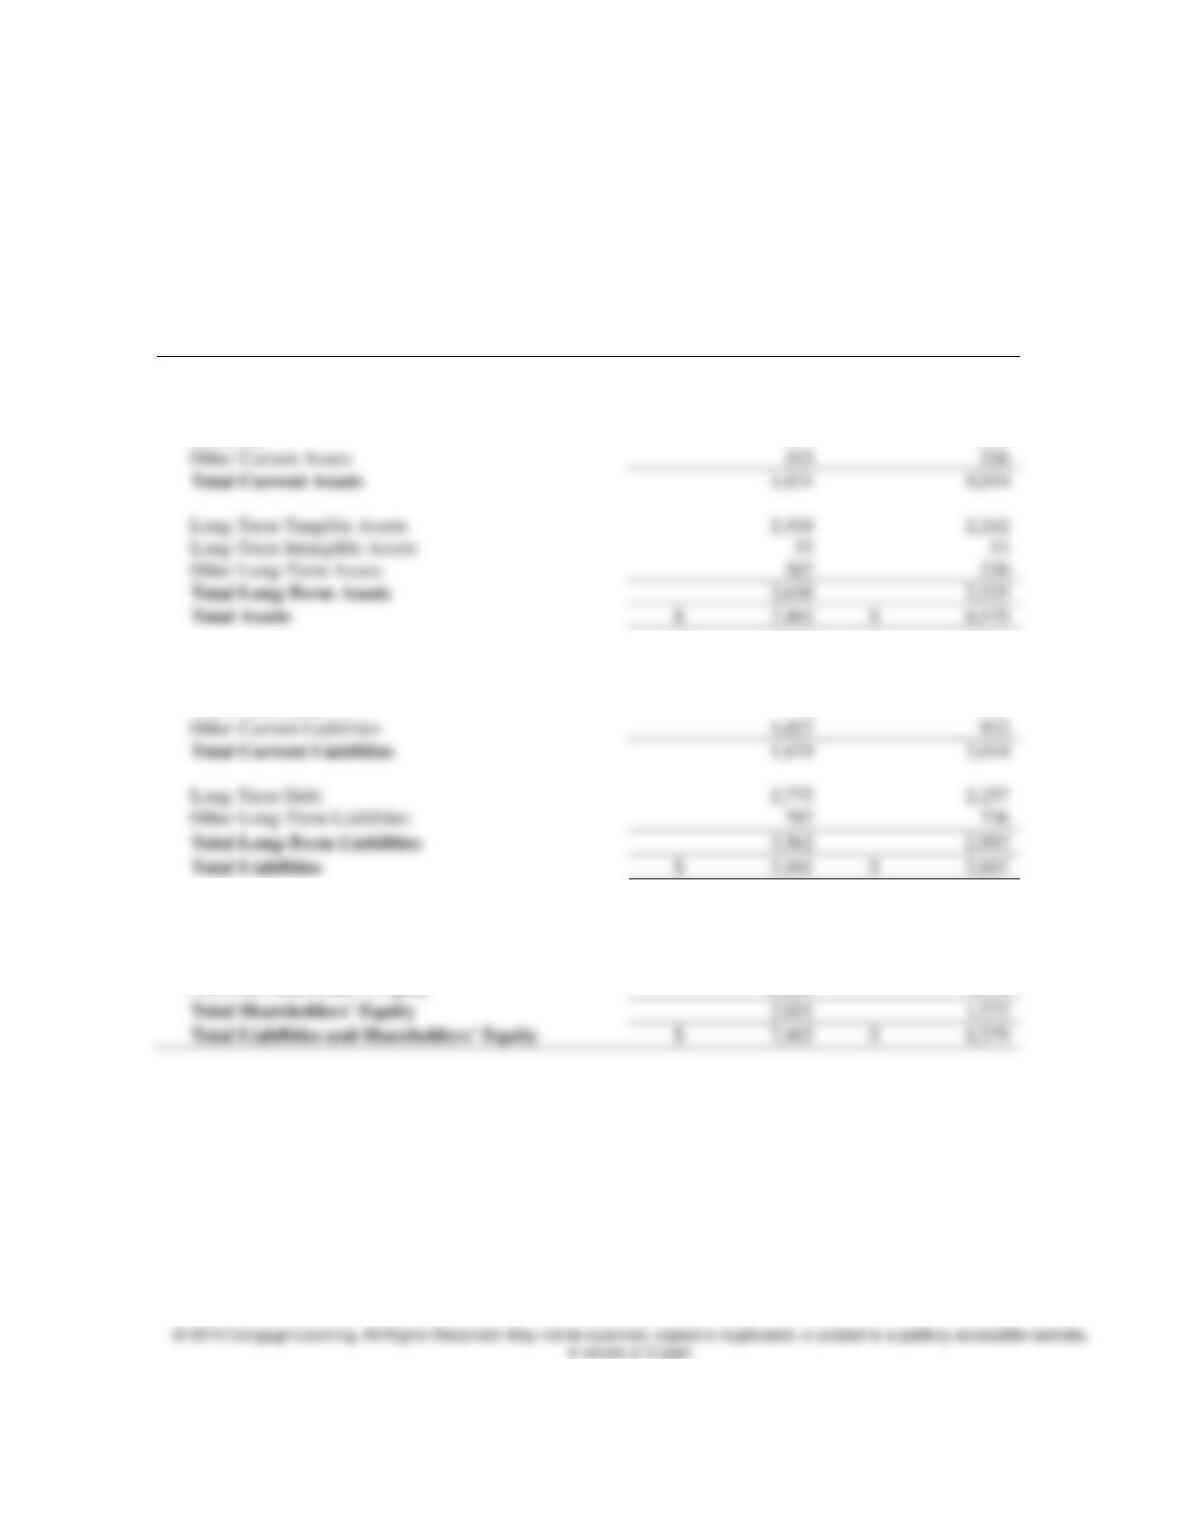
The resulting standardized financial statements are as follows:
Nordstrom Standardized Balance Sheet
$ in millions
January 29, 2011
January 30, 2010
ASSETS
Cash and Marketable Securities
$ 1,506
$ 795
Accounts Receivable
2,026
2,035
Inventory
977
898
Other Current Assets
315
326
4,824
Long-Term Tangible Assets
2,318
Long-Term Intangible Assets
Other Long-Term Assets
267
230
2,638
2,525
$ 7,462
$ 6,579
LIABILITIES
Accounts Payable
$ 846
$ 726
Short-Term Debt
6
356
1,879
2,014
Long-Term Debt
2,775
2,257
Other Long-Term Liabilities
Total Long-Term Liabilities
3,562
2,993
Total Liabilities
Shareholder’s Equity
Preferred Stock
0
0
Common Shareholder’s Equity
2,021
1,572
2,021
1,572
6 Instructor’s Manual
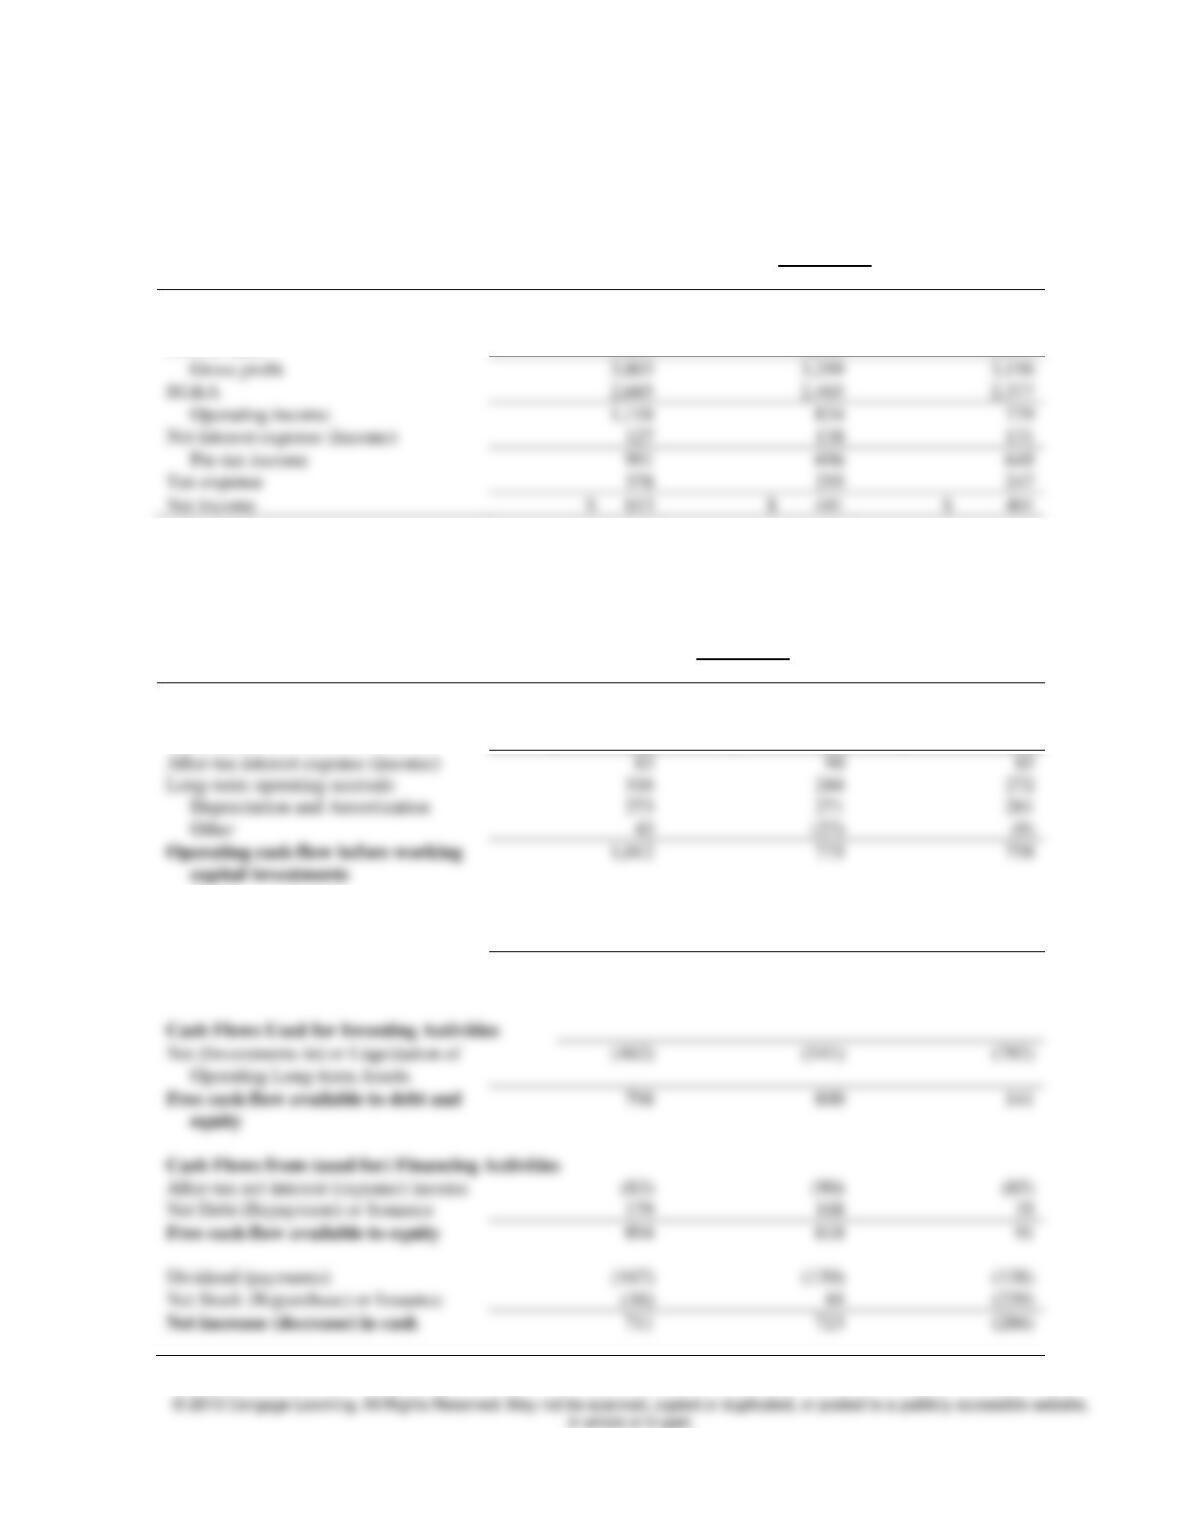
Nordstrom Standardized Income Statement
Fiscal Year
$ in millions
2010
2009
2008
Sales
$ 9,700
$ 8,627
$ 8,573
Cost of sales
5,897
5,328
5,417
Gross profit
3,803
3,299
3,156
SG&A
2,685
2,465
2,377
Operating income
1,118
Net interest expense (income)
Pre-tax income
Tax expense
Net income
Nordstrom Standardized Cash Flow Statement
Fiscal Year
$ in millions
2010
2009
2008
Cash Flows from Operating Activities
Net Income
$ 613
$ 441
$ 401
After-tax interest expense (income)
Long-term operating accruals
Depreciation and Amortization
Other
Operating cash flow before working
capital investments
1,012
775
758
Net (Investments in) or Liquidation of
Operating Working Capital
248
566
175
Operating cash flow before
investment in long-term assets
1,260
1,341
933
Cash Flows Used for Investing Activities
Net (Investments in) or Liquidation of
Operating Long-term Assets
equity
Cash Flows from (used for) Financing Activities
After-tax net interest (expense) income
Net Debt (Repayment) or Issuance
Free cash flow available to equity
Dividend (payments)
Net Stock (Repurchase) or Issuance
Chapter 4 Implementing Accounting Analysis 7
2. Refer to the Creative Technology example on delaying write-downs of current assets. How much excess
inventory do you estimate Creative Technology is holding in March 2005 if the firm’s optimal days’
Inventory is 100 days? Calculate the inventory impairment charge for Creative Technology if 50 percent
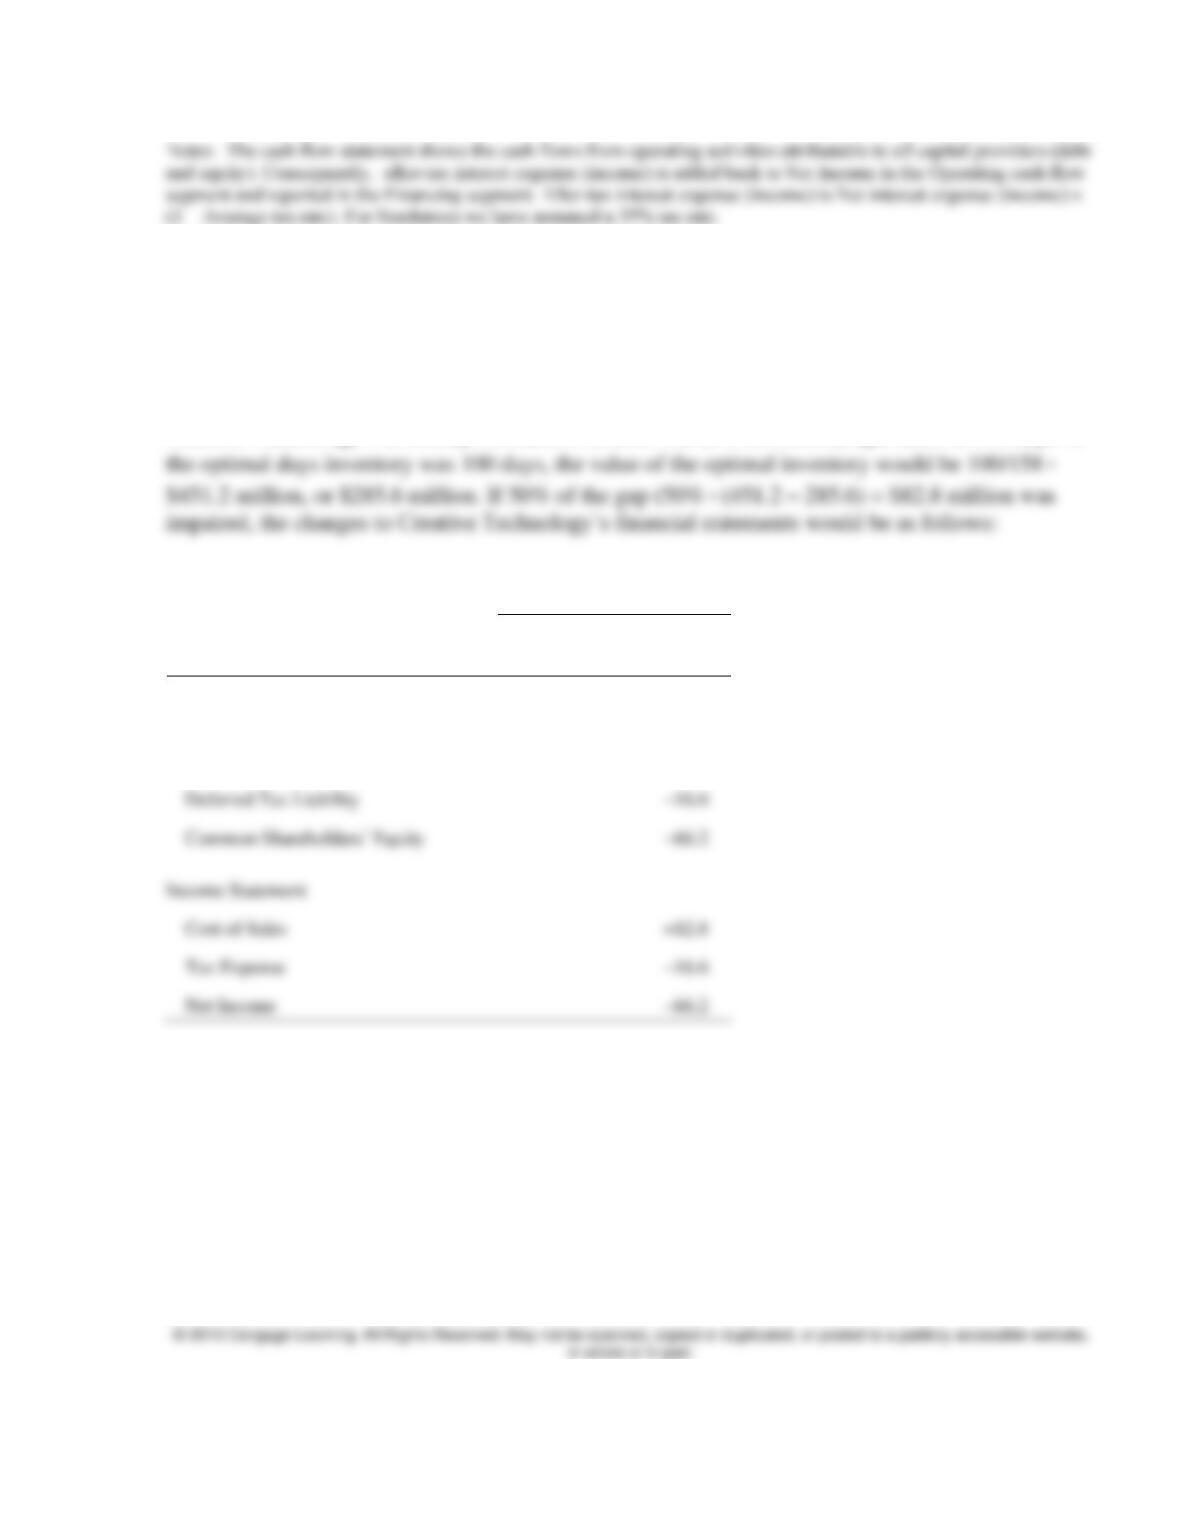
of this excess inventory is deemed to be worthless. Record the changes to Creative Technology’s financial
statements from adjusting for this impairment.
Creative Technology’s inventory on March 31, 2005 was $451.2 million, equivalent to 158 days. If
3. U.S.-based American International Group Inc. (AIG) is one of the world’s largest insurance
companies, offering property-casualty, life insurance, and retirement services to customers in more than
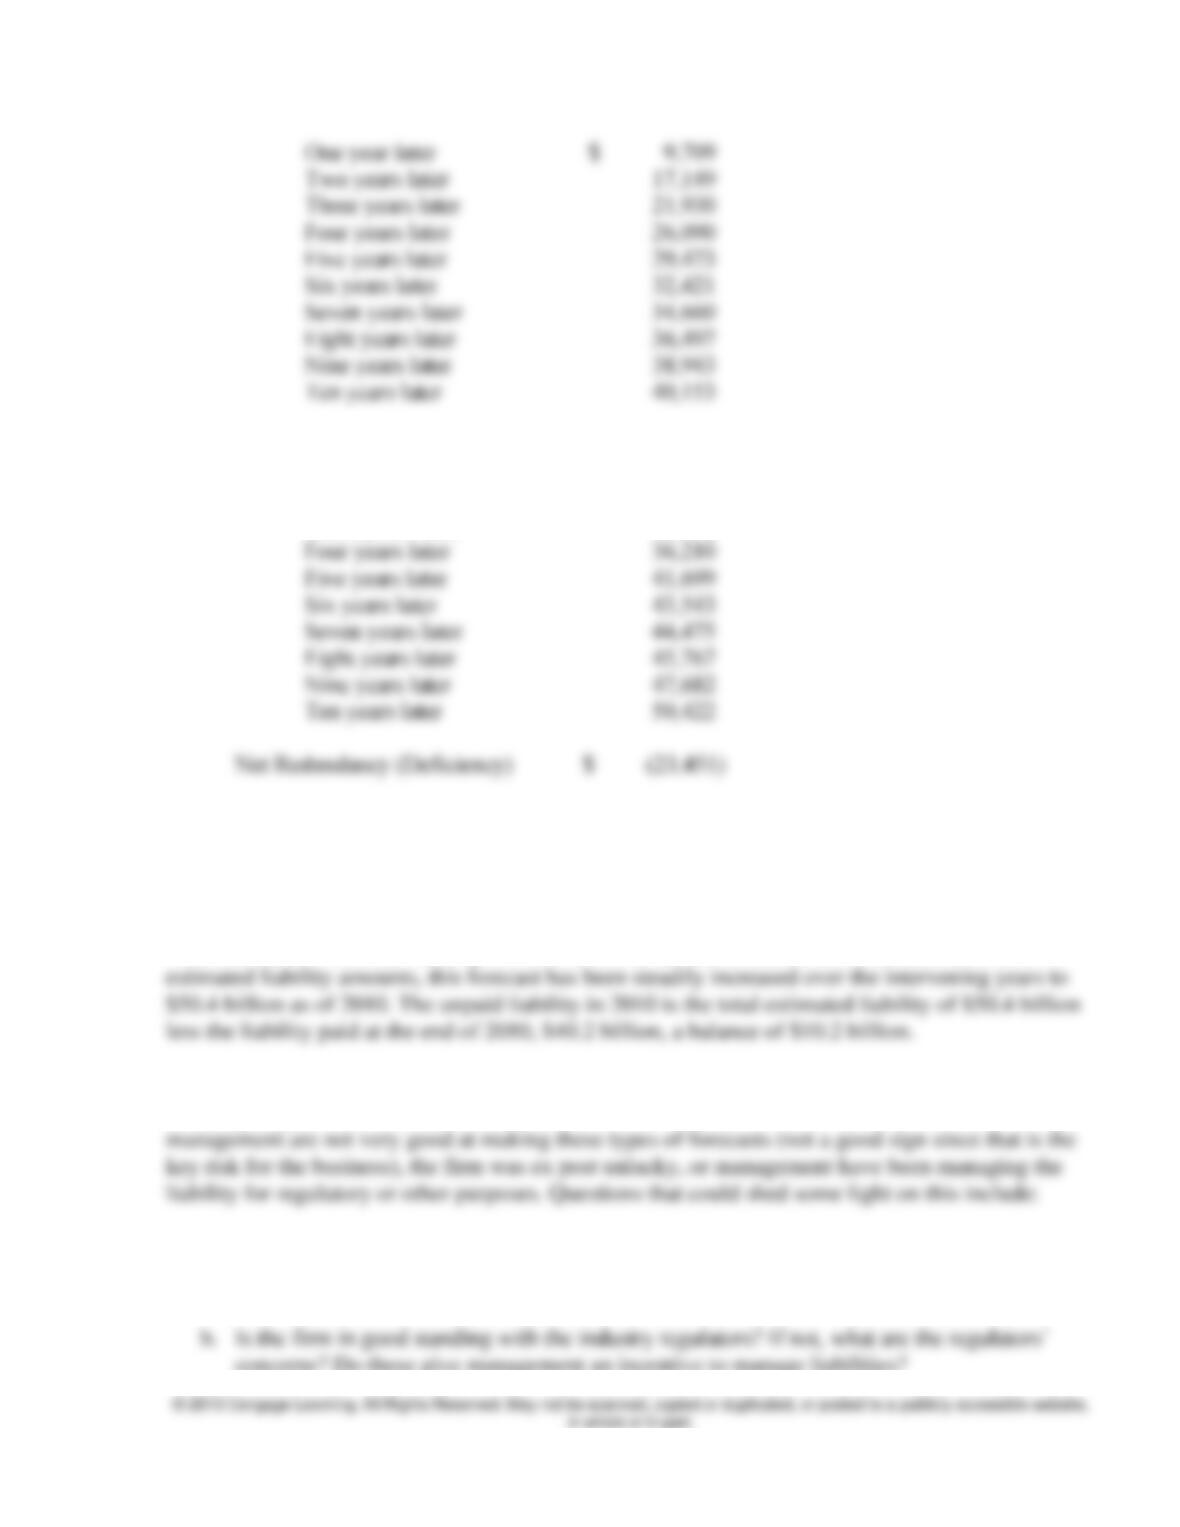
130 countries. In its 2010 10-K report to the SEC, it discloses the following information on the loss
reserves created for claims originating in 2000:
(in millions)
Net Reserves Held in 2000: $ 26,971
Cumulative net liability paid as of:
Adjustment
($millions)
Assets
Liabilities &
Equity
Balance Sheet
Inventory
–82.8
Deferred Tax Liability
Income Statement
Cost of Sales
Tax Expense
Net Income
8 Instructor’s Manual
Net reserves for 2000 re-estimated as of:
One year later $ 26,979
Two years later 30,696
Three years later 32,732
Was the initial estimate for loss reserves originating in 2000 too low or too high? How has the
firm updated its estimate of this obligation over time? What percentage of the original liability
remains outstanding for 2000 claims at the end of 2010? As a financial analyst, what
questions would you have for the CFO on its 2000 liability?
The estimate for the 2000 liability made in 2000 was $26.97 billion. As can be seen from the re-
The key questions that an analyst would have about the 2000 liability relates to the fact that the
company ex post underestimated the amount. This could arise for a number of reasons –
a. What were the reasons for the underestimate of the 2000 liability? Did the same factors
affect other firms in the industry? Did the same pattern occur for estimates of liability for
other years?
concerns? Do these give management an incentive to manage liabilities?
Chapter 4 Implementing Accounting Analysis 9
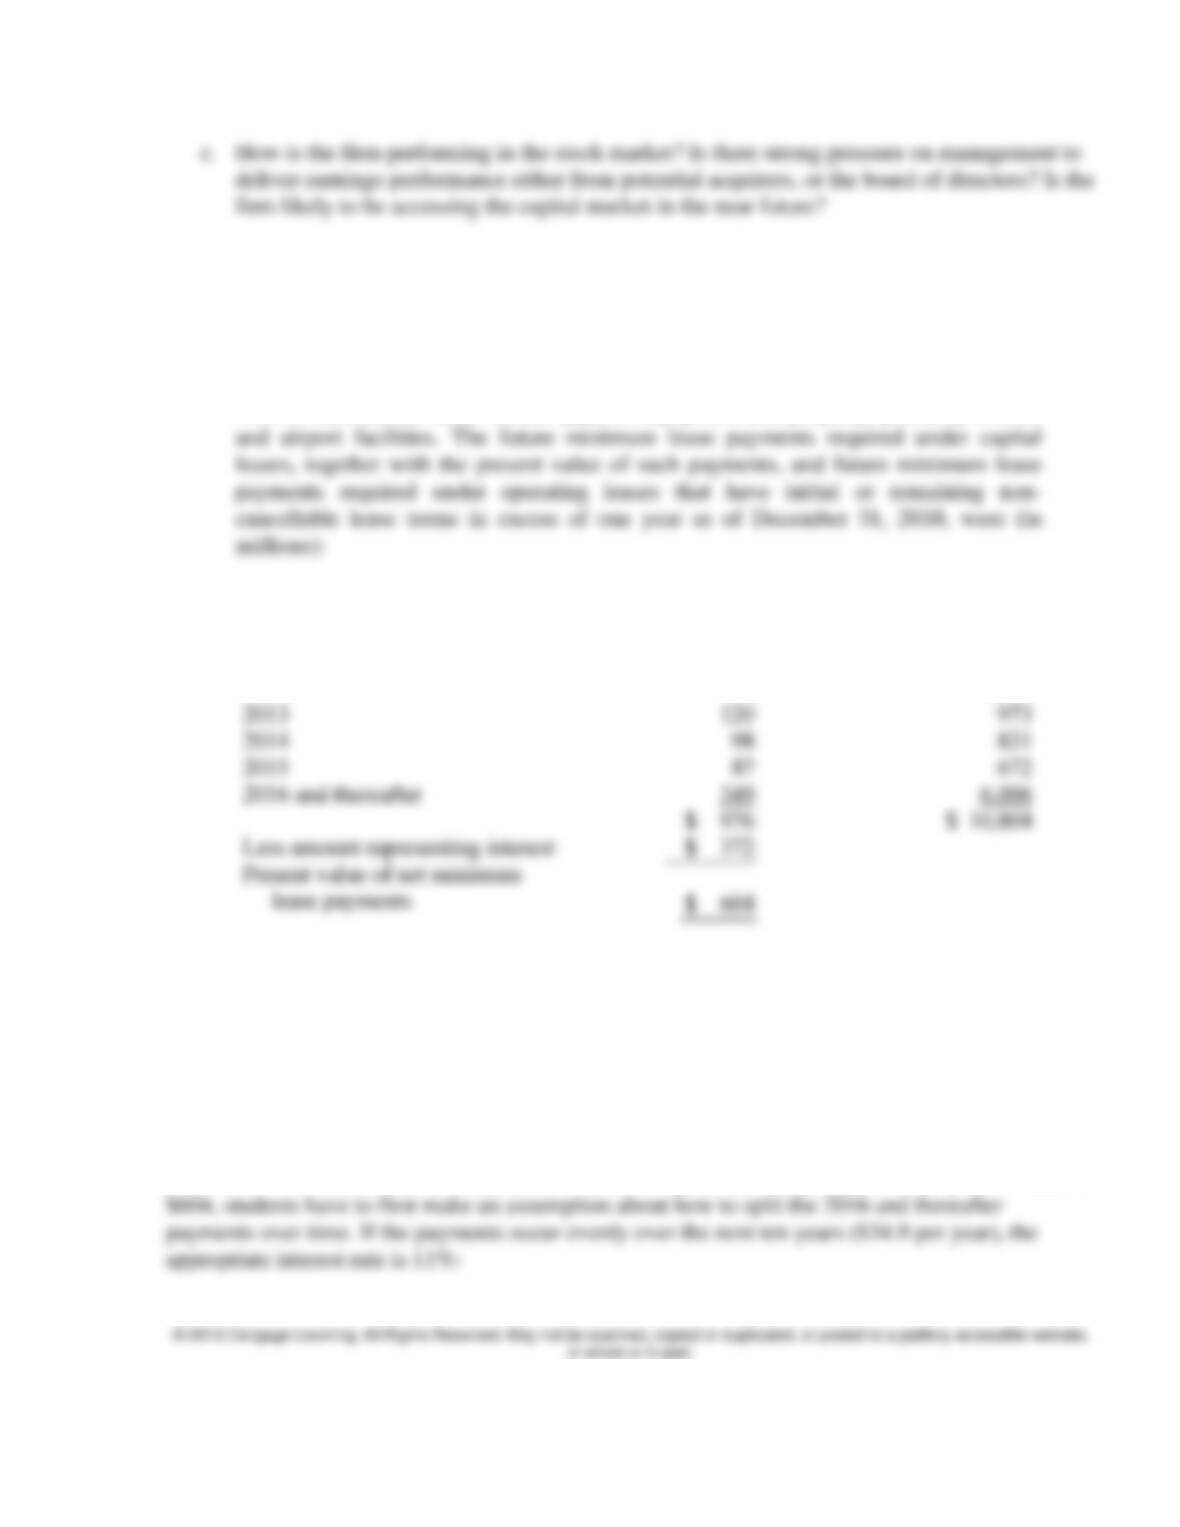
4. AMR, parent of American Airlines, provides the following footnote information on its capital and
operating leases:
AMR’s subsidiaries lease various types of equipment and property, primarily aircraft
Year Ending December 31,
Capital Leases
Operating Leases
2011
$ 186
$ 1,254
2012
136
1,068
2013
120
2014
2015
2016 and thereafter
349
6,006
$ 976
$ 10,804
AMR further disclosed that “lease terms vary but are generally 10 to 25 years for aircraft and seven to 40
years for other leased property and equipment.” Assuming all leases are for aircraft with an average lease
term of 15 years, what interest rate does AMR use to capitalize its capital leases? Use this rate to capitalize
AMR’s operating leases at December 31, 2010. Record the adjustment to AMR’s balance sheet to reflect
the capitalization of operating leases. How would this reporting change affect AMR’s Income Statement
in 2011?
To estimate the interest rate that equates the value of capital lease payments to the reported value of
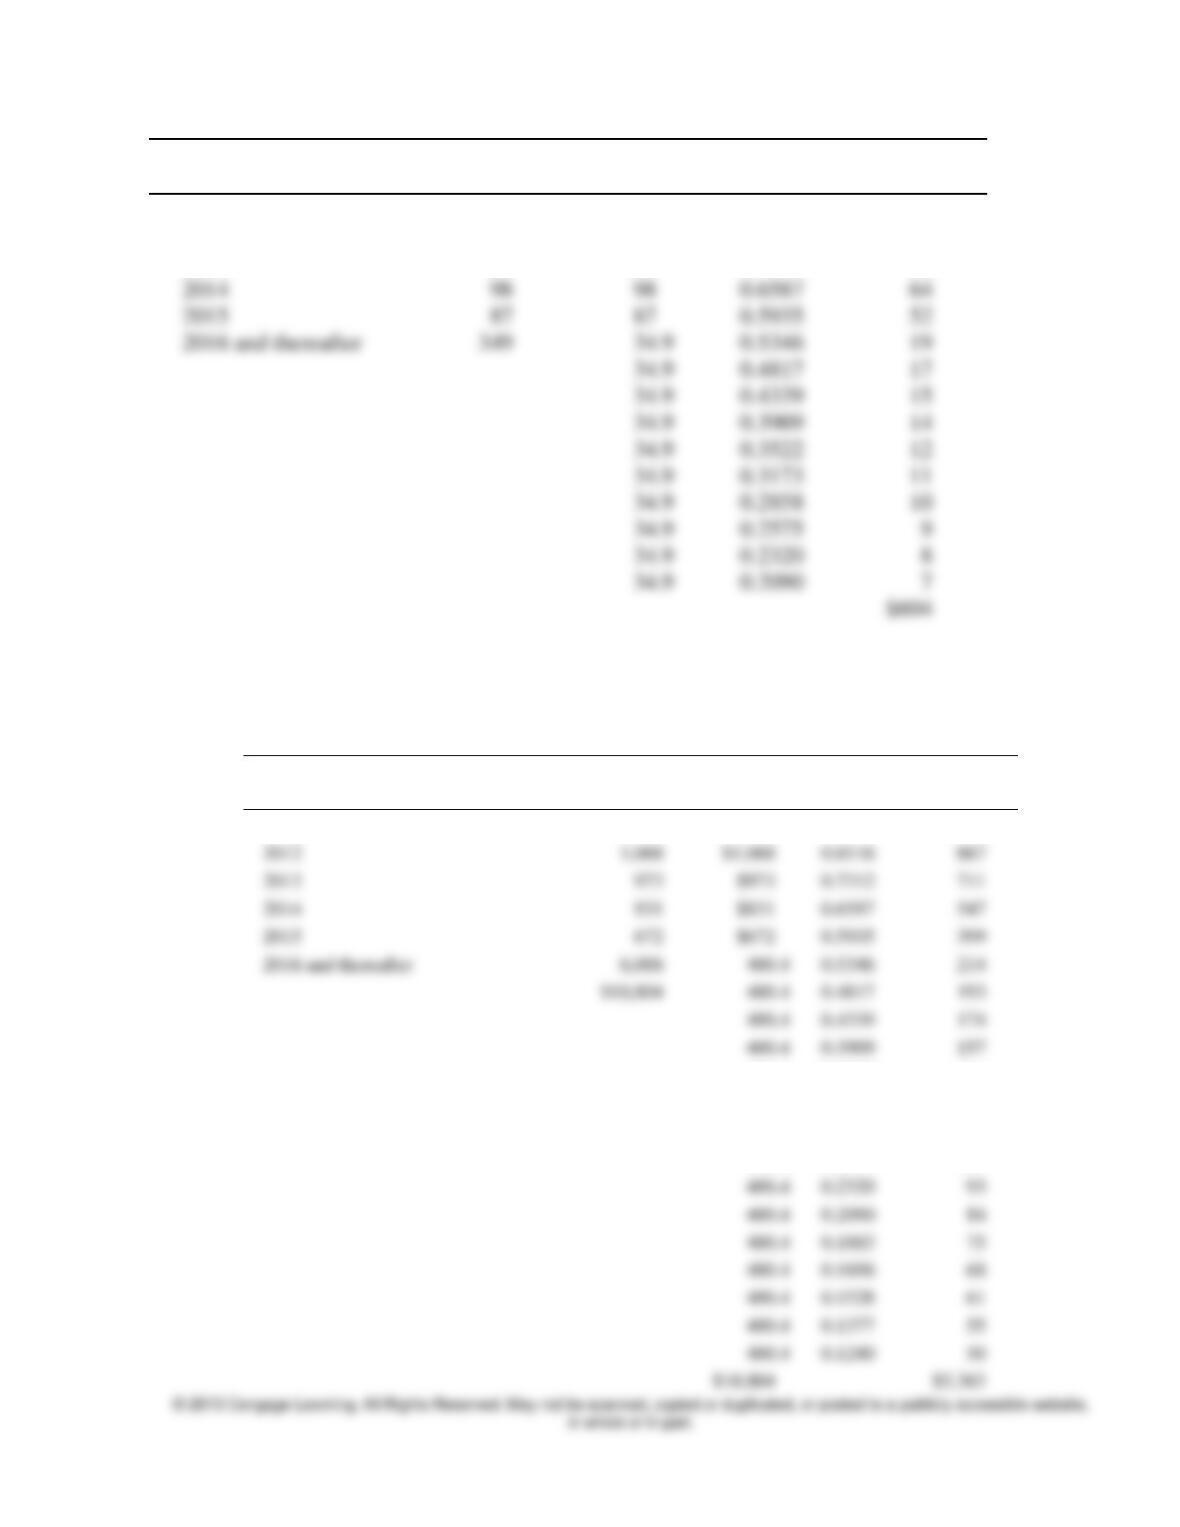
10 Instructor’s Manual
Year
Reported
Payment
Assumed
Payment
PV factor at
10%
PV
2011
$186
$186
0.9009
$168
2012
136
136
0.8116
110
2013
120
120
0.7312
88
2014
0.6587
64
2015
0.5935
52
2016 and thereafter
349
0.5346
19
0.4817
17
0.4339
15
0.3909
14
0.3522
12
0.3173
11
0.2858
10
0.2575
0.2320
0.2090
$604
For operating leases, the average contract life appears to be longer. This is based on the large
balloon value for lease payments for 2016 and beyond. If we assume that the average life of the
operating leases is 20 years, the present value of operating leases using a 11% discount rate is as
follows:
Year
Reported
Payment
Assumed
Payment
PV factor at
11%
PV
2011
$1,254
$1,254
0.9009
1130
2012
$1,068
0.8116
867
2013
0.7312
711
2014
0.6587
547
2015
0.5935
399
2016 and thereafter
400.4
0.5346
214
400.4
0.4817
193
400.4
0.4339
174
400.4
0.3909
157
400.4
0.3522
141
400.4
0.3173
127
400.4
0.2858
114
400.4
0.2575
103
400.4
0.2320
400.4
0.2090
400.4
0.1883
400.4
0.1696
400.4
0.1528
400.4
0.1240
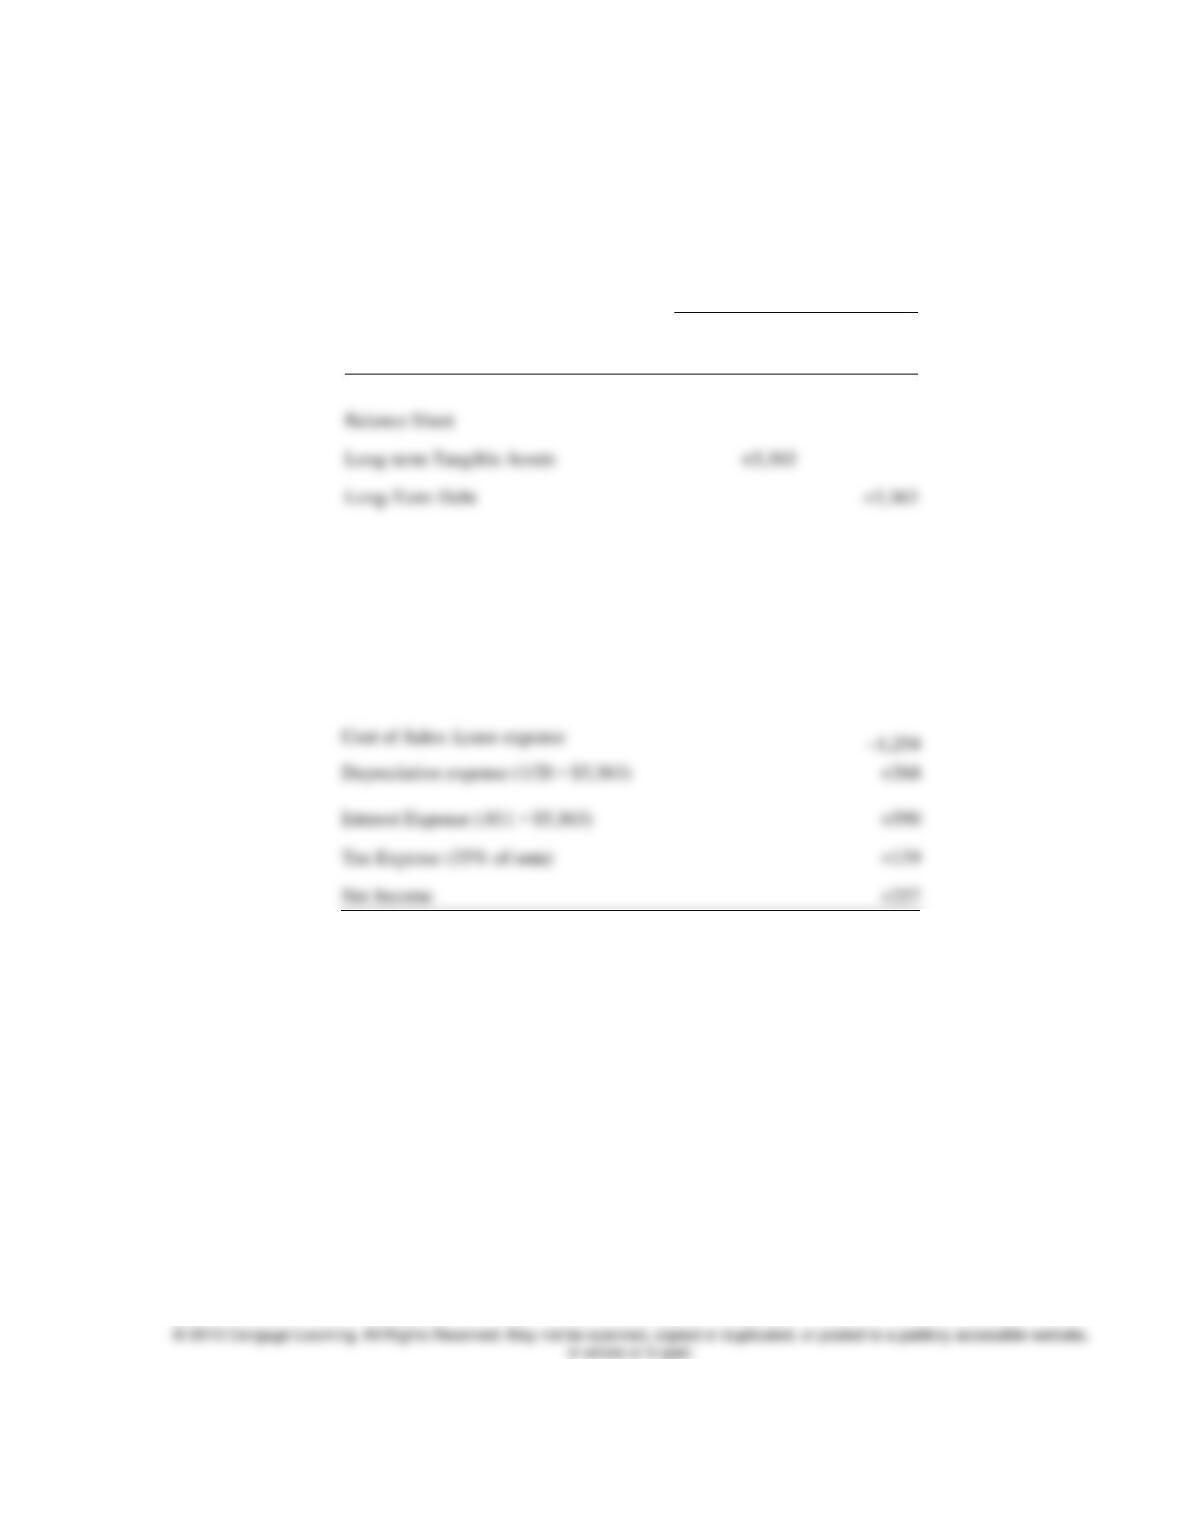
Chapter 4 Implementing Accounting Analysis 11
The adjusted balance sheet for December 31, 2010 is as follows:
Adjustment Dec. 31, 2010
($ millions)
Assets
Liabilities &
Equity
Balance Sheet
Long-term Tangible Assets
Long-Term Debt
For the year ended December 31, 2010, the impact on net income would be as follows:
Income Statement
Tax Expense (35% of sum)
Net Income
Note: The assumption is made that the lease expense for 2010 is the same as the expected lease
payment for 2011.
5. In 2011, Tata became the first Indian brand to be named in the top 50 global brands in Brand
Finance’s 2011 Global 500 report, which assigned the Tata brand a value of $15.8 billion. What
approaches would you use to estimate the value of brands? What assumptions underlie these
approaches? As a financial analyst, what would you use to assess whether the brand value
assigned by Brand Finance was a reasonable reflection of the future benefits from this brand?
What questions would you raise with the firm’s CFO about the firm’s brand assets?
In thinking about how to estimate brand value, an analyst might use any of the following
approaches. First, one might estimate brand value based on the premium price that company’s
12 Instructor’s Manual
Several assumptions underlie the above brand valuation approaches. First, under the price premium
approach, brands will only have value if: (a) the consumers will continue to value branded products
more highly than non-branded in the foreseeable future, (b) companies continue to maintain the
value of their brands, despite potential competition, and (c) premium prices are accompanied by
higher advertising outlays, so that brands create economic value for shareholders.
An analyst should question the company on the amount of any intangible asset reported on its
balance sheet that relates to its brand. Regardless of what Brand Finance is reporting, if the
company carries an intangible asset related to brand, is the company confident that this asset
6. As the CFO of a company, what indicators would you look at to assess whether your firm’s long-term
assets were impaired? What approaches could be used, either by management or an independent
valuation firm, to assess the dollar value of any asset impairment? As a financial analyst, what indicators
would you look at to assess whether a firm’s long-term assets were impaired? What questions would you
raise with the firm’s CFO about any charges taken for asset impairment?
Impairment is the loss of a significant portion of the utility of an asset through casualty,
obsolescence, or lack of demand for the asset’s service. A loss should be recognized when an asset
Chapter 4 Implementing Accounting Analysis 13
On the other hand, if the firm cannot assess the current market value of the asset, the impairment
loss amount is calculated as the difference between the old net book value and the expected net
present value of the future cash flows.
A financial analyst should look for the same types of indicators that the CFO looks for, of course
understanding that the CFO, as an insider of the company, has a great deal more information about
such issues as casualty, obsolescence, or lack of demand of certain assets. Indicators of impairment
include sustained declines in a firm’s and/or industry’s return on assets relative to its cost of capital,
7. The cigarette industry is subject to litigation for health hazards posed by its products. The industry has
been in an ongoing process of negotiating a settlement of these claims with state and federal governments.
As the CFO for Altria Group, the parent company of Philip Morris, one of the larger firms in the industry,
what information would you report to investors in the annual report on the firm’s litigation risks? How
would you assess whether the firm should record a liability for this risk, and if so, what approach would
you use to assess the value of this liability? As a financial analyst following Philip Morris, what questions
would you raise with the CEO over the firm’s litigation liability?
The litigation risks that Philip Morris faces are reported as contingent liabilities defined in SFAS 5.
Contingent liabilities arise from events or circumstances occurring before the balance sheet date,
Probable – If it is probable that Philip Morris will lose the lawsuit and the loss can be reasonably
estimated, the estimated loss should be reported as a charge to income and as a liability. If the loss
14 Instructor’s Manual
Reasonably possible – Where the likelihood that Philip Morris will lose the lawsuit is reasonably
possible, no amount needs to be accrued as a liability but the nature of the suit needs to be disclosed
in the footnotes of the annual report.
As a financial analyst following Philip Morris I would push the CEO for as much information as
possible about the likelihood that the company will lose the lawsuits or come to a settlement with
the claimants. This requires that the analysts understand the law and case history for the industry. It
also requires information on the company’s plans to either take the cases to trial or to settle, as well
as the costs of a legal battle, the company’s assessment of its chances of victory, and the costs of a
potential settlement.
8. Refer to the Lufthansa example on asset depreciation estimates. What adjustments would be required
if Lufthansa’s aircraft depreciation were computed using an average life of 25 years and salvage value of
5% (instead of the reported values of 12 years and 15%)? Show the adjustments to the 2008 and 2009
balance sheets, and to the 2009 income statement.
If Lufthansa used a 25-year average aircraft life (rather than 12 years) and a 5% salvage value
Chapter 4 Implementing Accounting Analysis 15
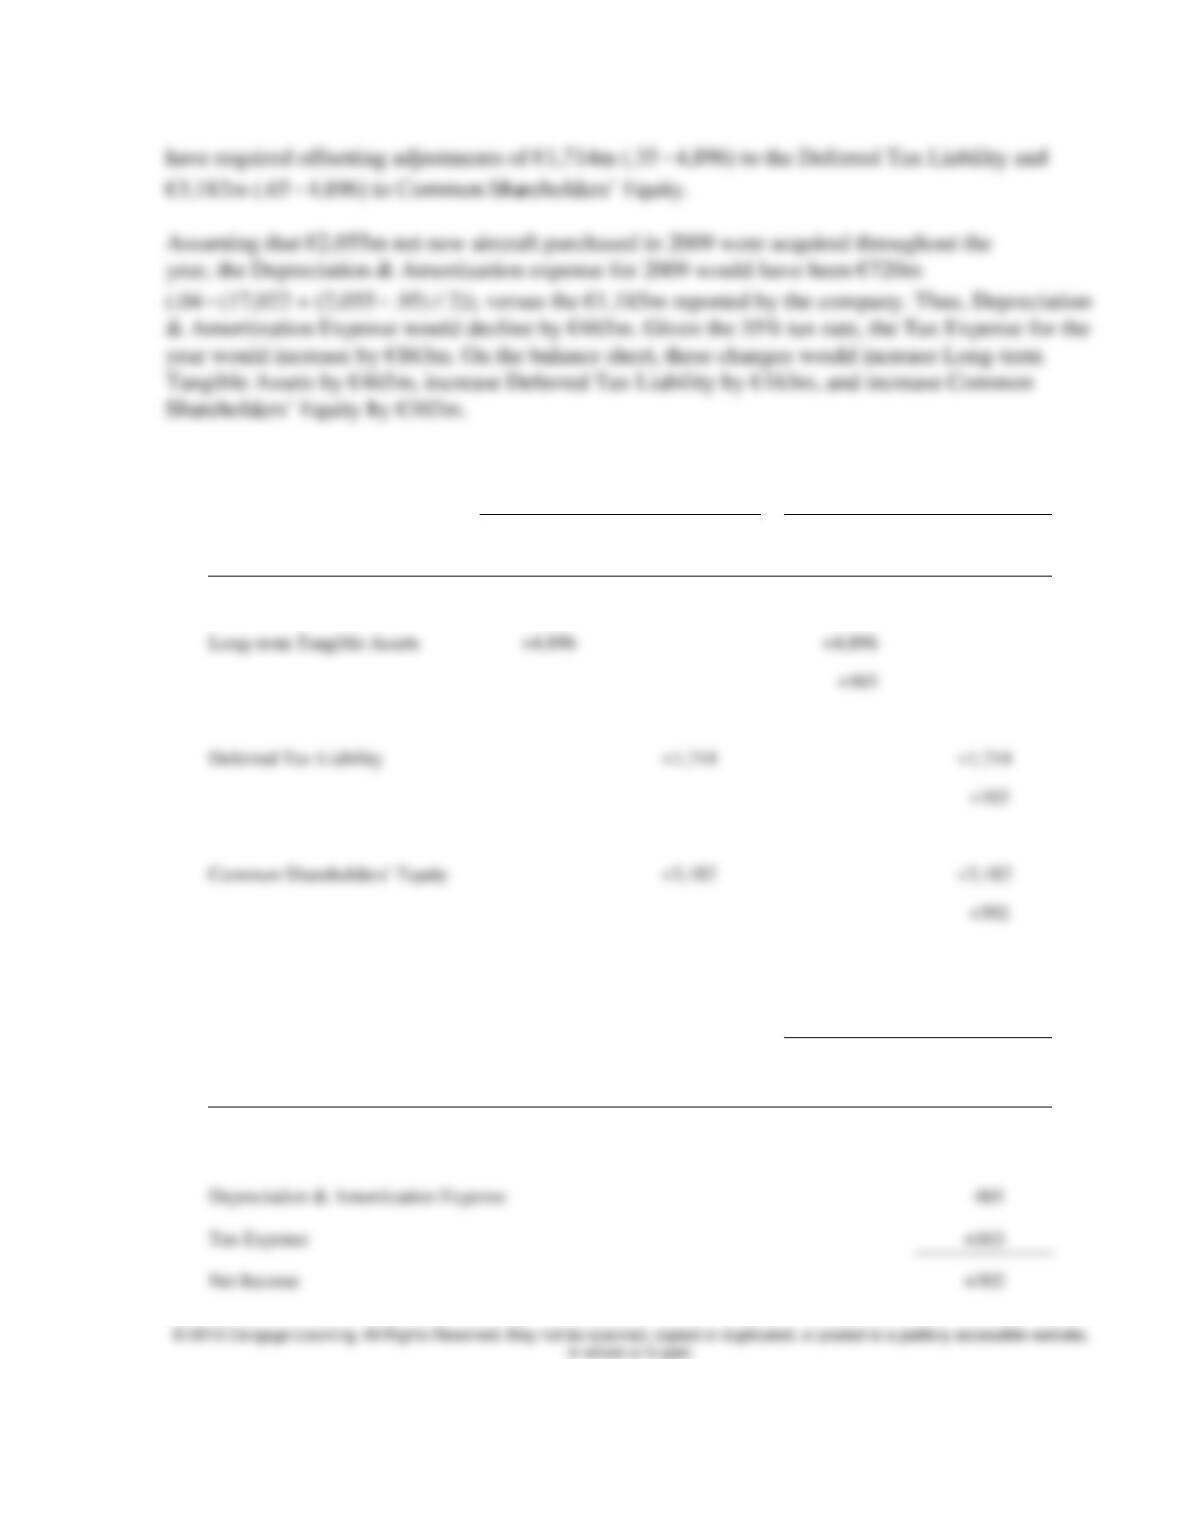
The adjustments to the financial statements would therefore be as follows:
Adj. for Dec. 31, 2008
Adj. for Dec. 31, 2009
(€millions)
Assets
Liabilities &
Equity
Assets
Liabilities &
Equity
Balance Sheet
Long-term Tangible Assets
Deferred Tax Liability
+3,182
+3,182
+302
Adj. for Dec. 31, 2009
Assets
Liabilities &
Equity
Income Statement
Depreciation & Amortization Expense
Tax Expense
Net Income
16 Instructor’s Manual
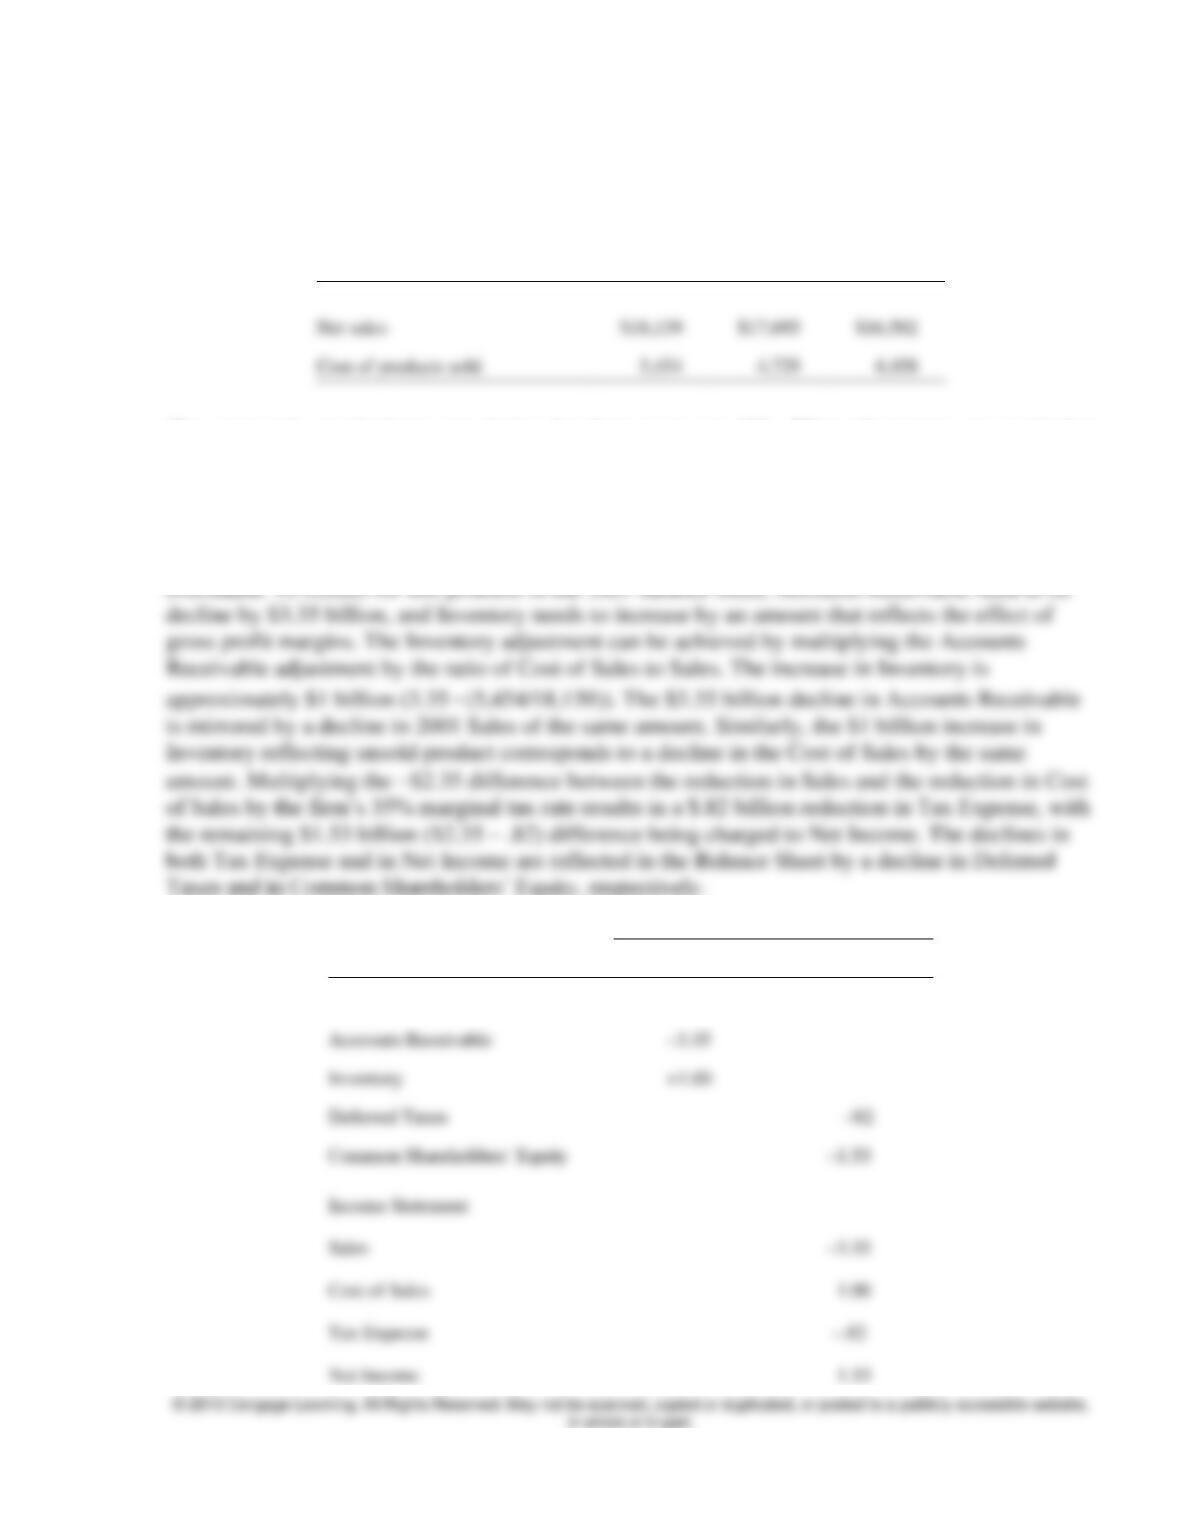
9. In early 2003, Bristol-Myers Squibb announced that it would have to restate its financial statements as
a result of stuffing as much as $3.35 billion worth of products into wholesalers’ warehouses from 1999
through 2001. The company’s sales and cost of sales during this period was as follows:
2001
2000
1999
Net sales
Cost of products sold
The company’s marginal tax rate during the three years was 35%. What adjustments are required to
correct Bristol-Myers Squibb’s balance sheet for December 31, 2001? What assumptions underlie your
adjustments? How would you expect the adjustments to affect Bristol-Myers Squibb’s performance in the
coming few years?
In the Bristol-Myers Squibb example, the firm’s Accounts Receivable, Sales, and Income are
Adjustments for Dec.31, 2001
($billions)
Assets
Liabilities & Equity
Balance Sheet
Accounts Receivable
Inventory
Deferred Taxes
Income Statement
Sales
Cost of Sales
Tax Expense
Net Income