CHAPTER 4 Cost-Volume-Profit Analysis: A Managerial Planning Tool
E 4-35 (Continued)
2. d. Both fixed cost and unit variable cost increase:
E 4-36
1. Unit Contribution Margin = $791,700/54,600 = $14.50
$60,000
$70,000
4-18
CHAPTER 4 Cost-Volume-Profit Analysis: A Managerial Planning Tool
E 4-37
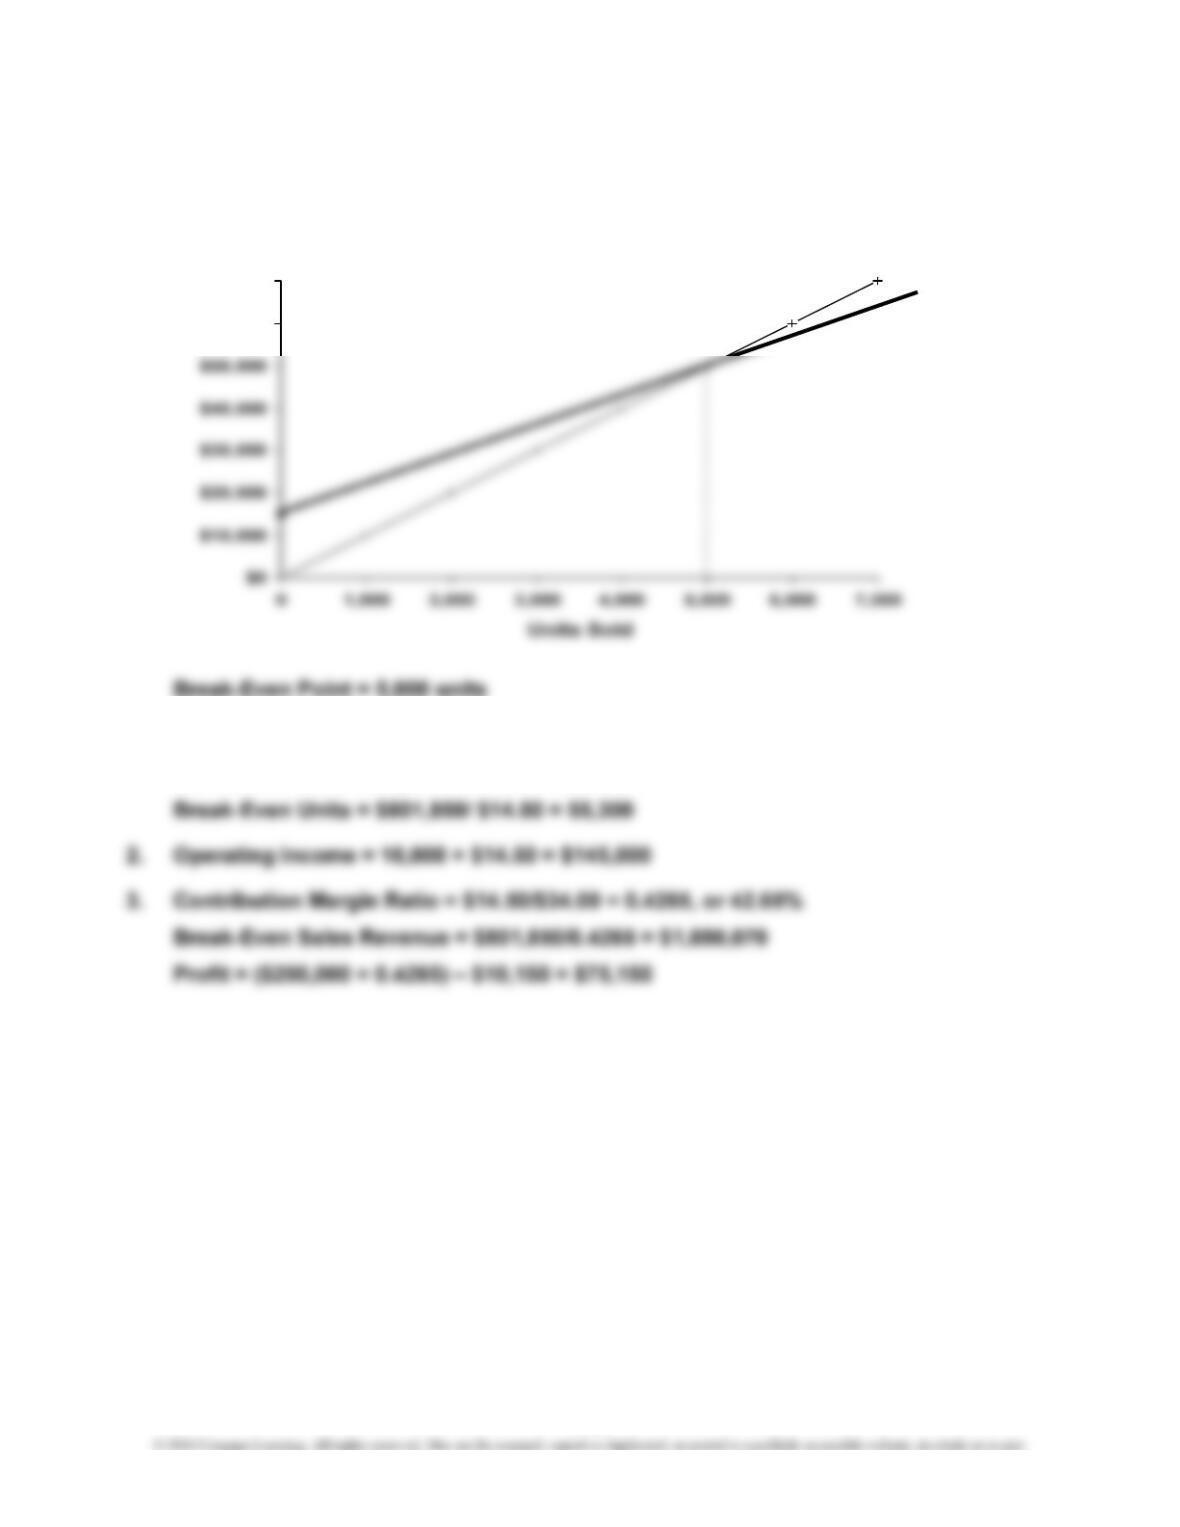
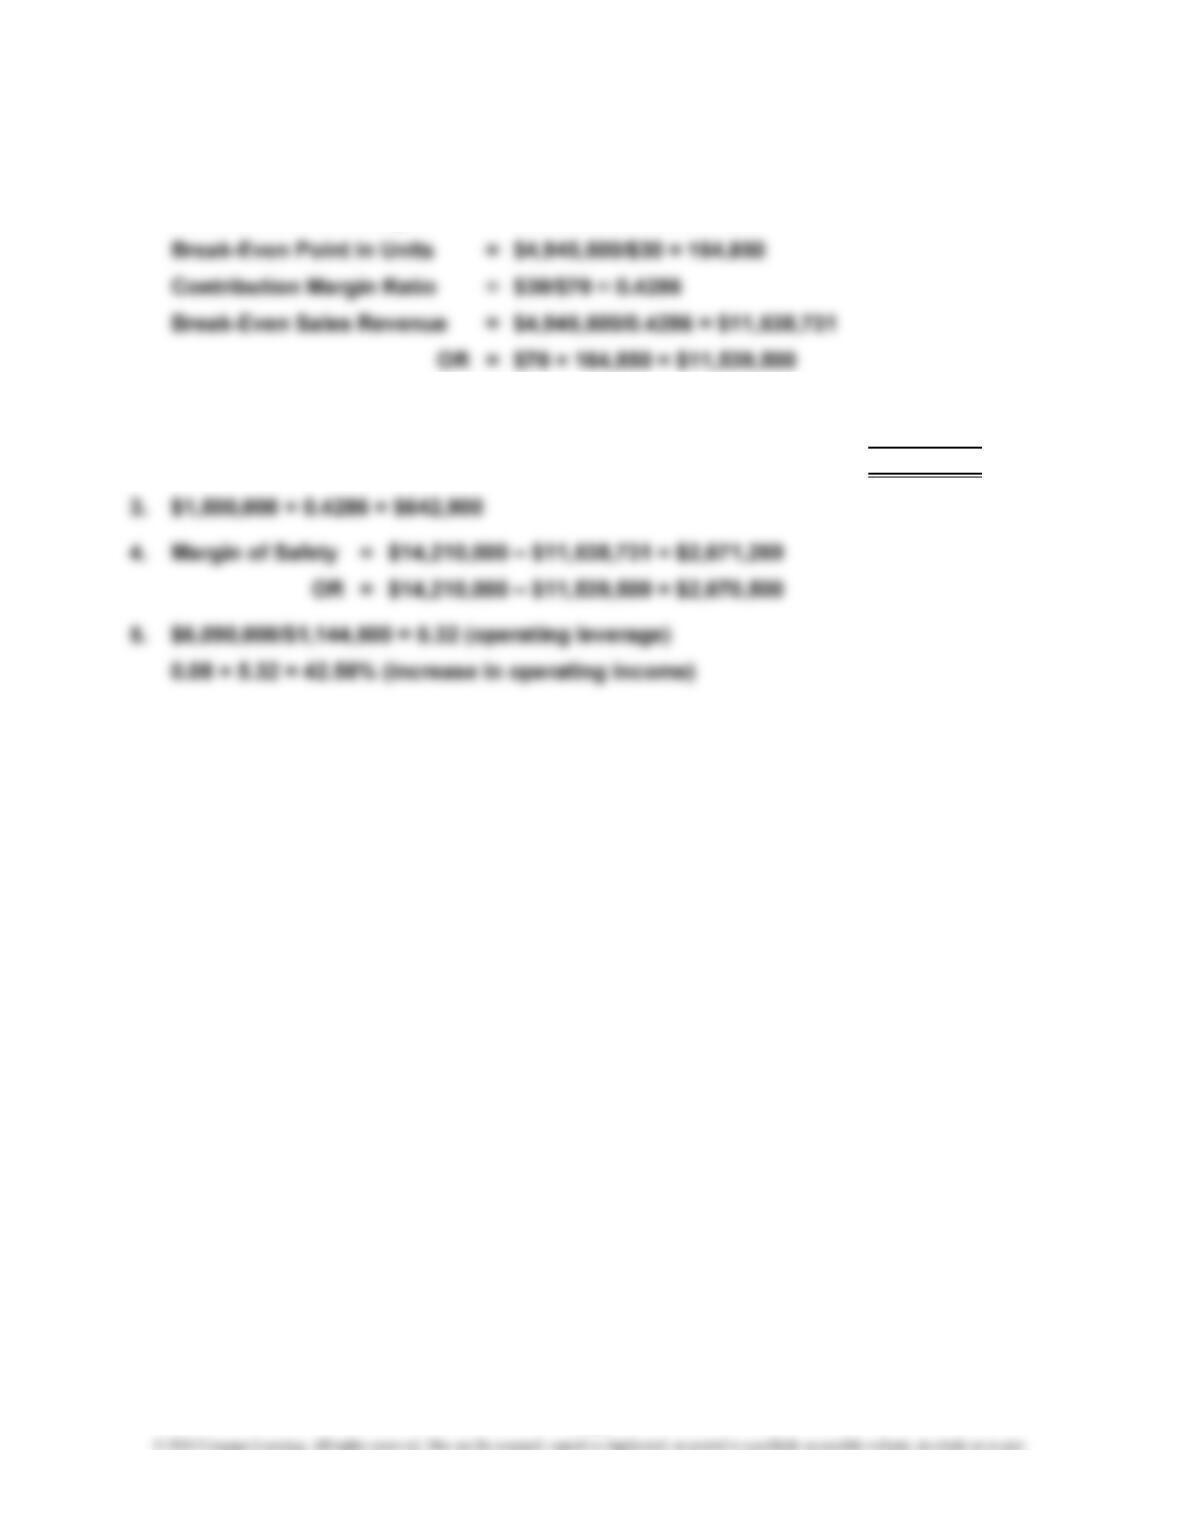
1. Break-Even Sales Dollars = $733,320/0.42* = $1,746,000
*Contribution Margin Ratio = $756,000/$1,800,000 = 0.42, or 42%
E 4-38
1. Sales Total
Product Price
–
=CM ×Mix=CM
Vases $40 $10 2 $20
2. The new sales mix is 3 vases to 2 figurines.
Sales Total
Product Price
–
=CM ×Mix=CM
Vases $40 $10 3 $30
$30
Variable
Variable
Cost
Cost
$30
4-19
CHAPTER 4 Cost-Volume-Profit Analysis: A Managerial Planning Tool
E 4-39
1. a. Variable Cost per Unit = $8,190,000/450,000 = $18.20
b. Contribution Margin per Unit = $3,510,000/450,000 = $7.80
3. Additional Operating Income = $50,000 × 0.30 = $15,000
4. Margin of Safety in Units = 450,000 – 289,000 = 161,000 units
Margin of Safety in Sales Dollars = $11,700,000 – $7,514,000 = $4,186,000
4-20
CHAPTER 4 Cost-Volume-Profit Analysis: A Managerial Planning Tool
P 4-40
3. Contribution Margin Ratio = $6/$24 = 0.25
With additional sales of $160,000, the additional profit would be
P 4-41
=Break-Even Units1.
PROBLEMS
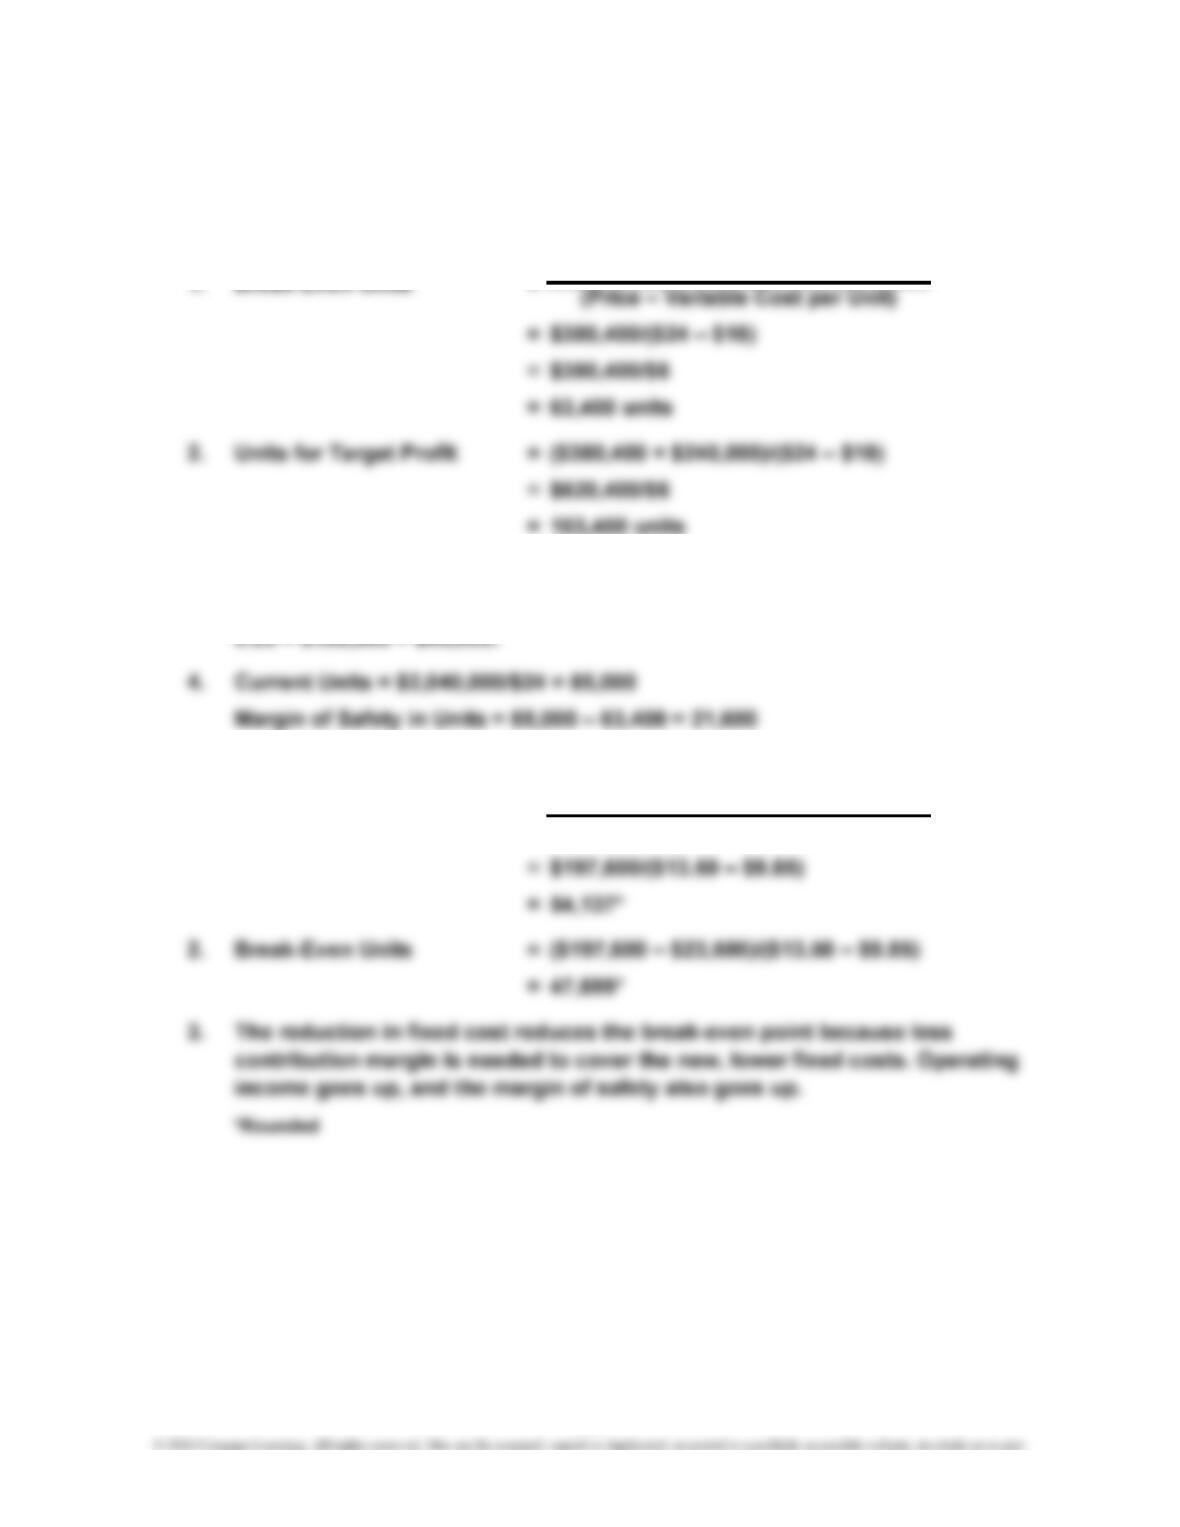
Fixed Cost
(Price – Variable Cost per Unit)
Fixed Cost
4-21
CHAPTER 4 Cost-Volume-Profit Analysis: A Managerial Planning Tool
P 4-42
1. Unit Contribution Margin = $6,090,000/203,000 = $30
2. Increased contribution margin ($1,000,000 × 0.4286)……………….
…
$428,600
Less: Increased advertising expense………………………….………
…
250,000
Increased operating income………………………………….………
…
$178,600
4-22
CHAPTER 4 Cost-Volume-Profit Analysis: A Managerial Planning Tool
P 4-43
1. Sales mix:
Basic: $3,000,000/$30 = 100,000 units
Aero: $2,400,000/$60 = 40,000 units
Variable Sales Total
Product Price
–
Cost* = × Mix = CM
2. New mix:
Variable Sales Total
Product Price
–
Cost* = × Mix = CM
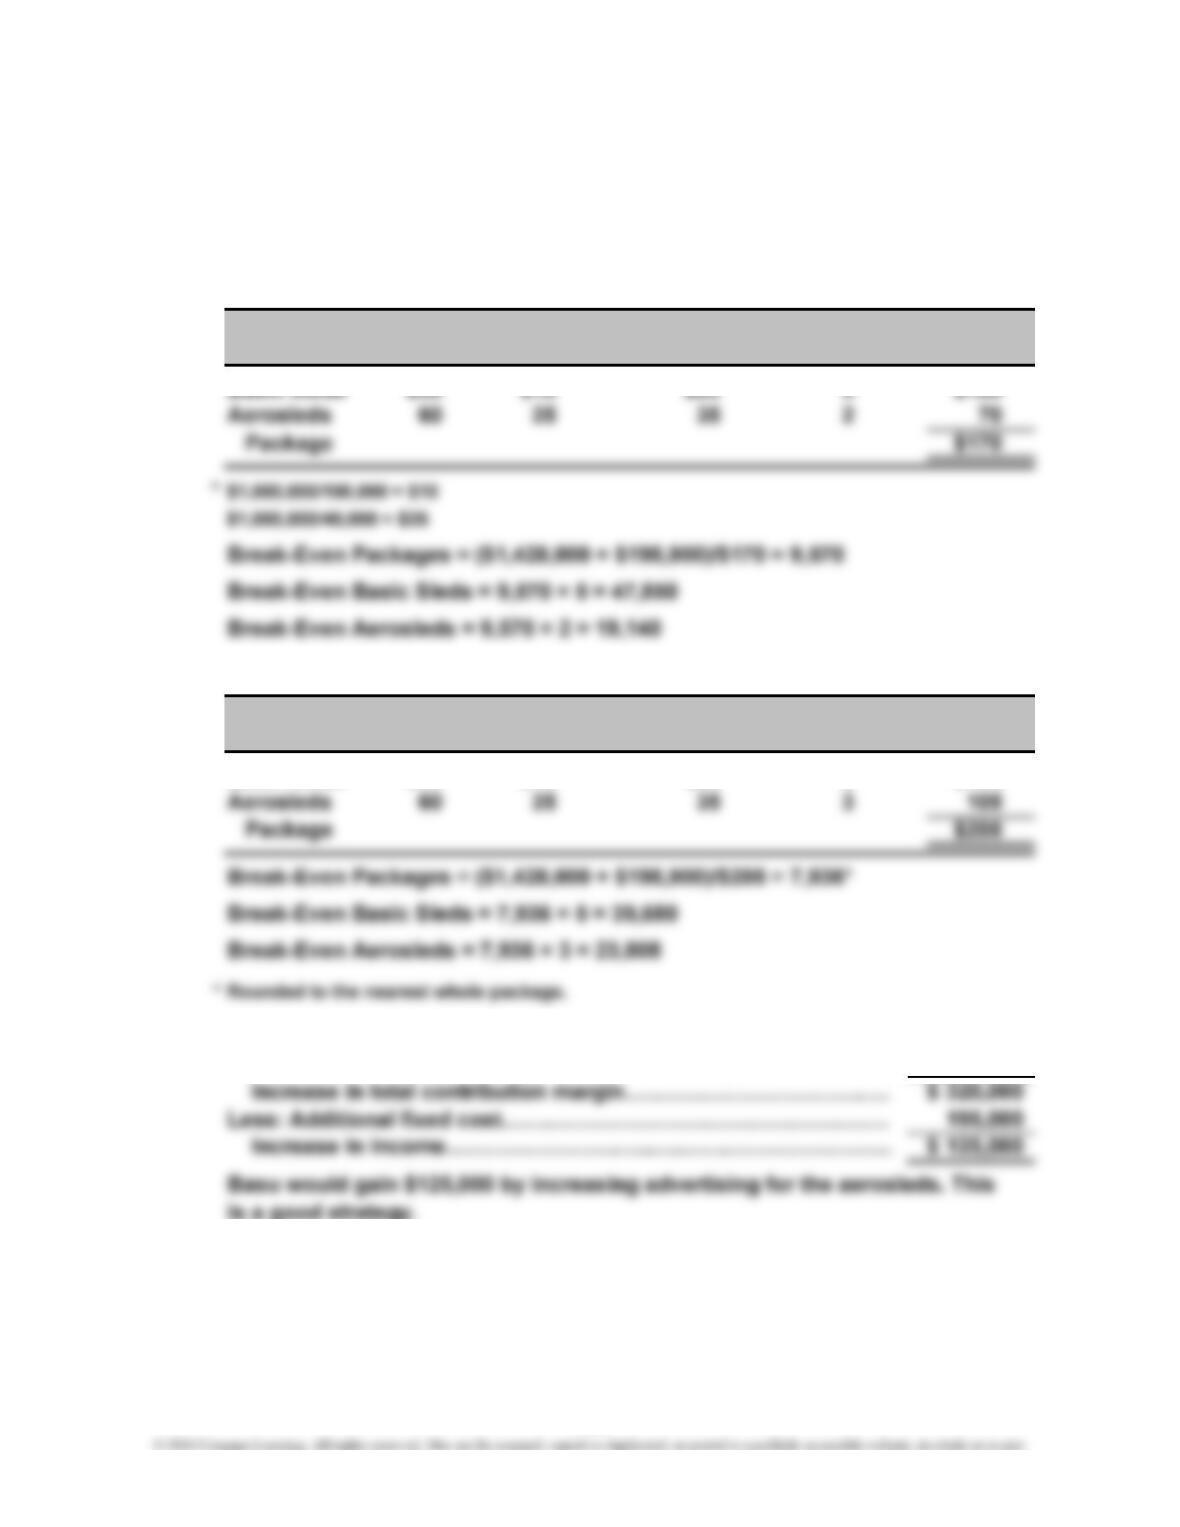
Basic sleds $30 $10 5 $100
3. Increase in contribution margin for aerosleds (12,000 × $35)……
…
Decrease in contribution margin for basic sleds (5,000 × $20)……
$ 420,000
(100,000)
Contribution
Margin
$20
Margin
Contribution
4-23
CHAPTER 4 Cost-Volume-Profit Analysis: A Managerial Planning Tool
P 4-44
1. Break-Even Units = $58,140/($3.40 – $2.55) = 68,400
Margin of Safety in Units = 81,600 – 68,400 = 13,200
2. Sales revenue ($3.40 × 81,600)……………………..………………..… $277,440
Total variable cost ($2.55 × 81,600)……………….…………….……
…
208,080
4. Operating Income = Sales – (Variable Cost Ratio × Sales) – Fixed Cost
P 4-45
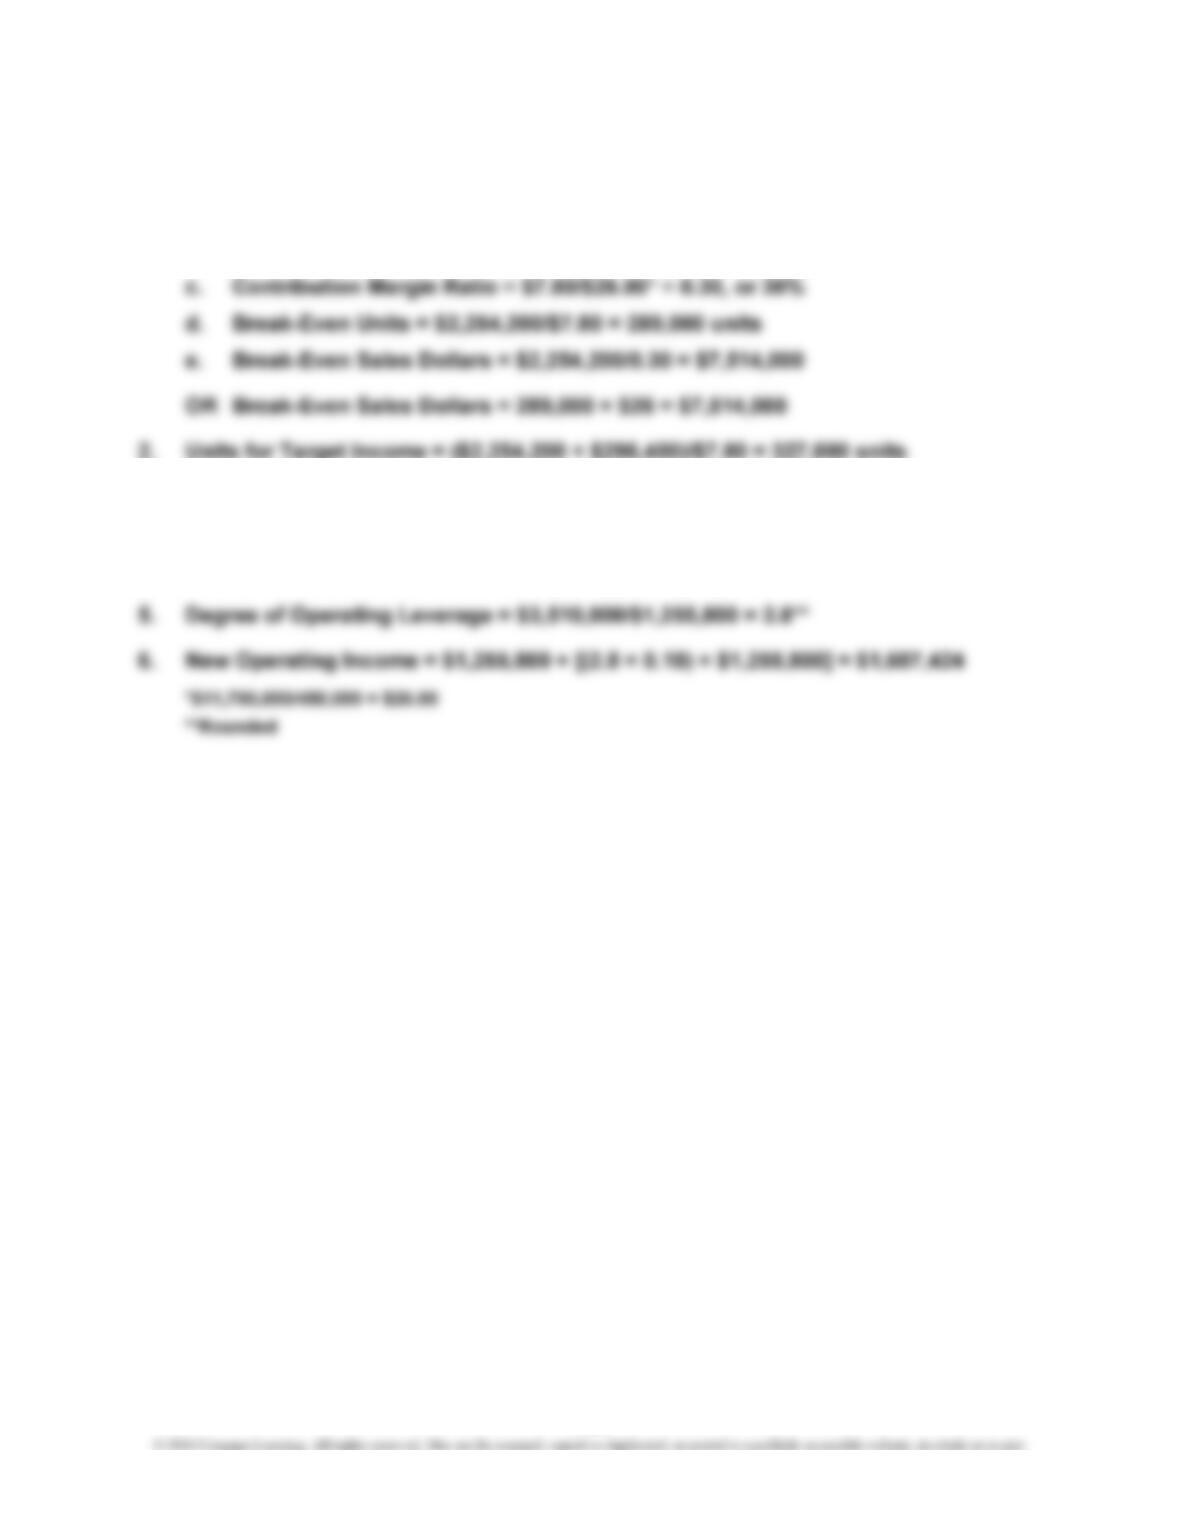
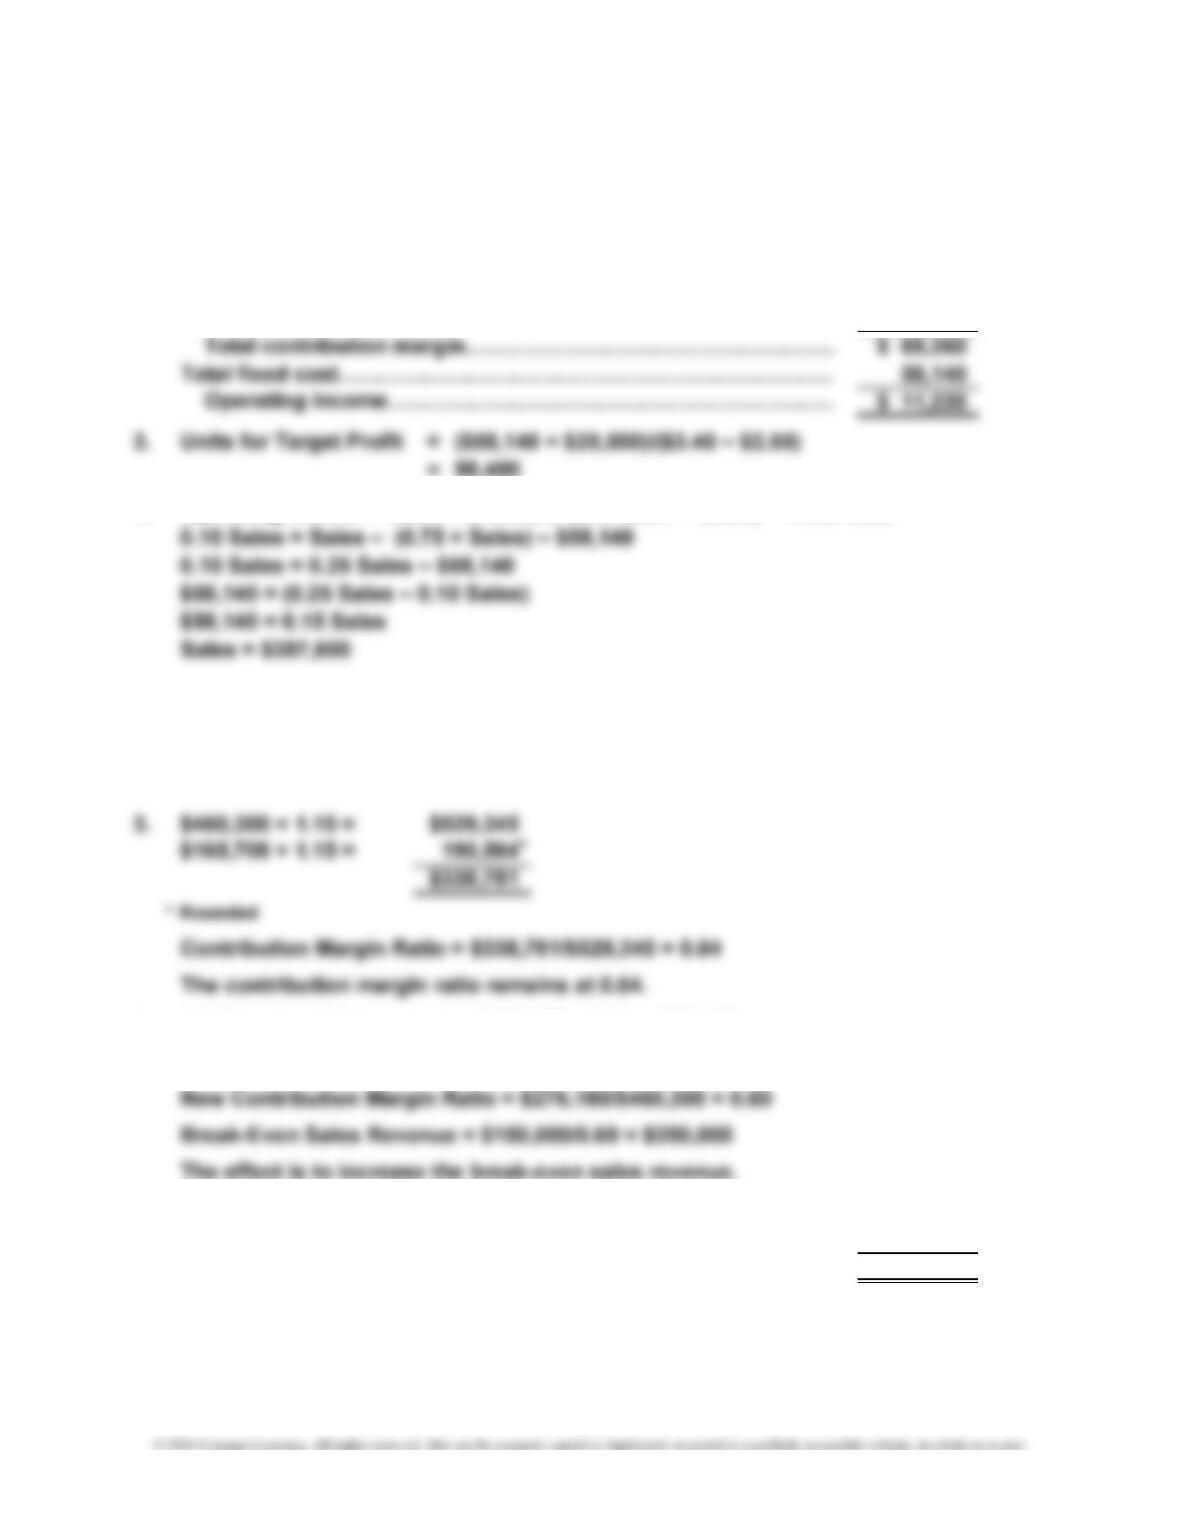
1. Contribution Margin Ratio = $294,592/$460,300 = 0.64, or 64%
2. Break-Even Sales Revenue = $150,000/0.64 = $234,375
4. Additional variable expense: $460,300 × 0.04 = $18,412
New Contribution Margin = $294,592 – $18,412 = $276,180
5. Projected contribution margin*………………………………………
…
$324,180
Present contribution margin………………….………………………
…
294,592
Increase in contribution margin/profit………………………………
…
$ 29,588
*($460,300 + $80,000) × 0.60 = $324,180
4-24
CHAPTER 4 Cost-Volume-Profit Analysis: A Managerial Planning Tool
P 4-45 (Continued)
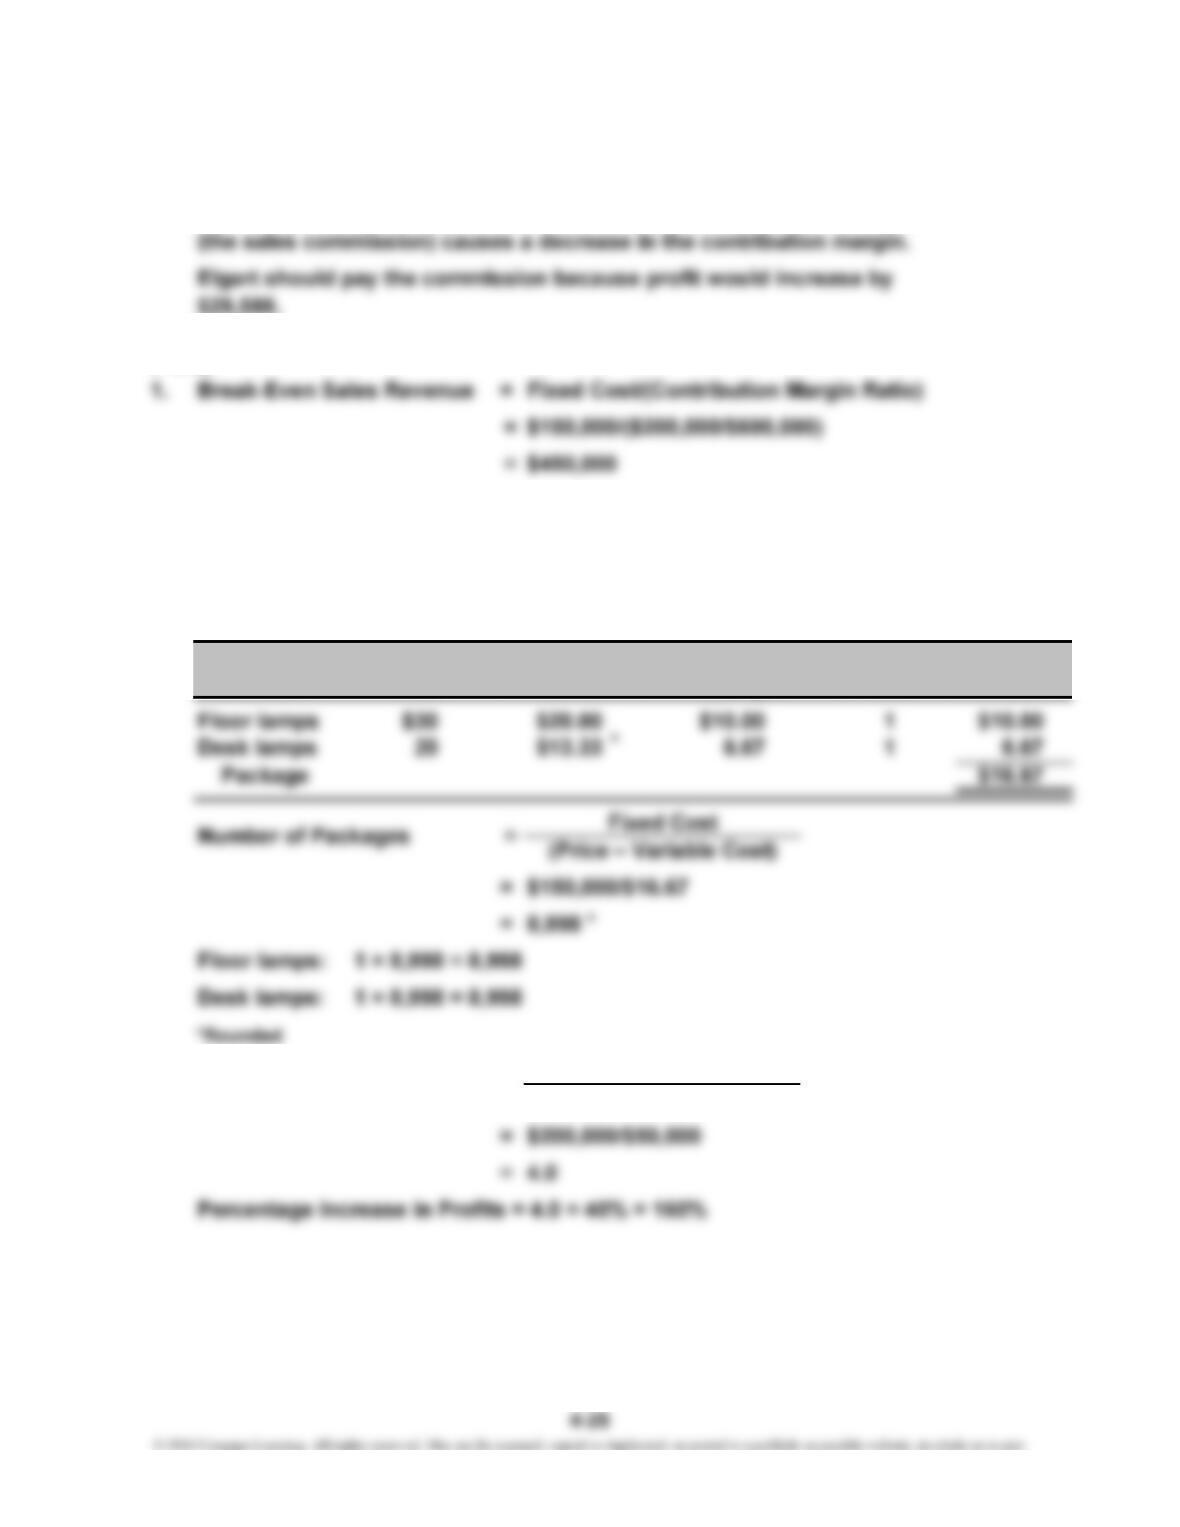
Operating leverage will decrease because the increase in variable cost
P 4-46
2. Of total sales revenue, 60% is produced by floor lamps and 40% by desk lamps.
$360,000/$30 = 12,000 units
$240,000/$20 = 12,000 units
Thus, the sales mix is 1:1.
Variable Sales Total
Product Price
–
Cost = × Mix = CM
3.
Operating Leverage =
Operating Income
Contribution
Margin
Contribution Margin
CHAPTER 4 Cost-Volume-Profit Analysis: A Managerial Planning Tool
P 4-47
1.
CM = $3 = $3
CM ratio = 0.25 = 0.375
3. Sales mix (from Requirement 2): 1 door handle to 2 trim kits
Sales Total
Product Price
–
= × Mix CM
Door handle $12 1 $3.00
Trim Kits = 2 × 16,222 = 32,444
4. Revenue (70,000 × $8)…………………….…………………………………
V
ariable cost (70,000 × $5)…………………….…………………………
…
P 4-48
1. Break-Even Units = $300,000/ $14* = 21,429**
=
$9
$8 – $5
$3/$8
Trim Kits
Contribution
Margin
560,000$
$3
350,000
V
ariable
Cost
Door Handles
$12 – $9
$3/$12
CHAPTER 4 Cost-Volume-Profit Analysis: A Managerial Planning Tool
P 4-48 (Continued)
3. Sales………………………………………………………………………
…
$1,218,000
V
ariable cost (0.45 × $1,218,000)……………….…………..………
…
548,100
P 4-49
= 0.22, or 22%
2. Break-Even Sales Revenue = $110,000/0.22 = $500,000
CHAPTER 4 Cost-Volume-Profit Analysis: A Managerial Planning Tool
P 4-50
1. Income = Revenue – Variable Cost – Fixed Cost
P 4-51
1. Contribution Margin per Unit = $5.60 – $4.20*
= $1.40
3. Sales ($5.60 × 35,000)…….…………………………..…………………
…
196,000$
V
ariable cost ($4.20 × 35,000)………………………………………..…
…
147,000
OR
4-28
CHAPTER 4 Cost-Volume-Profit Analysis: A Managerial Planning Tool
2.
X = $50,000/(1 – 0.80)
X = $50,000/ 0.20
3. Duncan: 3 × 30% = 90%
Macduff: 9 × 30% = 270%
Duncan
CHAPTER 4 Cost-Volume-Profit Analysis: A Managerial Planning Tool
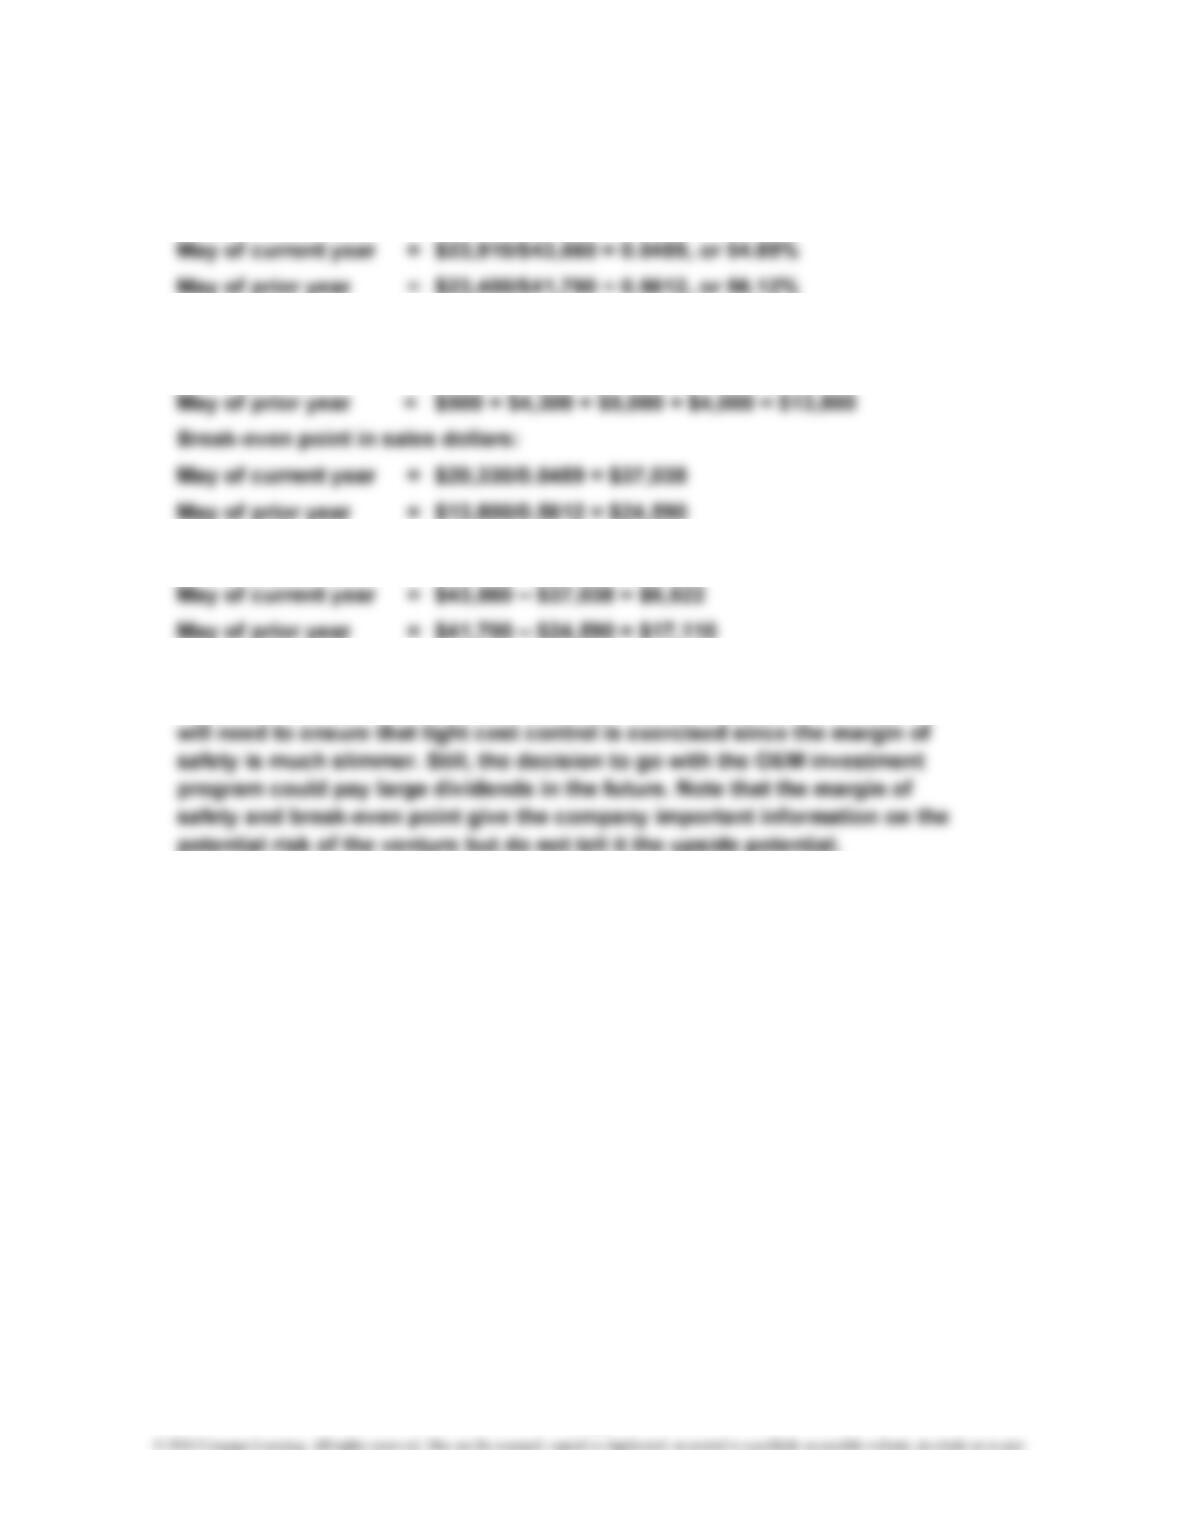
P 4-53
1. Contribution margin ratios:
2. Fixed costs:
May of current year = $680 + 4,300 + $5,600 + $9,750 = $20,330
3. Margin of safety:
4. Clearly, the sharp rise in fixed cost from the prior year to the current year has
had a strong impact on the break-even point and the margin of safety. Kicker
4-30
CHAPTER 4 Cost-Volume-Profit Analysis: A Managerial Planning Tool
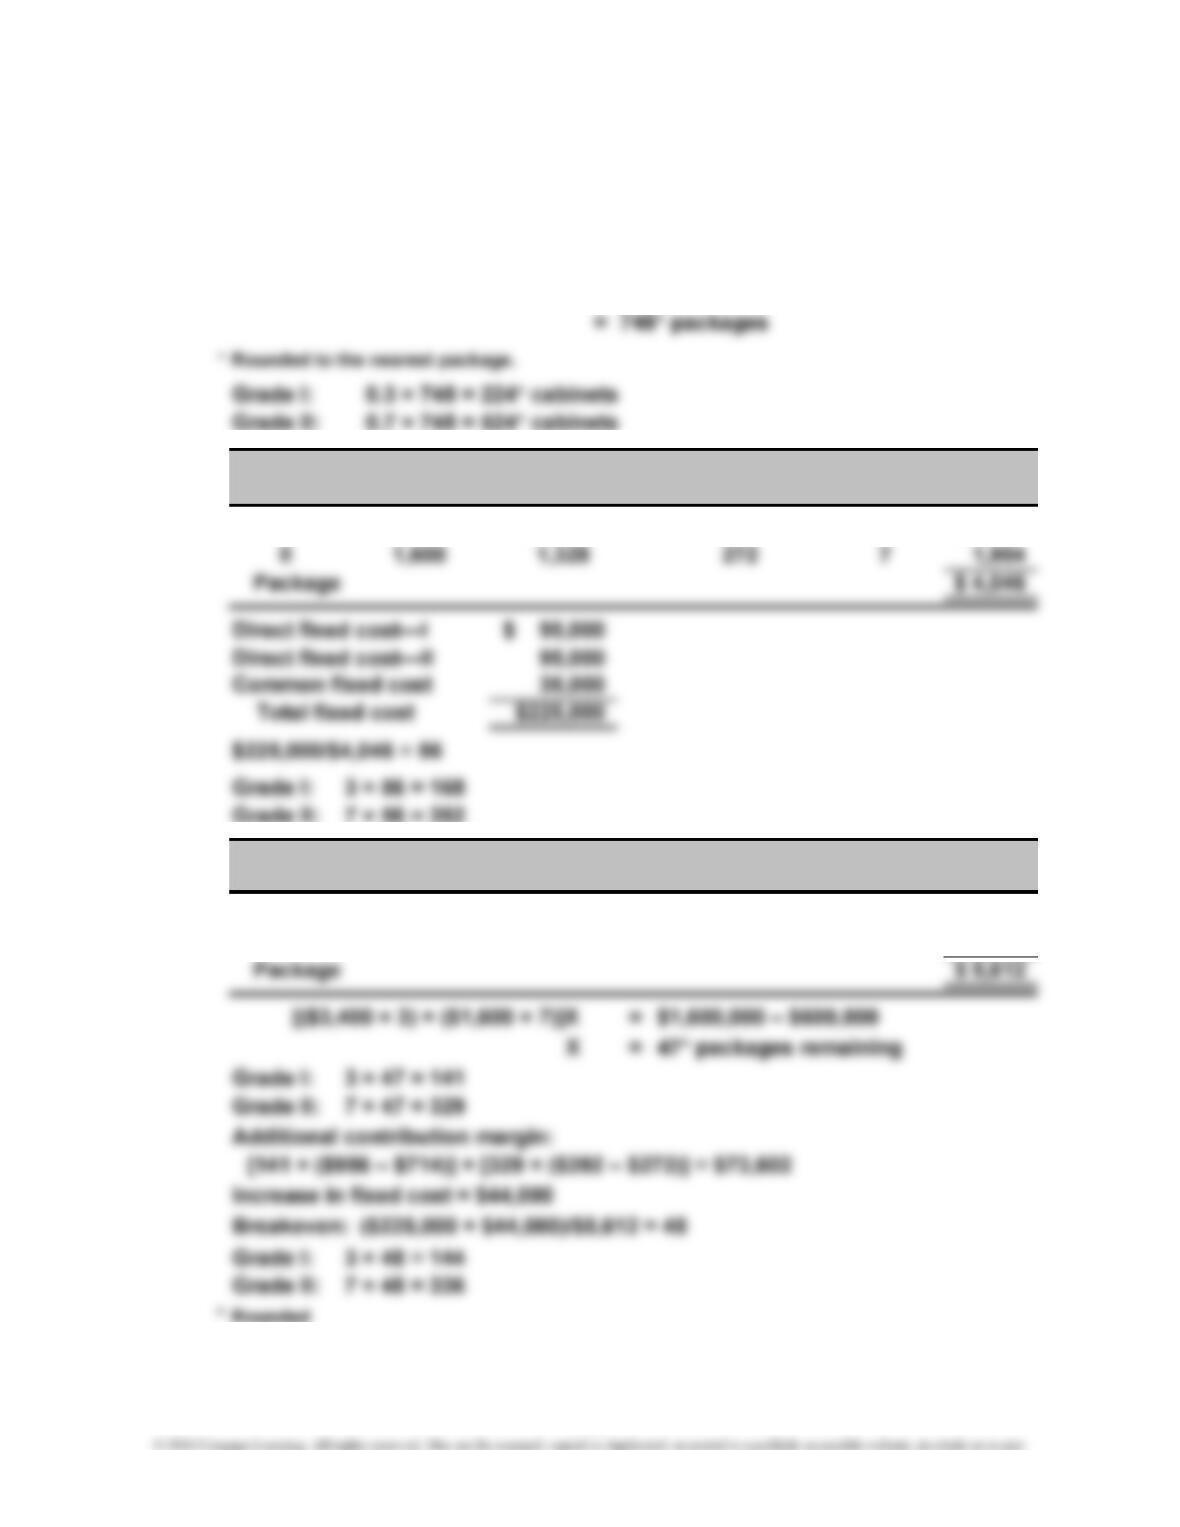
Case 4-54
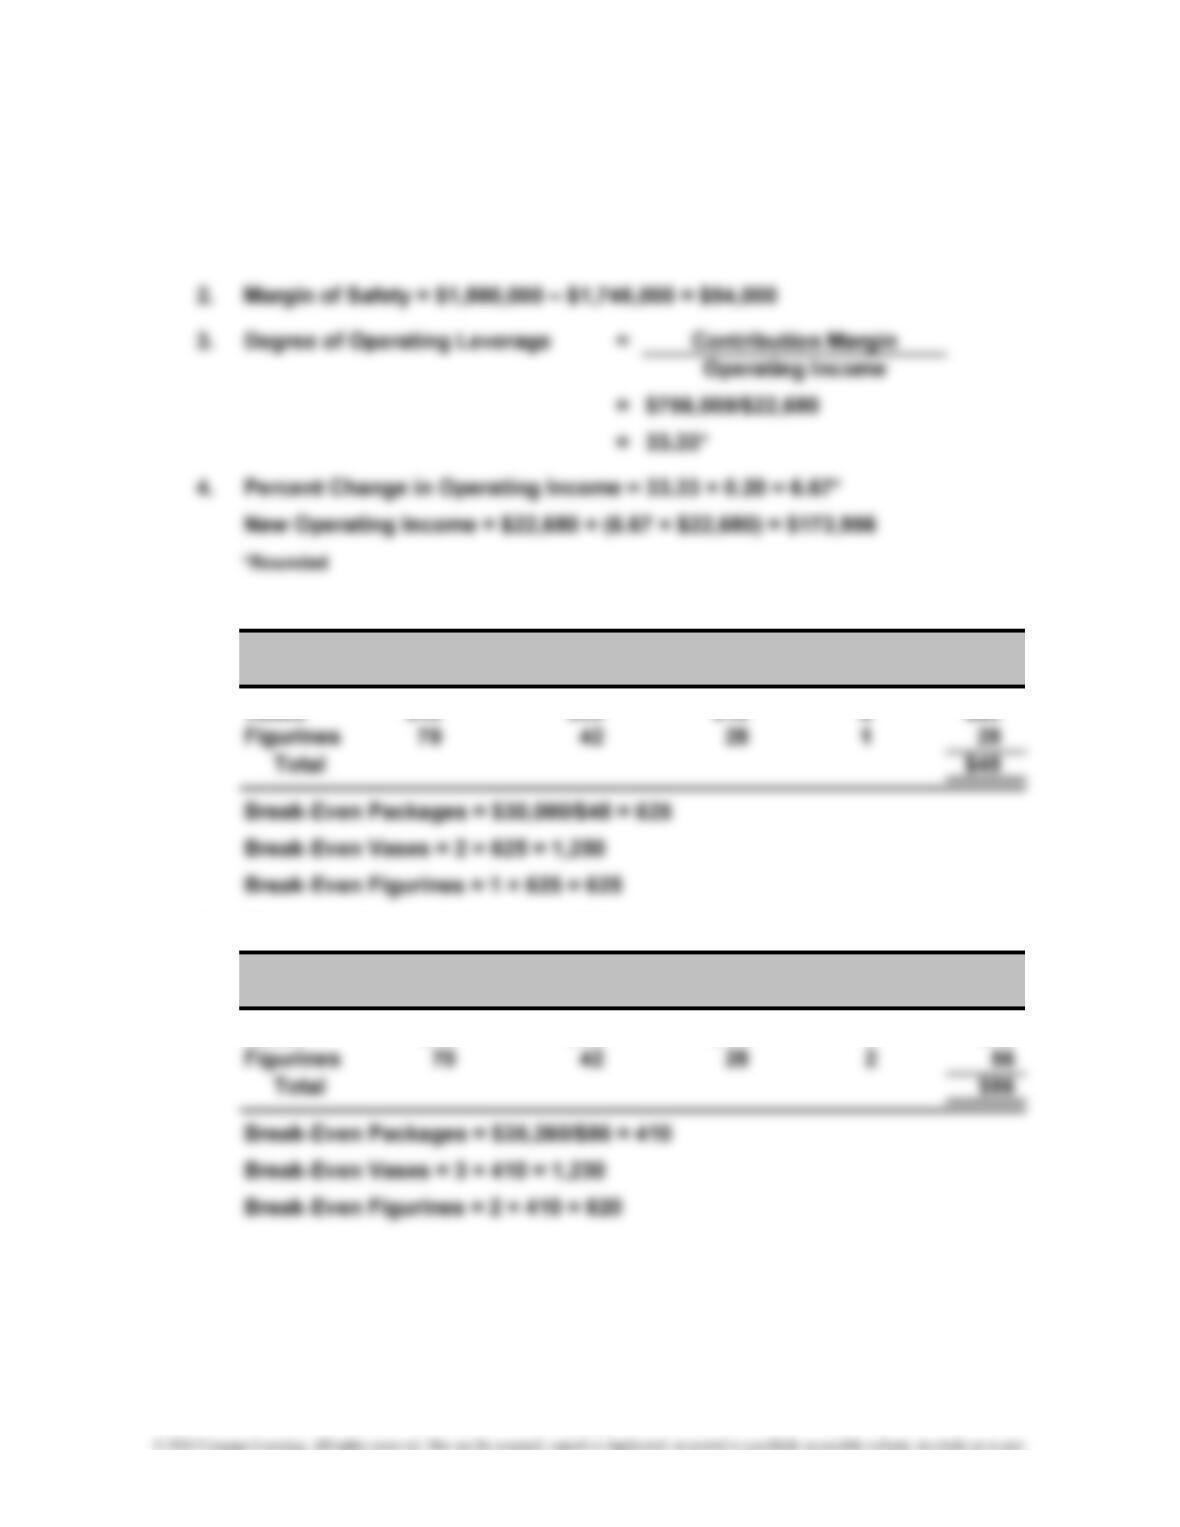
1. Let X be a package of 3 Grade I cabinets and 7 Grade II cabinets.
0.30X($3,400) + 0.70X($1,600) =
2. Contribution Sales Total
Product Price
–
= Margin × Mix = CM
I $3,400 $714 3 2,142$
3.
V
ariable Contribution Sales Total
Product Price
–
Cost = Margin × Mix = CM
I $3,400 $2,444 $956 3 2,868$
II 1,600 1,208 392 7 2,744
*
CASES
$1,600,000
Variable
Cost
$2,686
*
*
4-31
CHAPTER 4 Cost-Volume-Profit Analysis: A Managerial Planning Tool
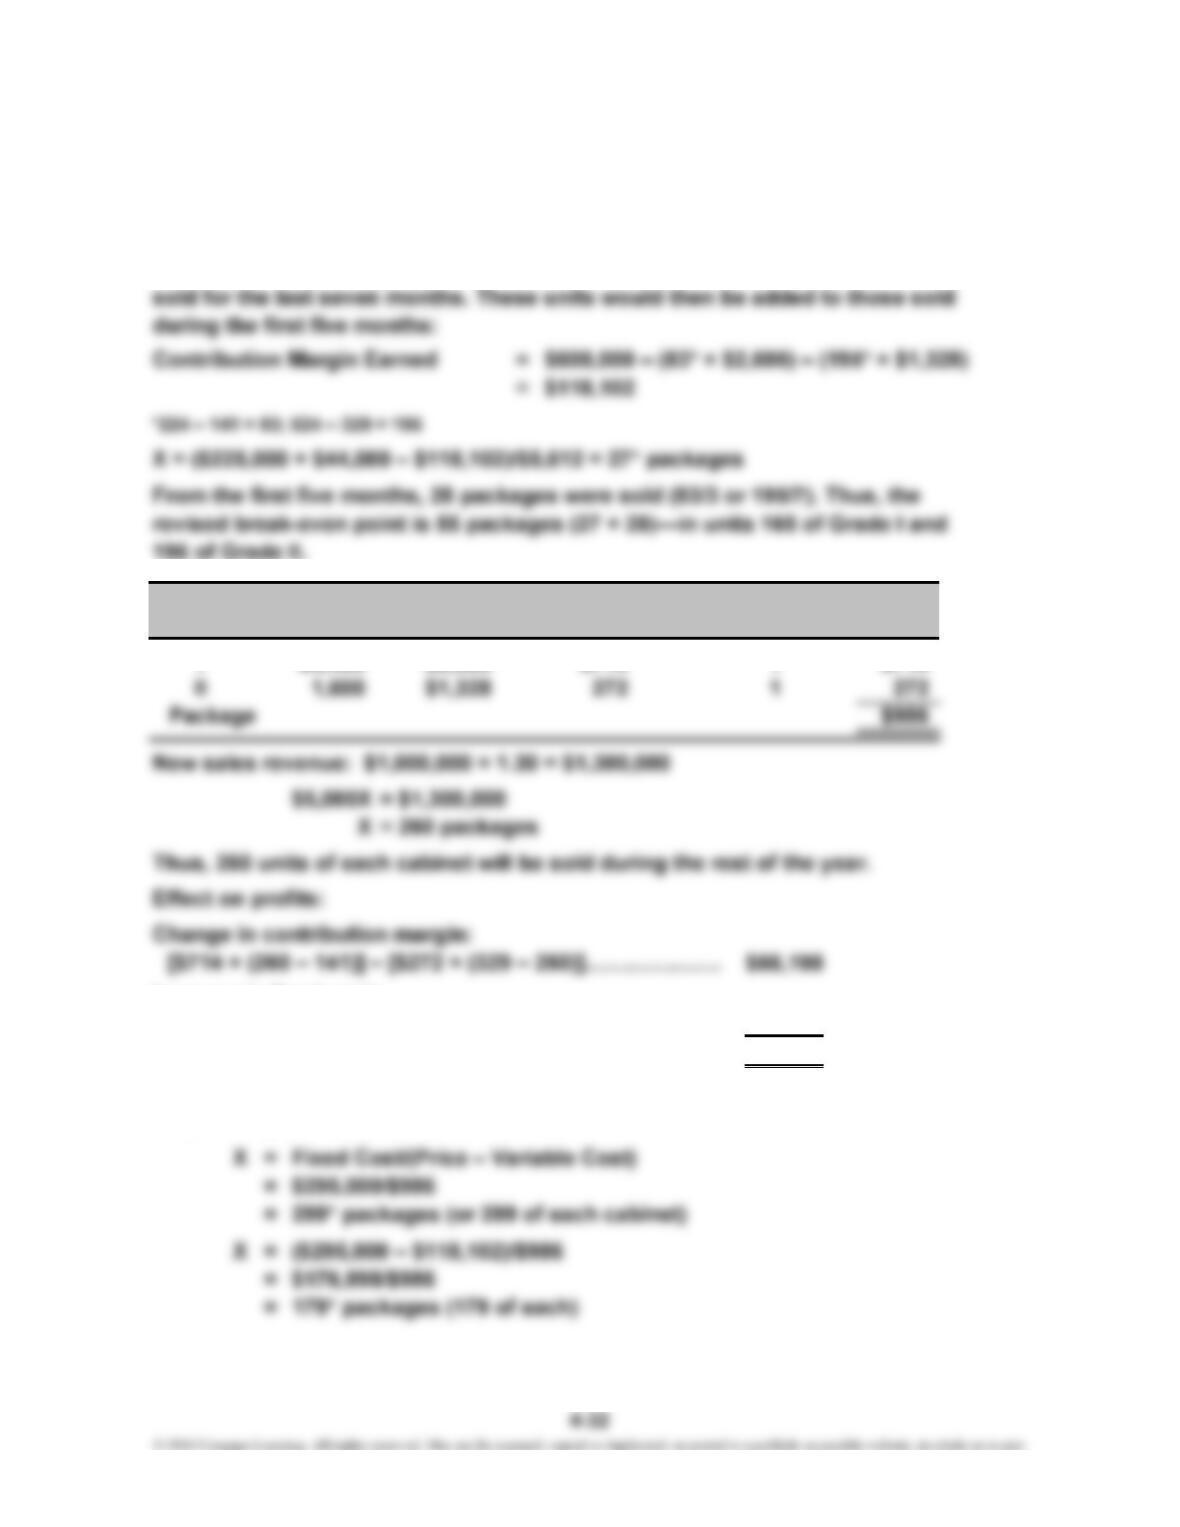
Case 4-54 (Continued)
If the new break-even point is interpreted as a revised break-even point for the
current year, then total fixed cost must be reduced by the contribution margin
already earned (through the first five months) to obtain the units that must be
4. Variable Sales Total
Product Price
–
Cost = × Mix = CM
I $3,400 $2,686 $714 1 $714
…
Increase in fixed costs:
$70,000 × (7/12)………………………………………………
…
40,833
Increase in operating income………………………………
…
$25,365
The break-even point (for the current year and the remaining 7 months,
respectively) is computed as follows:
Contribution
Margin
*
CHAPTER 4 Cost-Volume-Profit Analysis: A Managerial Planning Tool
Case 4-54 (Concluded)
To this, add the units already sold, yielding the revised break-even point:
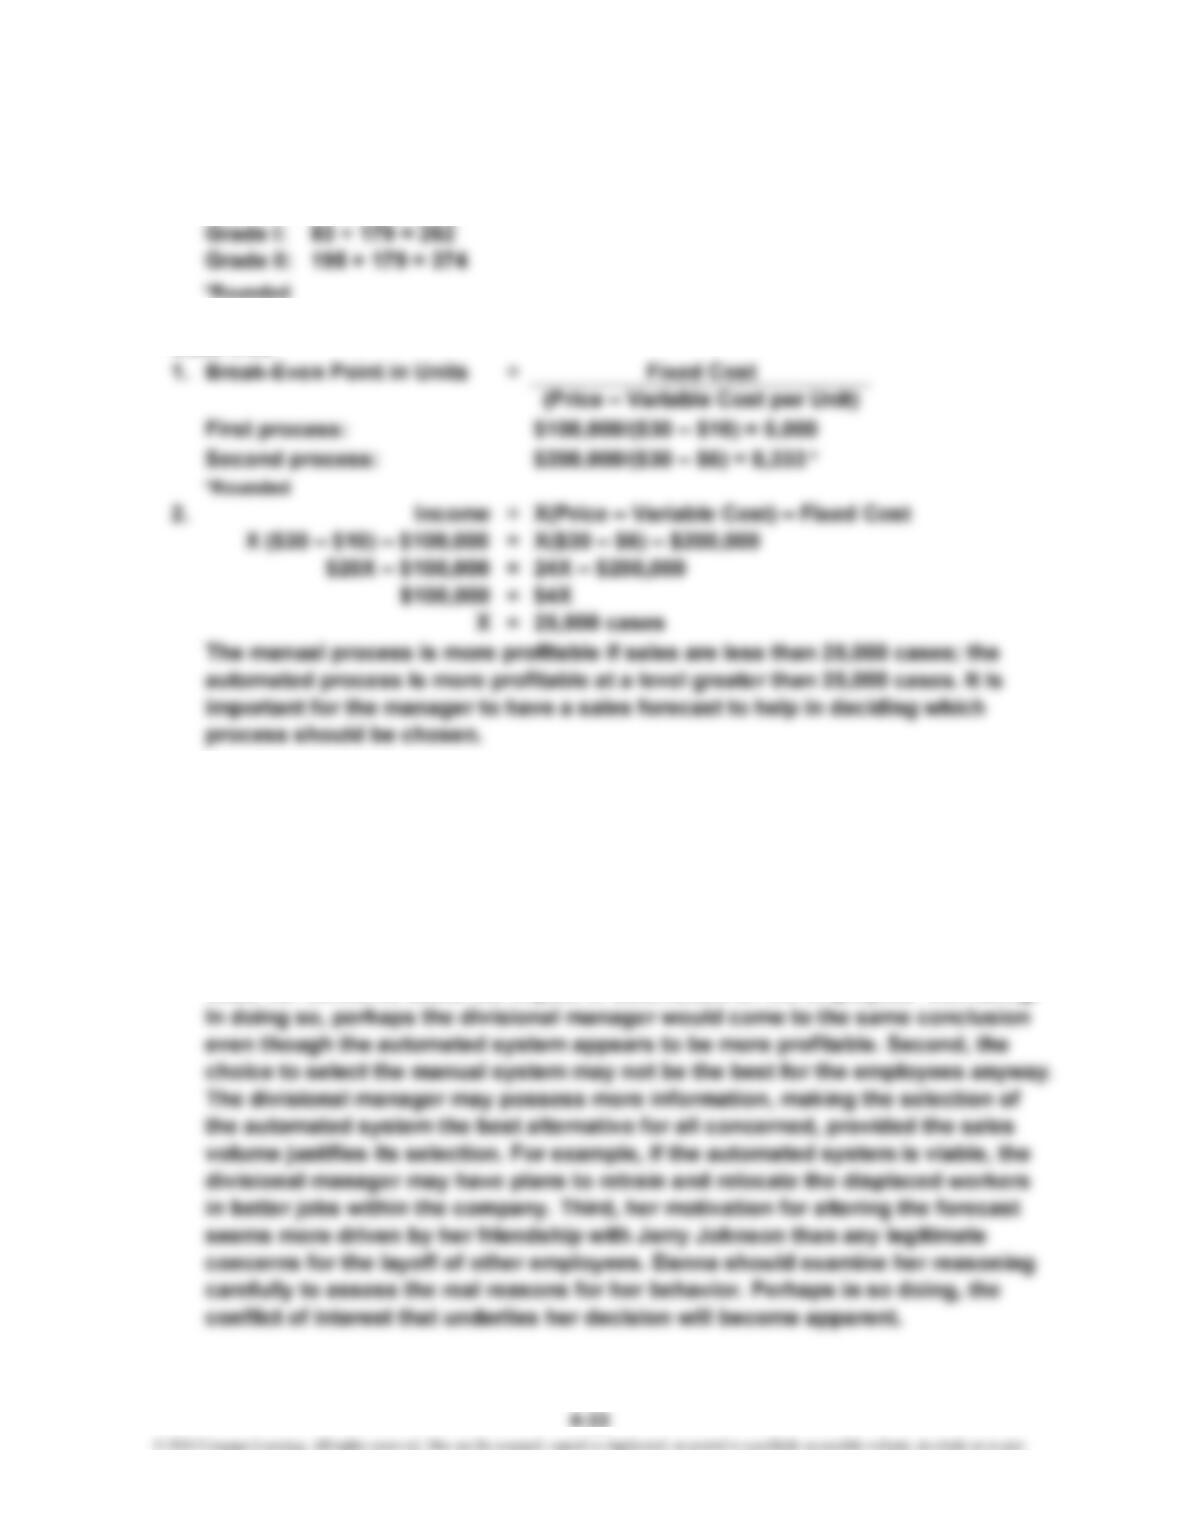
Case 4-55
3. The right to decide which process should be chosen belongs to the divisional
manager. Danna has an ethical obligation to report the correct information to her
superior. By altering the sales forecast, Danna unfairly and unethically influenced
the decision-making process. Managers certainly have a moral obligation to
assess the impact of their decisions on employees, and every effort should be
taken to be fair and honest with employees. Danna’s behavior, however, is not
justified by the fact that it helped a number of employees retain their employment.
First, Danna had no right to make that decision. Danna certainly has the right to
voice her concerns about the impact of automation on the employees’ well-being.