1. CVP analysis allows managers to focus on selling prices, volume, costs, profits, and
sales mix. Many different “what-if” questions can be asked to assess the effect of
changes in key variables on profits.
4.
A
t the break-even point, all fixed costs are covered. Above the break-even point, only
variable costs need to be covered. Thus, contribution margin per unit is profit per unit,
provided that the unit selling price is greater than the unit variable cost (which it must be
for breakeven to be achieved).
5. Variable Cost Ratio = Variable Cost per Unit/Price
8. Packages of products, based on the expected sales mix, are defined as a single product.
Selling price and cost information for this package can then be used to carry out CVP
analysis.
9. This statement is wrong; break-even analysis can be easily adjusted to focus on targeted
profit.
A
4COST-VOLUME-PROFIT ANALYSIS:
A MANAGERIAL PLANNING TOOL
DISCUSSION QUESTIONS
4-1
CHAPTER 4 Cost-Volume-Profit Analysis: A Managerial Planning Tool
12. Margin of safety is the sales activity in excess of that needed to break even. The higher the
margin of safety, the lower the risk.
15.
A
declining margin of safety means that sales are moving closer to the break-even point.
Profit is going down, and the possibility of loss is greater. Managers should analyze the
reasons for the decreasing margin of safety and look for ways to increase revenue and/or
decrease costs.
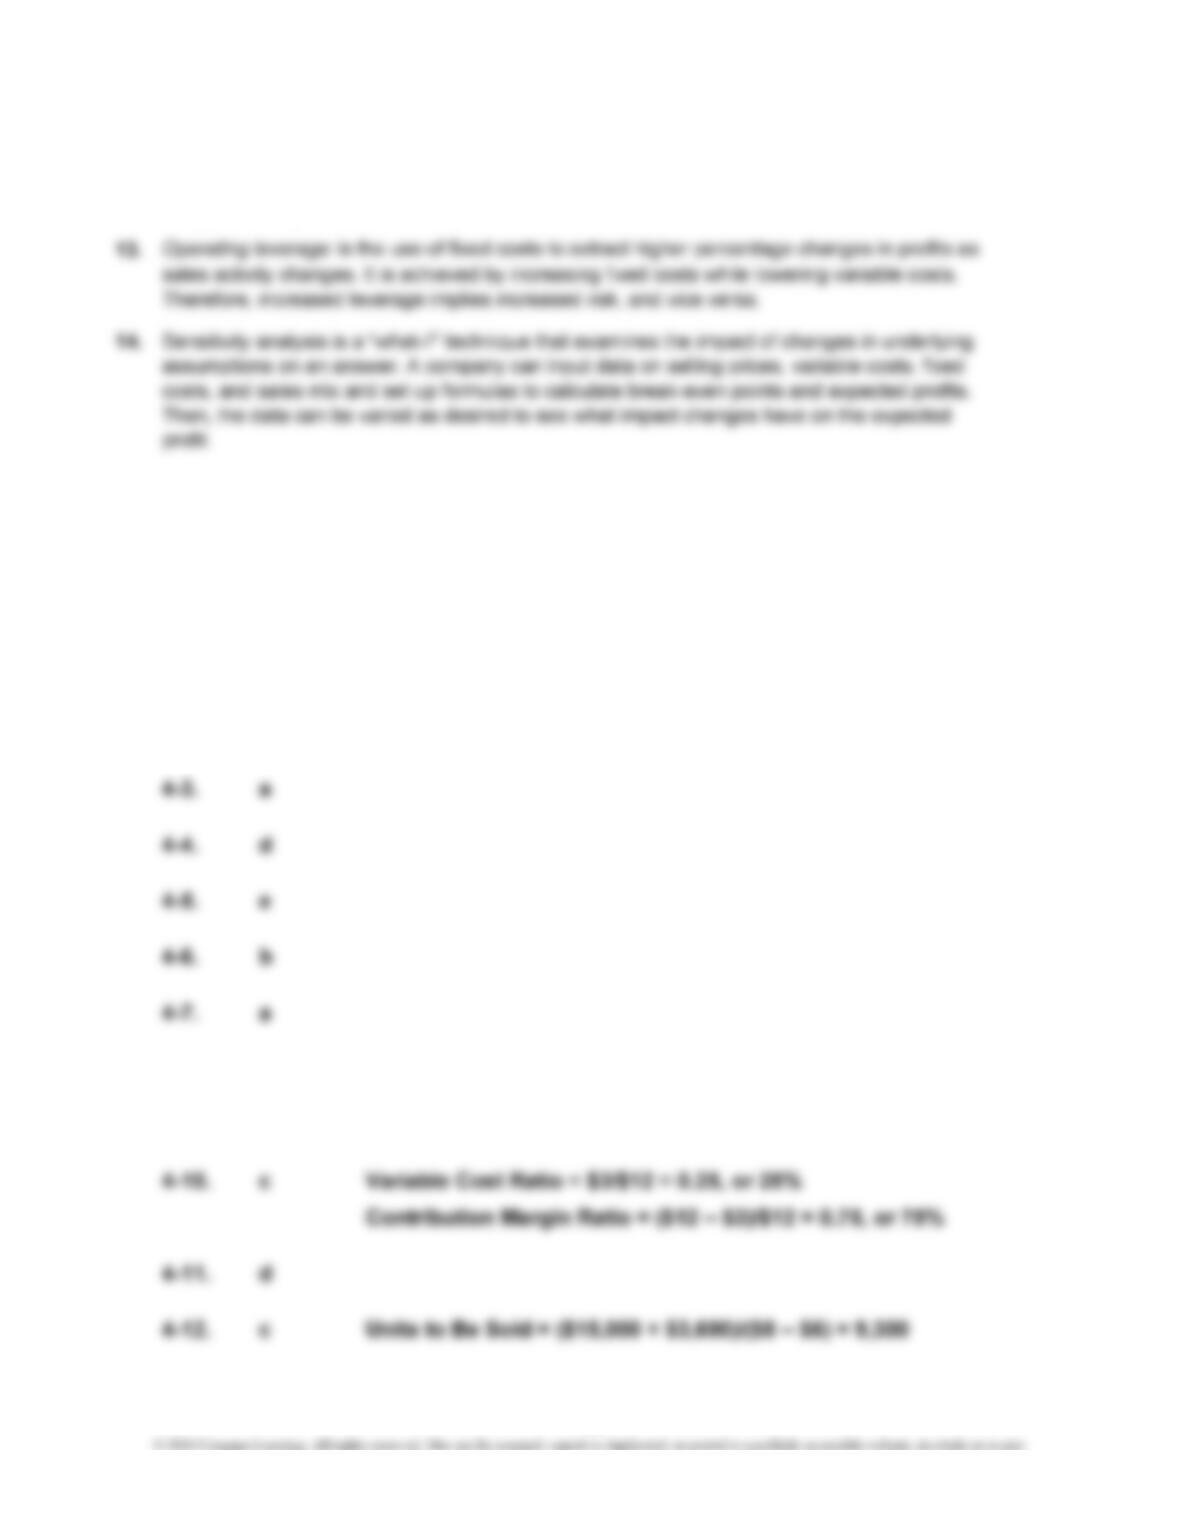
4-1. b
4-2. d
4-8. d
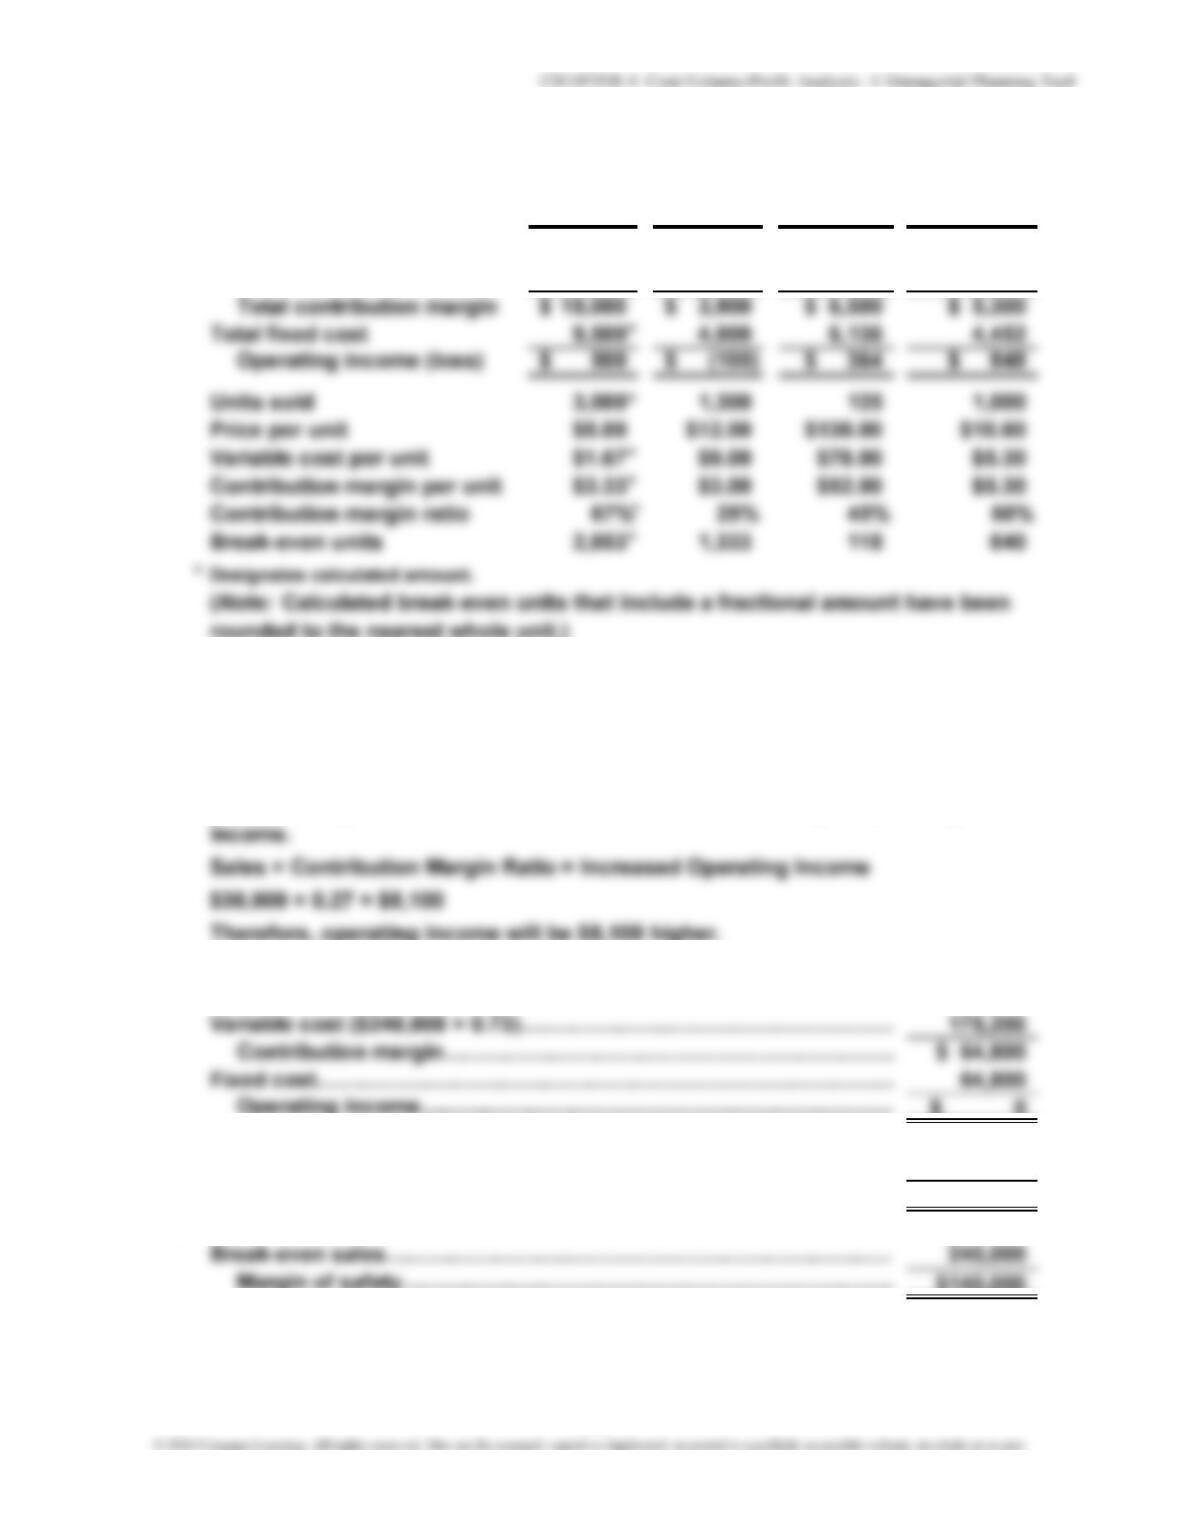
4-9. d Break-Even Units = $7,200/($12 – $3) = 800
MULTIPLE-CHOICE QUESTIONS
4-2
CHAPTER 4 Cost-Volume-Profit Analysis: A Managerial Planning Tool
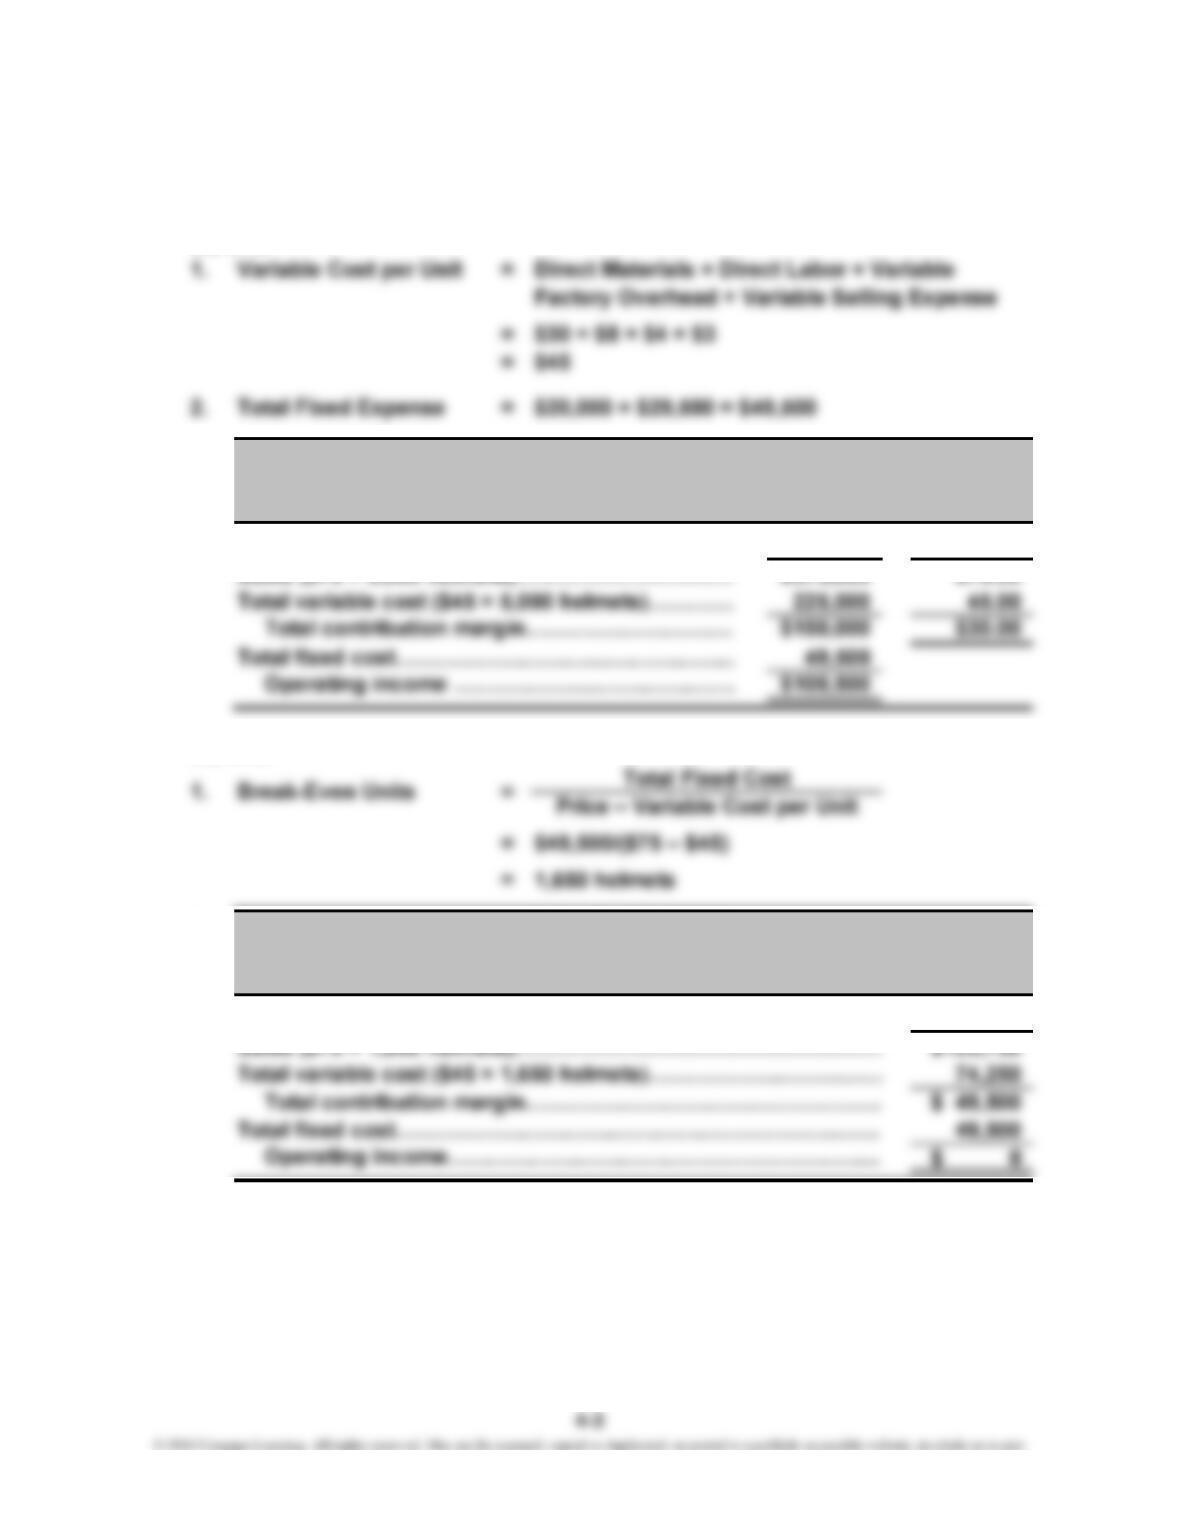
CE 4-13
3.
Total Per Unit
Sales ($75 × 5,000 helmets)…………………………
…
$375,000 $75.00
CE 4-14
2.
Total
A
t Break-Even Poin
t
For the Coming Year
Head-First Company
CORNERSTONE EXERCISES
Contribution Margin Income Statement
Head-First Company
Contribution Margin Income Statement
CHAPTER 4 Cost-Volume-Profit Analysis: A Managerial Planning Tool
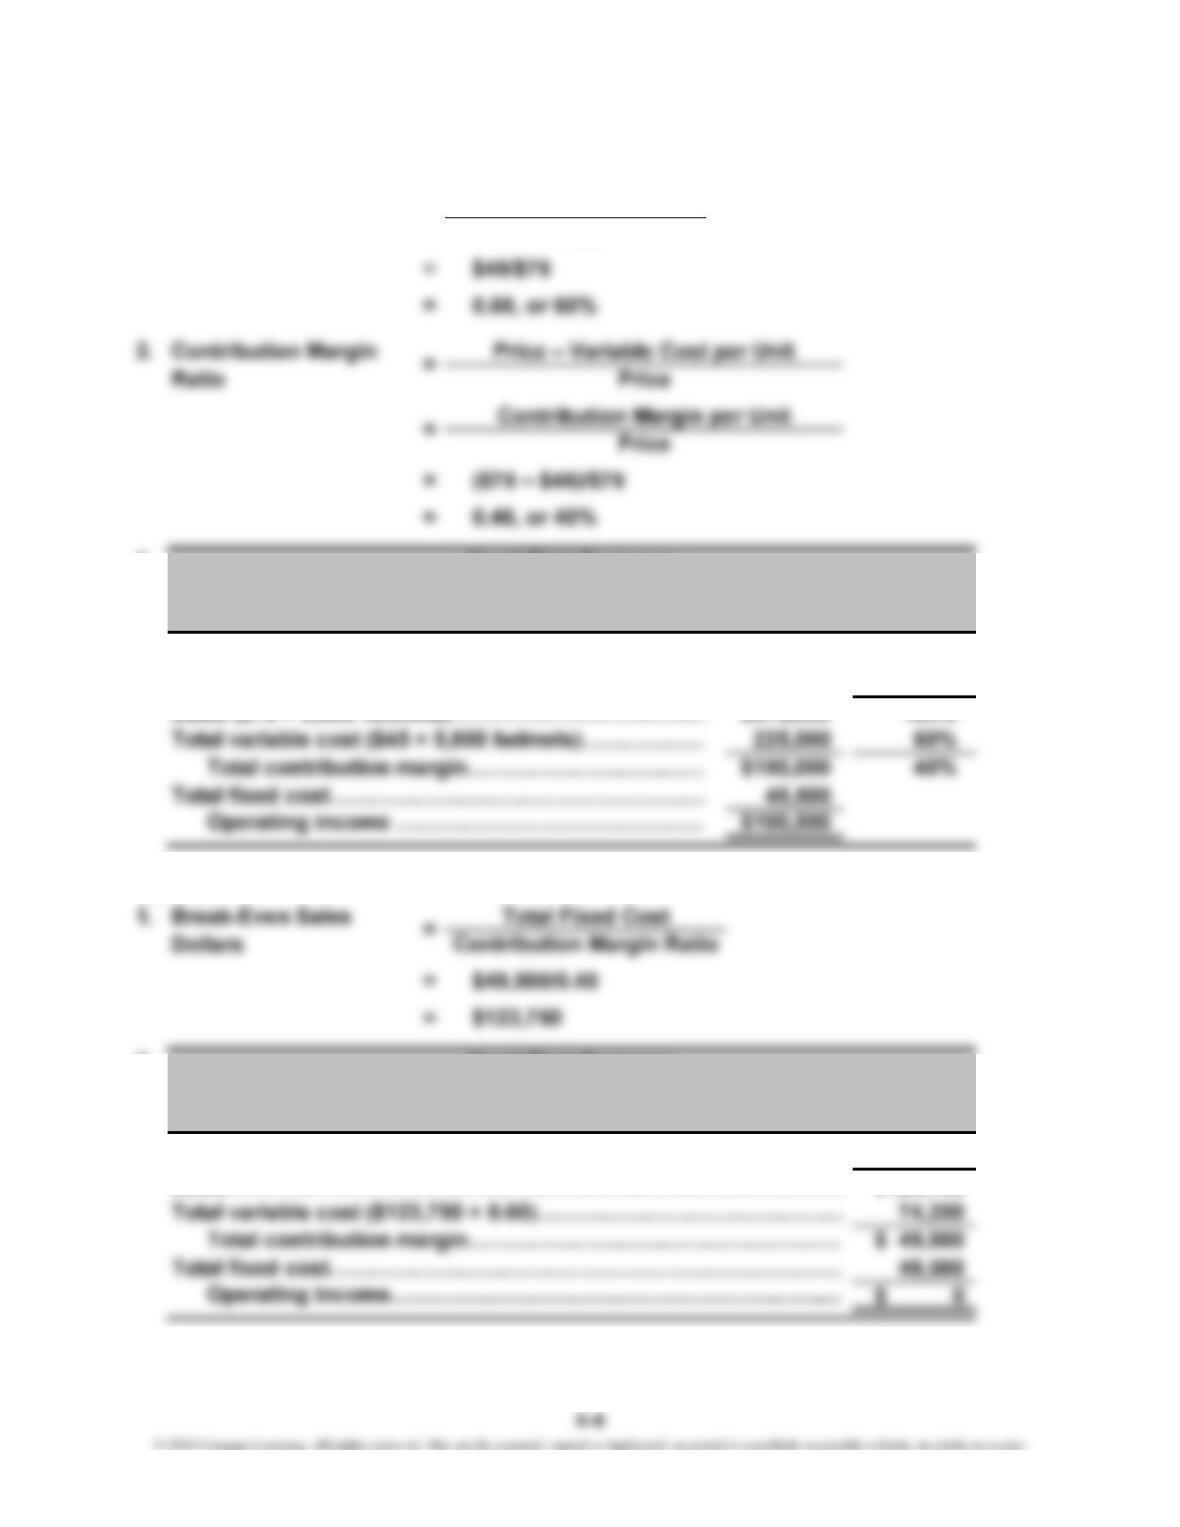
CE 4-15
3.
Percent
of Sales
Sales ($75 × 5,000 helmets)……………………………
…
$375,000 100%
CE 4-16
2.
Total
Sales…………………………………………………………………………
…
$123,750
Variable Cost Ratio1. = Variable Cost per Unit
Price
At Break-Even Poin
t
For the Coming Year
Head-First Company
Contribution Margin Income Statement
Head-First Company
Contribution Margin Income Statement
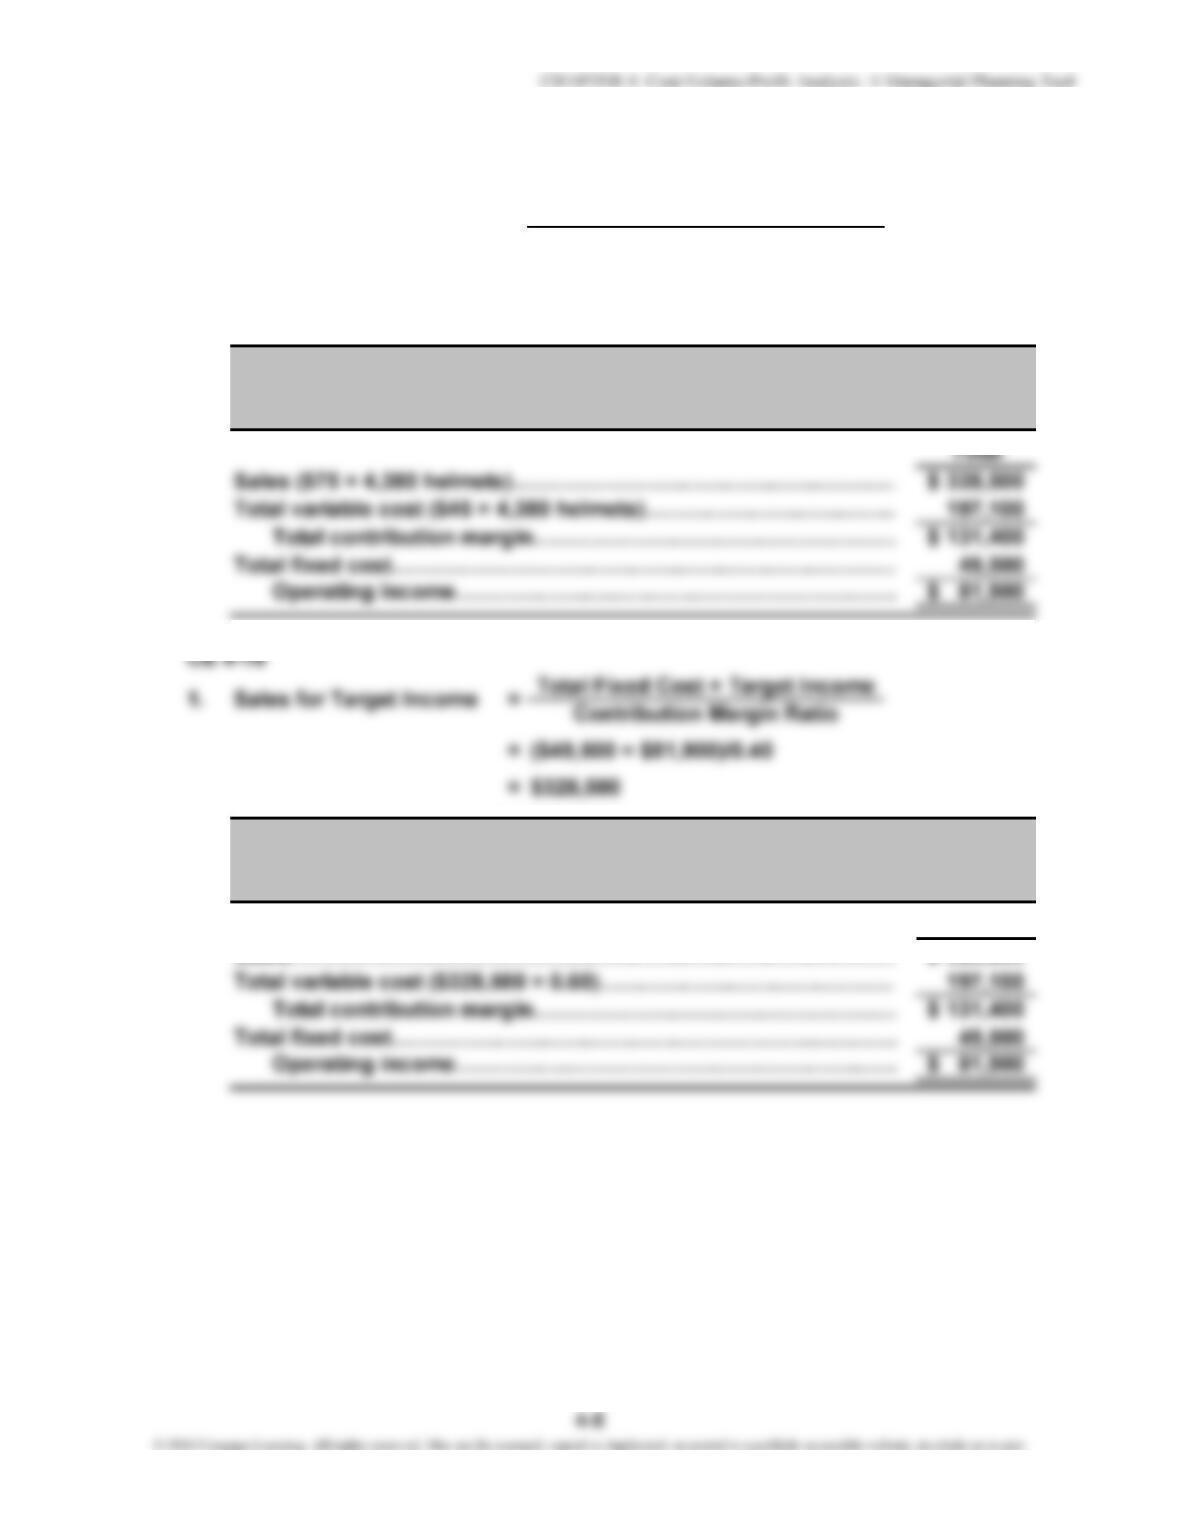
CE 4-17
= ($49,500 + $81,900)/($75 – $45)
= 4,380 helmets
2.
…
2.
Total
Sales…………………………………………………………………………
…
328,500$
Break-Even Units
A
t 4,380 Helmets Sold
Head-First Company
Contribution Margin Income Statement
1.
Contribution Margin Income Statement
A
t 4,380 Helmets Sold
Total Fixed Cost + Target Income
Price – Variable Cost per Unit
Head-First Company
=
CHAPTER 4 Cost-Volume-Profit Analysis: A Managerial Planning Tool
CE 4-19
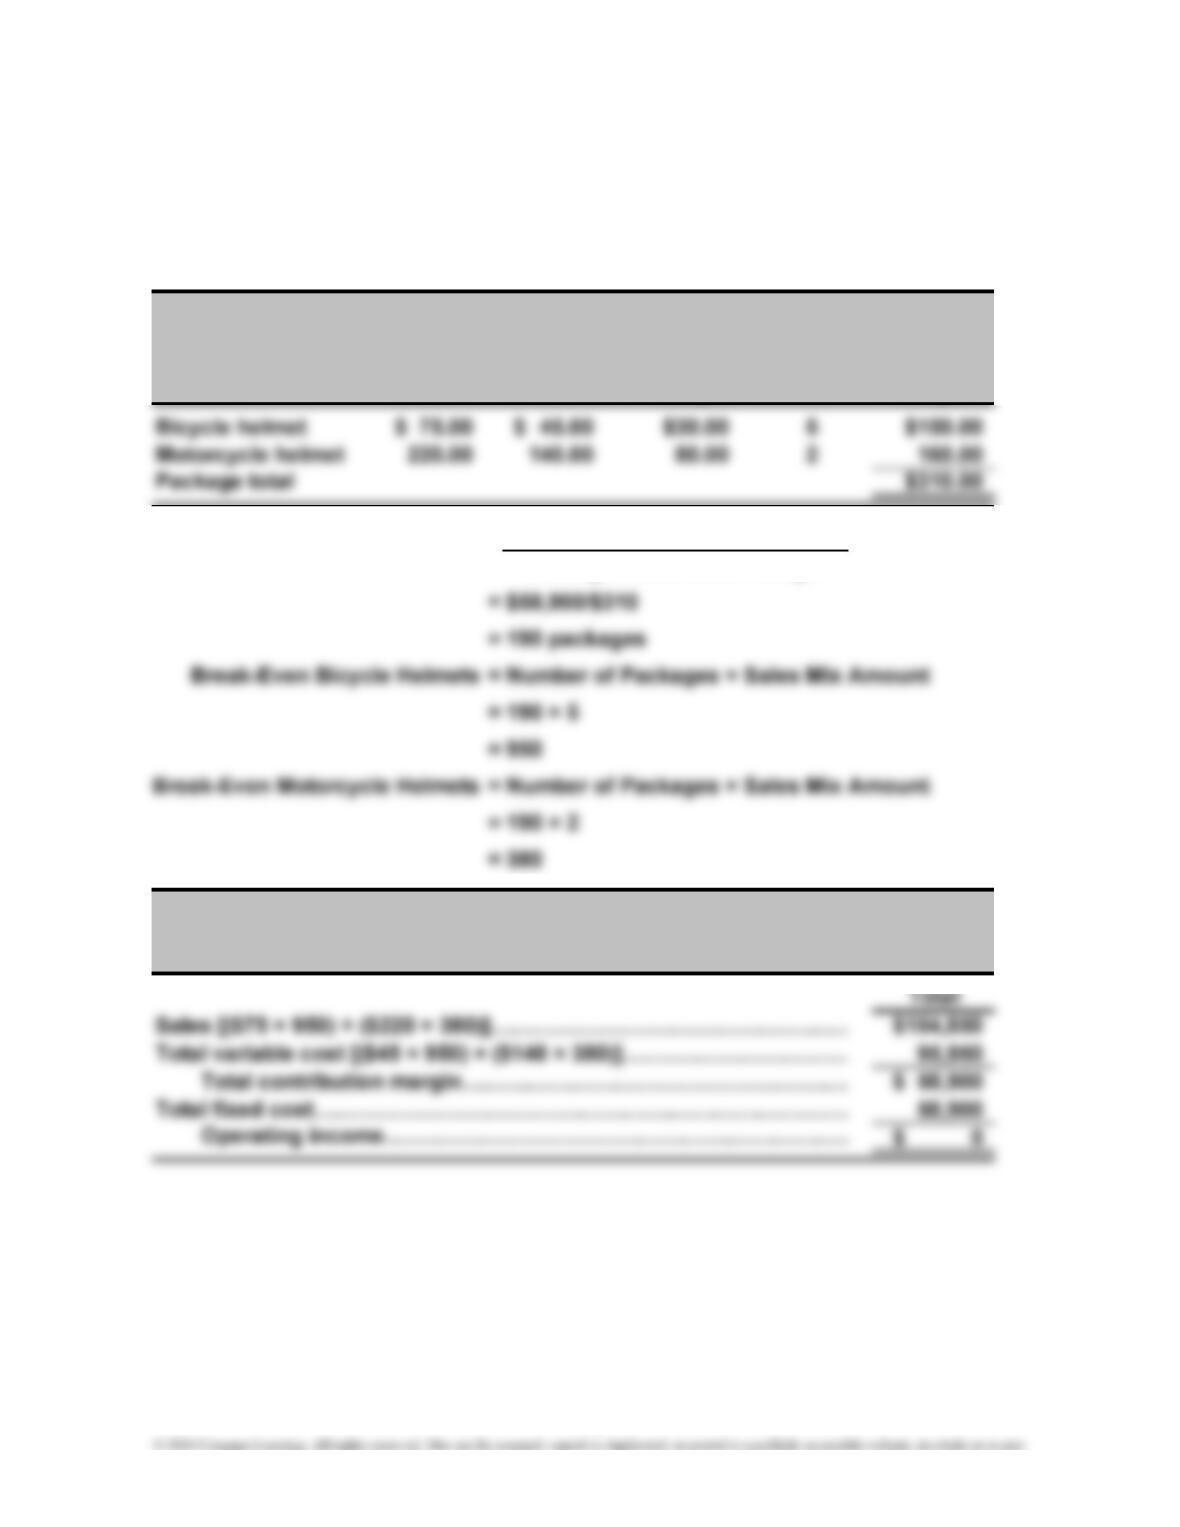
1. Any package with 5 bicycle helmets for every 2 motorcycle helmets is fine. For
example, 5:2, or 10:4, or 30:12. Throughout the rest of this exercise, we will use
5:2.
Package
Unit Unit Unit
Variable Contribution Sales Contribution
Product Price – Cost = Margin × Mix = Margin
Total Fixed Cost
3.
At Break-Even Poin
t
Head-First Company
Package Contribution Margin
Break-Even Packages =2.
Contribution Margin Income Statement
4-6
CHAPTER 4 Cost-Volume-Profit Analysis: A Managerial Planning Tool
CE 4-20
2.
Total
Sales…………………………………………………………………………
…
$184,466
CE 4-21
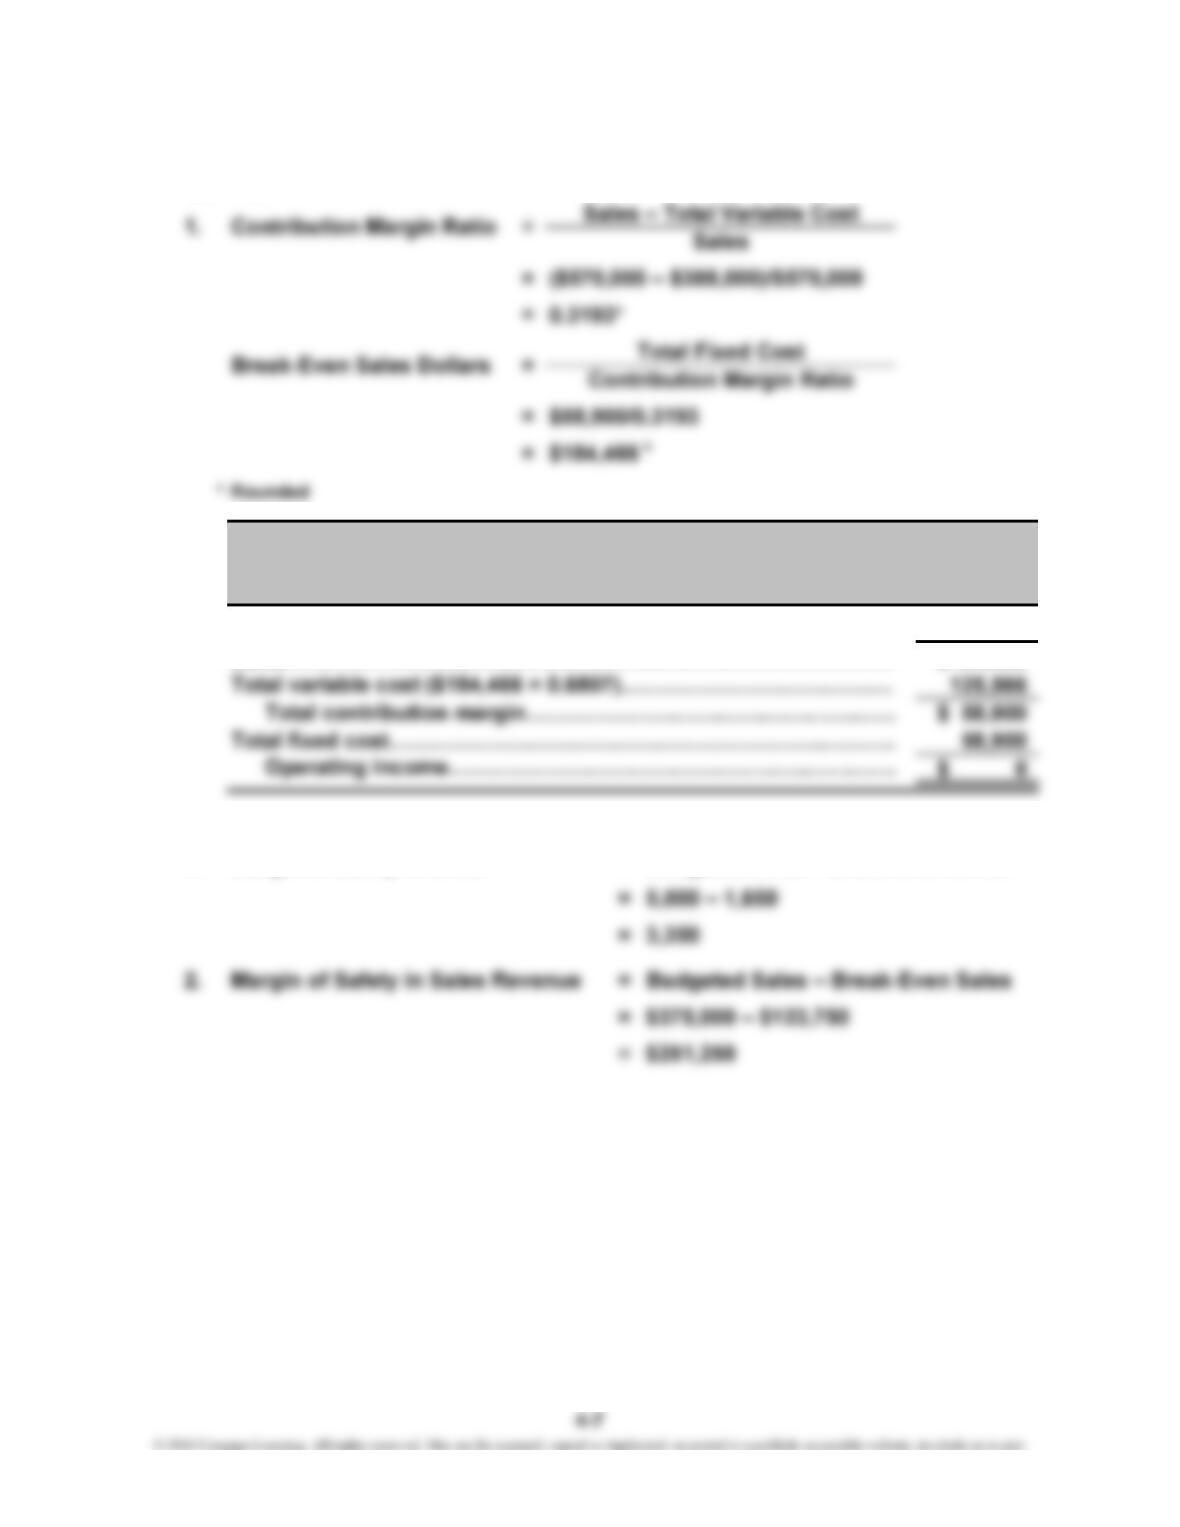
1. Margin of Safety in Units = Budgeted Units – Break-Even Units
Head-First Company
Contribution Margin Income Statement
A
t Break-Even Sales Dollars
CE 4-22
*Rounded
CE 4-23
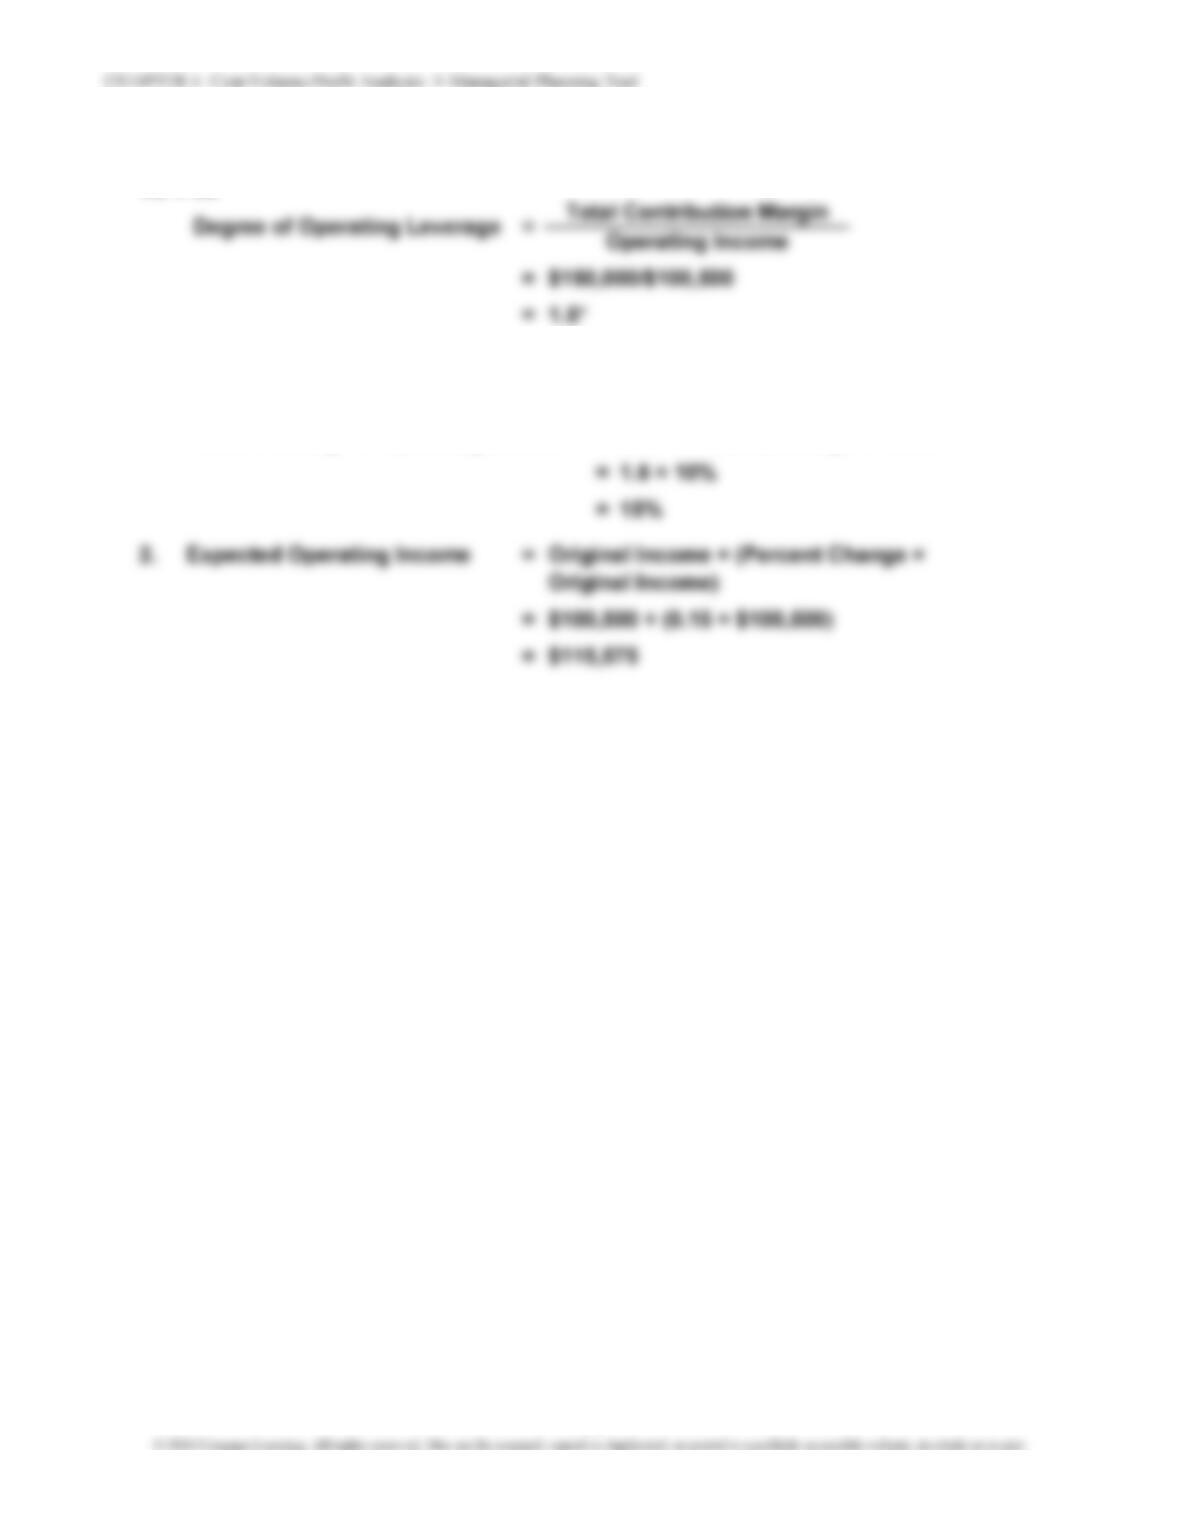
1. Percent Change in Operating Income = DOL × Percent Change in Sales
4-8
CHAPTER 4 Cost-Volume-Profit Analysis: A Managerial Planning Tool
E 4-24
1. Direct materials…………………………………….……………….……
…
$1.90
Direct labor………………………………………….……………….……
…
1.40
2. Contribution Margin Ratio = $13/$20 = 0.65, or 65%
Variable Cost Ratio = $7/$20 = 0.35, or 35%
…
Operating income…………………….……………….………………
…
$0
E 4-25
1. At breakeven:
2. Operating Income = (Price × Quantity) – (Variable Cost per Unit × Quantity) –
Fixed Cost
EXERCISES
CHAPTER 4 Cost-Volume-Profit Analysis: A Managerial Planning Tool
E 4-25 (Continued)
3. Total Contribution Margin = Actual Revenue × Contribution Margin Ratio
4. Break-Even Units = Total Fixed Cost/(Price – Variable Cost per Unit)
CHAPTER 4 Cost-Volume-Profit Analysis: A Managerial Planning Tool
E 4-26
1. Contribution Margin
Ratio
= $26,600/$95,000 = 0.28, or 28%
4. To increase operating income without increasing sales revenue, Pelley
would have to find a way to decrease variable cost (thus decreasing the
variable cost ratio and increasing the contribution margin ratio), decrease
fixed cost, or do a combination of both.
E 4-27
1. Sales ($16.00 × 26,800)………………..………………………..…… 428,800$
.
E 4-28
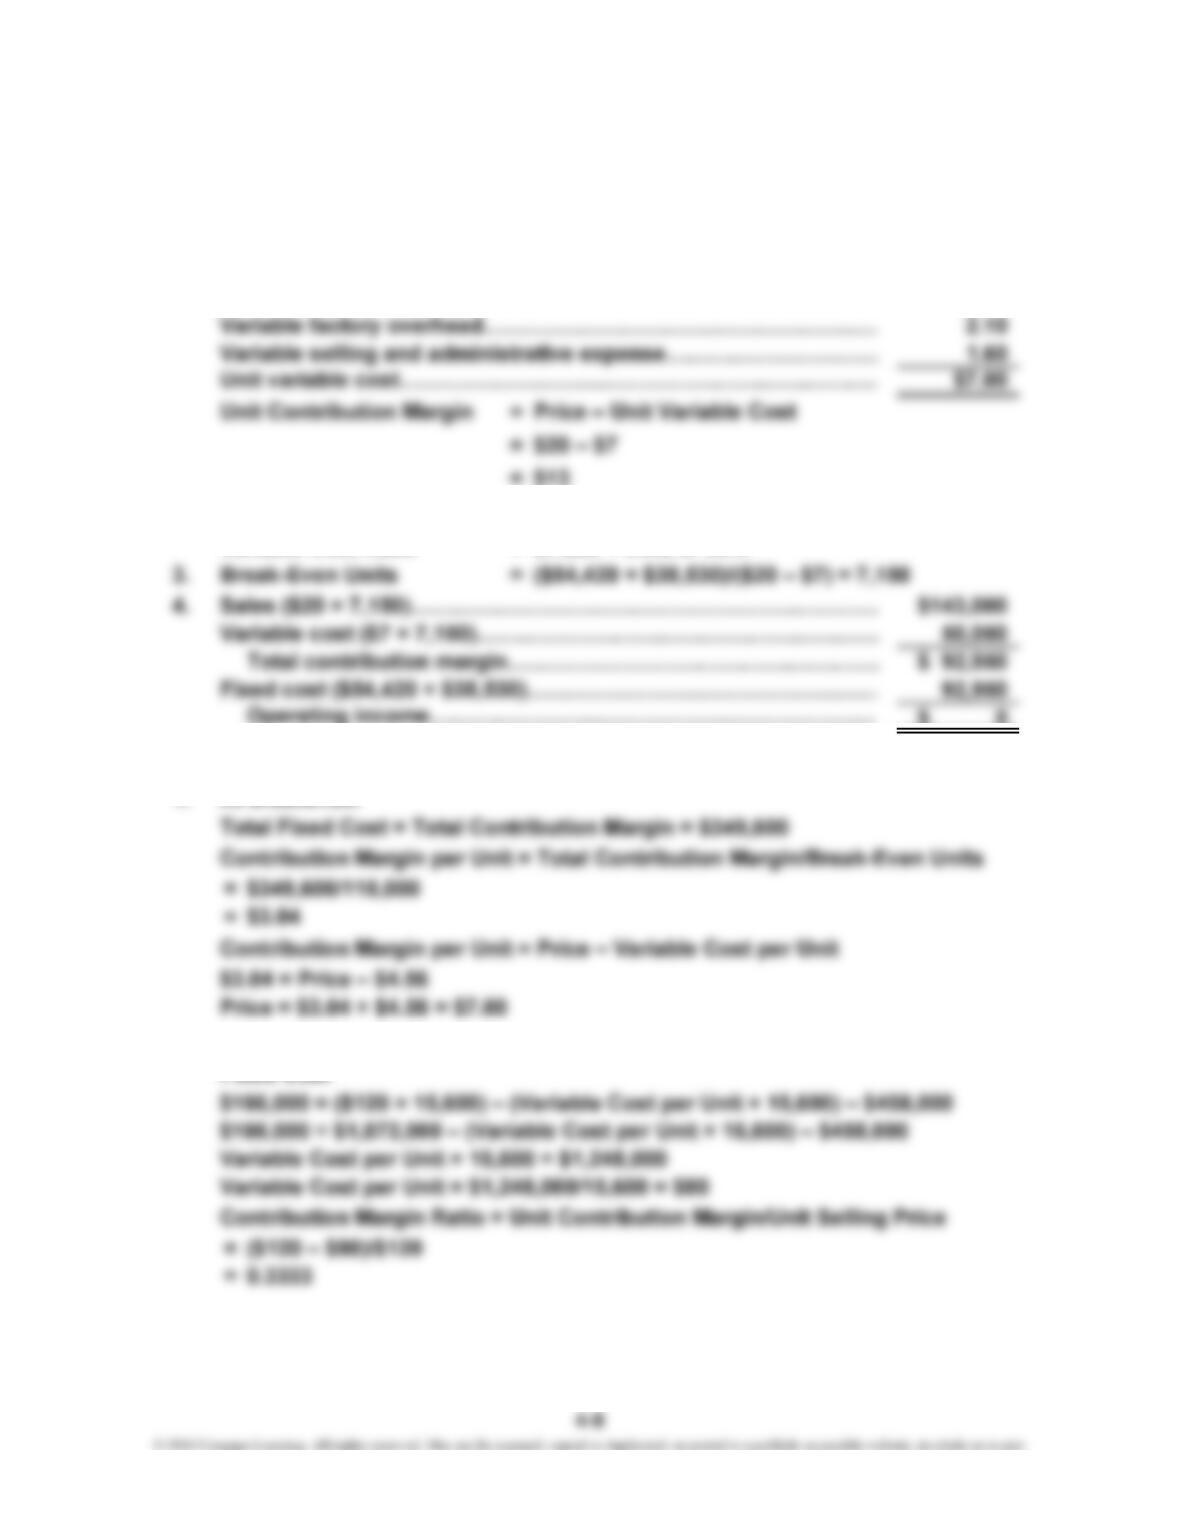
1. Break-Even Units = ($111,425 + $48,350)/($2.75 – $1.65)
= $159,775/$1.10
=
2. Unit variable cost includes all variable costs on a unit basis:
Direct materials…………………………………………………….…
…
$0.37
145,250
Contribution Margin
Sales
=
4-11
CHAPTER 4 Cost-Volume-Profit Analysis: A Managerial Planning Tool
E 4-28 (Continued)
Unit variable manufacturing cost includes the variable costs of production
on a unit basis:
=
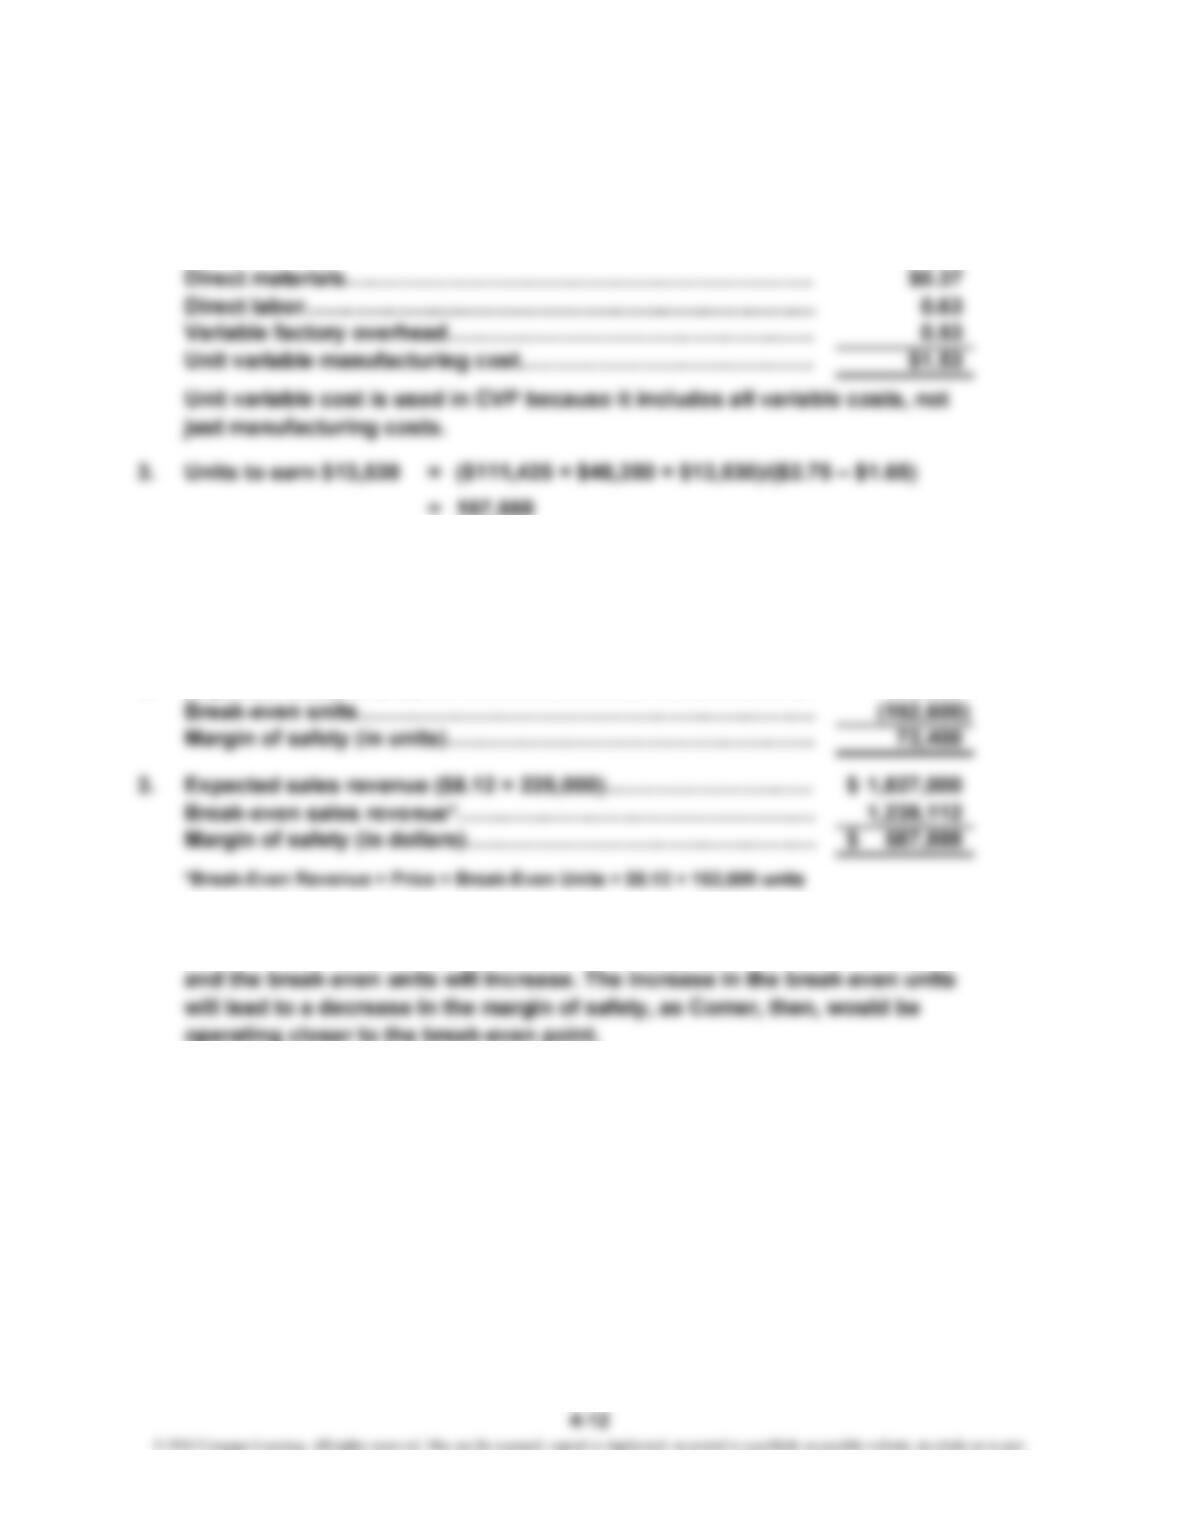
4. Sales revenue to earn $13,530 = 157,550 × $2.75 = $433,262.50
E 4-29
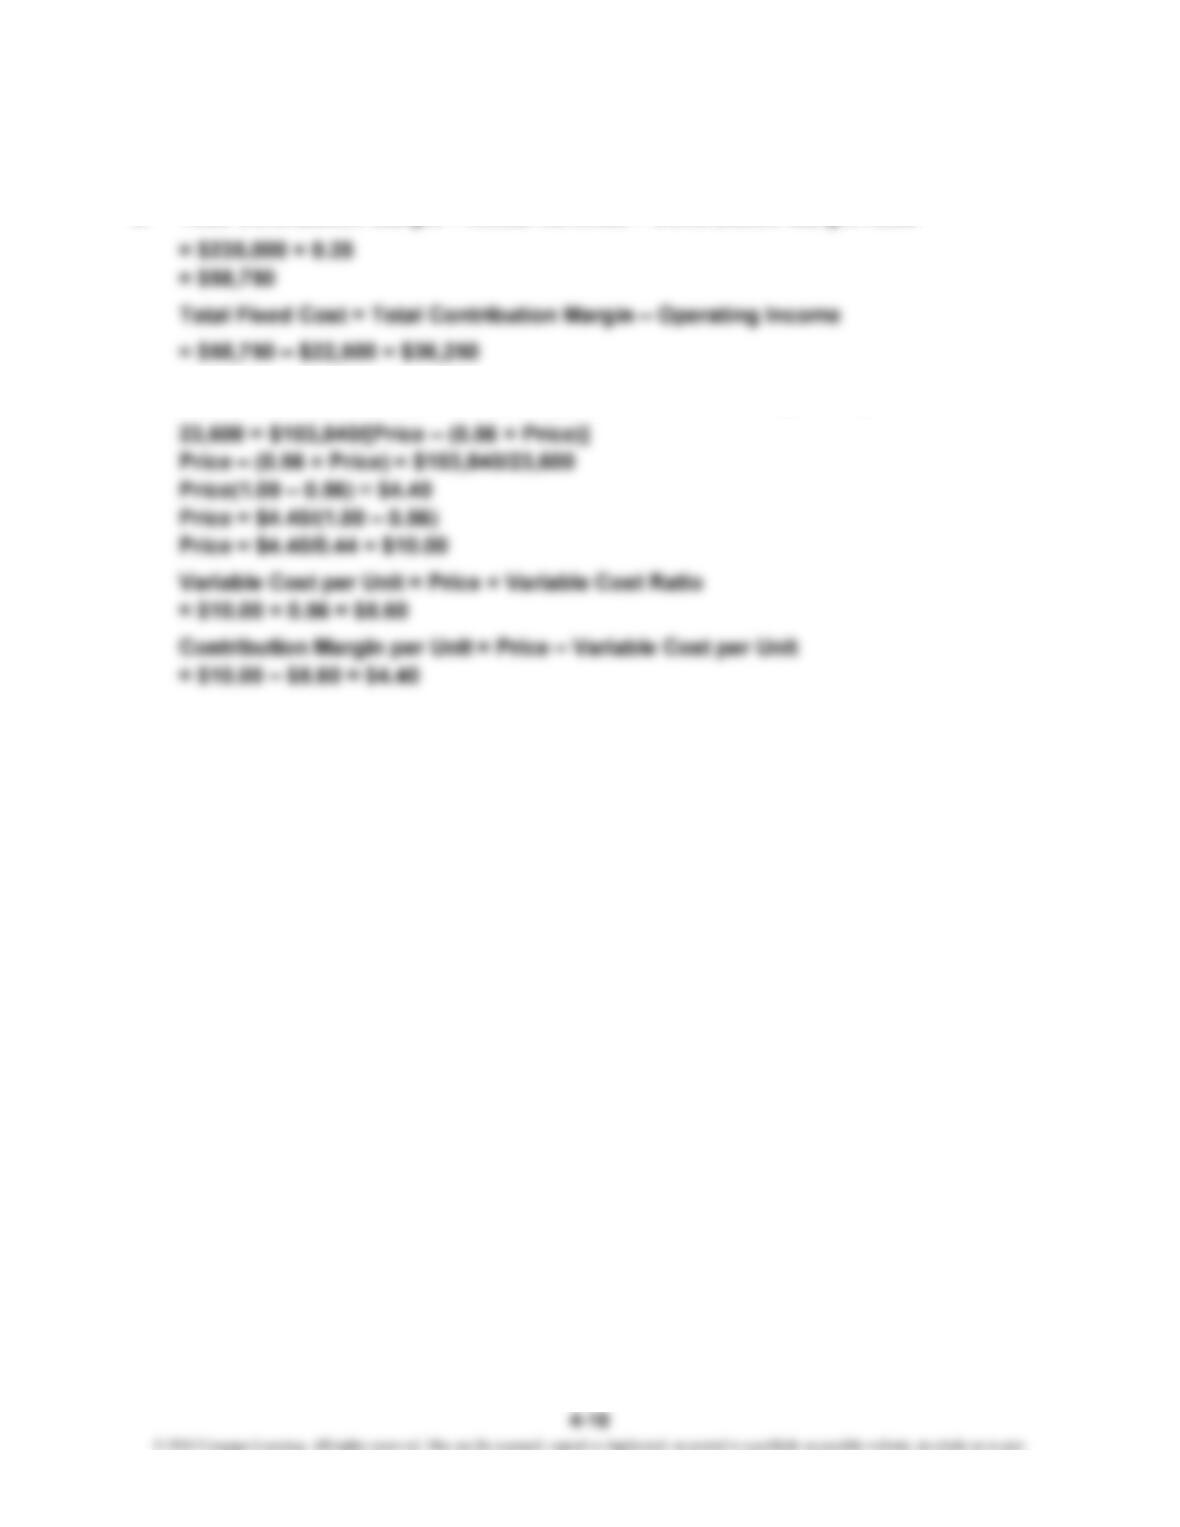
1. Break-Even Units = ($245,650 + $297,606)/($8.12 – $4.56) = 152,600
2. Expected sales in units……………………………………………..
…
225,000
4. If the price decreases, then the risk facing the company will go up. The
price decrease means that the contribution margin per unit will decrease
E 4-30
Laertes Ophelia Fortinbras Claudius
Sales 15,000$ 15,600$ $16,250 $10,600
Total variable cost 5,000 11,700 9,750 5,300
E 4-31
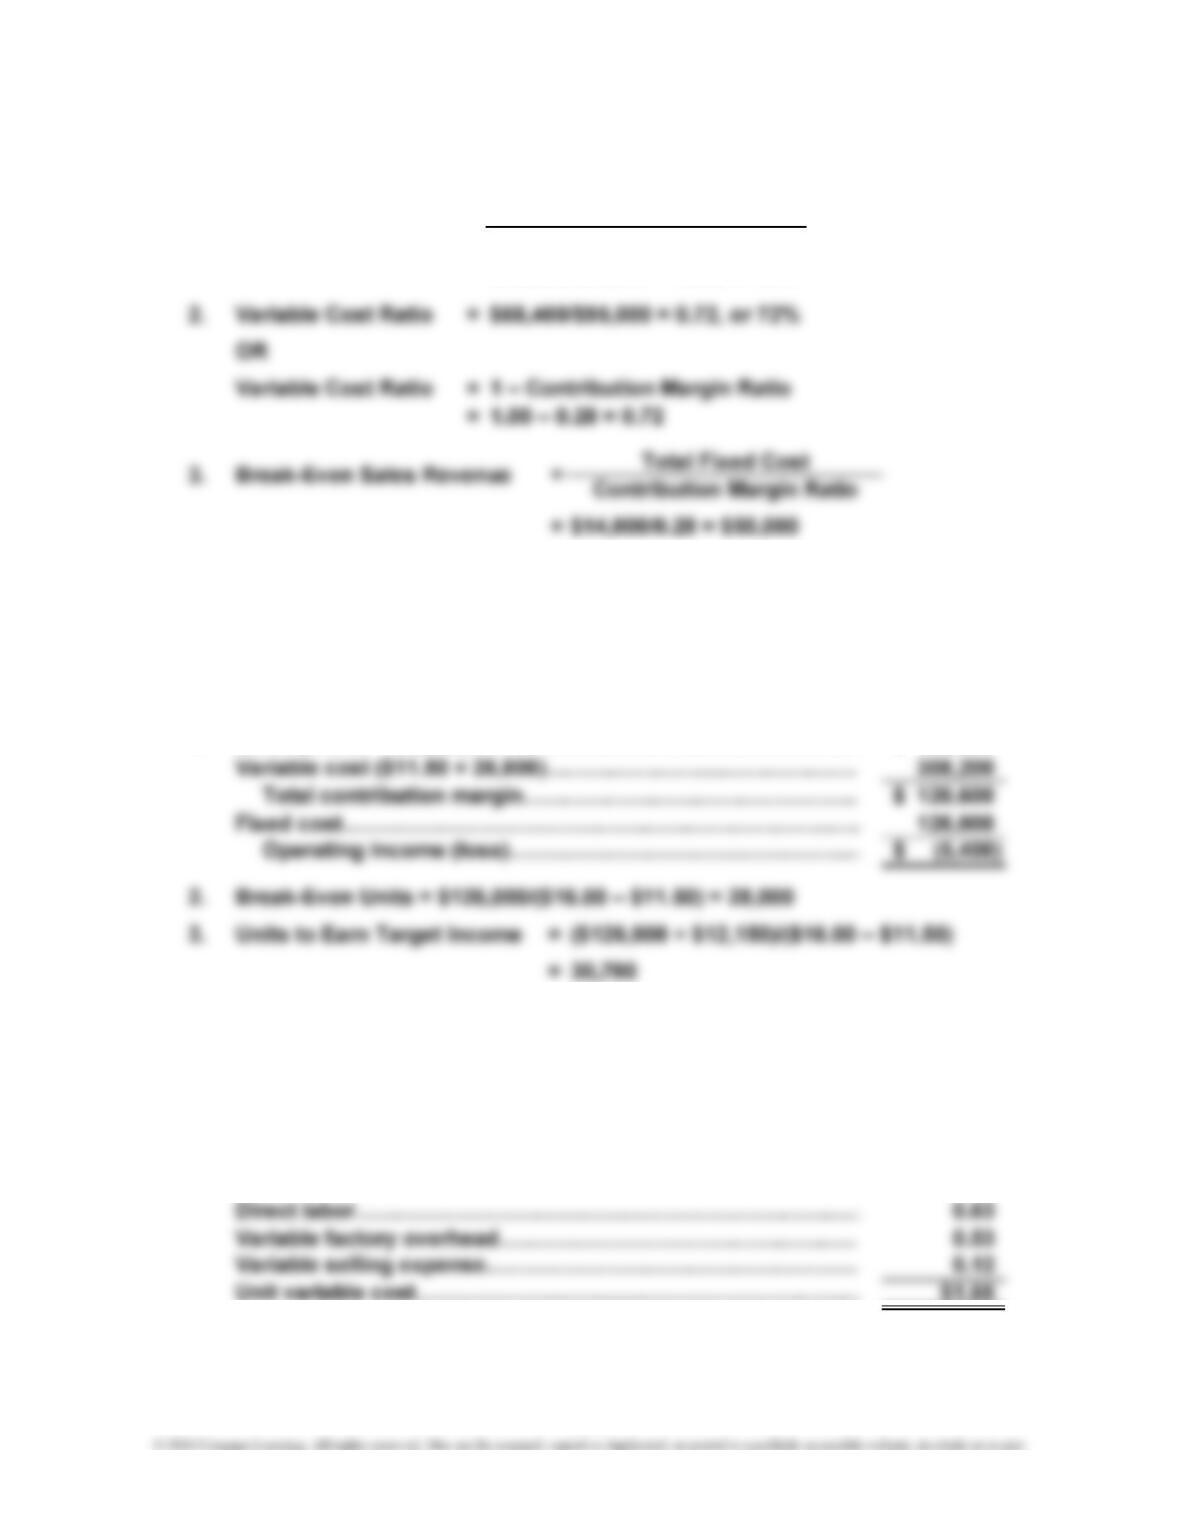
1. Variable Cost Ratio = $302,950/$415,000 = 0.73, or 73%
Contribution Margin Ratio = $112,050/$415,000 = 0.27, or 27%
2. Because all fixed costs are covered at breakeven, the contribution margin
portion of any revenue above breakeven contributes directly to operating
3. Break-Even Sales Revenue = $64,800/0.27 = $240,000
Sales……………………………………………………………………………
…
$240,000
4. Expected sales………………………………………………………………
…
$415,000
Break-even sales…………………………………….………………………
…
240,000
Margin of safety………………………..…………………………………
…
$175,000
5. Sales revenue………………..………………………………………………
…
$380,000
…
4-13
CHAPTER 4 Cost-Volume-Profit Analysis: A Managerial Planning Tool
E 4-32
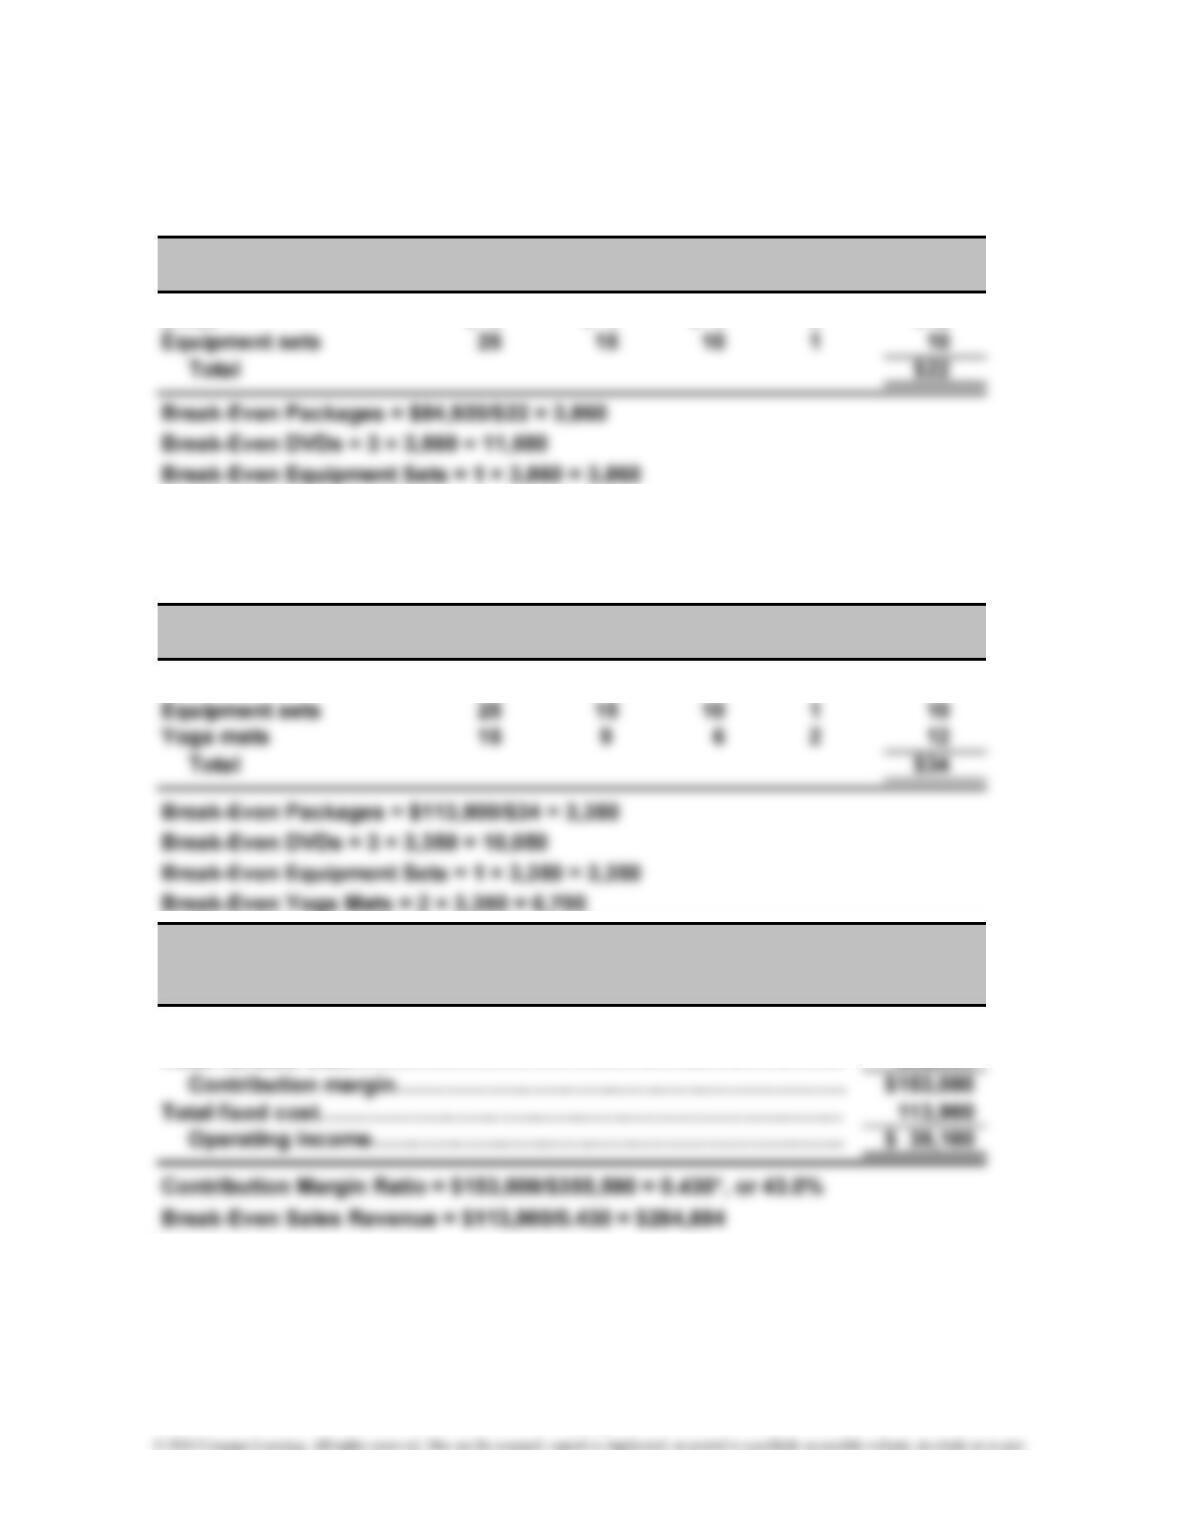
1. Sales mix is 3:1 (three times as many DVDs are sold as equipment sets).
2. Variable Sales Total
Product Price
–
Cost = CM × Mix = CM
DVDs $ 8 $ 4 $ 4 3 $12
E 4-33
1. Sales mix is 3:1:2 (three times as many DVDs will be sold as equipment sets,
and twice as many yoga mats will be sold as equipment sets).
2. Variable Sales Total
Product Price
–
Cost = CM × Mix = CM
DVDs $ 8 $ 4 $ 4 3 $12
3.
Sales……………………………………………………………………………
…
Total variable cost……………………………………………………………
*Rounded
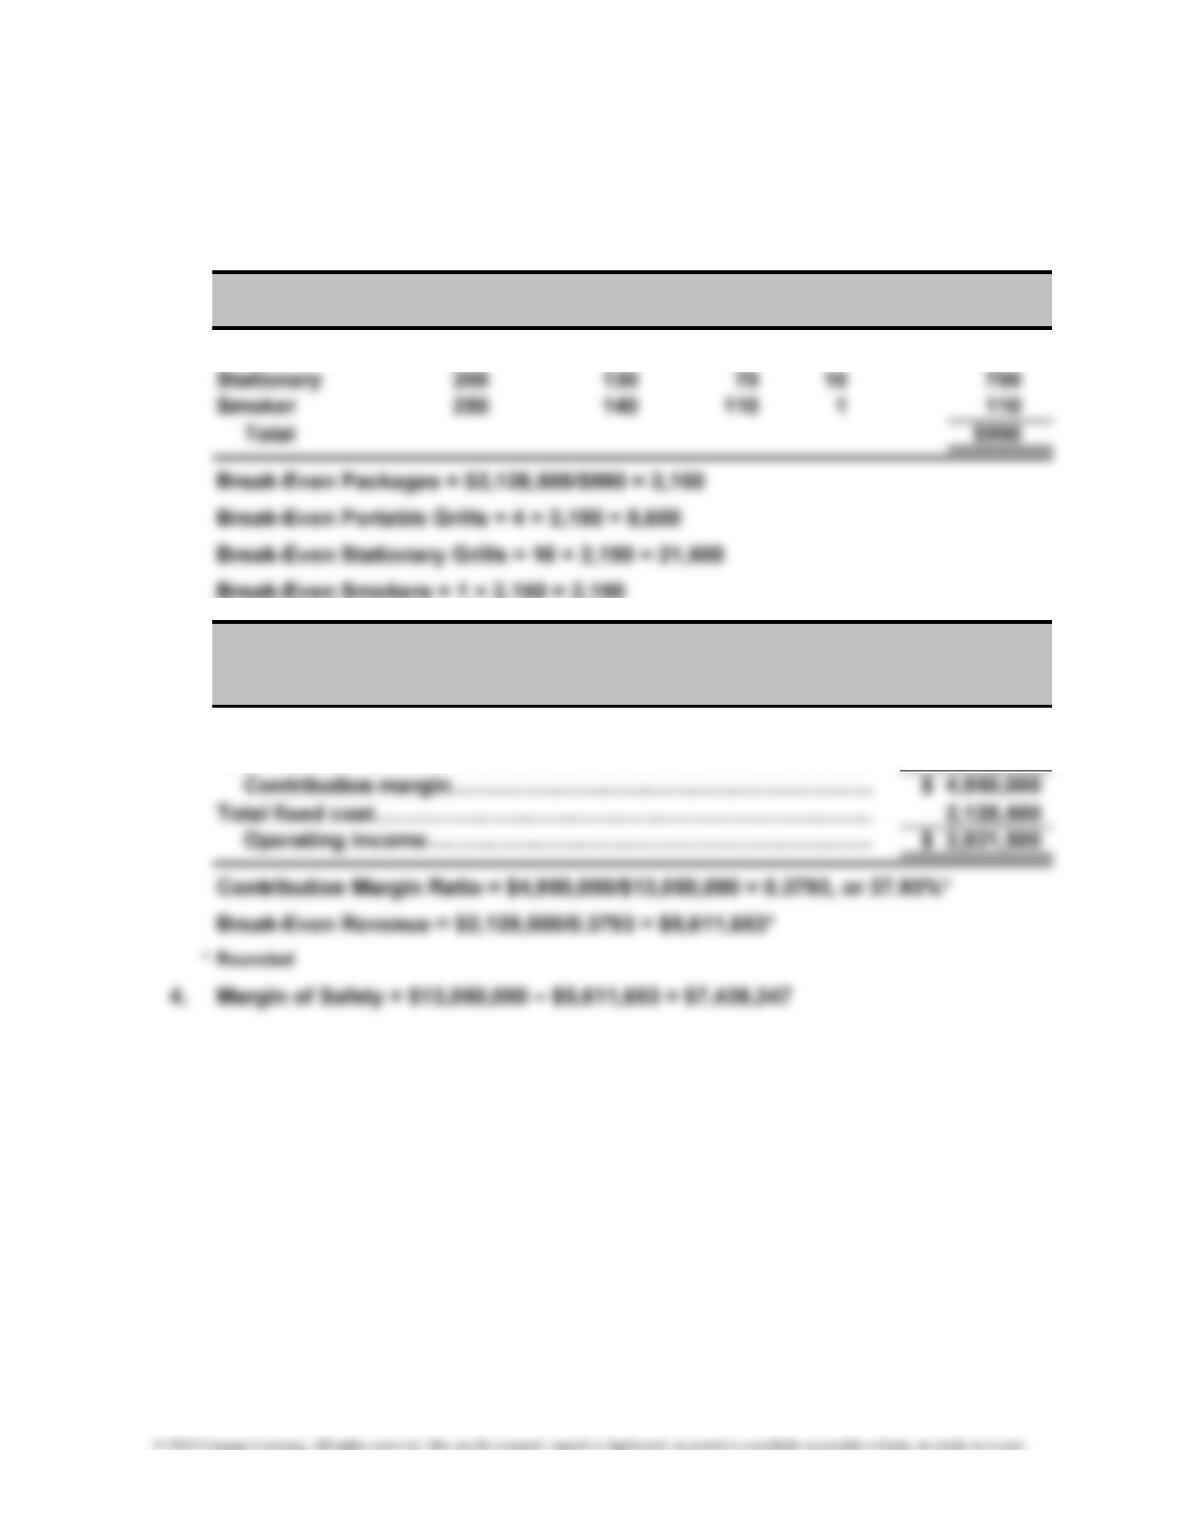
4. Margin of Safety = $355,500 – $264,884 = $90,616
Cherry Blossom Products Inc.
Income Statement
For the Coming Year
$355,500
202,500
4-14
CHAPTER 4 Cost-Volume-Profit Analysis: A Managerial Planning Tool
E 4-34
1. Sales mix is 4:10:1 (four times as many portable grills will be sold as smokers,
and 10 times as many stationary grills will be sold as smokers).
2. Variable Sales Total
Product Price
–
Cost = CM × Mix = CM
Portable $ 90 $ 45 $ 45 4 $180
3.
Sales………………………………………………………………………
…
Total variable cost………………………………………………………
…
Income Statement
For the Coming Year
Texas-Q Company
$13,050,000
8,100,000
4-15
CHAPTER 4 Cost-Volume-Profit Analysis: A Managerial Planning Tool
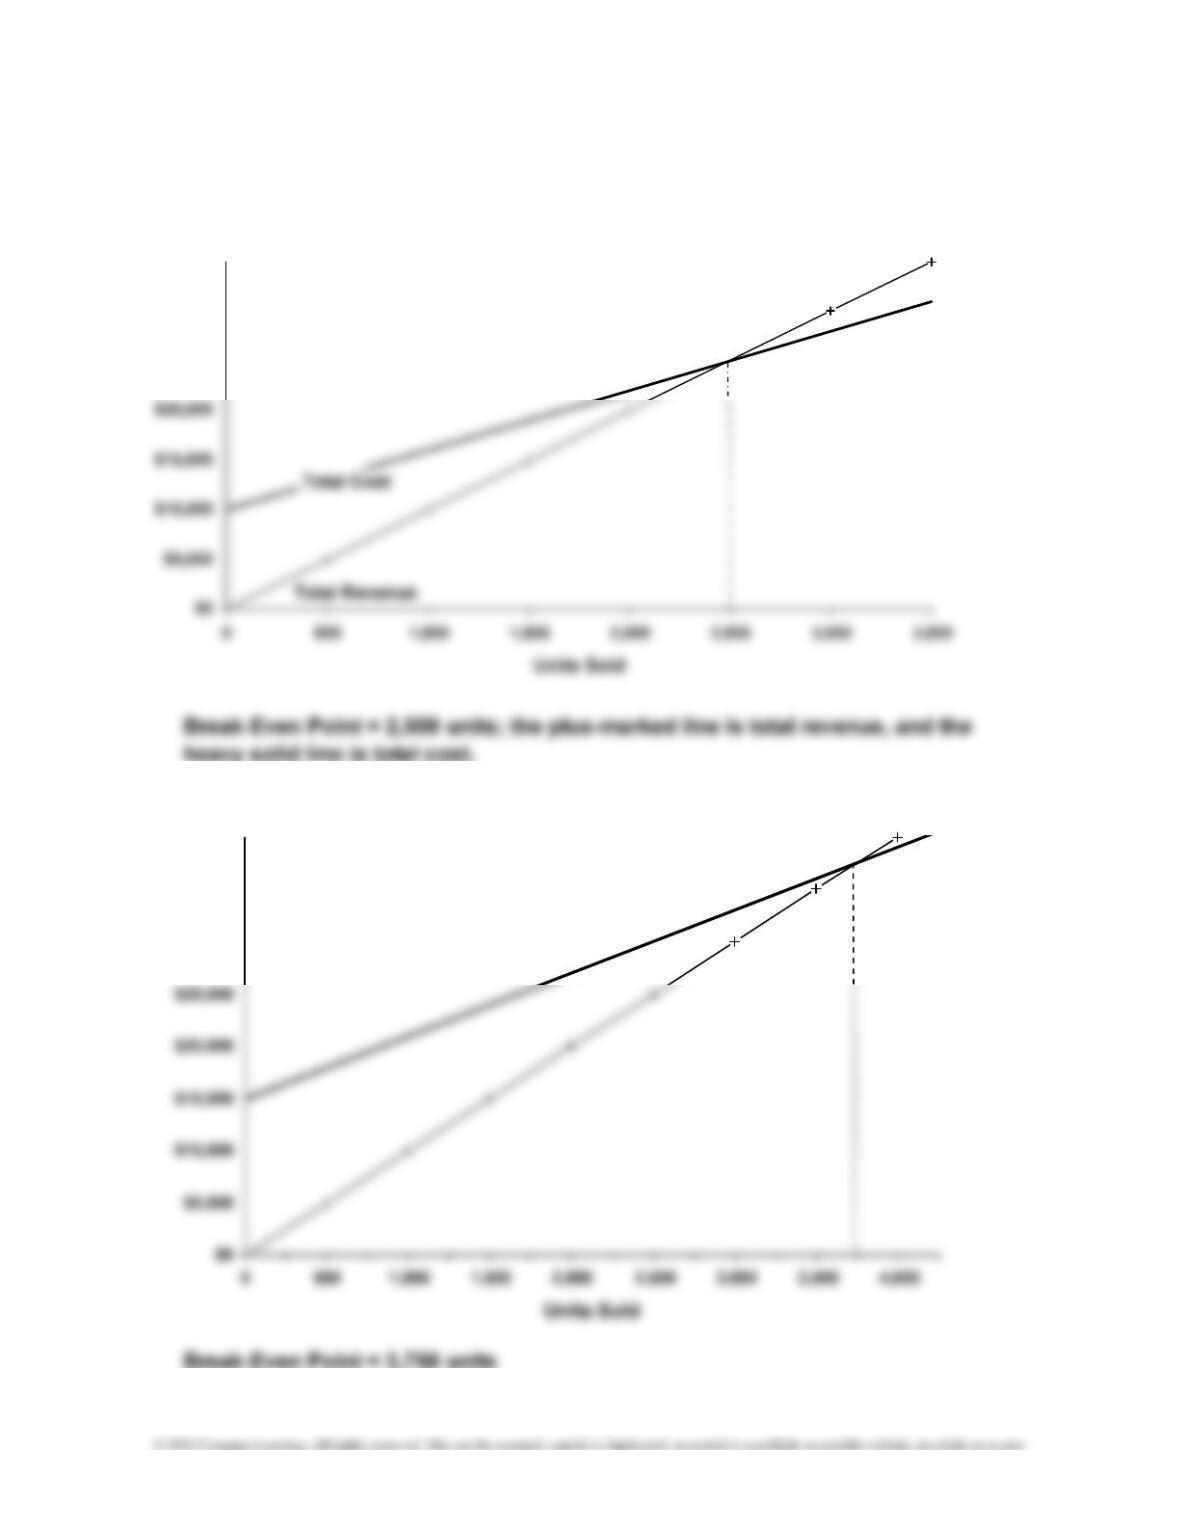
E 4-35
1.
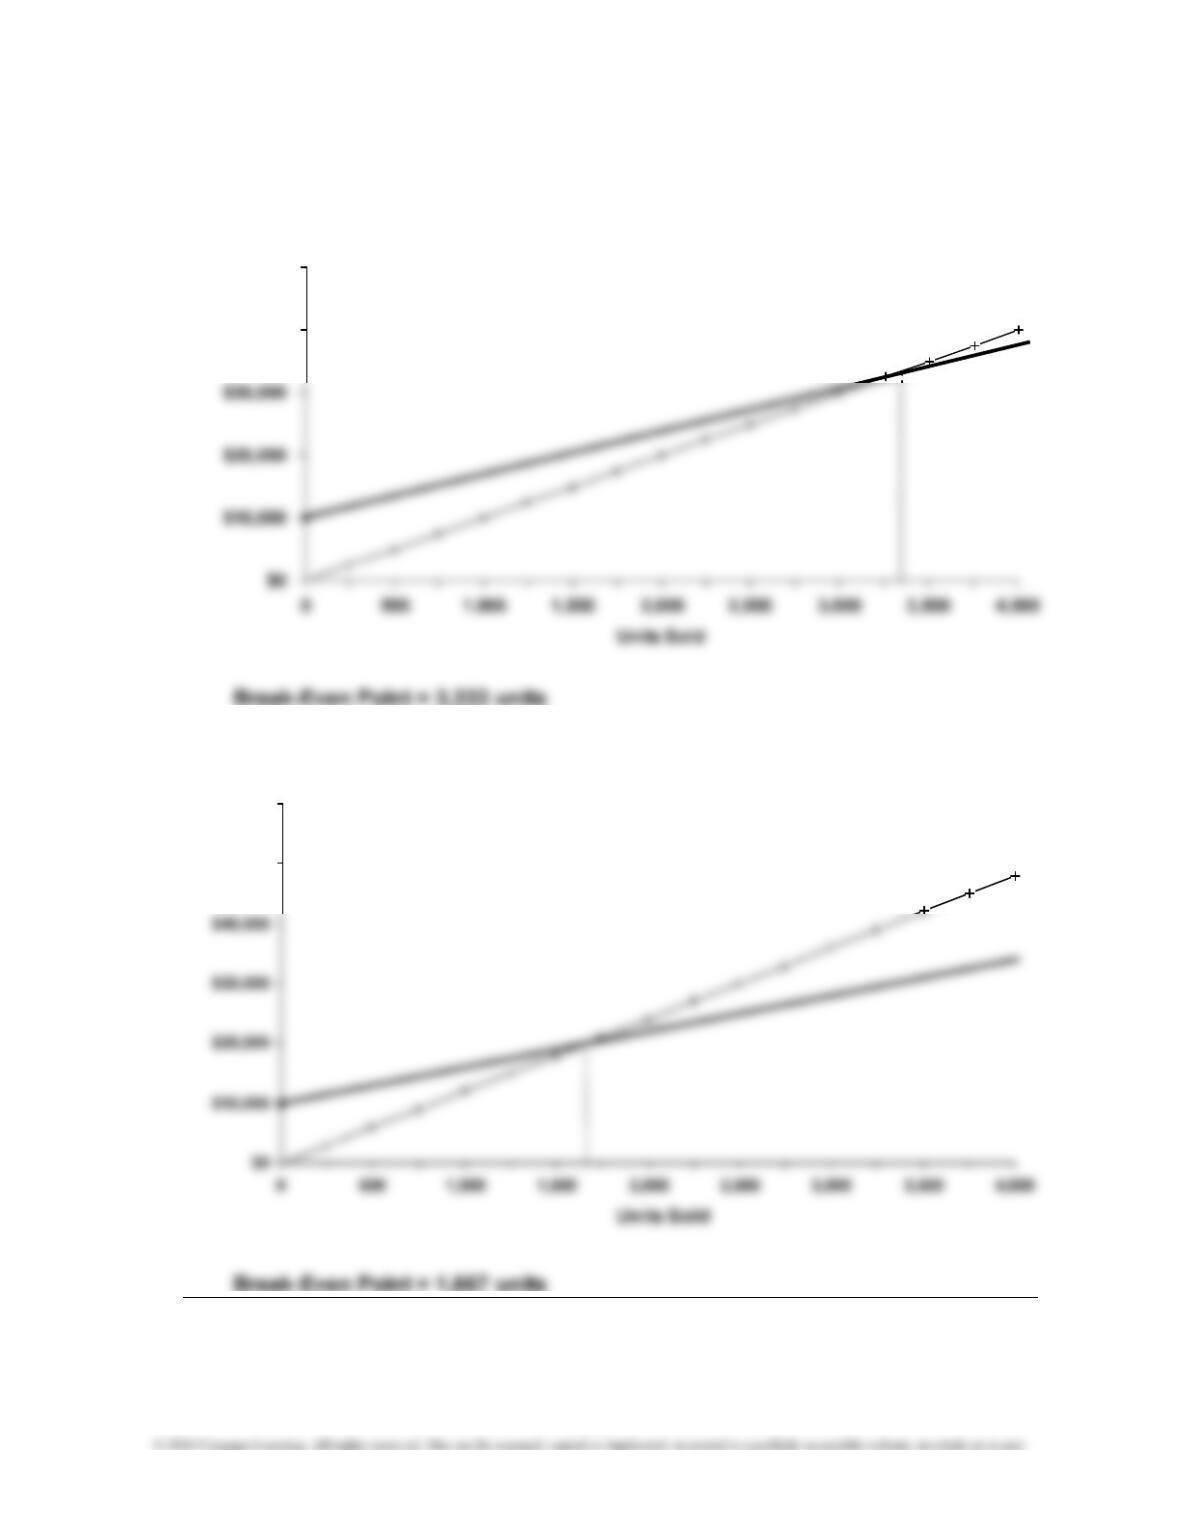
2. a. Fixed cost increases by $5,000:
$25,000
$30,000
$35,000
$30,000
$35,000
$40,000
4-16
CHAPTER 4 Cost-Volume-Profit Analysis: A Managerial Planning Tool
E 4-35 (Continued)
2. b. Unit variable cost increases to $7:
2. c. Unit selling price increases to $12:
$50,000
$60,000
$40,000
$50,000
4-17