P3–2
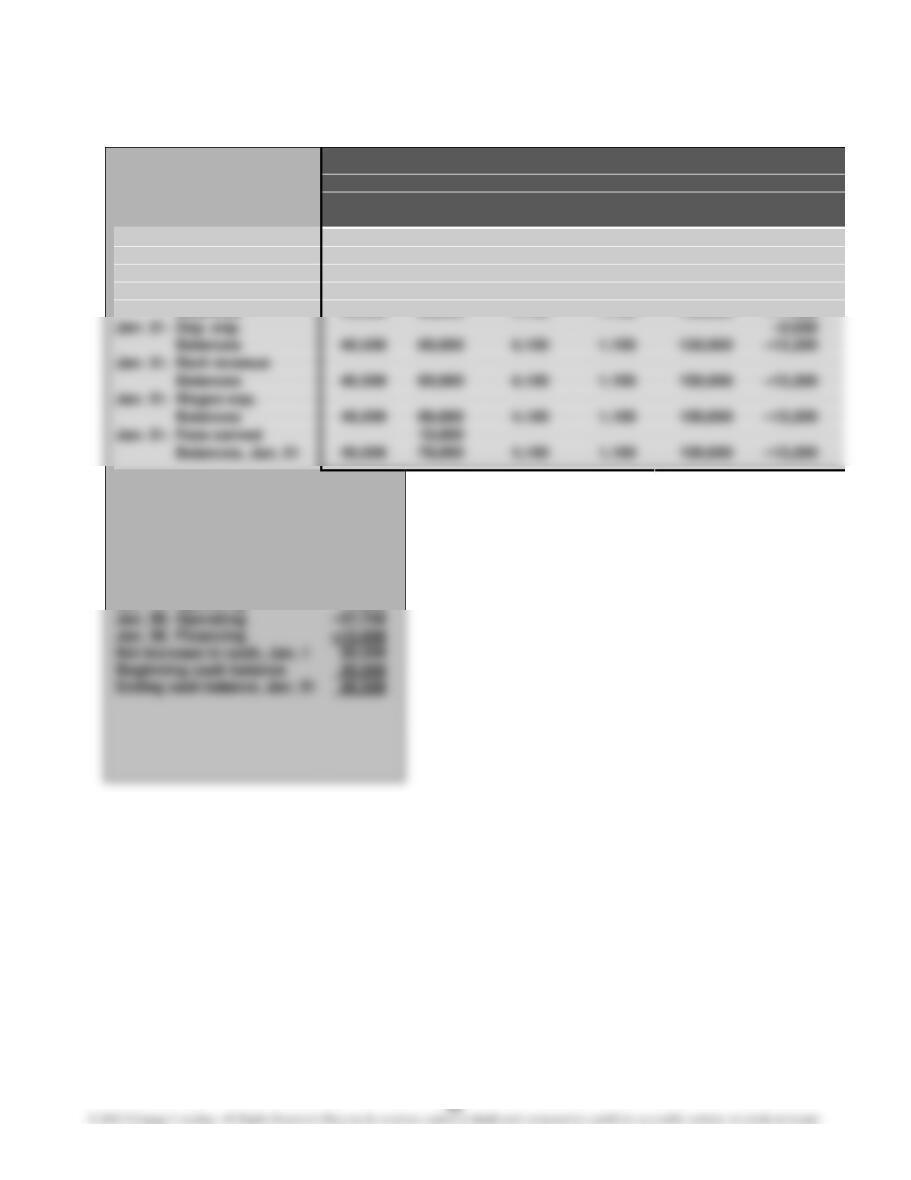
Statement of
Balance
Cash Flows
Assets
Accts.
Prepaid
Acc.
Cash
+
Rec.
+
Insurance
+
Supplies
+
Building
–
Depr.
+
Balances
40,500
69,000
4,900
2,800
150,000
–11,200
Jan. 31.
Insurance exp.
–800
Balances
40,500
69,000
4,100
2,800
150,000
–11,200
Jan. 31.
Supplies exp.
–1,700
Balances
40,500
69,000
4,100
1,100
150,000
–11,200
Jan. 31.
Dep. exp.
Balances
40,500
69,000
4,100
1,100
150,000
–13,200
Jan. 31.
Rent revenue
Balances
40,500
69,000
4,100
1,100
–13,200
Jan. 31.
Wages exp.
Balances
40,500
69,000
4,100
1,100
–13,200
Jan. 31.
Fees earned
10,000
Balances, Jan. 31
40,500
79,000
4,100
1,100
–13,200
Statement of Cash Flows
Jan. 1.
Operating
15,000
Jan. 1.
Operating
–4,200
Jan. 9.
Operating
27,500
Jan. 11.
Operating
–3,000
Jan. 18.
Financing
25,000
Jan. 25.
Operating
12,900
Jan. 30.
Operating
Jan. 30.
Financing
Net increase in cash, Jan. 1
20,500
20,000
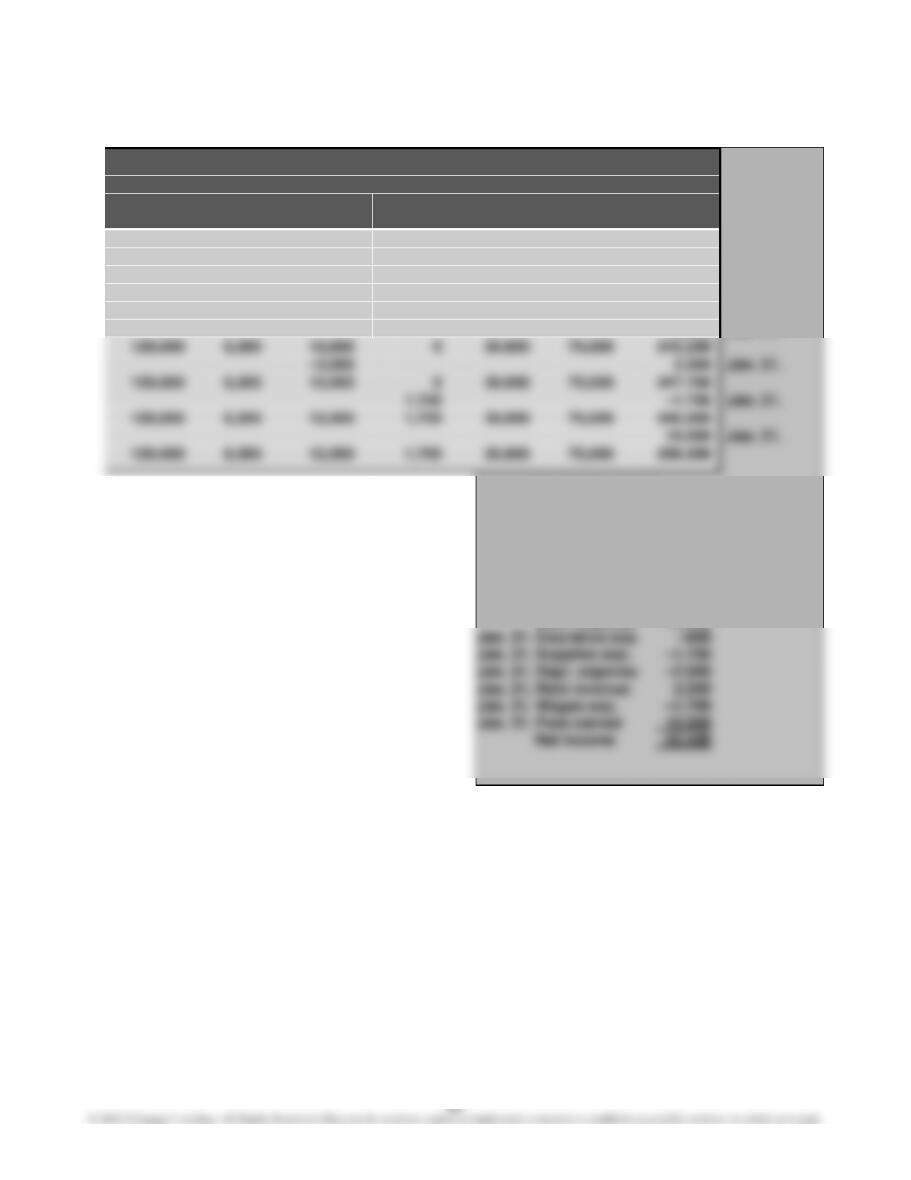
P3–2, Concluded
Sheet
Income
=
Liabilities
+
Stockholders’ Equity
Statement
Accts.
Unearned
Wages
Notes
Capital
Retained
+
Land
=
Payable
+
Revenue
+
Payable
+
Payable
+
Stock
+
Earnings
120,000
6,300
15,000
0
30,000
75,000
249,700
–800
Jan. 31.
120,000
6,300
15,000
0
30,000
75,000
248,900
–1,700
Jan. 31.
120,000
6,300
15,000
0
30,000
75,000
247,200
–2,000
Jan. 31.
120,000
6,300
15,000
0
30,000
75,000
245,200
2,500
Jan. 31.
120,000
6,300
12,500
0
30,000
75,000
247,700
1,700
–1,700
Jan. 31.
120,000
6,300
12,500
1,700
30,000
75,000
246,000
10,000
Jan. 31.
120,000
6,300
12,500
1,700
30,000
75,000
256,000
Income Statement
Jan. 20. Fees earned
62,000
Jan. 25. Fees earned
12,900
Jan. 30. Wages exp.
–24,000
Utilities exp.
–6,000
Rent expense
–5,000
Interest exp.
–200
Misc. expense
–2,500
Jan. 31. Insurance exp.
–800
Jan. 31. Supplies exp.
–1,700
Jan. 31. Depr. expense
–2,000
Jan. 31. Rent revenue
Jan. 31. Wages exp.
–1,700
Jan. 31. Fees earned
10,000
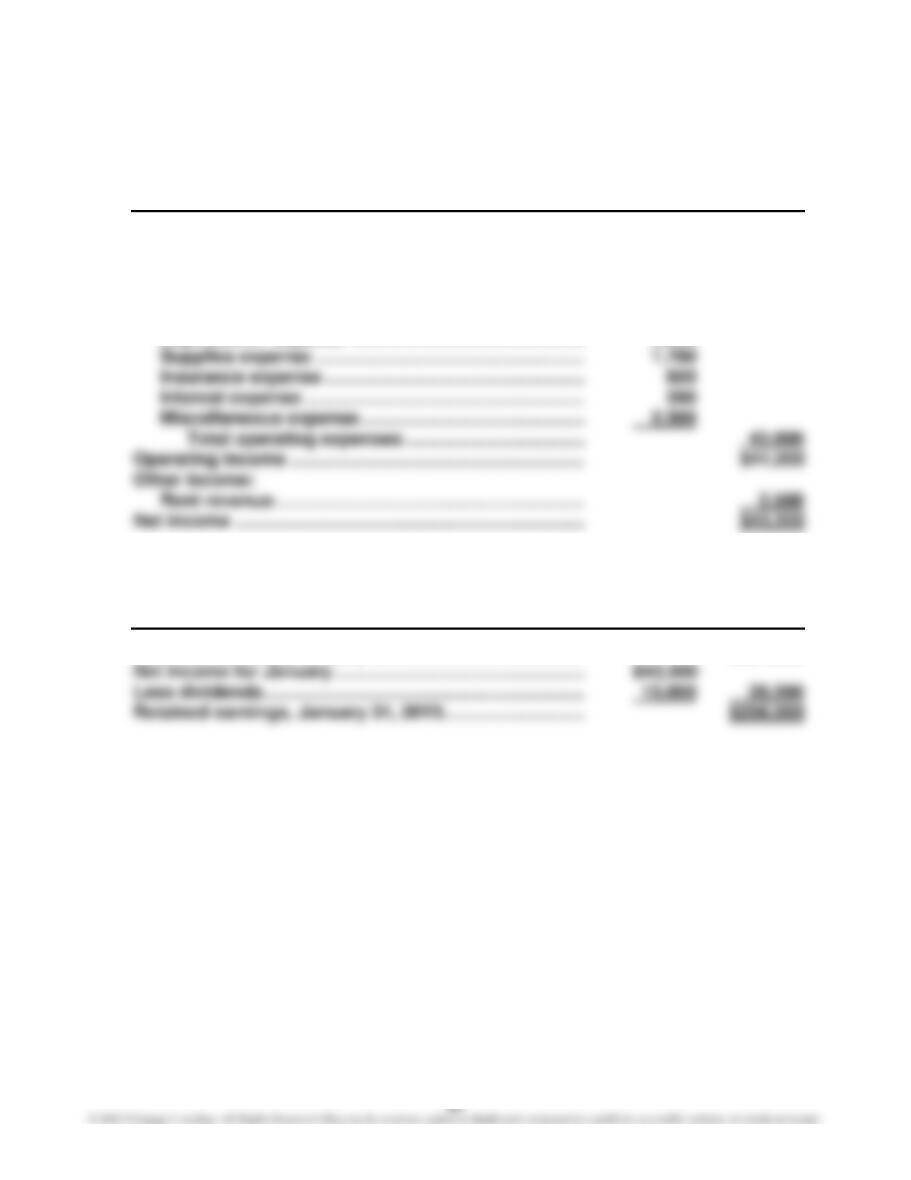
P3–3
OASIS HEALTH CARE, INC.
Income Statement
For the Month Ended January 31, 20Y5
Fees earned …………………………………………………………… $84,900
Operating expenses:
Wages expense …………………………………………………. $25,700
Utilities expense ……………………………………………….. 6,000
Rent expense ……………………………………………………. 5,000
Depreciation expense ……………………………………….. 2,000
OASIS HEALTH CARE, INC.
Retained Earnings Statement
For the Month Ended January 31, 20Y5
Retained earnings, January 1, 20Y5 ………………………… $227,500
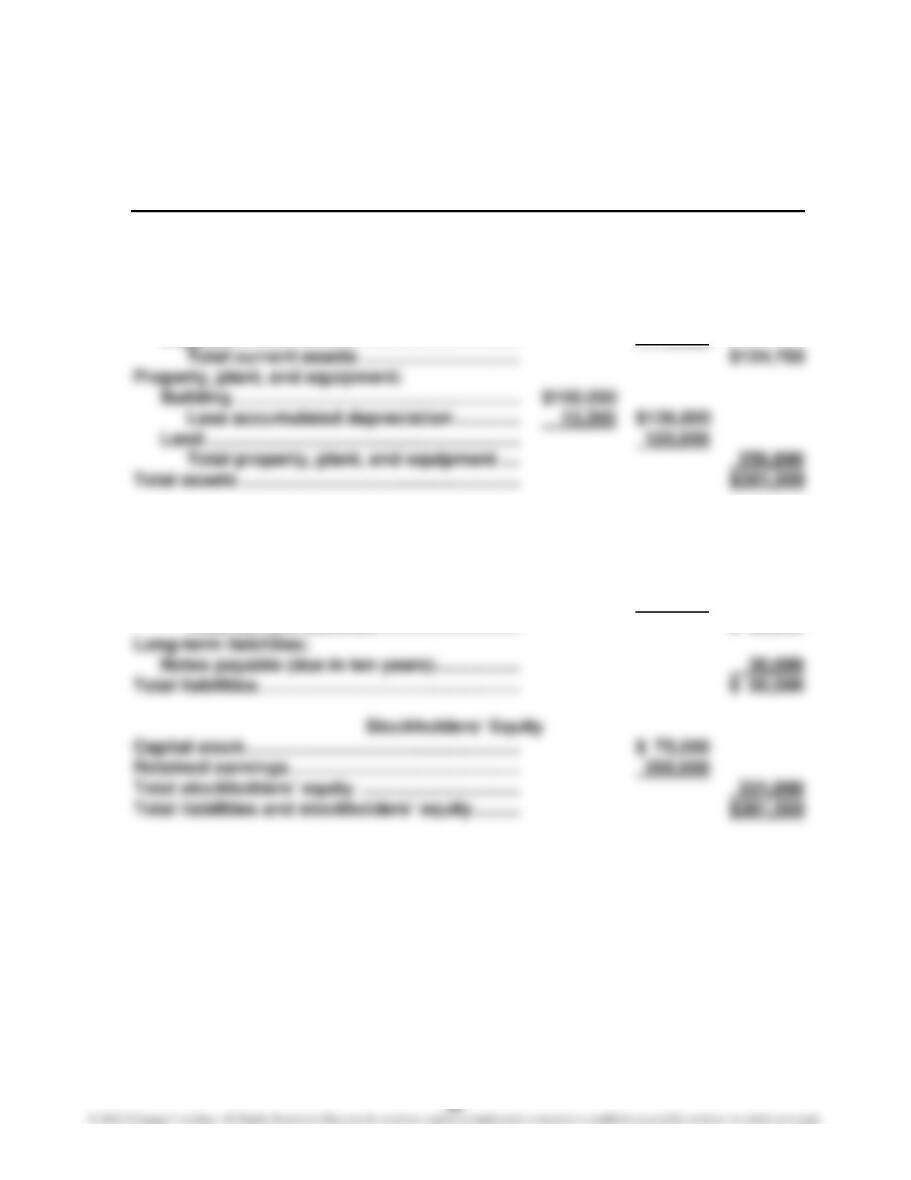
P3–3, Concluded
OASIS HEALTH CARE, INC.
Balance Sheet
January 31, 20Y5
Assets
Current assets:
Cash ……………………………………………………… $ 40,500
Accounts receivable ………………………………. 79,000
Prepaid insurance …………………………………. 4,100
Supplies ……………………………………………….. 1,100
Liabilities
Current liabilities:
Accounts payable ………………………………….. $ 6,300
Unearned rent ……………………………………….. 12,500
Wages payable ………………………………………. 1,700
Total current liabilities ………………………. $ 20,500
P3–4
1. OASIS HEALTH CARE, INC.
Statement of Cash Flows
For the Month Ended January 31, 20Y5
Cash flows from operating activities:
Cash received from customers ………………………….. $ 55,400*
Deduct cash payments for expenses …………………. (44,900)**
Net cash flows from operating activities …………………. $ 10,500
Cash flows from investing activities ……………………….. 0
2. Net income ……………………………………………………………. $ 43,500
Add:
Depreciation expense ……………………………………….. $ 2,000
Increase in unearned revenue ……………………………. 12,500
Increase in wages payable ………………………………… 1,700 16,200
P3–5
Total
Net Total Total Stockholders’
Income Assets Liabilities Equity
Reported amounts $127,500 $480,000 $150,000 $330,000
Corrections:
Adjustment (a) +9,700 +9,700 0 +9,700

1.
Statement of
Balance Sheet
Income
Cash Flows
Assets
=
Liabilities
+
Stockholders’ Equity
Statement
Laundry
Prepaid
Laundry
Acc.
Accts.
Wages
Capital
Retained
Cash
+
Supplies
+
Ins.
+
Equip.
–
Depr.
=
Payable
+
Payable
+
Stock
+
Earnings
Balances, Dec. 31, 2013
53,000
9,000
6,000
250,000
–65,000
7,000
0
50,000
196,000
Dec. 31. (a)
2,150
–2,150
(a)
Dec. 31. (b)
–12,500
–12,500
(b)
Dec. 31. (c)
–7,500
–7,500
(c)
Dec. 31. (d)
–4,600
–4,600
(d)
Balances, Dec. 31, 2013
53,000
1,500
1,400
250,000
–77,500
7,000
2,150
50,000
169,250
Statement of Cash Flows
Income Statement
Operating (Revenues)
275,000
Laundry revenue
275,000
Financing (Capital Stock)
25,000
Wages expense
–110,000
Operating (Expenses)
–200,000
Rent expense
–30,000
Investing (Equipment)
Utilities expense
–18,000
Financing (Dividends)
–15,000
Misc. expense
Net increase in cash
35,000
Dec. 31. (a)
Wages expense
Beginning cash balance,
Dec. 31. (b)
Depreciation exp.
January 1, 2013
18,000
Dec. 31. (c)
Laundry sup. exp.
Ending cash balance,
Dec. 31. (d)
Insurance expense
P3–6, Continued
2. MS. ELLEN’S LAUNDRY INC.
Income Statement
For the Year Ended December 31, 20Y8
Laundry revenue ……………………………………………………. $275,000
Operating expenses:
Wages expense …………………………………………………. $112,150
Rent expense ……………………………………………………. 30,000
MS. ELLEN’S LAUNDRY INC.
Retained Earnings Statement
For the Year Ended December 31, 20Y8
Retained earnings, January 1, 20Y8 ………………………… $101,500
Net income for the year ………………………………………….. $82,750
P3–6, Continued
3. MS. ELLEN’S LAUNDRY INC.
Balance Sheet
December 31, 20Y8
Assets
Current assets:
Cash …………………………………………………………………. $ 53,000
Laundry supplies ………………………………………………. 1,500
Prepaid insurance …………………………………………….. 1,400
Liabilities
Current liabilities:
Accounts payable ……………………………………………… $ 7,000
Wages payable ………………………………………………….. 2,150
Total liabilities ……………………………………………………….. $ 9,150
P3–6, Concluded
4. MS. ELLEN’S LAUNDRY INC.
Statement of Cash Flows
For the Year Ended December 31, 20Y8
Cash flows from operating activities:
Cash received from customers ………………………….. $ 275,000
Cash paid for expenses …………………………………….. (200,000)
Net cash flows from operating activities …………………. $ 75,000
Cash flows used for investing activities:
Cash paid for equipment……………………………………. (50,000)
FINANCIAL ANALYSIS
FA3–1
1. Year 2: $363 ($1,997 – $1,634)
Year 1: $407 ($2,155 – $1,748)
2. Year 2: 1.2 ($1,997 ÷ $1,634)
4. GameStop’s working capital has declined $44 million in Year 2 from $407 mil-
5. GameStop is experiencing competitive pressures from the availability of in-
expensive games that can be downloaded from various online sources for
FA3–2
1. Year 2: $2,181 ($4,309 – $2,128)
Year 1: $1,831 ($3,926 – $2,095)
2. Year 2: 2.0 ($4,309 ÷ $2,128)
Year 1: 1.9 ($3,926 ÷ $2,095)
FA3–3
1. Year 2: $882 ($1,287 – $405)
Year 1: $786 ($1,174 – $388)
2. Year 2: 3.2 ($1,287 ÷ $405)
4. American Eagle Outfitters’ liquidity position stayed approximately the same
from Year 1 to Year 2. Working capital increased by $96 million while the cur-
FA3–4
Working capital, the current ratio, and the quick ratio for Year 2 (from FA3–2 and
FA3–3) are summarized below.
American Eagle
The Gap Outfitters
Working capital (in millions) …………… $2,181 $882
Current ratio ………………………………….. 2.0 3.2
Quick ratio …………………………………….. 1.0 2.1
FA3–5
1. This item is intended to encourage students to think about different types of
businesses and their operations. It then requires the student to think about
how business operations might affect the current ratio.
2. This item is intended to encourage students to think about different types of
3. Walmart:
Current ratio: 0.9 ($54,975 ÷ $62,300)
Quick ratio: 0.2 ($12,487 ÷ $62,300)
4. Walmart has significantly lower current and quick ratios than does Google.
Walmart’s current and quick ratios are 0.9 and 0.2 compared to Google’s 3.7
and 3.1. These differences can be partially explained by the nature of the op-
erations of the two companies. As a large retailer, Walmart has a significant
amount of merchandise inventory (over $40 billion) included in its current as-
sets. In contrast, Google has no inventory. In addition, because of its large
CASES
Case 3–1
Revenue is normally recorded when the services are provided or when the goods
are delivered (title passes) to the buyer. By waiting until after the services are
provided, the expenses of providing the services can be more accurately
measured and matched against the related revenues. Also, at this point, the pro-
vider of the services has a right to demand payment for the services if payment
hasn’t already been received.
Note to Instructors: You might point out to students the following points related
to the discussion of the adjusting process in this chapter.
(1) The receipt of revenue from customers in advance of a flight represents un-
earned revenues to the airline. For example, the purchase of discount tickets,
which often requires prepayment months in advance of the actual flight, is
unearned revenue to the airline.
(2) At the end of the airline’s accounting period, it would have adjustments relat-
ed to items such as the following:
• Accrued wages for employees
Case 3–2
1. There are several indications that adjustments were not recorded before the
financial statements were prepared, including:
a. All expenses on the income statement are identified as “paid” items and
not as “expenses.”
2. Likely accounts requiring adjustment include:
a. Truck (for depreciation)
Case 3–3
1. The answers will vary among the student groups. The objective of this case is
to generate student interest and discussion of business emphases.
The advantages of the do-it-yourself emphasis are as follows:
a. It requires less capital equipment and training of employees. For example,
expensive automotive diagnostic equipment will not have to be pur-
The advantages of the do-it-for-me emphasis are as follows:
a. Demographically, the population of the United States is aging. In the fu-
ture, such demographics mean that more customers will be less willing to
fix their own cars. That is, they would rather pay someone to fix their cars
for them.
2. Examples of do-it-yourself include AutoZone, Pep Boys, and Napa Auto Parts
in the automotive industry. In the home improvement industry, examples in-
clude Home Depot and Lowe’s.
Case 3–4
1. CVS:
Operating income ………………………………………………………… $3,461
Add: Increase in accounts payable ($7,663 – $7,096) …….. $ 567
Deduct: Increase in accounts receivable ($6,550 – $5,436) (1,114) (547)
Adjusted cash basis operating income ………………………… $2,914
2. CVS: $547 ($3,461 – $2,914)
Walgreens: $337 ($2,127 – $1,790)
3. CVS: 15.8% ($547 ÷ $3,461)
Walgreens: 15.8% ($337 ÷ $2,127)
5. Most analysts focus on operating income rather than net income in assessing
the long-term profitability of a company. This is because operating income
Case 3–5
1. Company A is Amazon.com
2. Amazon.com (Company A) has experienced rapidly growing revenues since
its inception. In Year 3 Amazon reported revenues of $48,077 million, which is
a $13,873 million ($48,077 – $34,204) increase from Year 2. At the same time,
Amazon’s net cash flows from operations and total assets have increased.
Amazon’s investment in its future operations decreased in Year 3 by $1,430
(21.8 cents per revenue dollar). Coke obviously has higher operating margins
than does Kroger. This is what we would expect because of Coke’s brand
name and acceptance of its core products. Like Coke, Kroger has positive net
cash flows from operating activities and continues to invest cash in its busi-
ness.