6e Income Statement Page 88 Chapter 3
d. It was shown in Activity 8 that Wal-Mart makes profits by generating a large volume of sales
each revenue dollar to cover all remaining operating expenses, nonoperating expenses, and
shown on the income statement. The information for both the numerator and denominator
On the previous page, for each ratio, circle the strongest among the three companies in the
Personal Computer Systems industry.
g. Meaning is added to a ratio by comparing that ratio to industry norms because success may
vary by industry. On the previous page, cross out each ratio that is weaker than the Personal
Computer Systems industry average.
h. Review the ratios that were circled as the strongest and those ratios that were crossed out
for being lower than the industry average to answer the following questions.
2. Which company appears to sell at a low markup to generate a greater volume of sales?
3. According to the most comprehensive measure of profitability, which company is the
4. Which company has the lowest product costs compared to sales revenue?
6e Income Statement Page 89 Chapter 3
ACTIVITY 29 ANALYSIS: TREND
Purpose: • Prepare a trend analysis and understand the information provided.
The TREND ANALYSIS compares amounts of a more recent year to a base year. The base year is the earliest year being studied. The analysis measures the
percentage of change from the base year.
Q1 For Apple Computer, use amounts listed below to complete the trend indexes for Income before income tax and the lines below. Divide each amount by
the amount for the base year. Record the resulting trend index in the shaded area. Use FYE 9/29/2007 as the base year.
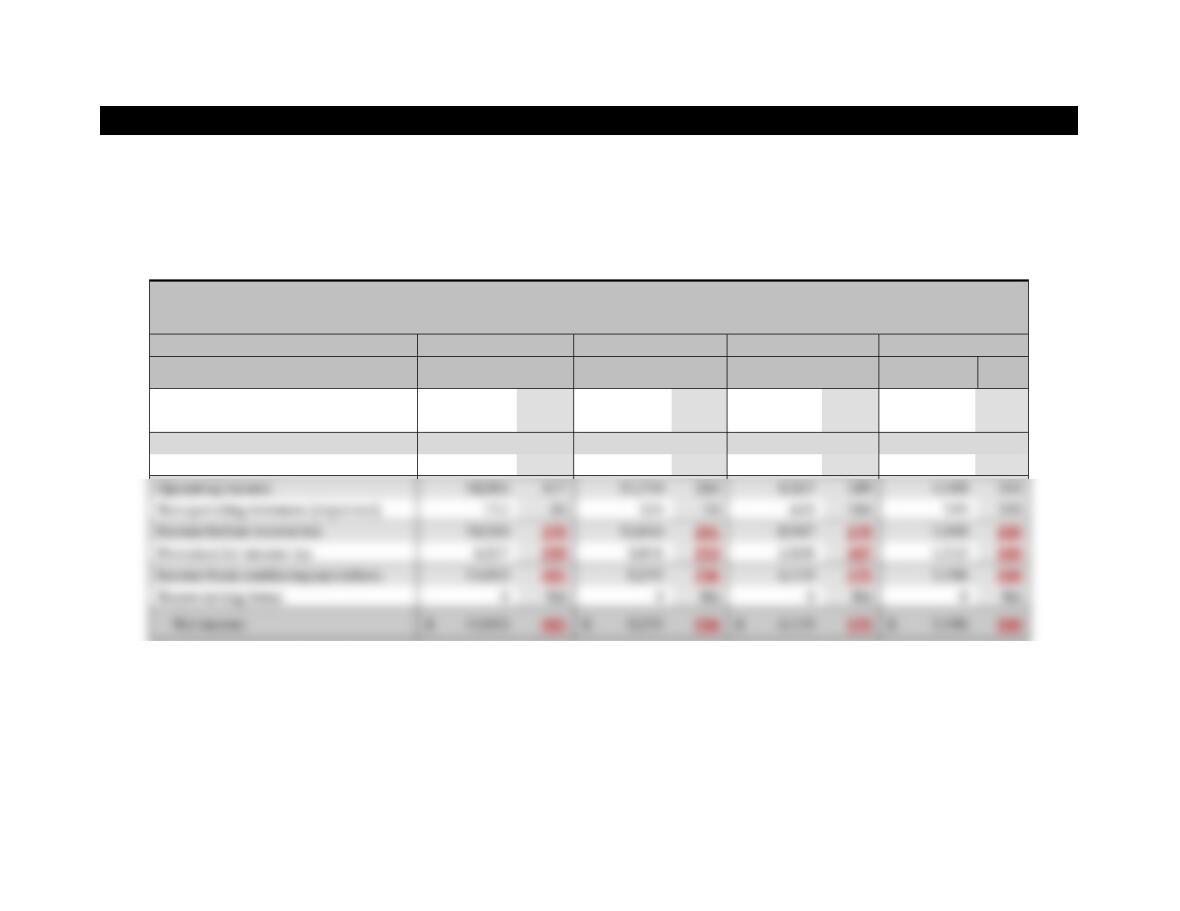
Apple Computer (AAPL) ($ in millions)
Fiscal year ended (FYE)
9/25/2010
9/26/2009
9/27/2008
9/29/2007
Amount
Trend
Index
Amount
Trend
Index
Amount
Trend
Index
BASE
YEAR
Trend
Index
Sales revenue
$
65,225
272
$
42,905
179
$
37,491
156
$
24,006
100
Cost of goods sold
39,541
249
25,683
162
24,294
153
15,852
100
Gross profit
25,684
315
17,222
211
13,197
162
8,154
100
Operating expenses
7,299
195
5,482
146
4,870
130
3,745
100
* Amounts with opposite signs cannot be accurately compared.
Operating Income
18,385
417
11,740
266
189
4,409
100
Nonoperating revenues (expenses)
104
100
Income before income tax
18,540
12,066
5,008
Provision for income tax
1,512
Income from continuing operations
3,496
Nonrecurring items
6e Income Statement Page 90 Chapter 3
Refer to the series of income statements and the trend analysis on the previous page to answer the
following questions.
Q2 Sales growth was 172% (272–100) from FYE 9-29-2007 to FYE 9-25-2010 with the greatest increase
Q3 From FYE 9-29–2007 to FYE 9-25-2010, which of the following expenses increased at a greater rate
Q5 The annual revenue growth rate can be compared between companies.
Assume less than 5% is low, 5 to 15% is moderate, and more than 15% is high.
Q6 Compute gross profit margin (Gross profit / Sales revenue) for fiscal years ended:
unfavorable) trend. What does this trend indicate?
List as many items as you can to support your response.
6e Income Statement Page 91 Chapter 3
List as many items as you can to support your response.
6e Income Statement Page 92 Chapter 3
ACTIVITY 30 ANALYSIS: COMMON–SIZE STATEMENTS
Purpose: • Prepare common-size statements and understand the information provided.
The common-size income statement compares all amounts to revenues. The analysis measures each item
as a percentage of revenue.
Q1 For Lenovo and Hewlett Packard companies listed below, complete the common-size statements
by dividing each item on the income statement by sales revenue. Record the resulting common-size
percentage in the shaded area provided.
Lenovo
DELL
Hewlett Packard
(LNVGY)
(DELL)
(HPQ)
Fiscal year ended
3/31/2010
1/30/2011
10/31/2010
Amount
Amount
Amount
Refer to the information above to answer the following questions.
Q3 The company that reported the highest ratio for:
Q4 The company that reported the greatest percentage of expense for:
Q5 During 2010, (LNVGF / DELL / HPQ) remained the #1 direct-sale computer vendor.
(Hint: Refer to company descriptions in Appendix A—Featured Corporations)
($ in millions)
6e Income Statement Page 93 Chapter 3
ACTIVITY 31 ANALYSIS OF HEWLETT–PACKARD COMPANY
Purpose: • Understand and interpret amounts reported on the income statement
Hewlett-Packard (HPQ) INCOME STATEMENTS ($ in millions)
Fiscal years ended October 31,
Trend
Index
2010
2009
2008
2007
SGA
103
12,585
11,613
13,326
12,226
R&D
82
2,959
2,819
3,543
3,611
Restructuring changes
296
1,144
Other operating expenses
390
1,777
1,820
Total operating expenses
111
18,465
16,892
17,822
16,680
Operating income
132
11,479
10,136
10,473
8,719
Interest inc (exp) and other
Total nonoper rev (exp)
Income before income tax
120
10,974
9,415
10,473
9,177
Provision for income tax
116
2,213
1,755
2,144
1,913
Income from cont oper
121
8,761
7,660
8,329
7,264
Nonrecurring items / MInt
Net income
121
8,761
$
7,660
$
$
7,264
Refer to the series of income statements presented above to answer the following questions.
revenue. The annual revenue growth rate can be compared between companies.
Assume less than 5% is low, 5 to 15% is moderate, and more than 15% is high
Q2 Using 10/31/2007 as the base year, compute the trend index on 10/31/2010 for:
Q3 Compute ROS (Net income / Sales revenue) for fiscal years ended on:
Sales revenue
121
$
$
$
Cost of goods sold (COGS)
122
96,089
87,524
90,069
78,887
Gross profit
118
29,944
27,028
28,295
25,399
6e Income Statement Page 94 Chapter 3
Q4 Review all of the information presented above. If you had $10,000, would you consider investing in
ACTIVITY 32 ANALYSIS OF LENOVO GROUP
Purpose: • Understand and interpret amounts reported on the income statement.
LENOVO GROUP (LNVGY) INCOME STATEMENTS ($ in millions)
For fiscal year ended March 31,
2010
2009
2008
2007
Sales revenue
$
16,605
$
14,901
$
16,352
$
13,978
Cost of sales (COGS)
14,815
13,104
13,902
12,091
Gross profit
1,790
1,797
2,450
1,887
Selling, general, and distribution exp (SGA)
1,406
1,566
1,700
1,521
Research and development expense (R&D)
214
220
230
196
Other operating expenses
(49)
203
21
9
Total operating expenses
1,571
1,989
1,951
1,726
Operating income
219
(192)
499
161
Interest Expense
63
38
38
35
Other nonoperating income
21
42
52
29
Total nonoperating revenue (expense)
(42)
4
14
(6)
Income before income tax
177
(188)
513
155
Provision for income tax
47
38
48
27
Income from continuing operations
130
(226)
465
128
Nonrecurring items
0
0
+19
+33
Net income
$
130
$
(226)
$
484
$
161
Refer to the series of income statements presented above to answer the following questions.
Q1 Prepare a trend analysis of Sales Revenue for all four years:
Q3 Compute common-size percentages during 2010 and 2008 for the amounts below.
2010
2008
Q4 Review all of the information presented above. Lenovo Group appears to report a
Why? Support your response with at least two observations.
6e Income Statement Page 96 Chapter 3
ACTIVITY 33 TEST YOUR UNDERSTANDING
Purpose: • Understand and interpret amounts reported on the income statement.
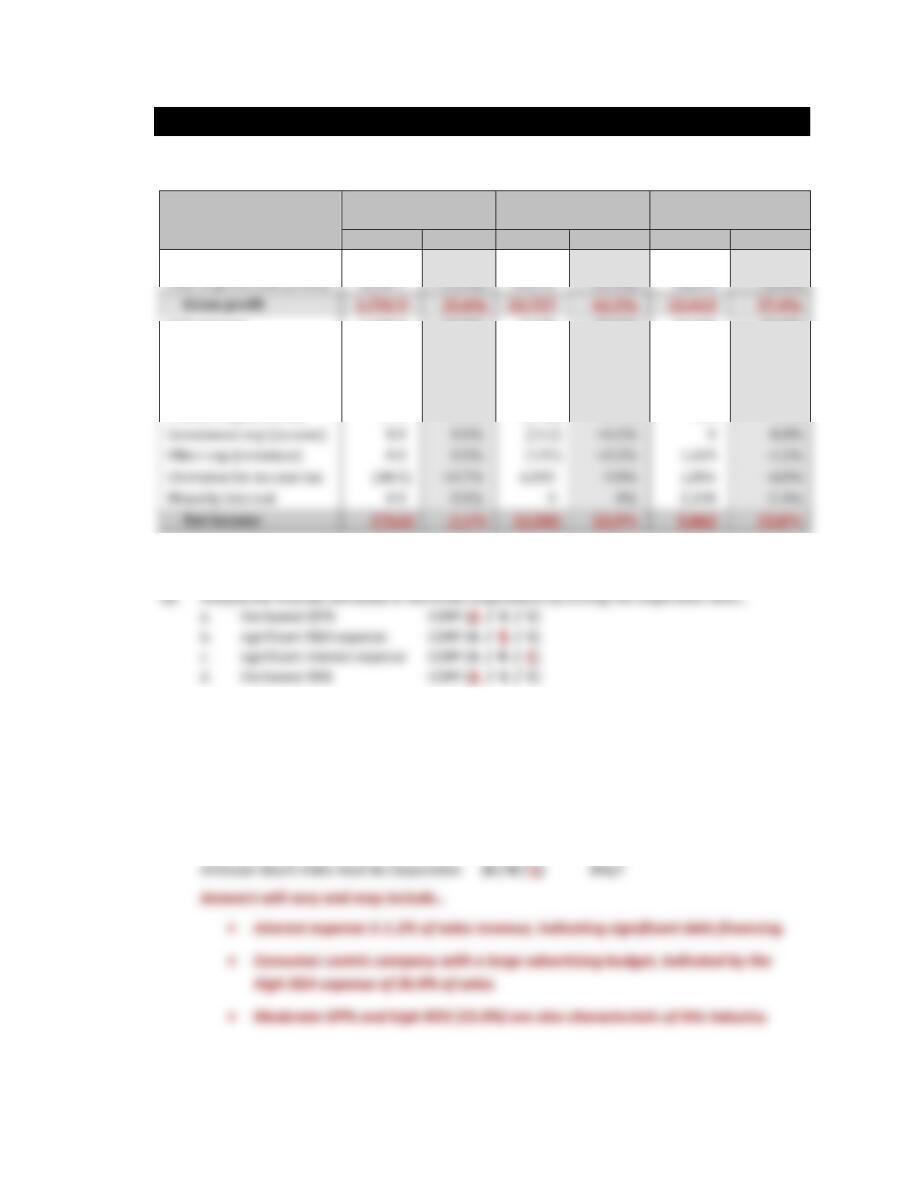
(in millions of $ or €)
CORP A
CORP B
CORP C
04/30/2011
12/31/2011
12/31/2011
Amount
CS%
Amount
CS%
Amount
CS%
Sales revenue
6,998.6
100.0%
53,999
100.0%
39,046
100.0%
SGA expense
1,629.4
-23.3%
7,670
–14.2%
10,499
–26.9%
R&D
0.0
0.0%
8,350
–15.5%
0
0.0%
Depreciation/amor
228.7
–3.3%
260
–0.5%
0
0.0%
Other operating expenses
0.5
–0.0%
132
–0.2%
0
0.0%
Interest exp (income)
57.4
–0.8%
(192)
+0.4%
469
–1.2%
Investment exp (income)
(112)
+0.2%
Other exp (revenues)
(135)
+0.2%
–4.2%
Provision for income tax
–4.8%
Minority interest
Q1 Compute gross profit, gross profit margin, net income, and the return on sales ratio for each
corporation. Record the amounts in the appropriate space above.
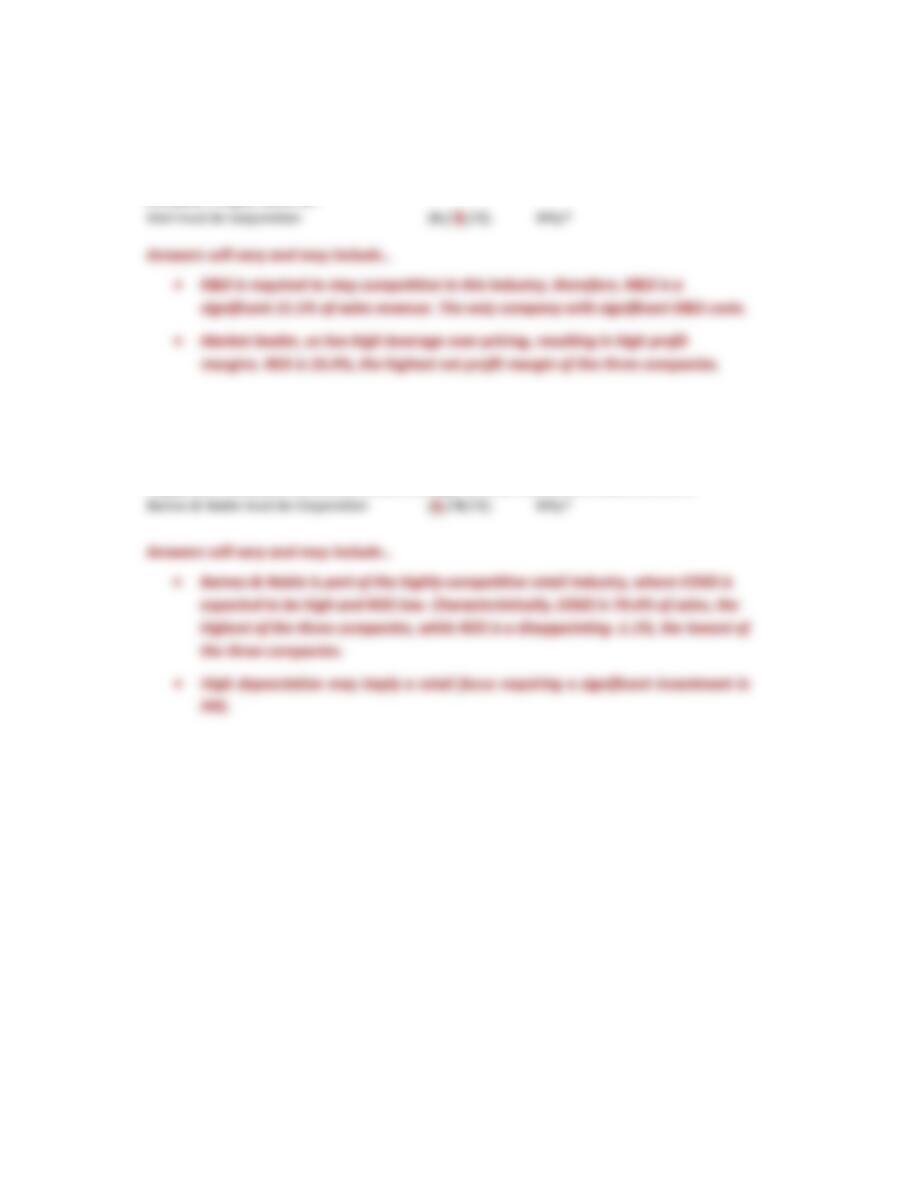
Q3 Use the descriptions below to identify each corporation using their financial information.
ANHEUSER-BUSCH INBEV (BUD) is a publicly-traded company based in Leuven, Belgium. It is the
leading global brewer and one of the world’s top five consumer products companies. A true
consumer-centric, sales-driven company, Anheuser-Busch InBev manages a portfolio of nearly 300
brands that includes global flagship brands Budweiser®, Stella Artois®, and Beck’s®. Anheuser–
Busch InBev’s dedication to heritage and quality is rooted in brewing traditions that originate from
the Den Hoorn brewery in Leuven, Belgium, dating back to 1366 and the pioneering spirit of the
Anheuser & Co. brewery, established in 1860 in St. Louis, USA. Anheuser-Busch InBev has
significant debt financing.
Cost of goods sold (COGS)
5,205.7
-74.4%
20,242
–37.5%
16,634
6e Income Statement Page 97 Chapter 3
INTEL CORPORATION (INTC) is the largest producer of semiconductors in the world, currently
possessing 80% of the market share. Intel’s most notable products include its Pentium and Celeron
microprocessors. Intel also makes flash memories and is #1 globally in this market. Dell is the
company’s largest customer.
BARNES & NOBLE (BKS) operates in the highly competitive retail industry of selling books,
magazines, newspapers, and other content through its multi-channel distribution platform.