CHAPTER 17 (FIN MAN); CHAPTER 3 (MAN) Process Cost Systems
Prob. 17–4B (FIN MAN); Prob. 3–4B (MAN) (Continued)
2.
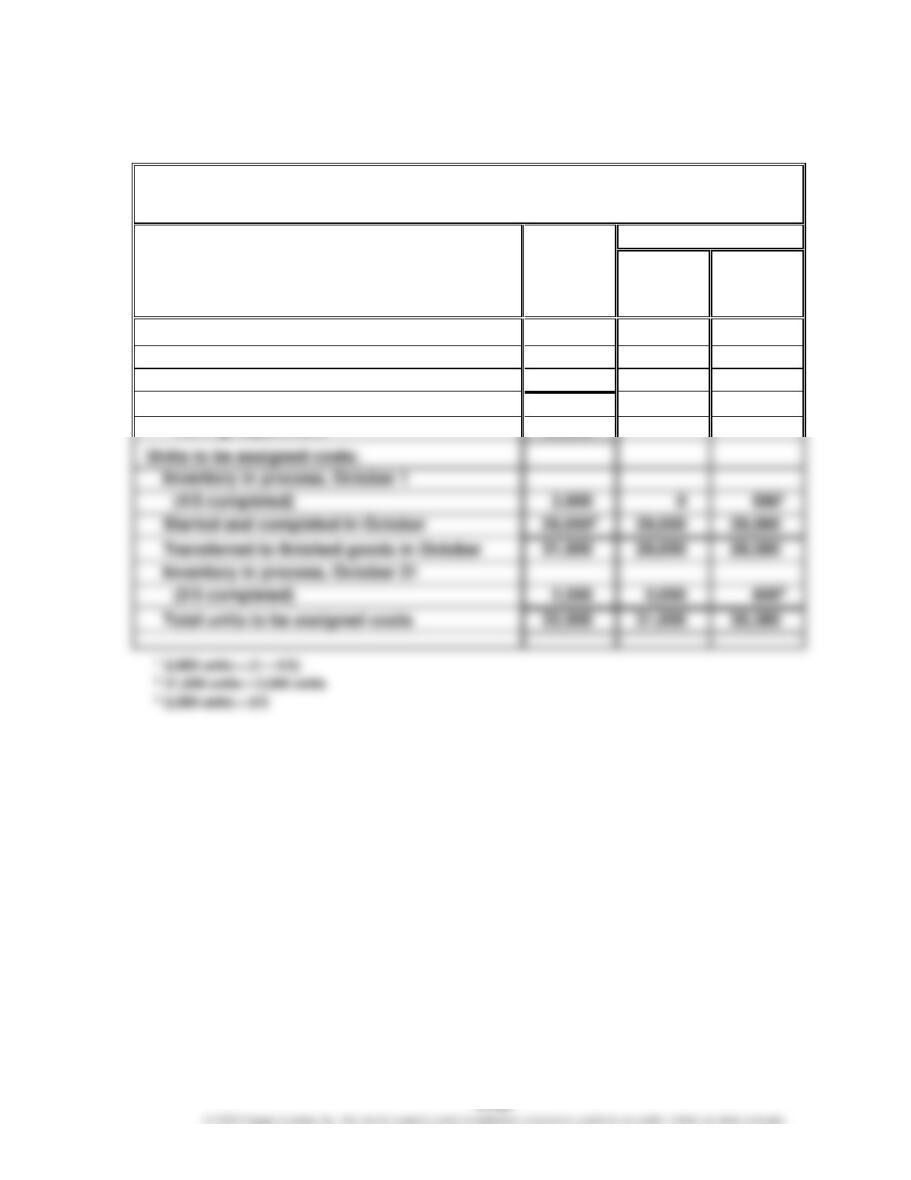
Pittsburgh Aluminum Company
Cost of Production Report—Rolling Department
For the Month Ended October 31
UNITS
Whole
Units
Equivalent Units
Direct
Materials
(a)
Conversion
(a)
Units charged to production:
Inventory in process, October 1
2,900
Received from Smelting Department
31,000
Total units accounted for by the
Units to be assigned costs:
Inventory in process, October 1
Transferred to finished goods in October
31,900
29,000
29,580
Inventory in process, October 31
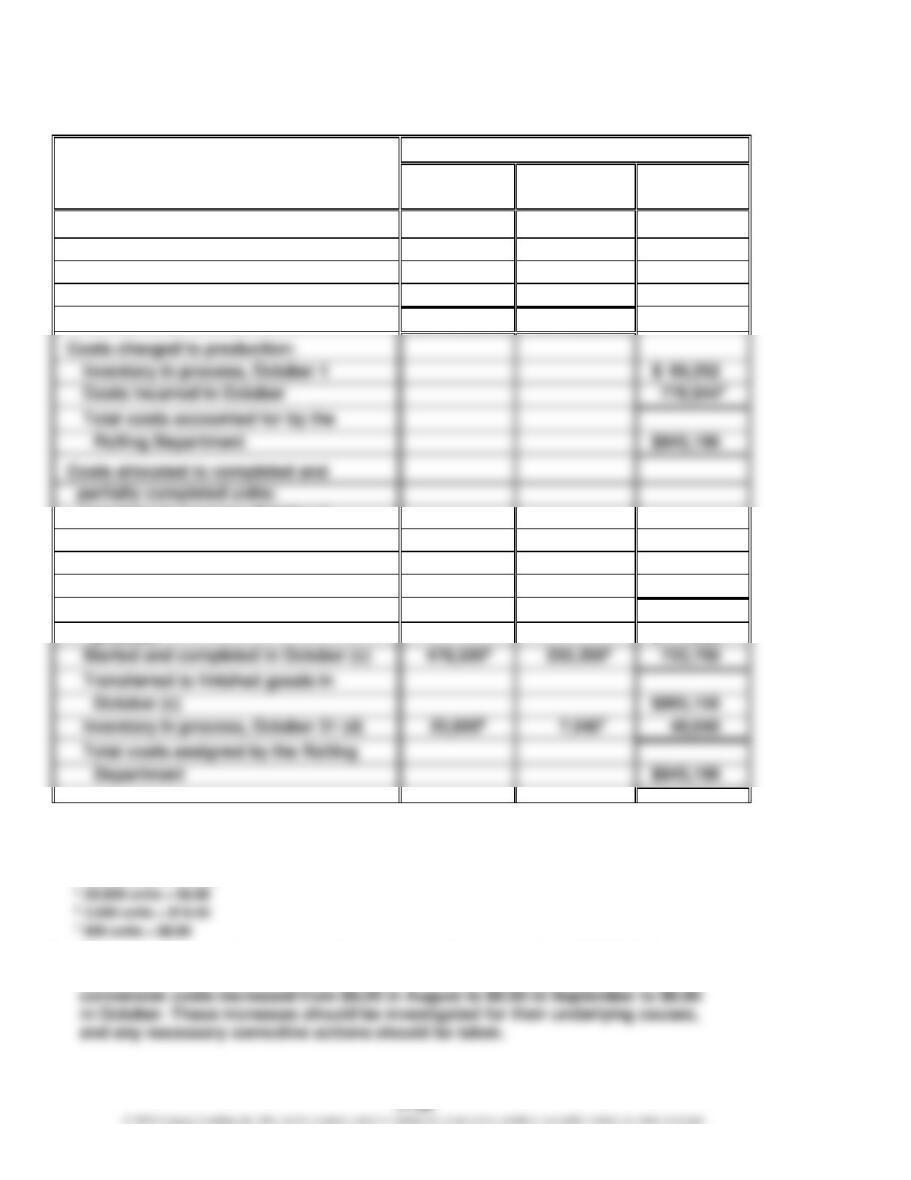
CHAPTER 17 (FIN MAN); CHAPTER 3 (MAN) Process Cost Systems
Prob. 17–4B (FIN MAN); Prob. 3–4B (MAN) (Concluded)
COSTS
Costs
Direct
Materials
Conversion
Total
Cost per equivalent unit:
Total costs for October in Rolling
Department
$511,500
$267,3441
Total equivalent units
÷ 31,000
÷ 30,380
Cost per equivalent unit (b)
$ 16.50
$ 8.80
Inventory in process, October 1
$ 66,352
Costs incurred in October
Total costs accounted for by the
Rolling Department
Costs allocated to completed and
Inventory in process, October 1
balance (c)
$ 66,352
To complete inventory in process,
October 1 (c)
$ 0
$ 5,1043
5,104
Cost of completed October 1 work in
Started and completed in October (c)
Transferred to finished goods in
October (c)
Inventory in process, October 31 (d)
Total costs assigned by the Rolling
1 $162,850 + $104,494
2 $511,500 + $162,850 + $104,494
3 580 units × $8.80
4 29,000 units × $16.50
3. The cost per equivalent unit for direct materials increased from $15.50 in August
to $16.00 in September to $16.50 in October. The cost per equivalent unit for
CHAPTER 17 (FIN MAN); CHAPTER 3 (MAN) Process Cost Systems
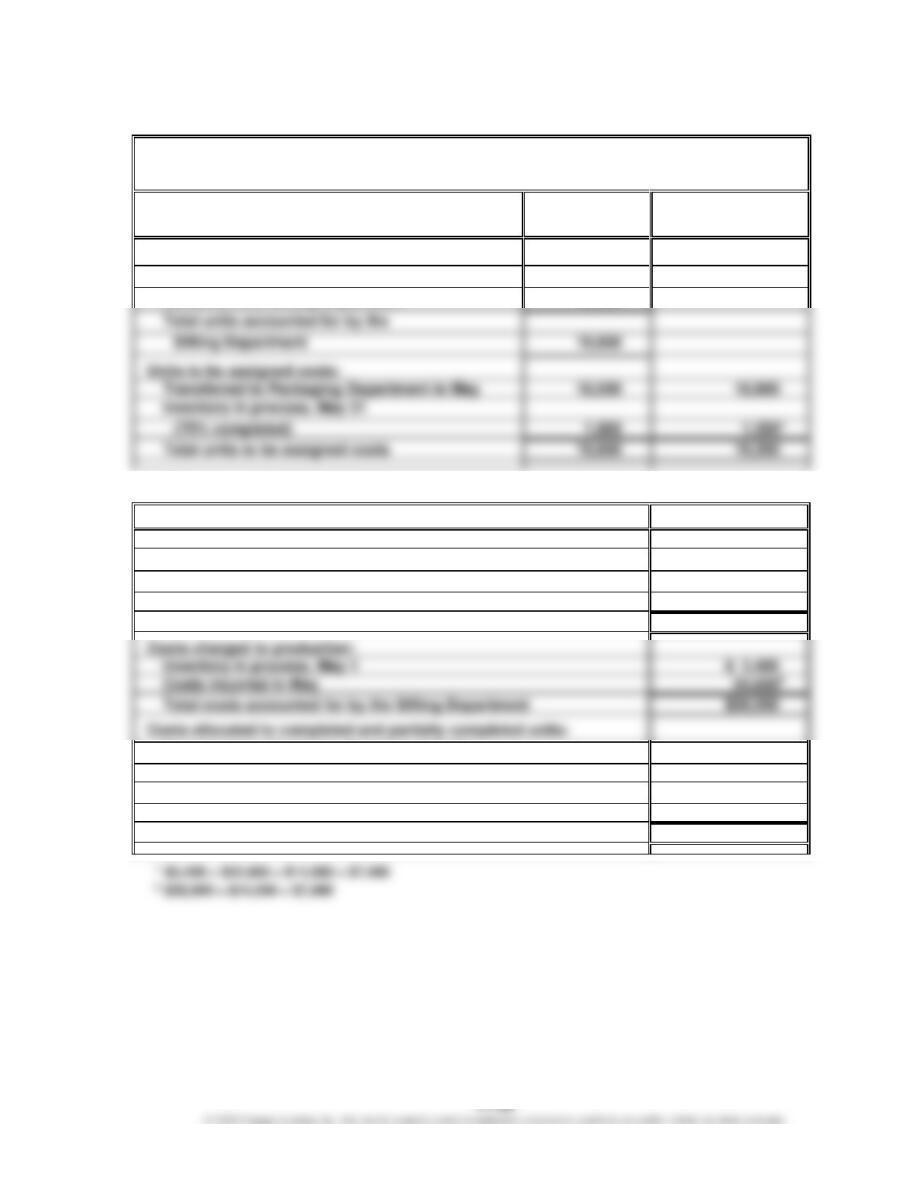
Appendix Prob. 17–5B (FIN MAN); Appendix Prob. 3–5B (MAN)
Blue Ribbon Flour Company
Cost of Production Report—Sifting Department
For the Month Ended May 31
UNITS
Whole
Units
Equivalent Units
of Production
Units charged to production:
Inventory in process, May 1
1,500
Received from Milling Department
18,300
Total units accounted for by the
19,800
Units to be assigned costs:
Transferred to Packaging Department in May
Inventory in process, May 31
(75% completed)
Total units to be assigned costs
*75% units × 1,800 units
COSTS
Costs
Cost per equivalent unit:
Total costs for May in Sifting Department
$58,0501
Total equivalent units
÷19,350
Cost per equivalent unit
$ 3.00
Inventory in process, May 1
Costs incurred in May
Total costs accounted for by the Sifting Department
$58,050
Transferred to Packaging Department in May
(18,000 units × $3.00)
$54,000
Inventory in process, May 31
(1,800 units × 75% × $3.00)
4,050
Total costs assigned by the Sifting Department
$58,050
CHAPTER 17 (FIN MAN); CHAPTER 3 (MAN) Process Cost Systems
MAKE A DECISION
MAD 17–1 (FIN MAN); MAD 3–1 (MAN)
a.
May
June
July
Resin cost per foot
$0.54
$0.57
$0.60
$483,000 ÷
$630,000 ÷
$672,000 ÷
900,000 ft.
1,100,000 ft.
1,120,000 ft.
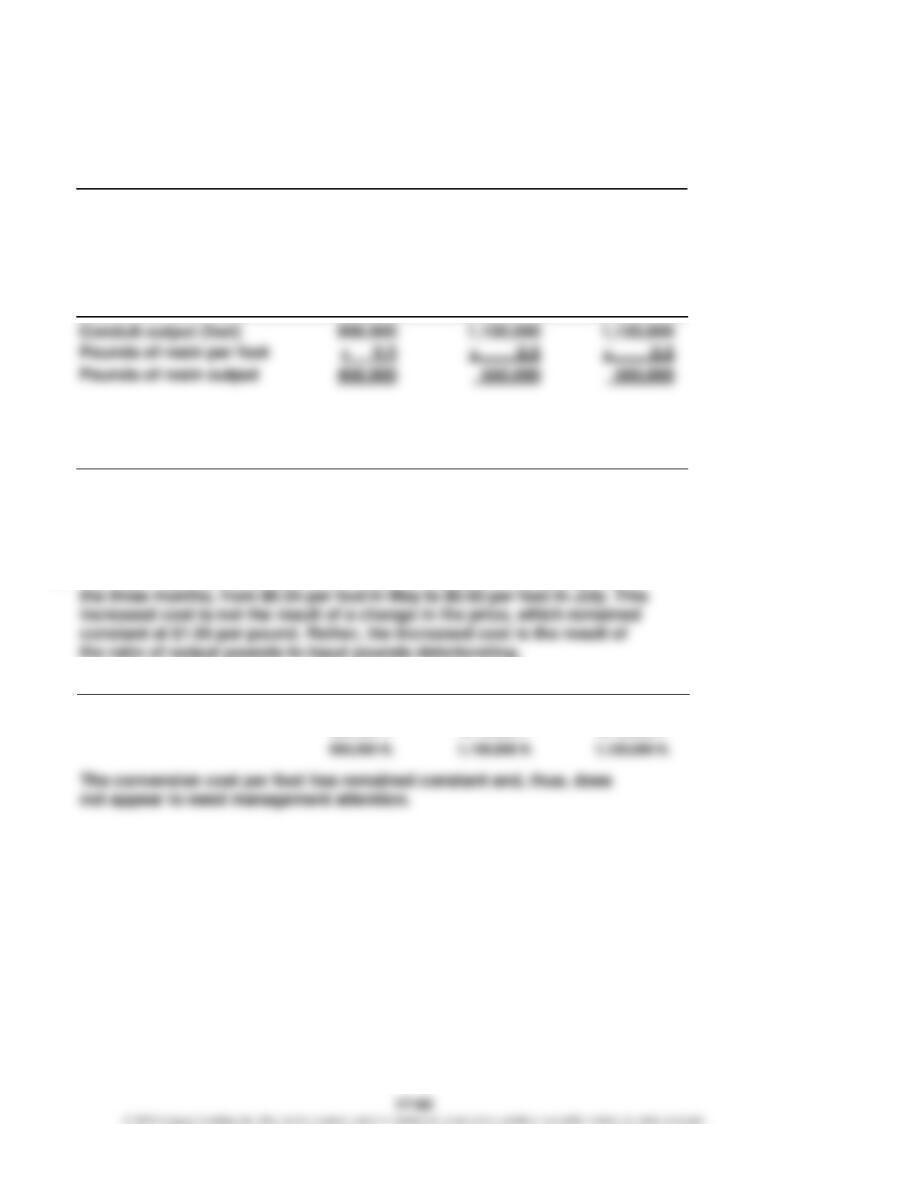
b.
Pounds of resin:
May
June
July
Conduit output (feet)
Ratio of output pounds to input pounds:
May
June
July
Resin output pounds
divided by input pounds
97.8%
91.7%
87.5%
450,000 ÷
550,000 ÷
560,000 ÷
460,000
600,000
640,000
c. The resin materials cost per foot of finished product is increasing over
the ratio of output pounds to input pounds deteriorating.
d.
May
June
July
Conversion cost per foot
$0.10
$0.10
$0.10
$110,000 ÷
$112,000 ÷
1,100,000 ft.
1,120,000 ft.
CHAPTER 17 (FIN MAN); CHAPTER 3 (MAN) Process Cost Systems
MAD 17–2 (FIN MAN); MAD 3–2 (MAN)
Memo
To: Production Manager
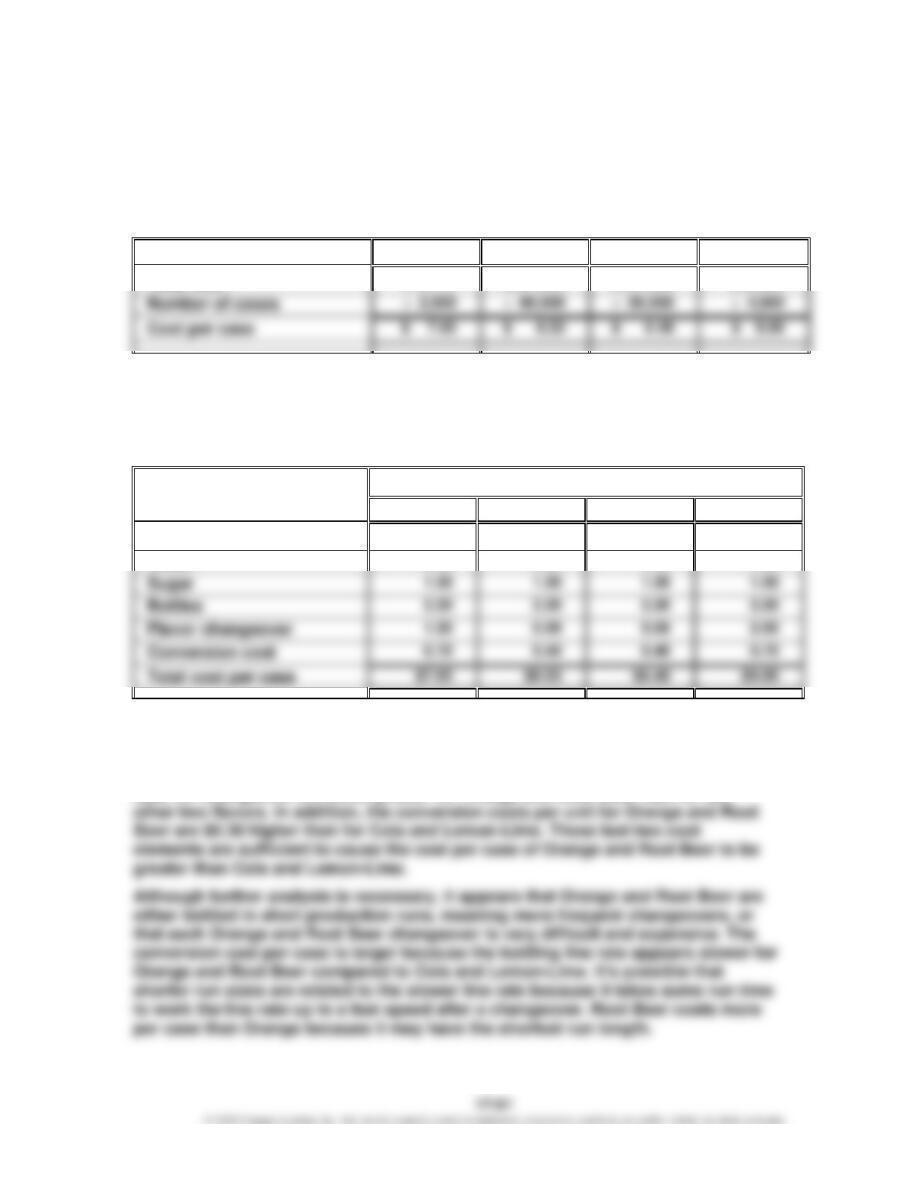
The cost of production report is used to identify the cost per case for each of the four
flavors as follows:
Orange
Cola
Lemon-Lime
Root Beer
$19,125
$391,800
$324,000
$36,000
As can be seen, the cost per case of Root Beer is significantly above the cost per
case of the other three flavors. A more detailed analysis is necessary to
understand the causes of this difference. The individual cost elements that
determine the total cost can be divided by the number of cases. This analysis
follows:
Cost per Case by Cost Element
Orange
Cola
Lemon-Lime
Root Beer
Concentrate
$1.85
$2.15
$2.10
$1.90
Water
0.70
0.40
0.40
0.70
0.50
0.50
0.50
0.50
This table indicates that the concentrate per case is actually less for Orange and
Root Beer than for Cola and Lemon-Lime. This is because the concentrate
supplier charges a higher price for the more popular flavors. The costs per case
for water, sugar, and bottles are the same for each flavor. However, the costs per
CHAPTER 17 (FIN MAN); CHAPTER 3 (MAN) Process Cost Systems
MAD 17–3 (FIN MAN); MAD 3–3 (MAN)
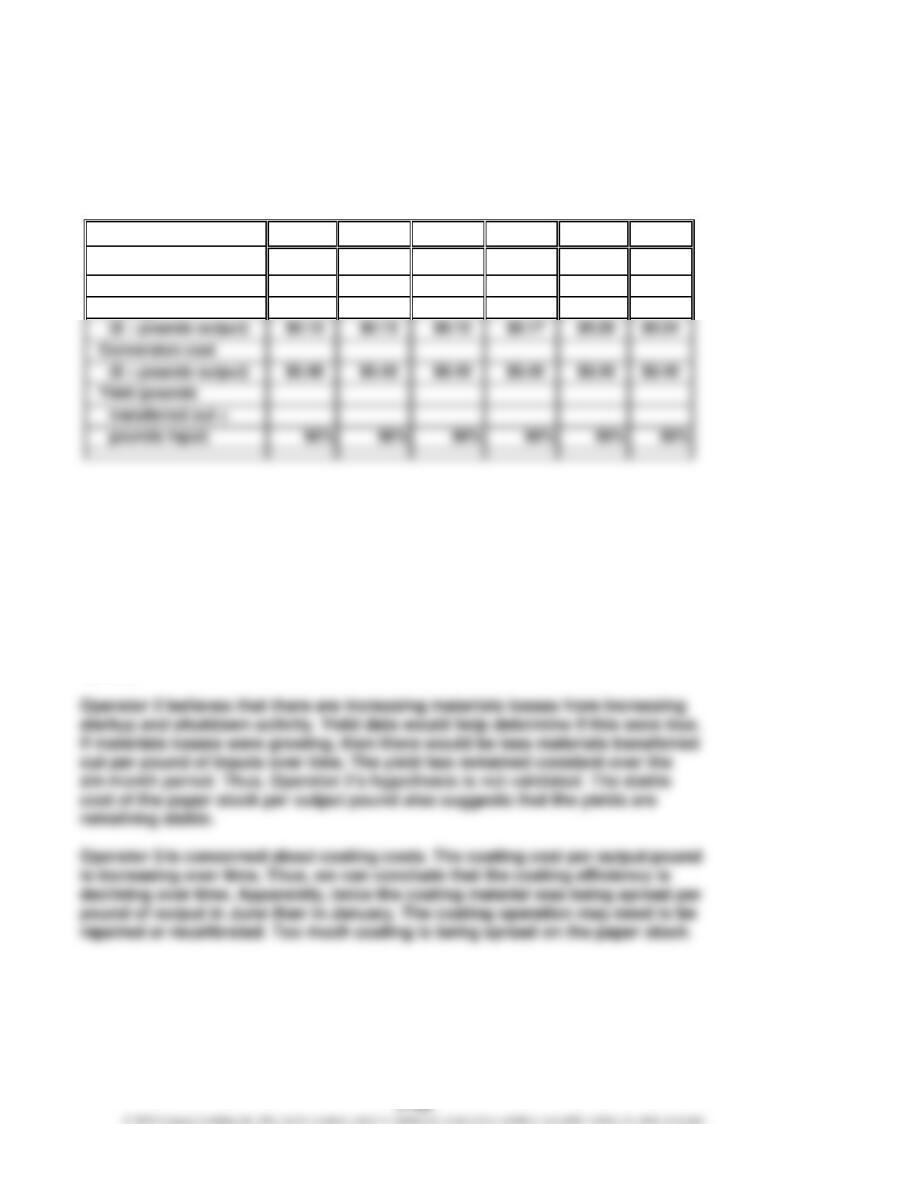
The solution to this exercise is to determine if the cost per pound trends in paper
stock, conversion, and coating costs are remaining stable over time. The following
table can be developed from the data:
a.
January
February
March
April
May
June
Paper stock
($ ÷ pounds output)
$0.70
$0.70
$0.70
$0.70
$0.70
$0.70
Coating
($ ÷ pounds output)
$0.12
$0.13
$0.15
$0.17
$0.20
$0.24
($ ÷ pounds output)
$0.40
$0.40
$0.40
$0.40
$0.40
$0.40
transferred out ÷
The cost per pound information is determined by dividing the costs by the
pounds transferred out. The yield is determined by dividing the pounds
transferred out by the pounds input.
b. Operator 1 believes that energy consumption is becoming less efficient. The
energy cost is part of the conversion cost. The conversion cost per output
pound has remained constant for the six months. If the energy efficiency were
declining, it would take more energy per pound of output over time. Thus, we
would expect to see the conversion rate per pound increasing if Operator 1 were
correct.
CHAPTER 17 (FIN MAN); CHAPTER 3 (MAN) Process Cost Systems
MAD 17–4 (FIN MAN); MAD 3–4 (MAN)
This case is abstracted from a real situation, where higher raw materials costs due
to tin content were more than offset by lower energy costs. The cost system used in
Apr.
May
June
July
Aug.
Sept.
Materials cost per unit ……………..
$0.28
$0.29
$0.30
$0.31
$0.32
$0.33
Energy cost per unit ………………..
0.26
0.24
0.22
0.20
0.19
0.16
Total cost per unit …………………..
$0.54
$0.53
$0.52
$0.51
$0.51
$0.49
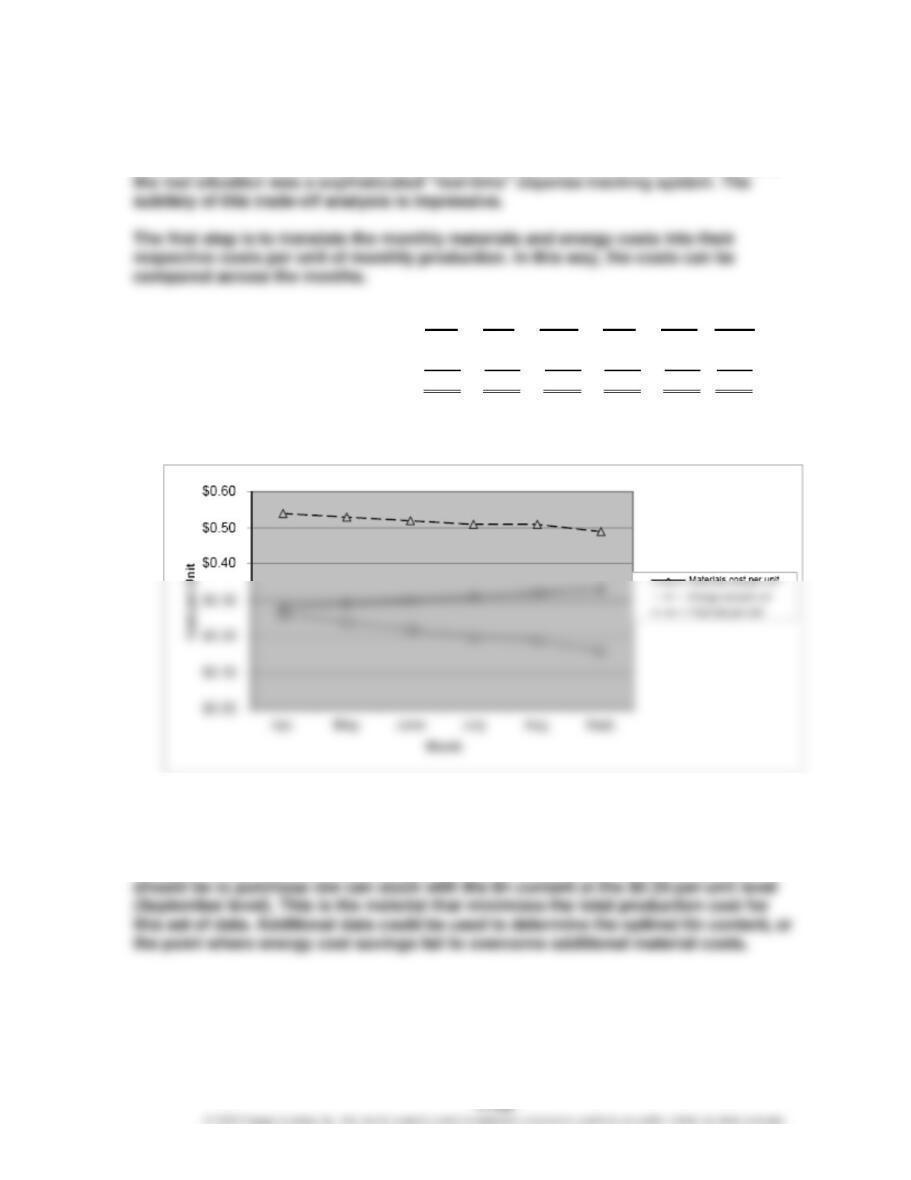
The graph below shows the total unit cost data for each month.
The graph reveals that the tin content and energy costs are inversely related. That is,
as the materials cost increased due to higher tin content, the energy costs dropped
by more. In fact, the total cost line shows that the energy savings exceeds the
additional materials cost, due to higher tin content. Thus, the recommendation
CHAPTER 17 (FIN MAN); CHAPTER 3 (MAN) Process Cost Systems
TAKE IT FURTHER
TIF 17–1 (FIN MAN); TIF 3–1 (MAN)
1. This case comes from a real story. In the real story, the first reduction in chips had no
impact on market demand. The manager was promoted, and the next manager
2. There are several options that you, as the controller, have:
a. Do nothing. This is a safe strategy. It would be highly unlikely that failing to reveal
this information to anybody would ever be discovered or “pinned” on you.
Unfortunately, this is one of those situations where silence has very little penalty,
yet speaking up entails some risk. However, silence may not be the best option.
Silence may allow the product quality erosion to continue, which could be harmful
with Brandon.
c. Talk to the vice president. You could also go right over Brandon’s head to the vice
president. This strategy might label you as “not a team player,” so some caution is
in order here. You might get Brandon in trouble, or you may get yourself in some
trouble. This is probably not the best first move. It is within Brandon’s authority to
make the chip decision, so you are, in a sense, second- guessing Brandon when
you go to the vice president. You could be accused of being out of your expertise.
After all, what do you know about chips and the marketplace?
CHAPTER 17 (FIN MAN); CHAPTER 3 (MAN) Process Cost Systems
TIF 17–2 (FIN MAN); TIF 3–2 (MAN)
This activity can be accomplished with multiple groups assigned to one or more of the
industry categories. Assign at least one group to each industry category. (Some are
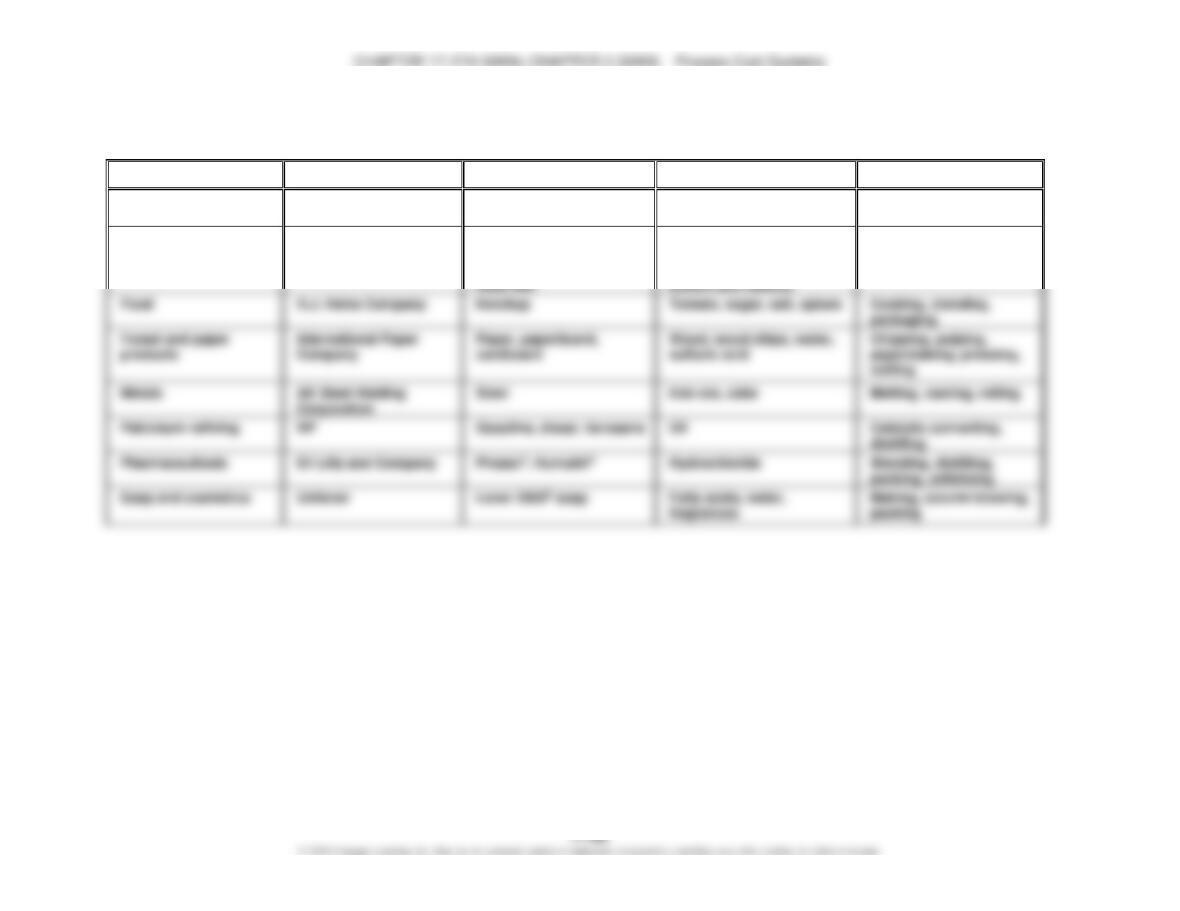
TIF 17–2 (FIN MAN); TIF 3–2 (MAN) (Concluded)
Industry Category
Example Company
Products
Materials
Processes
Beverages
PepsiCo, Inc.
Pepsi, Diet Pepsi
Sugar, carbonated water,
concentrate
Mixing, bottling
Chemicals
E. I. du Pont de Nemours
and Company
Stain master®, Kevlar®,
Lycra®, Teflon®,
refrigerants, electronic
materials
Petroleum refining
Gasoline, diesel, kerosene
Oil
Catalytic converting,
distilling
Petroleum and
petroleum-based
intermediates
Reaction, blending,
distilling, extruding
CHAPTER 17 (FIN MAN); CHAPTER 3 (MAN) Process Cost Systems
TIF 17–3 (FIN MAN); TIF 3–3 (MAN)
Memo
To: Jamarcus Bradshaw
From: Ima Student
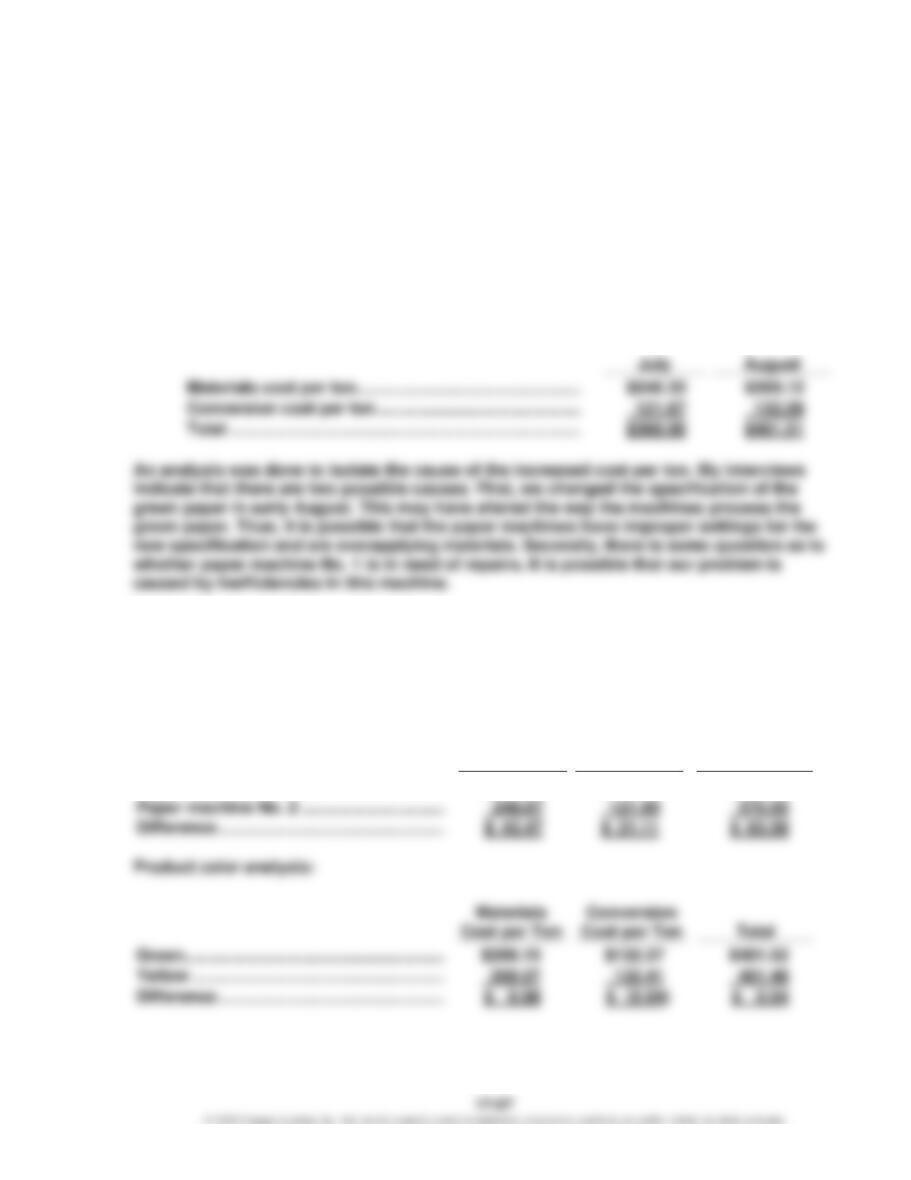
Re: Analysis of August Increase in Unit Cost for Papermaking Department
The increase in the unit costs from July to August occurred for both the materials (pulp
and chemicals) and conversion costs in the Papermaking Department, as indicated in the
table below.
Materials cost per ton …………………………………………
Conversion cost per ton ……………………………………..
Fortunately, we run both colors on paper machine No. 1. Thus, we can separate the analysis
between these two possible explanations. I have provided the following cost- per-ton data
for the two paper machines and the two product colors:
Paper machine analysis:
Materials
Cost per Ton
Conversion
Cost per Ton
Total
Paper machine No. 1 ………………………….
$290.54
$143.04
$433.58
Paper machine No. 2 ………………………….
Difference ………………………………………….
Cost per Ton
Green ………………………………………………..
$269.15
TIF 17–3 (FIN MAN); TIF 3–3 (MAN) (Continued)
The results are clear. Paper machine No. 1 had a much higher materials and conversion
cost per ton in August. Apparently, the paper machine is overapplying pulp. This is
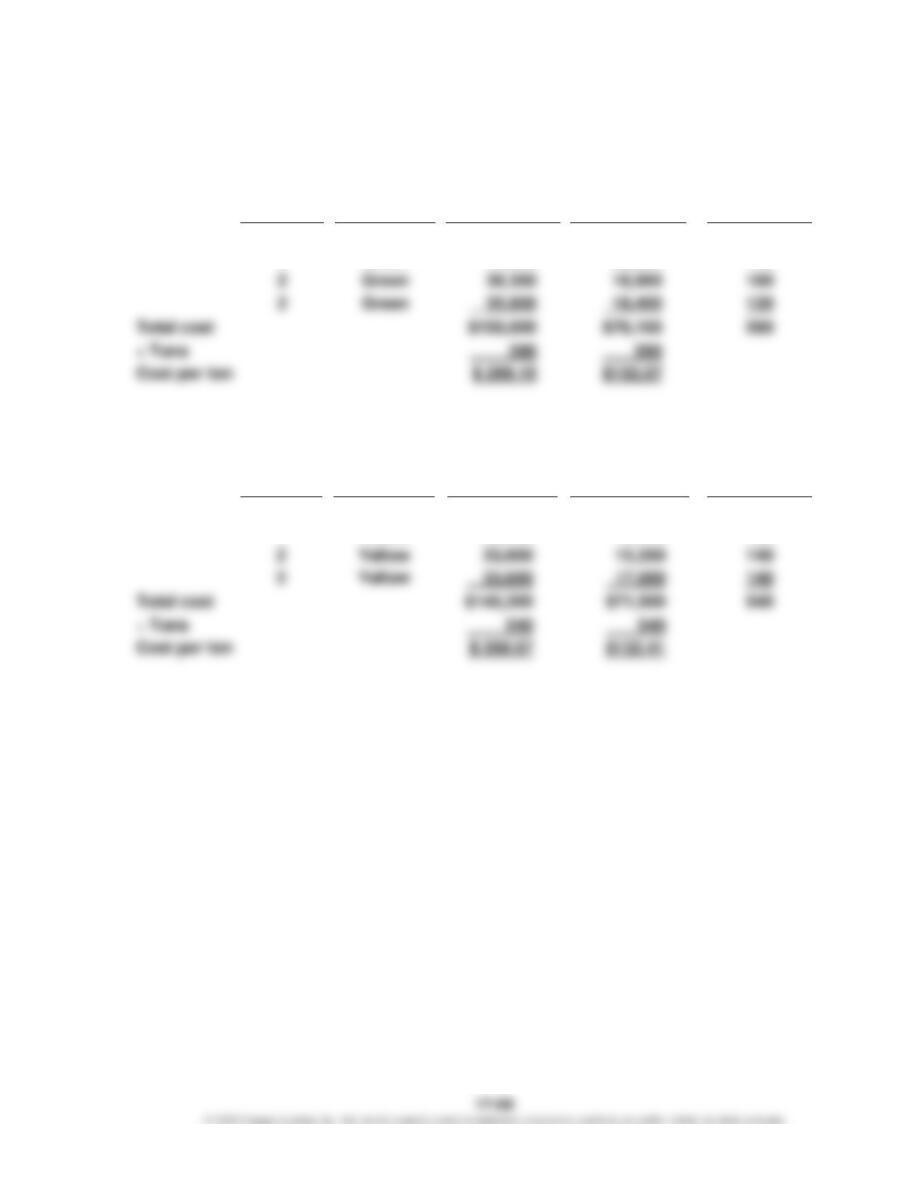
Supporting calculations:
Machine No. 1:
Materials
Conversion
Machine
Color
Cost
Cost
Tons
1
Green
$ 40,300
$18,300
150
1
Yellow
41,700
21,200
140
1
Yellow
120
560
Machine No. 2:
Machine
Color
Materials
Cost
Conversion
Cost
Tons
2
Yellow
15,200
2
Green
$ 38,300
$18,900
160
CHAPTER 17 (FIN MAN); CHAPTER 3 (MAN) Process Cost Systems
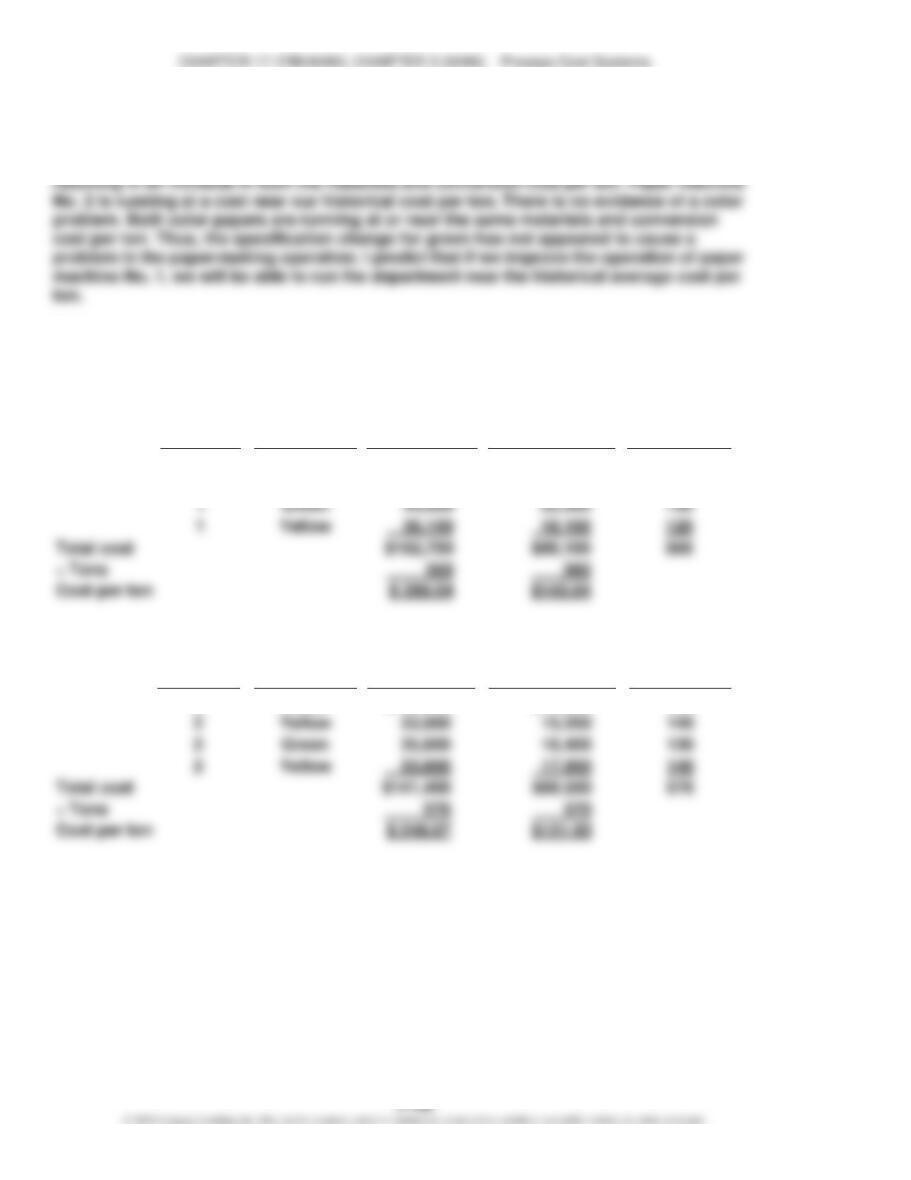
TIF 17–3 (FIN MAN); TIF 3–3 (MAN) (Concluded)
Green Paper Color:
Materials
Conversion
Machine
Color
Cost
Cost
Tons
1
Green
$ 40,300
$18,300
150
590
1
Green
44,600
22,500
150
Yellow Paper Color:
Materials
Conversion
Machine
Color
Cost
Cost
Tons
1
Yellow
$ 41,700
$21,200
140
1
Yellow
36,100
18,100
120
TIF 17–4 (FIN MAN); TIF 3–4 (MAN)
a. This accounting procedure has the effect of rewarding the production of broke.
b. The accounting for broke that is typical in the industry fails to account for the
total impact of broke. It is true that the use of recycled materials may reduce the
direct materials cost to the operation. However, such a view is very limited. For
example, the production of broke has a cost. Machine capacity was used to
is not captured by most accounting systems in the accounting for broke.
There are other hidden costs. Broke production makes the total amount
produced difficult to predict. As a result of this source of variation (broke),
production schedules are difficult to maintain. For example, if a particular
production run has a high amount of broke, then the scheduled run will need to
CHAPTER 17 (FIN MAN); CHAPTER 3 (MAN) Process Cost Systems
CERTIFIED MANAGEMENT ACCOUNTANT (CMA®)
EXAMINATION QUESTIONS (ADAPTED)
1.
d.
Krause’s equivalent units for conversion costs are 92 units, computed as
follows:
Beginning work in process (20 units × 40%) ………………………………
8
units
Units started and completed (100 units – 20 units) ……………………..
80
Ending work in process (10 units × 40%) …………………………………..
4
Total …………………………………………………………………………………..
92
units
2.
a.
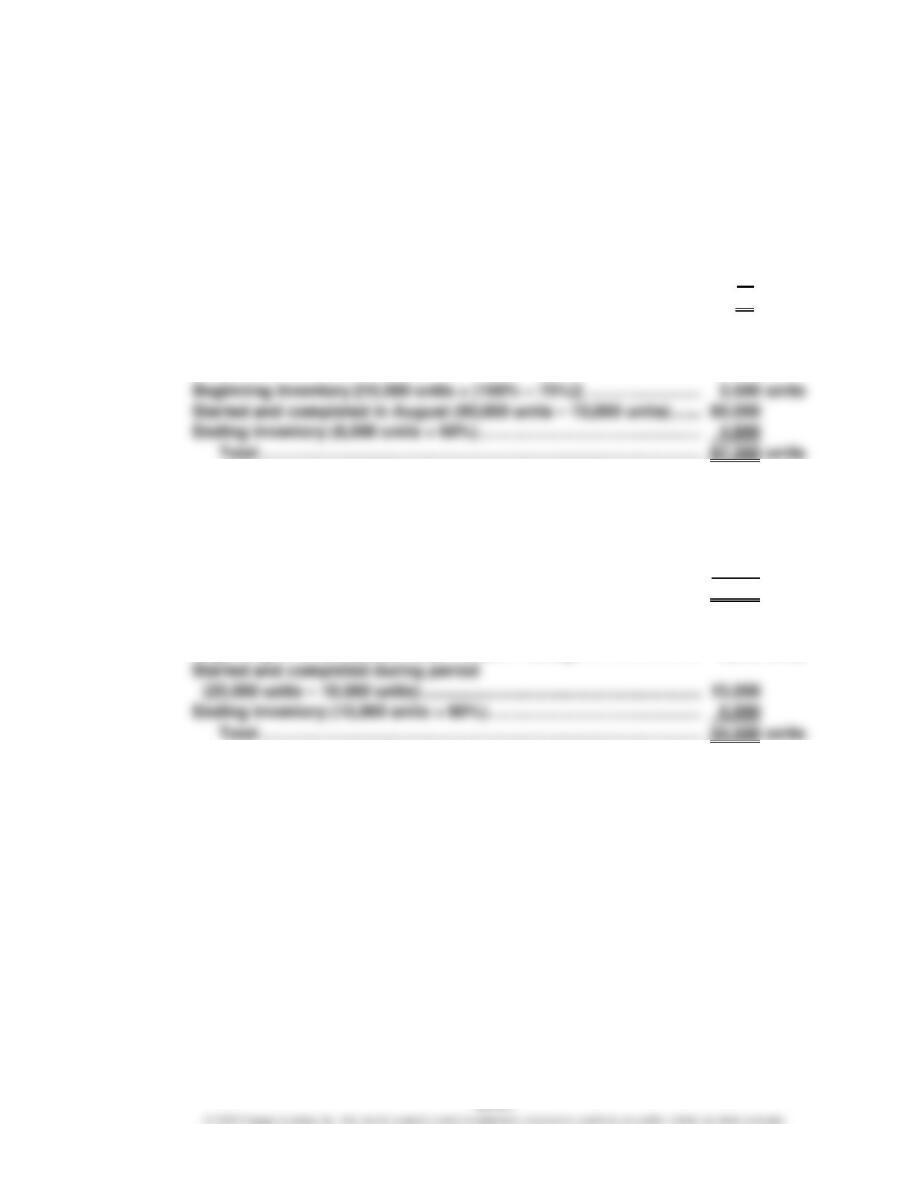
Jones’s equivalent units for conversion costs is 87,300 units, computed as
follows:
Beginning inventory [10,000 units × (100% – 75%)] …………………….
2,500
units
Started and completed in August (90,000 units – 10,000 units) ……
80,000
Total …………………………………………………………………………………..
87,300
units
3.
c.
Kimbeth’s equivalent units for conversion costs is 98,400 units, computed as
follows:
Beginning inventory [16,000 units × (100% – 20%)] …………………….
12,800
units
Started and completed in May (100,000 units – 24,000 units) ………
76,000
Ending inventory (24,000 units × 40%) ……………………………………….
9,600
Total …………………………………………………………………………………..
98,400
units
4.
c.
Equivalent units for the period are 24,500 units, computed as follows:
Started and completed during period
15,000
Total …………………………………………………………………………………..
24,500
units
Beginning inventory [5,000 units × (100% – 30%)] ………………………
3,500
units