Unlock document.
This document is partially blurred.
Unlock all pages and 1 million more documents.
Get Access
Case 3.2 (a)
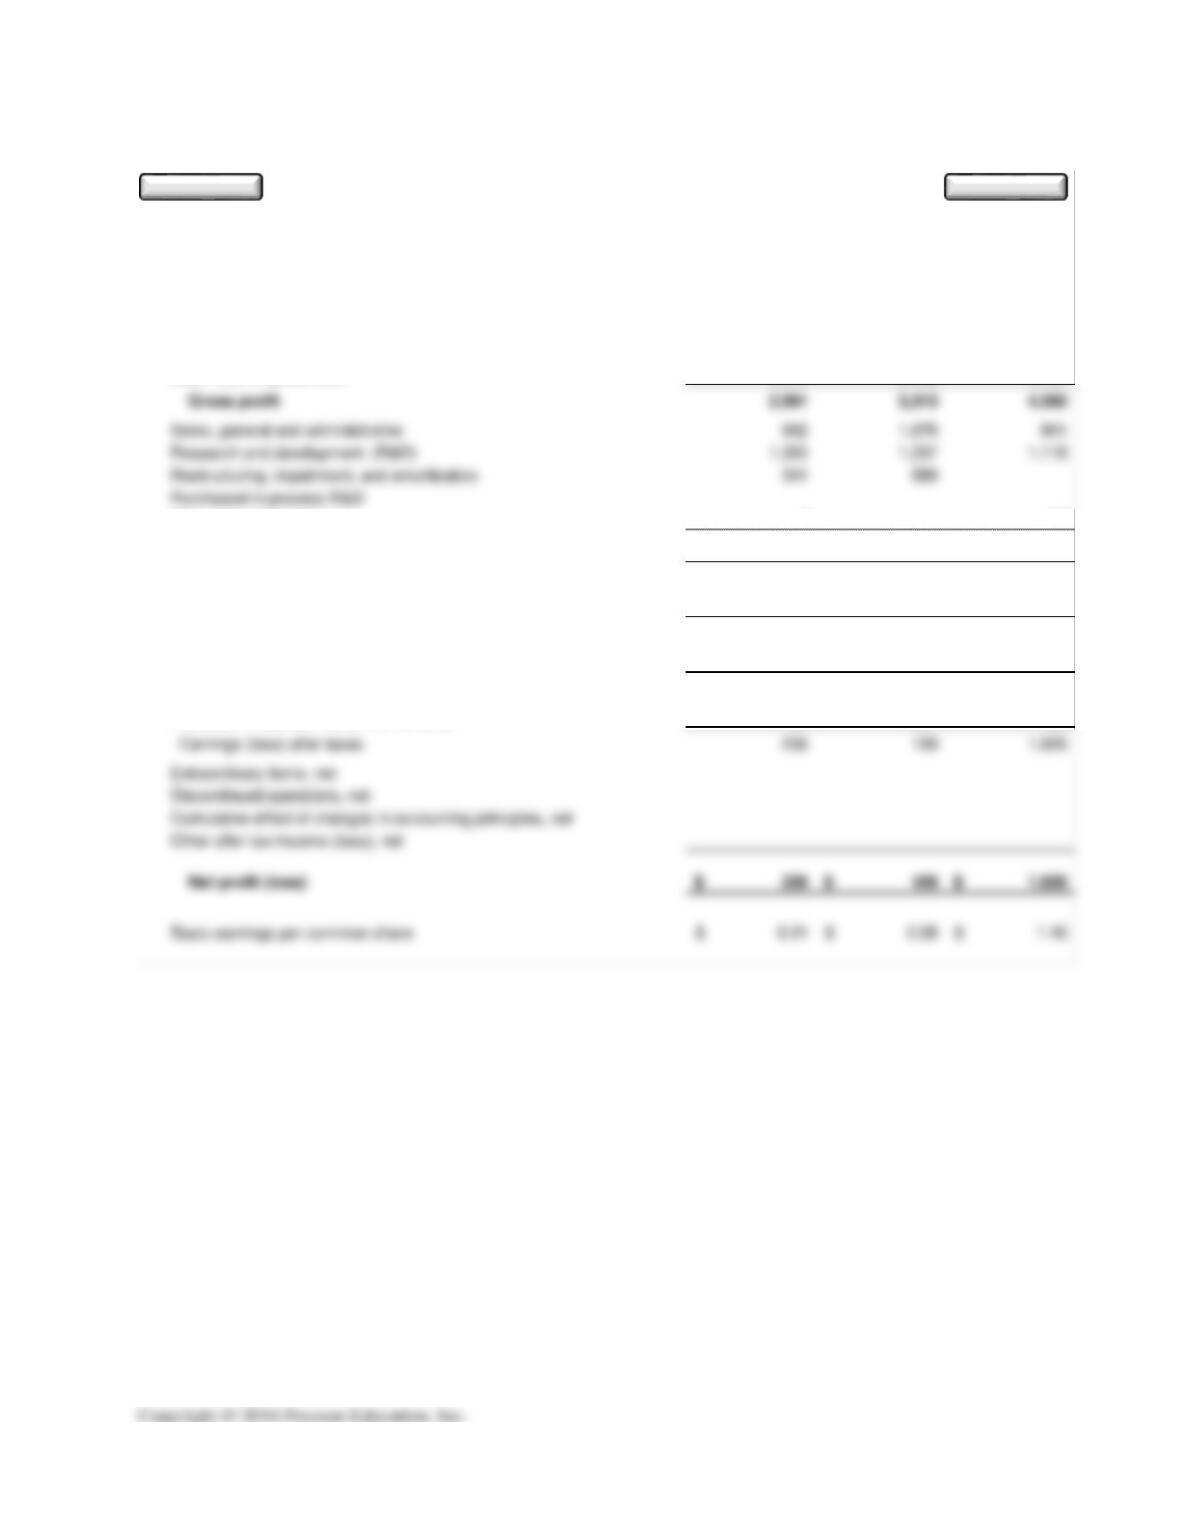
Oct 27, 2013 Oct 28, 2012 Oct 30, 2011
Net sales 7,509$ 8,719$ 10,517$
Less: Cost of goods sold 4,518 5,406 6,157
Other operating expenses (4) (57)
Total operating expenses 2,559 2,902 1,962
Operating profit (loss) 432 411 2,398
Other income (expenses), net excluding interest expense 13 39
Earnings (loss) before interest and taxes 445 411 2,437
Interest expense 95 95 59
Earnings (loss) before taxes 350 316 2,378
Provision for (benefit from) income taxes 94 207 452
Results for the Years Ending
Applied Materials (AMAT / NASDAQ)
Annual Consolidated Income Statement
Amou nts Rou n d ed to : M illion s ( excep t p er sh are am ou nts)
Edit
Clear
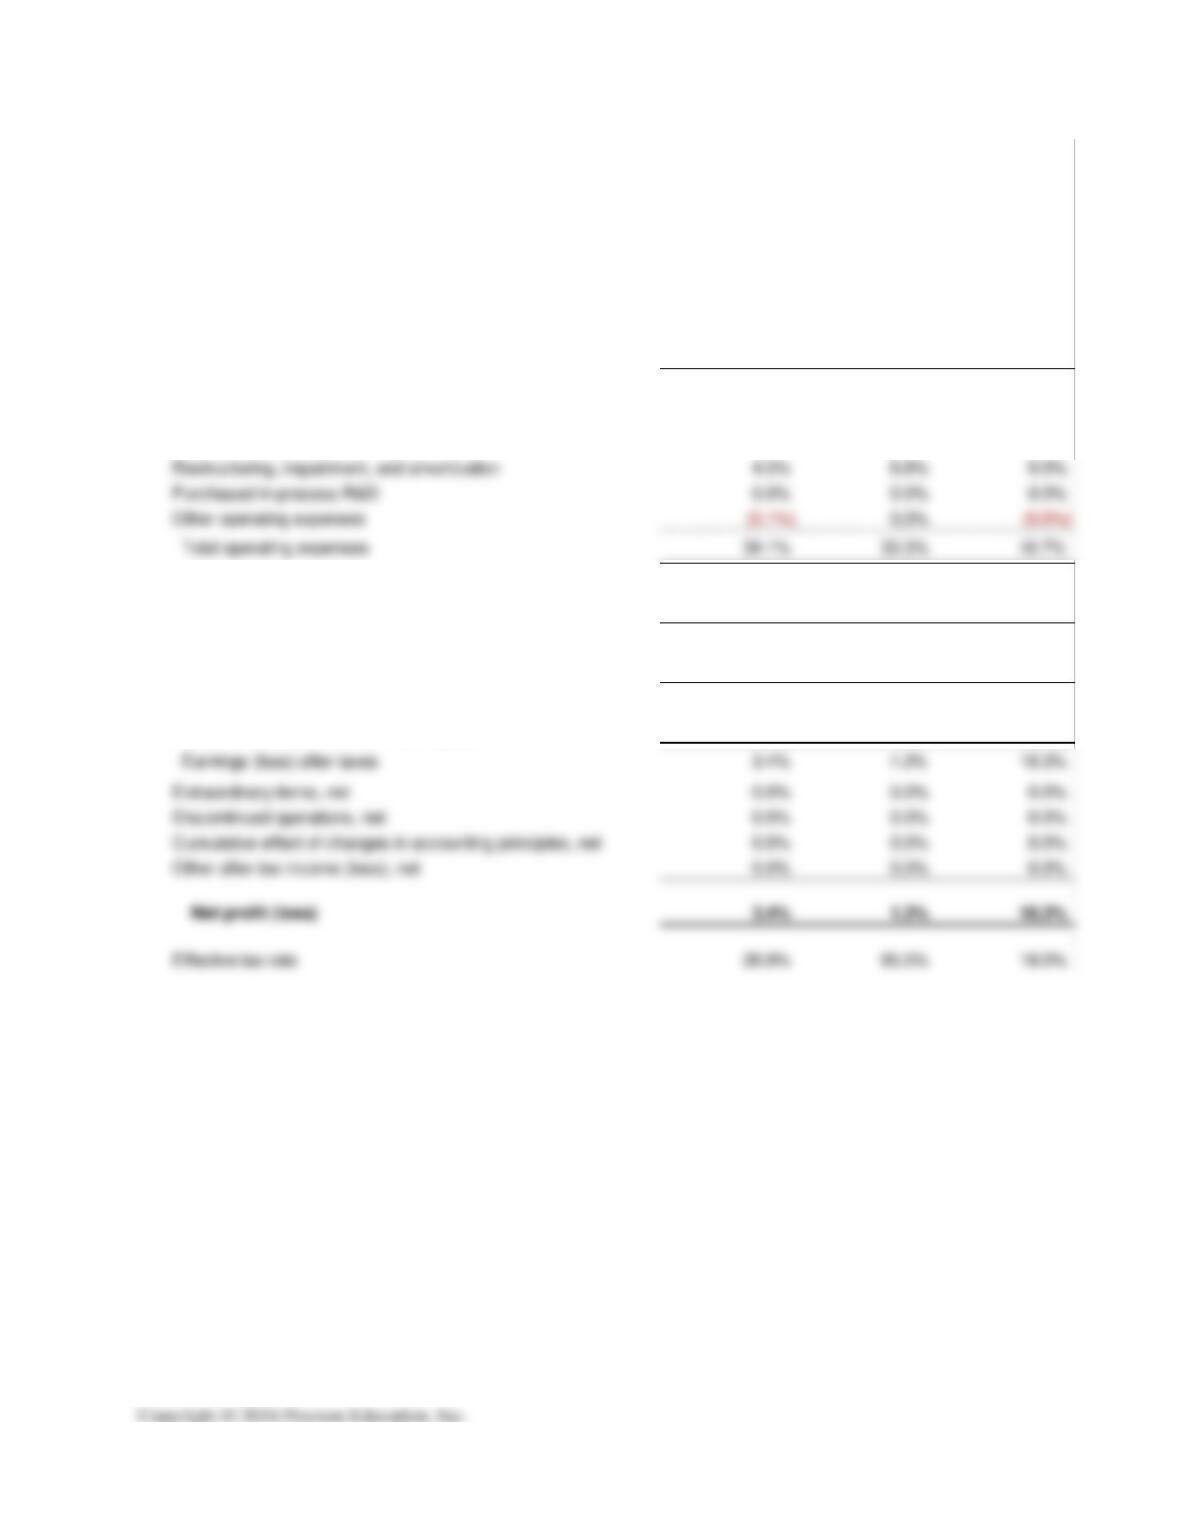
Oct 27, 2013 Oct 28, 2012 Oct 30, 2011
Net sales 100.0% 100.0% 100.0%
Less: Cost of goods sold 60.2% 62.0% 58.5%
Gross profit 39.8% 38.0% 41.5%
Sales, general and administrative 12.0% 12.3% 8.6%
Research and development (R&D) 17.6% 14.2% 10.6%
Operating profit (loss) 5.8% 4.7% 22.8%
Other income (expenses), net excluding interest expense 0.2% 0.0% 0.4%
Earnings (loss) before interest and taxes 5.9% 4.7% 23.2%
Interest expense 1.3% 1.1% 0.6%
Earnings (loss) before taxes 4.7% 3.6% 22.6%
Provision for (benefit from) income taxes 1.3% 2.4% 4.3%
Results for the Years Ending
Applied Materials (AMAT / NASDAQ)
Annual Common Size Income Statement
S u mmary p ercen tag es in ital ics will n ot f oot due to rou n ding
(b) Applied Materials’ (AMAT) sales decreased 14% from 2012 to 2013, and
17% from 2011 to 2012. AMAT has four distinct segments: Silicon Systems
Group, Applied Global Services, Display and Energy and Environmental
Solutions. The only segment with increasing sales in 2013 was the Display
Gross profit margin decreased in 2012, but recovered somewhat in 2013. Despite
lower sales in 2013, gross profit margin increased due to lower costs, lower
inventory charges and a favorable product mix. The decrease in gross profit margin
in 2012 was a result of lower sales (AMAT has fixed costs), higher inventory
charges and costs associated with the Varian acquisition.
impairment charges.
AMAT has increased research and development (R&D) expenditures in order to
maintain a competitive advantage. In 2013 the firm increased their investments in
300mm product development, developed new applications to enable chip makers to
build faster devices and deliver next-generation mobile computing power, released
next-generation defect review and classification technology, and continued to
invest in 450 mm wafer fabrication equipment. The increases in R&D in 2012
again and the firm was able to reduce costs through their restructuring programs
along with a reduction in bad debt expense as a result of lower risk exposure in
display and solar customers.
AMAT’s effective tax rate has been volatile. The non-deductibility of the goodwill
impairment charges in 2012 caused the rate to be 65.5%. The effective tax rate for
the firm, with no goodwill impairment charges, was 19% in 2011. AMAT benefits
from lower tax rates to a great extent and realized a much lower tax rate as a result
of global business in 2013. This was offset, however, by more non-deductible
goodwill impairment charges resulting in an effective tax rate of 26.9% instead of
a rate of 4.4% had impairment charges not been taken.
Case 3.3
(a)
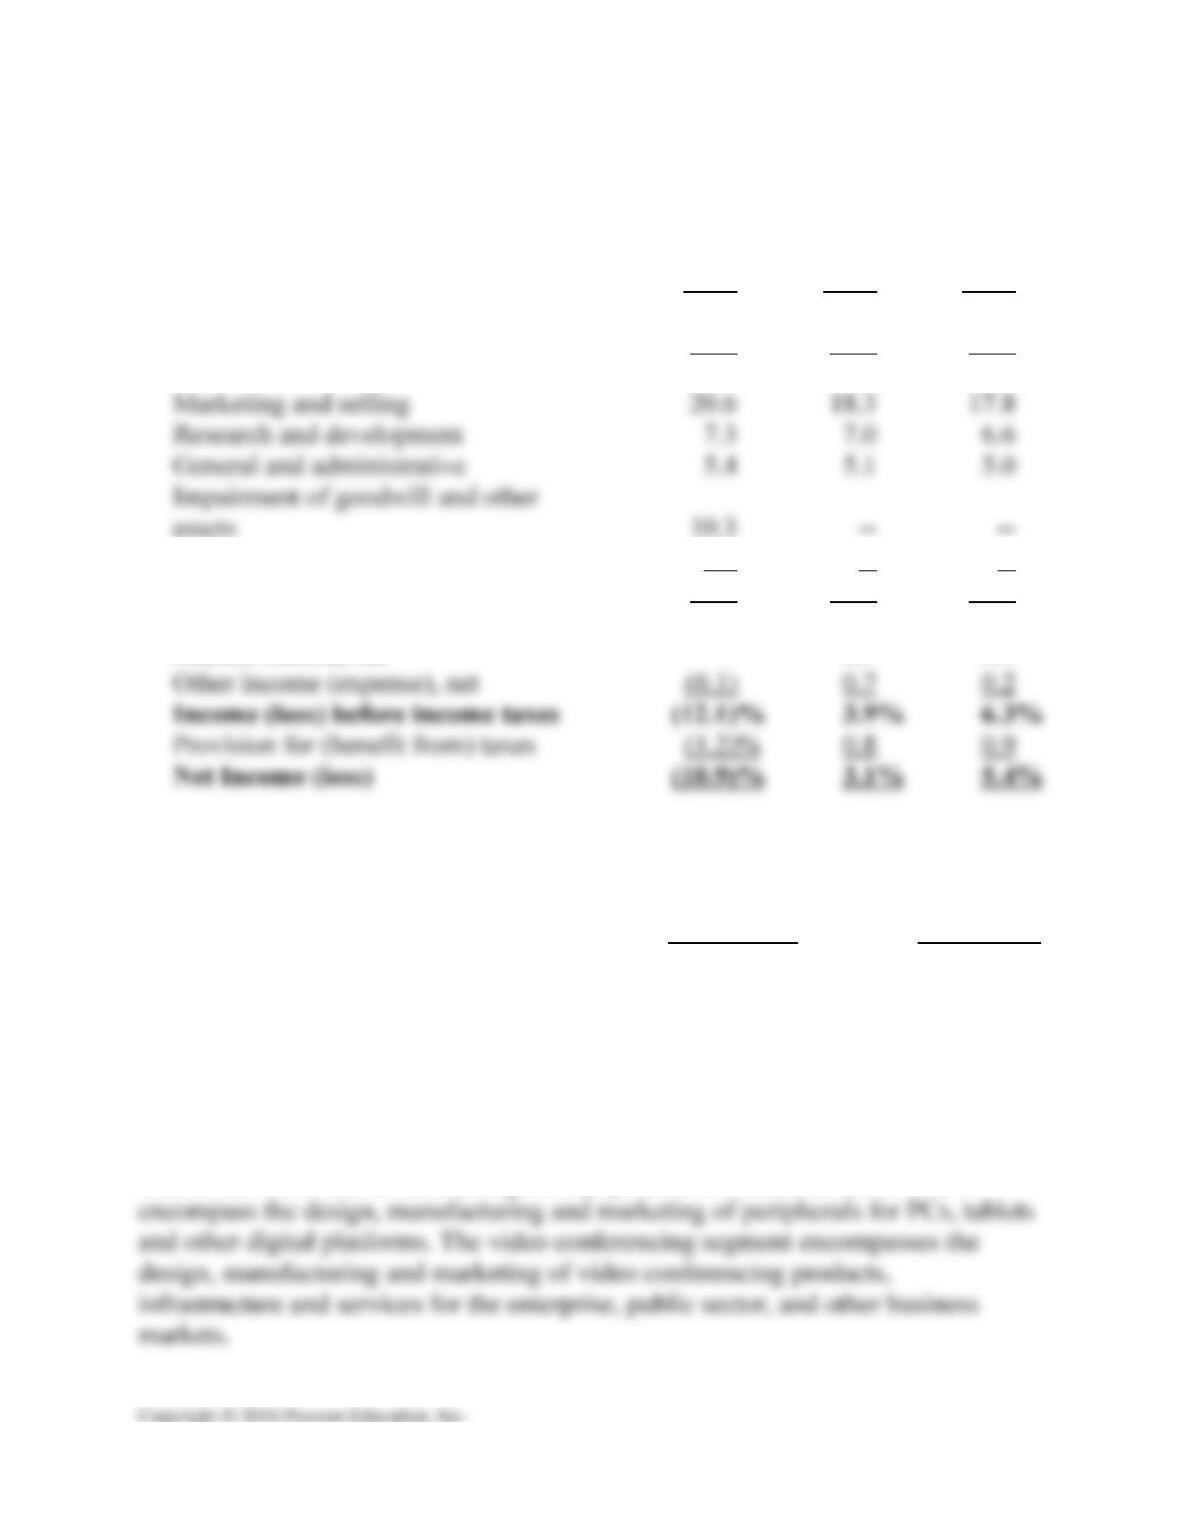
Logitech International S.A.
Common Size Income Statement
2013
2012
2011
Net sales
100.0
%
100.0
%
100.0
%
Cost of goods sold
66.3
66.5
64.6
Gross Profit
33.7
%
33.5
%
35.4
%
Restructuring charges
2.1
--
--
Total operating expenses
45.7
30.4
29.4
Operating income (loss)
(12.0)
%
3.1
%
6.0
%
Interest income, net
--
0.1
0.1
(b)
Effective tax rate
10.1
%
21.7
%
13.5
%
(c)
Growth rates
2012 - 2013
2011- 2012
Net revenues
(9.3)
%
(2.0)
%
Operating costs
36.2
%
1.6
%
Operating costs + COGS
4.8
%
1.1
%
Analysis of Income Statement
Logitech has two segments, peripherals and videoconferencing. Peripherals are
sold in the retail market and to original equipment manufacturers (OEM) and
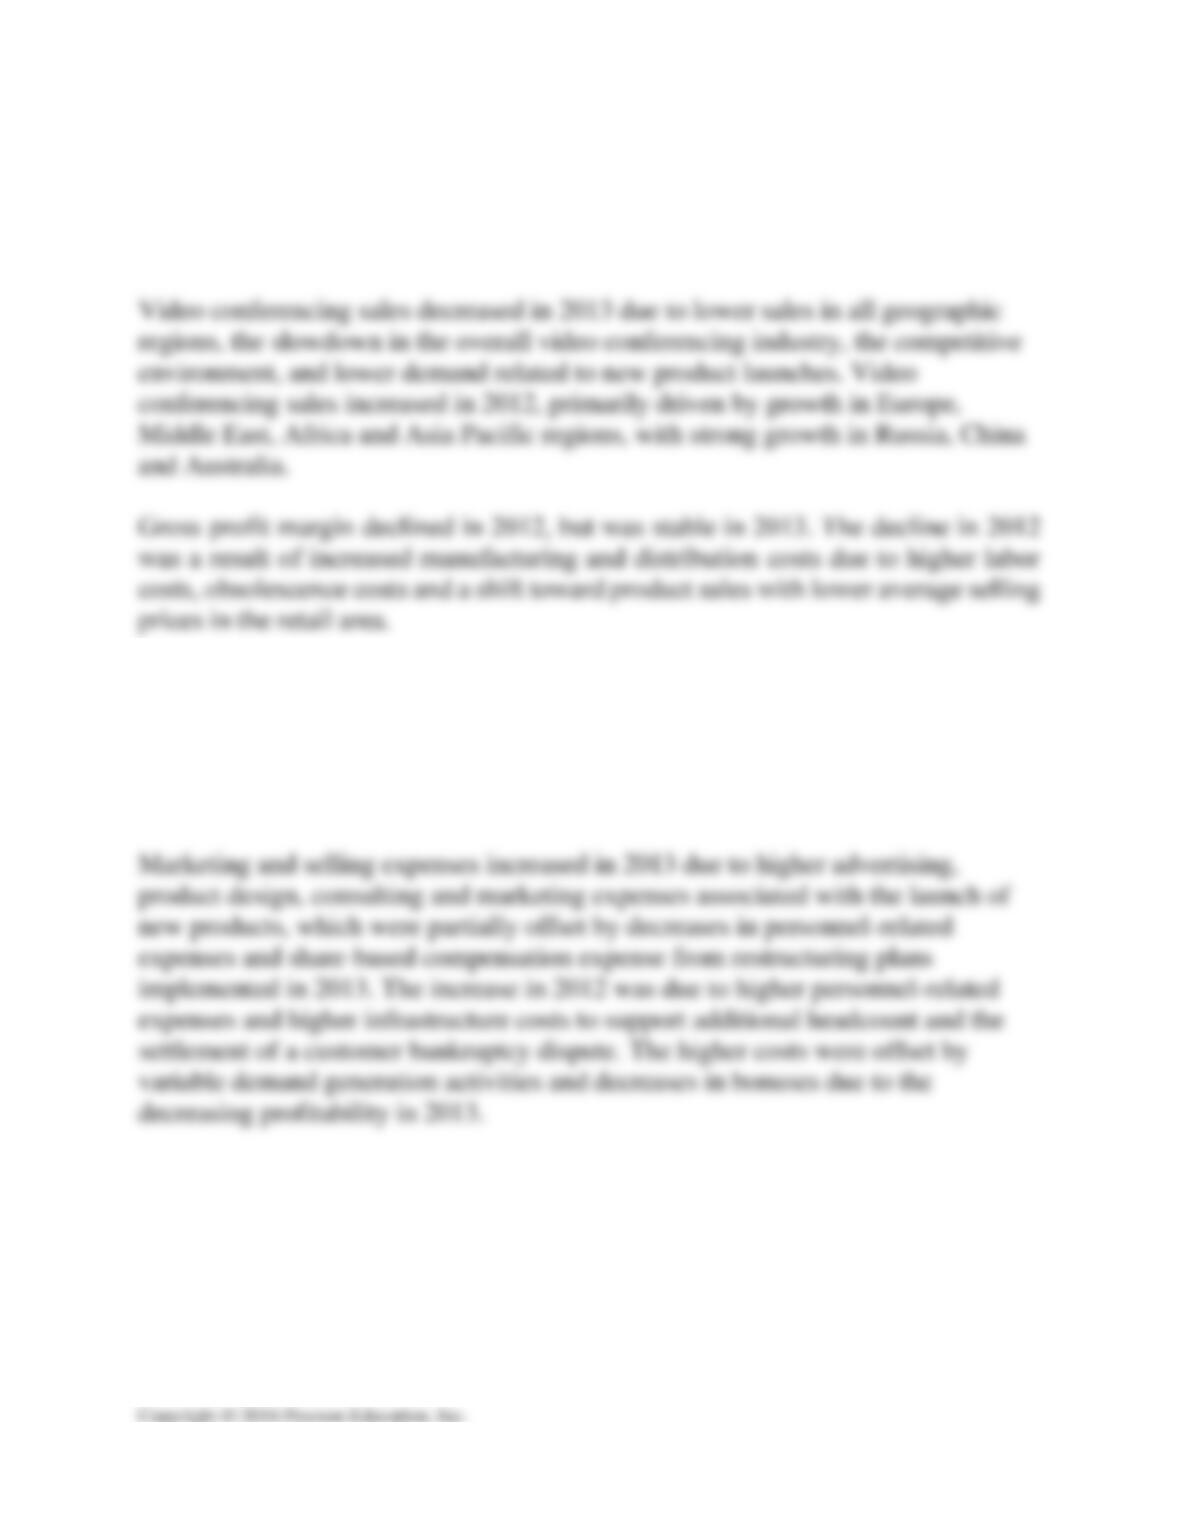
Sales have been decreasing at an increasing rate over the three year period from
2011 to 2013. Retail and OEM sales declined mainly due to lower volume and to a
lesser extent lower selling price in 2013; in 2012, volume increased but the average
selling price declined causing a slight decline in retail sales for the year.
While sales have been decreasing, operating expenses have increased all three
years with a 36% increase in 2013. Operating profit margin dropped from 6% in
2011 to a loss of 12% in 2013. The primary reason for this significant drop in
margin is a result of goodwill impairment charges and restructuring costs in 2013
related to the video conferencing area.
Research and development (R&D) expenses declined in 2013 as workforce
reductions took place due to the restructuring plan. In 2012 R&D increased due to
higher personnel-related expenses and increased investments in product
development for pointing devices, audio and digital home. These increases were
offset by decreased bonuses due to lower profitability levels; lower share-based
compensation expense, and cost containment efforts in consulting and outsourcing.
General and administrative expenses decreased in 2013 due to lower personnel-
related expenses and share-based compensation expense due to workforce
reductions due to restructuring. In 2012, these expenses increased due to higher
personnel-related expenses offset by decreased bonuses due to lower profitability
levels, lower share-based compensation expense due to executive departures.
Net profit has followed the same downward trend as operating profit margin.
Although the impairment and restructuring charges should be one-time events,
Logitech’s profitability, without consideration of these items in 2013, is still much
lower than previous years. The firm needs to determine ways to increase the
volume of sales of its products and maintain good control of operating expenses.
Case 3.4
(a)
Company Name:
Stock Ticker Symbol: HYGS
U.S. Stock Exchange: NASDAQ Variable
1 /31/ 000
Statement Year-end Dates: 12/31/2013 12/31/2012
Financial Reports Rounded to : Thousands
Check Figures:
Balance Sheet Current Assets: 31,649$ 34,607$
Total Assets: 40,070$ 41,877$
Current Liabilities: 22,528$ 26,054$
Total Stockholders' Equity: 6,161$ 4,307$
Hydrogenics Corporation
The 'Analysis ToolPak' add-in must be installed and active.
Enter data on this sheet before other financial statement information.
Clear
Dec 31, 2013 Dec 31, 2012 Jan 0, 1900
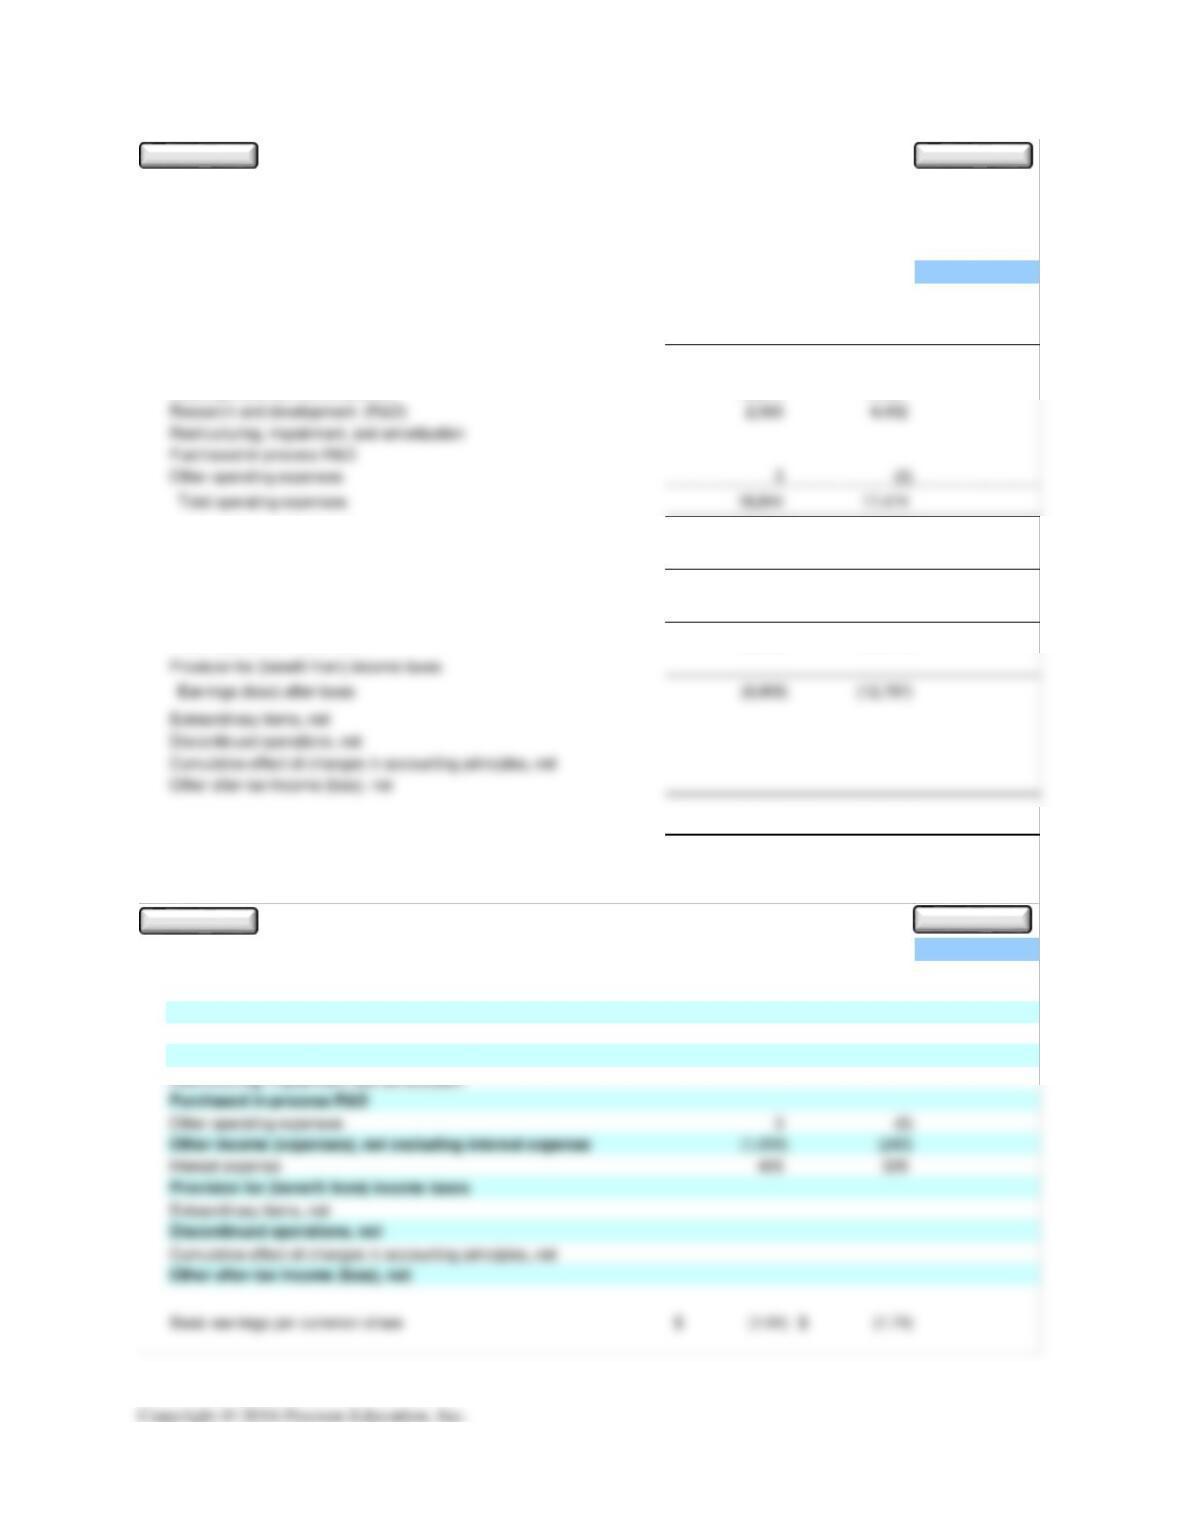
Net sales 42,413$ 31,697$
Less: Cost of goods sold 30,352 26,448
Gross profit 12,061 5,249 -
Sales, general and administrative 16,275 13,027
Operating profit (loss) (6,783) (12,225) -
Other income (expenses), net excluding interest expense (1,699) (243)
Earnings (loss) before interest and taxes (8,482) (12,468) -
Interest expense 426 329
Earnings (loss) before taxes (8,908) (12,797) -
Net profit (loss) (8,908)$ (12,797)$ -$
Basic earnings per common share (1.04)$ (1.74)$
Results for the Years Ending
Hydrogenics Corporation (HYGS / NASDAQ)
Annual Consolidated Income Statement
Amou n ts R ou n d ed to : T hou san ds ( except p er sh are amou nts)
Edit
Clear
Dec 31, 2013 Dec 31, 2012 Jan 0, 1900
Net sales 42,413$ 31,697$
Less: Cost of goods sold 30,352 26,448
Sales, general and administrative 16,275 13,027
Research and development (R&D) 2,566 4,452
Type all entries, DO NOT cut & paste values
Review
Clear
Dec 31, 2013 Dec 31, 2012 Jan 0, 1900
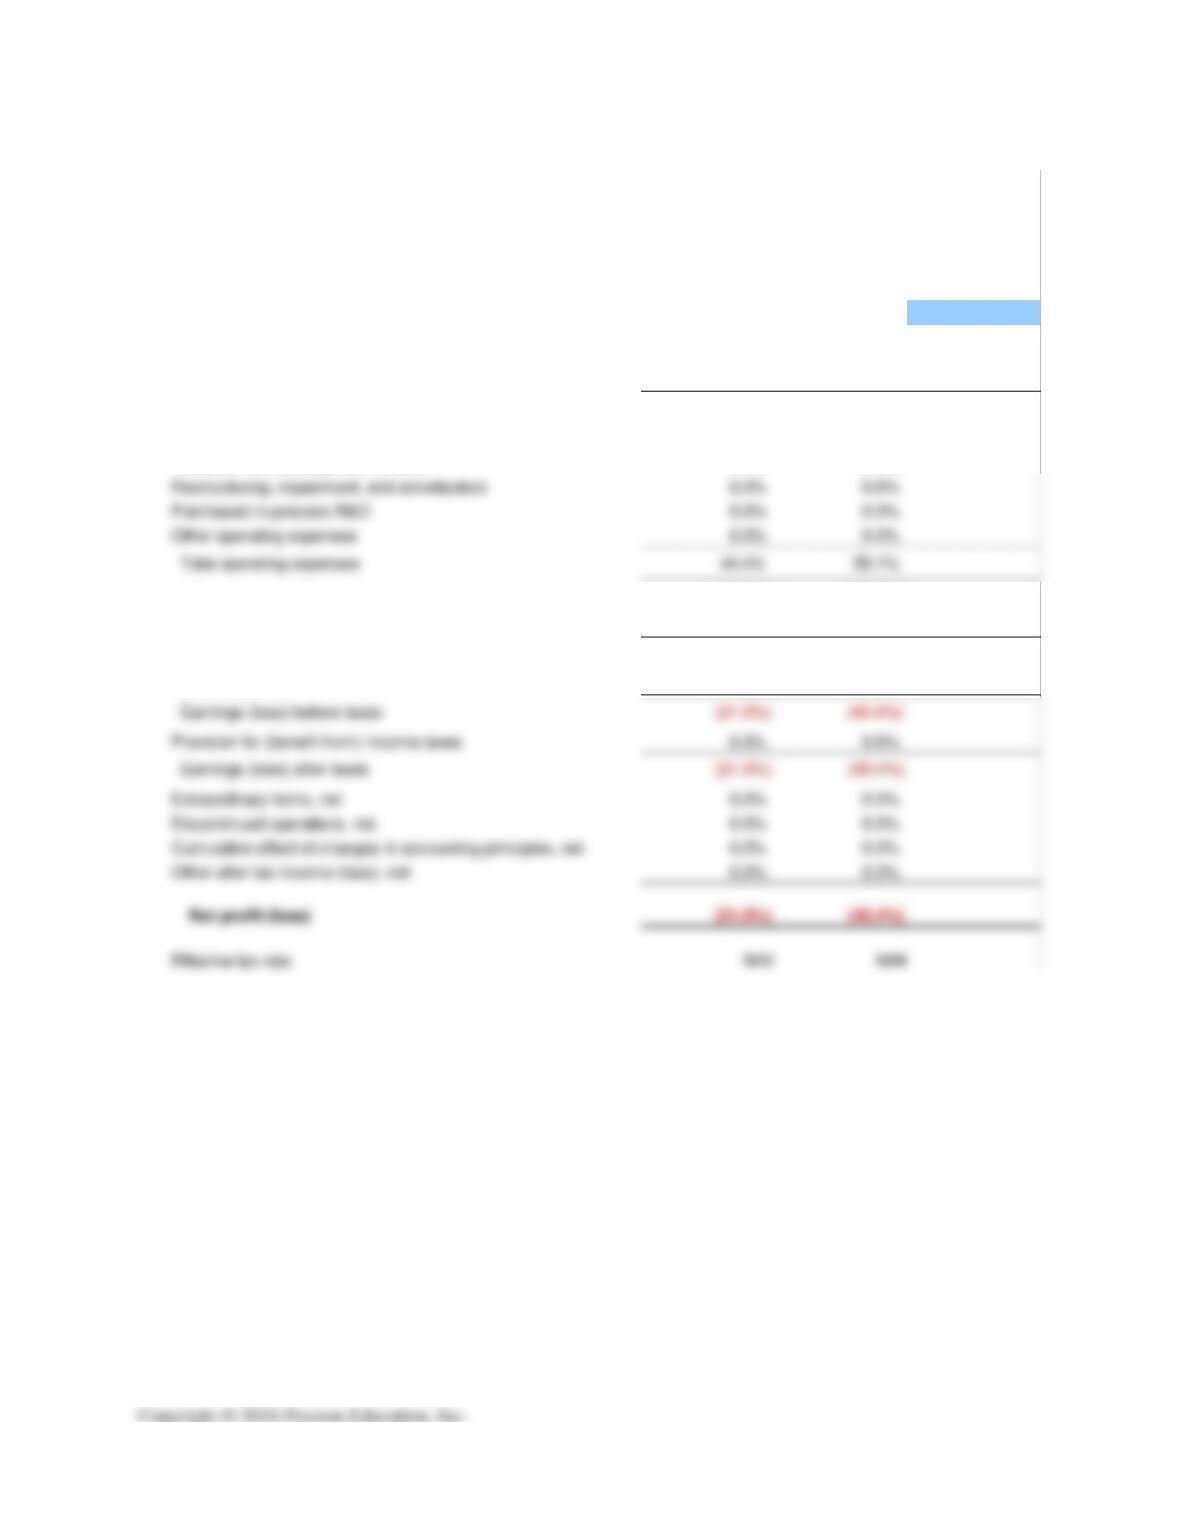
Net sales 100.0% 100.0%
Less: Cost of goods sold 71.6% 83.4%
Gross profit 28.4% 16.6%
Sales, general and administrative 38.4% 41.1%
Research and development (R&D) 6.1% 14.0%
Operating profit (loss) (16.0%) (38.6%)
Other income (expenses), net excluding interest expense (4.0%) (0.8%)
Earnings (loss) before interest and taxes (20.0%) (39.3%)
Interest expense 1.0% 1.0%
Results for the Years Ending
Hydrogenics Corporation (HYGS / NASDAQ)
Annual Common Size Income Statement
S u mm ary p ercen tages in ital ics will n ot f oot d u e to rou nd in g
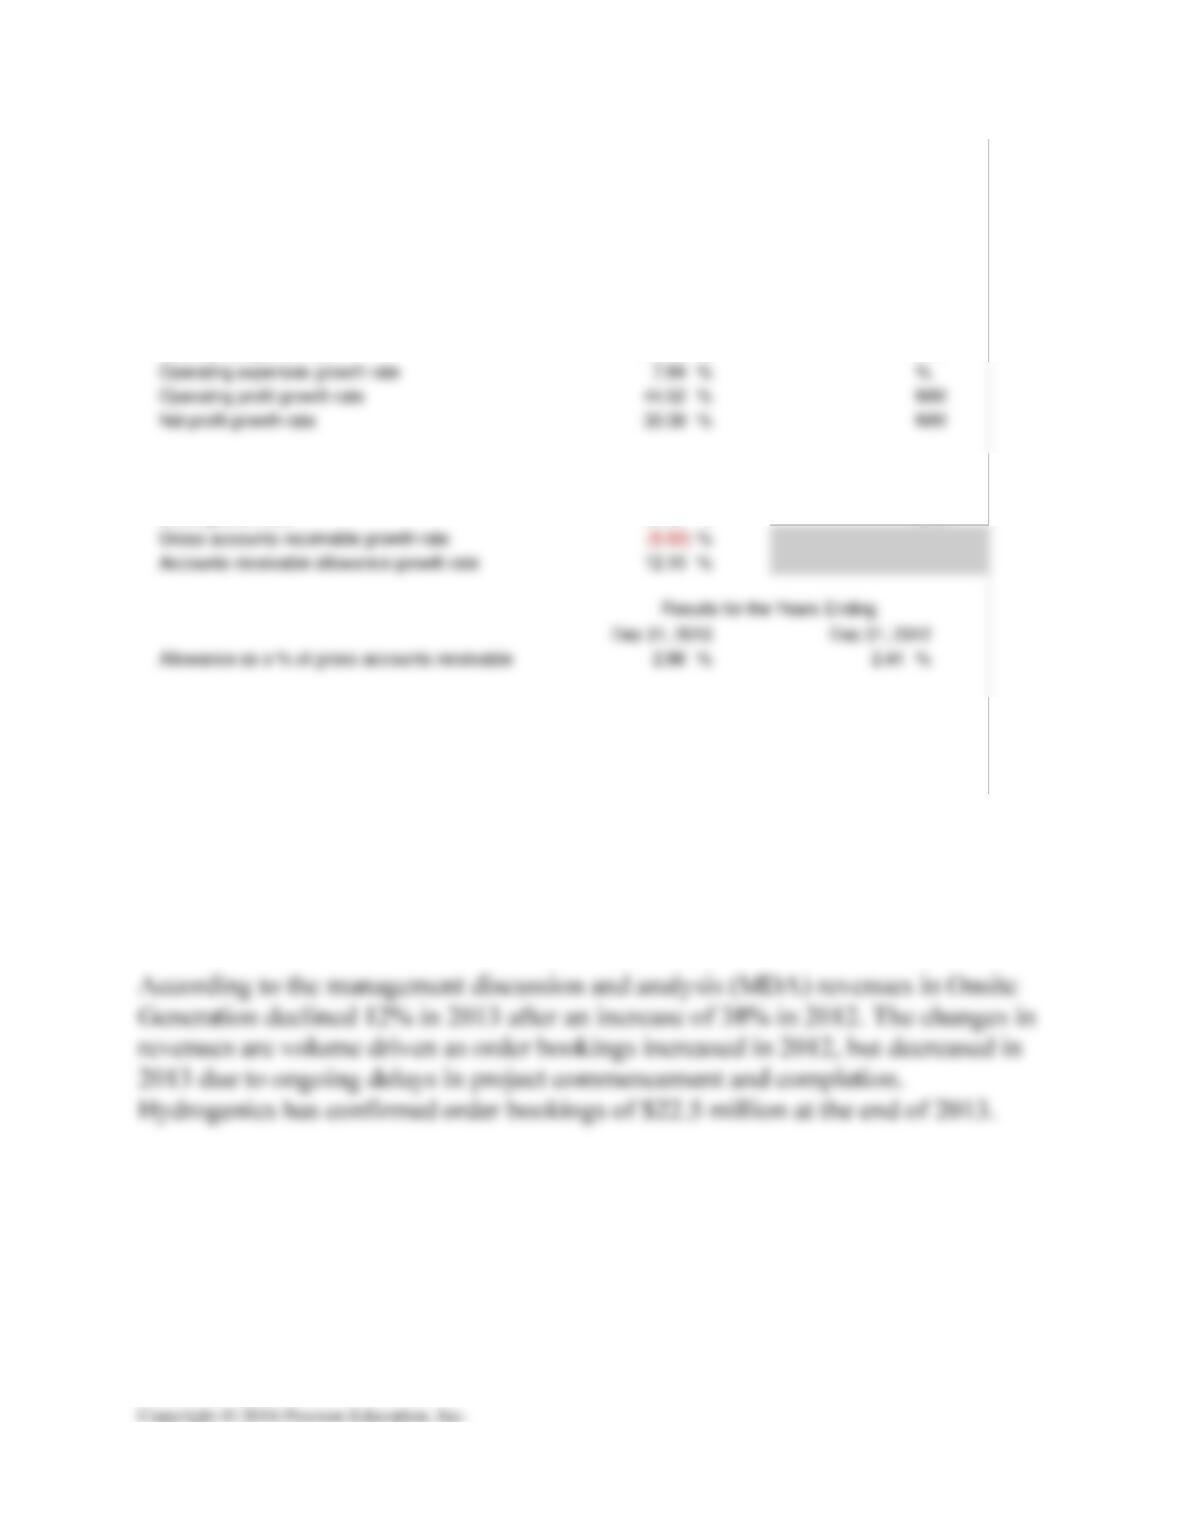
(b) Revenues for Hydrogenics increased 33.81% overall in 2013 while operating
expenses increased 7.84% resulting in a favorable change. Hydrogenics has
operated at a net loss; however, the net loss is decreasing from 2012 to 2013. The
firm operates in two key segments, Onsite Generation and Power Systems.
The Power Systems segment has grown significantly in 2013 with an increase of
320% in revenue after a 5% increase in 2012. This growth is a result of revenues
earned on the contract for integrated power propulsion systems for a customer, as
well as delivery of the major order of fuel cell modules to Hydrogenics’ strategic
partner, CommScope, Inc. The firm has confirmed order bookings of $34.5 million
at the end of 2013.
Selected Income Statement Growth Rates:
Sales growth rate 33.81 % (0.00) N/M
Gross profit growth rate 129.78 % (0.00) N/M
Accounts Receivable Analysis
Sales growth rate 33.81 % (0.00) N/M
NOTES: "N/M" indicates a calculated rate is not meaningful for analysis
2013 vs. 2012
2012 vs. 0
Hydrogenics Corporation (HYGS / NASDAQ)
Additional Ratio Analysis
Growth Rate Comparisons Between
Operating losses have decreased significantly in 2013 due to the improved gross
profit margins and declines in all other operating expenses. Notes 14, 15 and 16
detail specific changes in selling, general and administrative expense (SG&A)
accounts and research and development (R&D).
R&D is an important expense for a company such as Hydrogenics who must stay
on the cutting edge of innovation. The decline in R&D relative to revenues in 2013
can be explained by two key items. First, the large increase in revenues in 2013,
would not require a corresponding increase in percent of R&D. Second, Note 16
shows that R&D expenses each year are offset by government funding. In 2013
government funding increased. It should be noted that in dollars, gross R&D
expenses did decline 8.9% from 2012 so this decrease should be investigated
further.


