3
Fundamentals of Cost-Volume-Profit Analysis
Solutions to Review Questions
3-1.
Profit
=
TR – TC
=
PX – VX – F
=
(P – V)X – F
=
operating profit,
=
total revenue,
=
total costs,
=
average unit selling price,
=
average unit variable cost,
=
quantity of units,
=
total fixed costs for the period.
3-2.
3-3.
Total contribution margin: Total selling price – Variable manufacturing costs expensed –
3-4.
3-5.
3-6.
3-7.
3-8.
3-9.
3-10.
3-11.
It is common to assume a fixed sales mix when solving for break-even volumes with
3-12.
Two common assumptions in CVP analysis are that unit prices and unit variable costs are
Solutions to Critical Analysis and Discussion Questions
3-13.
There may be a difference between costs used in cost-volume-profit analysis and costs
expensed in financial statements. A common example is fixed manufacturing costs. Cost–
3-14.
The accountant makes use of a linear representation to simplify the analysis of costs and
3-15.
As volume rises, it is likely that product markets will be saturated, leading to a need to cut
prices to maintain or increase volume. This price-cutting would result in a nonlinear
3-16.
Although the assumptions of CVP analysis appear relatively simplistic, CVP analysis is a
useful tool for understanding the relations among costs, volumes, and the resulting profit.
3-17.
Although there are no “profits” in a not-for-profit organization, these organizations are still
very concerned about the difference between inflows (from fees, grants, sales, or other
3-18.
Most business schools have relatively high fixed costs when volume is measured by the
3-19.
High (or low) operating leverage is not a good (or bad) thing. It is the result of managerial
3-20.
The “product” or “service” for an airline consists of a flight between two city-pairs (for
example, Los Angeles to San Francisco). As you can imagine, the number of “products”
3-21.
Because the price Luxe pays for the leased parking space is fixed (it does not depend on
3-22.
The per-unit lease cost is not appropriate to decide where to park the cars, because the
Solutions to Exercises
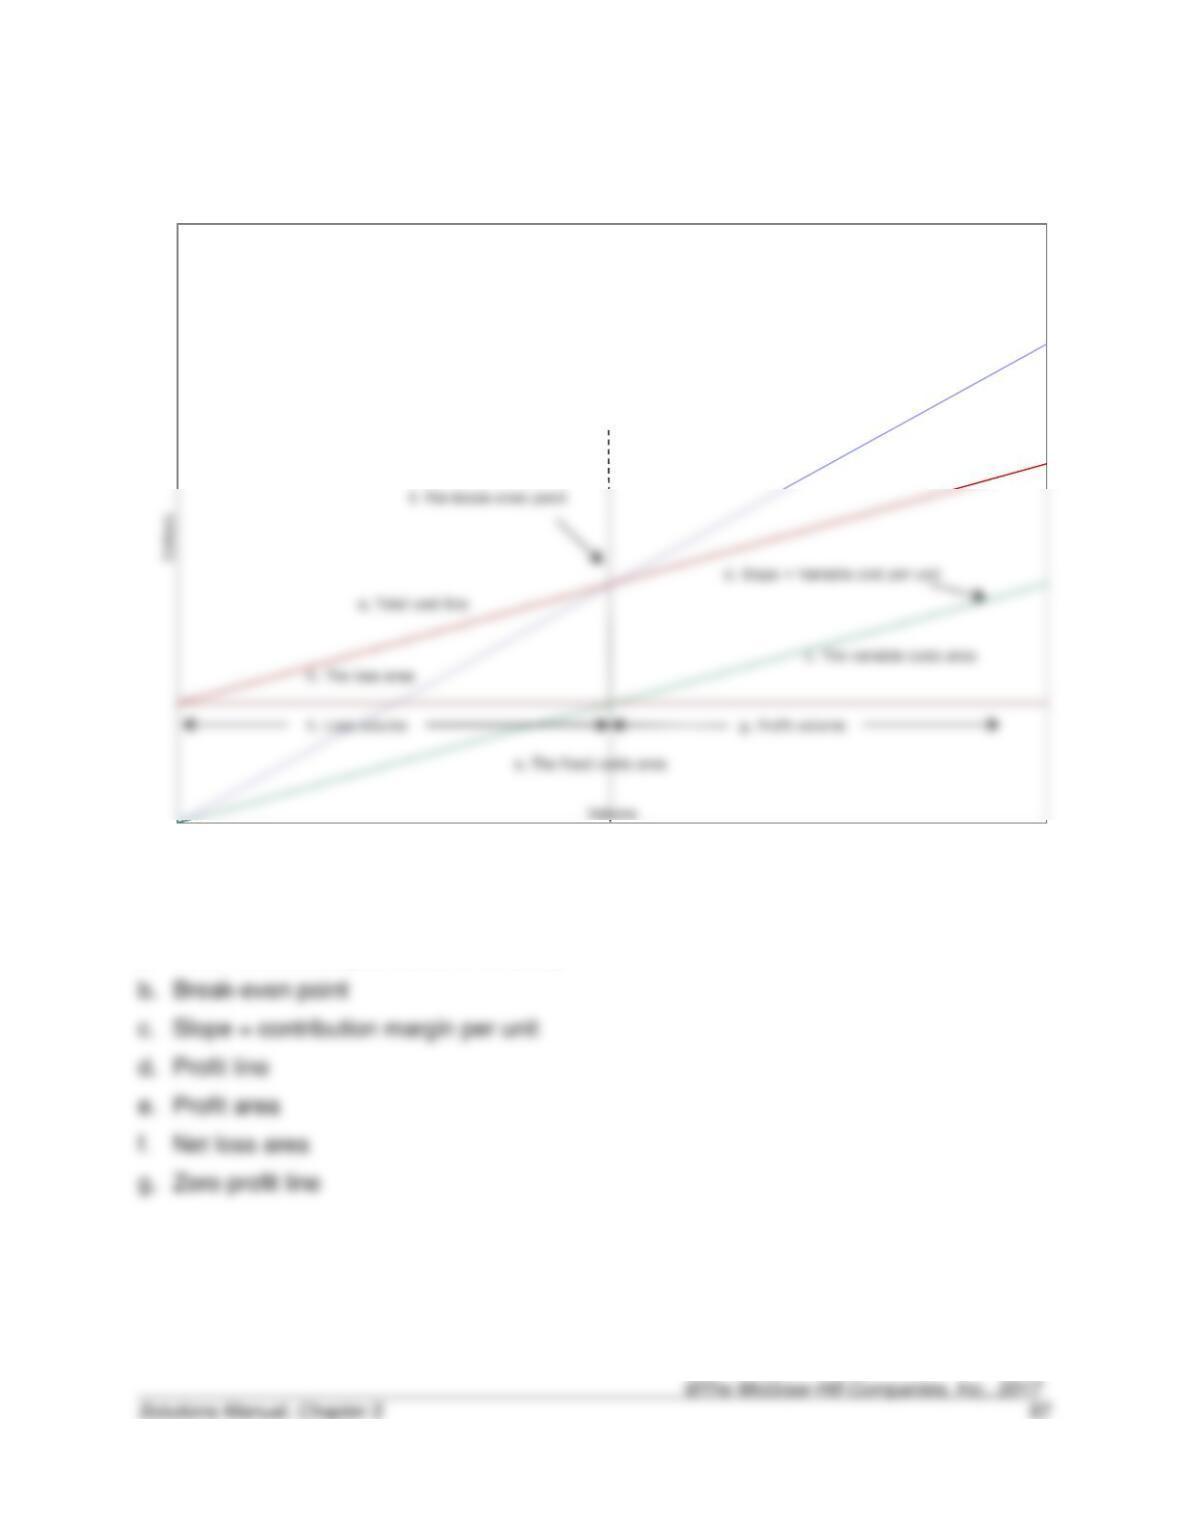
3-23. (15 min.) Profit Equation Components.
b. Total revenue line
g. The profit area
3-24. (15 min.) Profit Equation Components.
a. Total fixed costs (loss at zero volume)
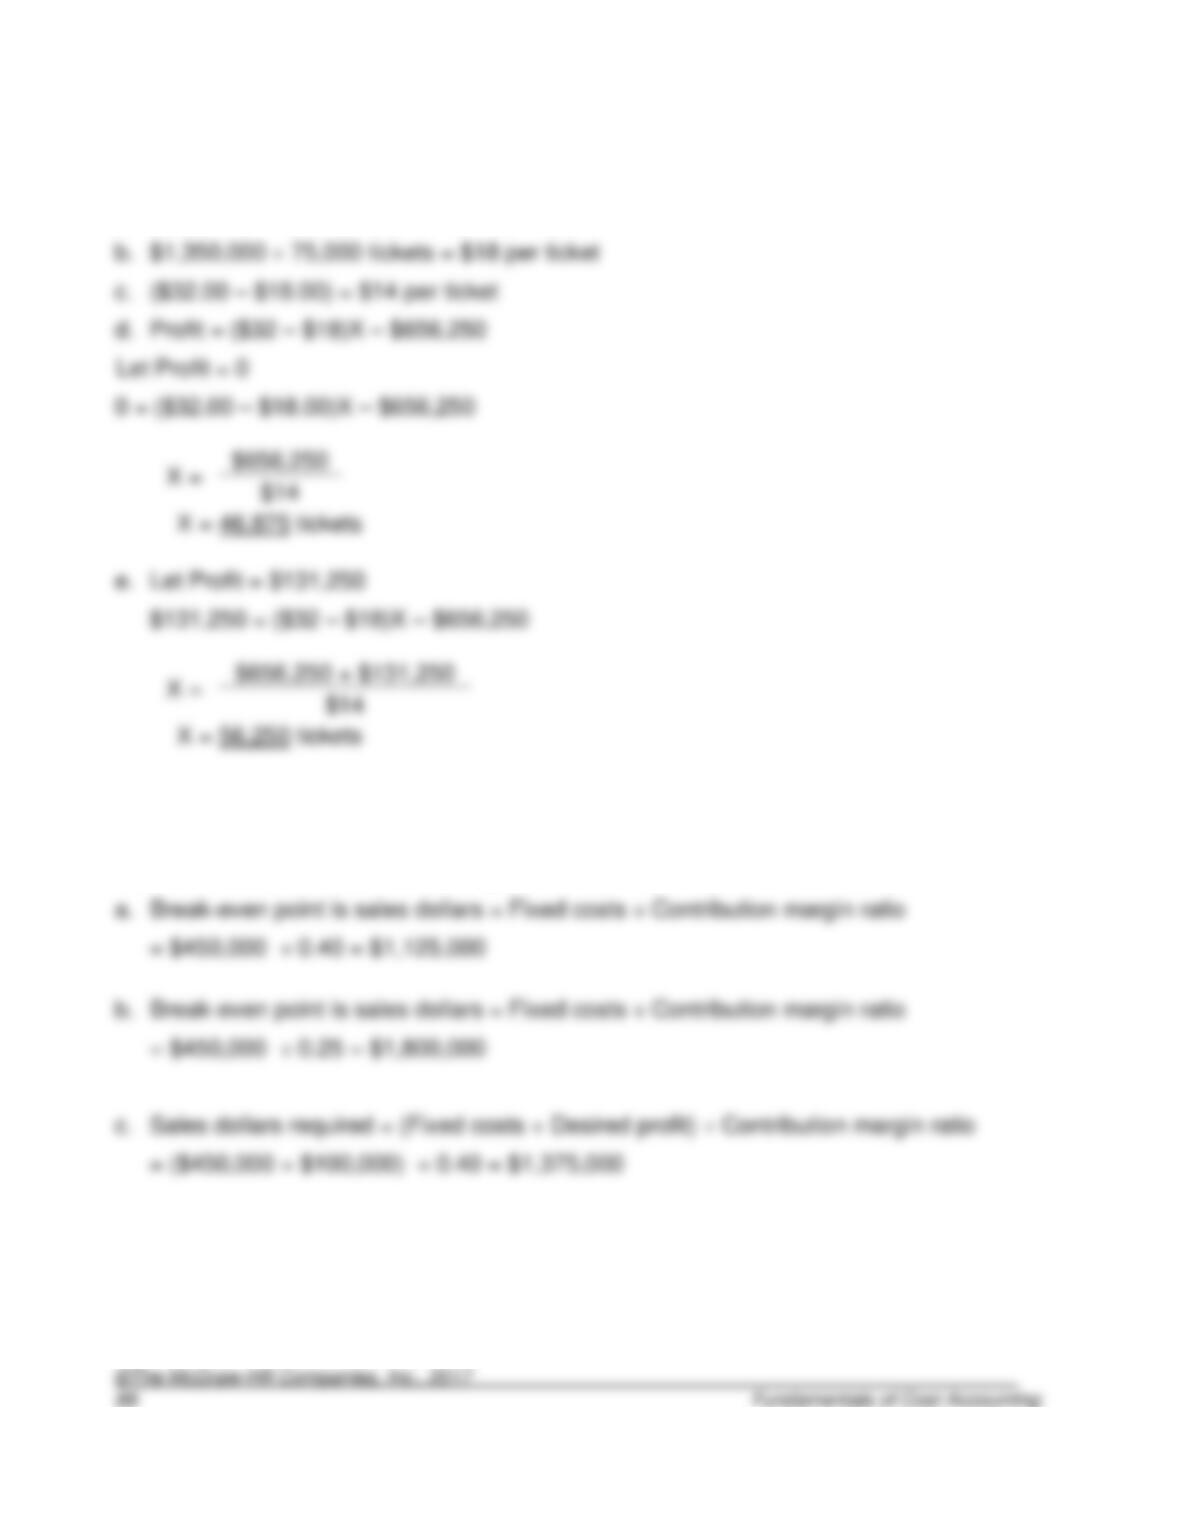
3-25. (20 min.) Basic Decision Analysis Using CVP: Anu’s Amusement Center.
a. $2,400,000 75,000 tickets = $32 per ticket
3-26. (20 min.) Basic CVP Analysis: Dukey’s Shoe Station.
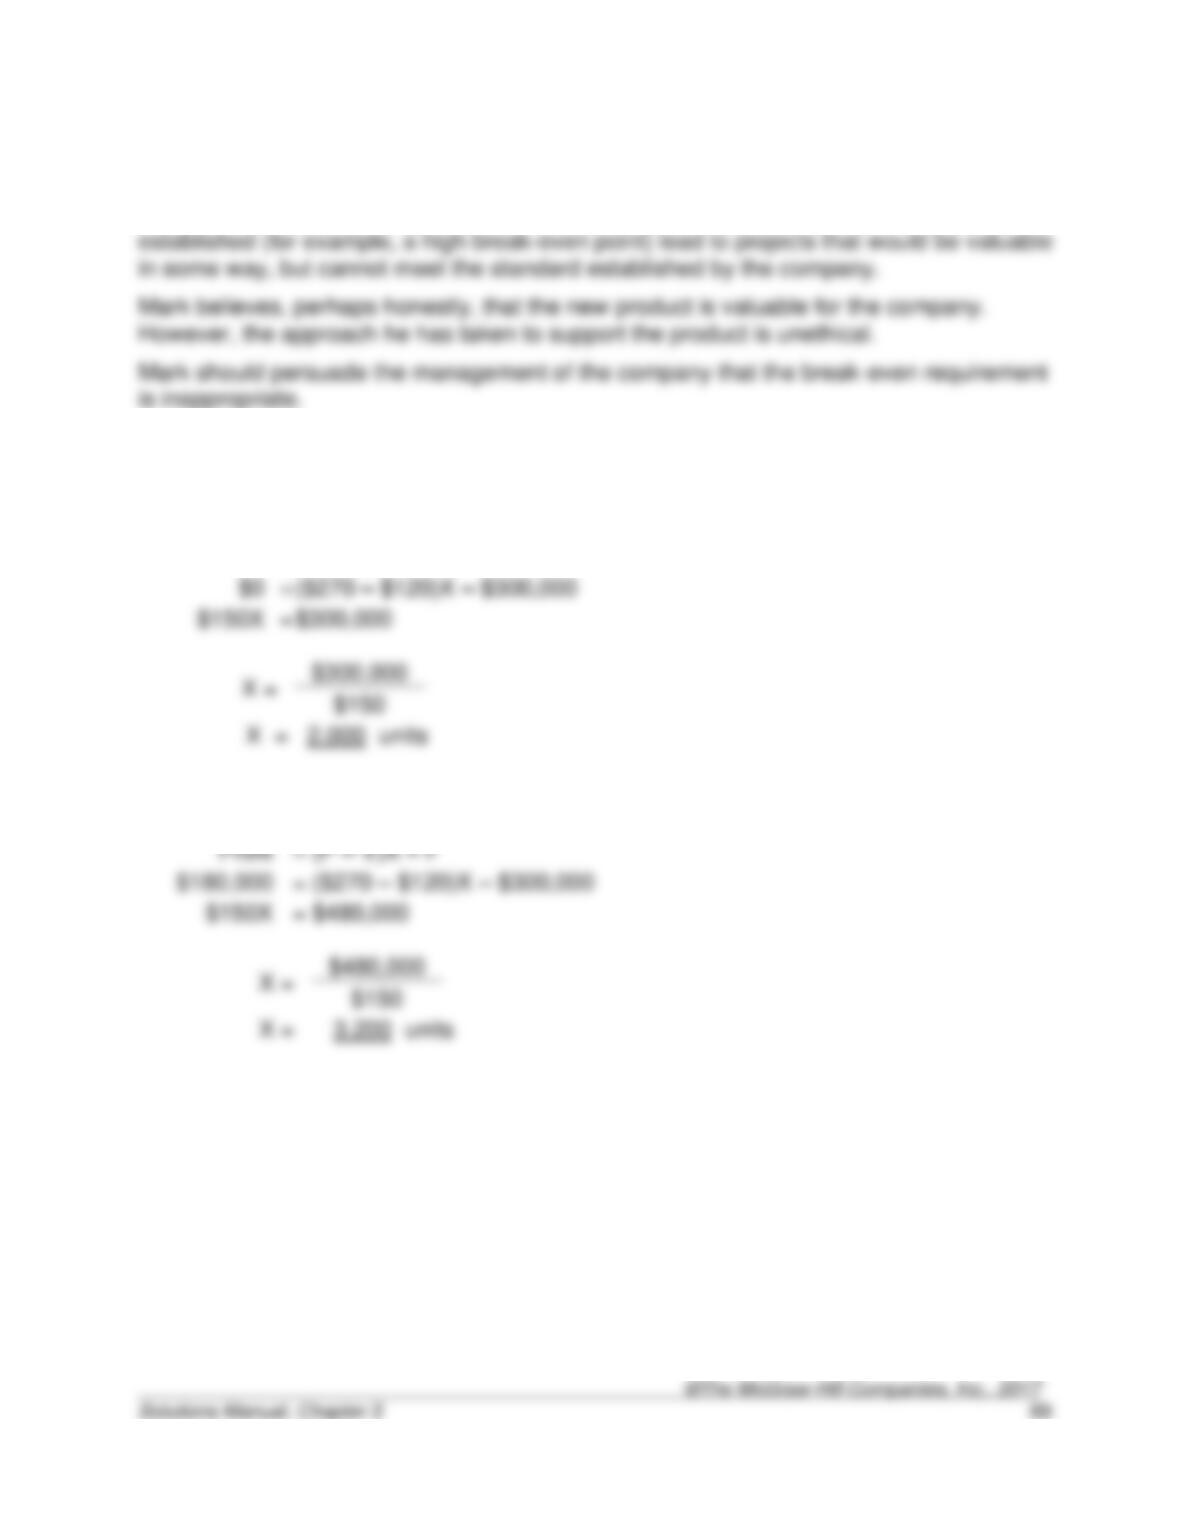
3-27. (25 min.) CVP Analysis—Ethical Issues: Mark Ting.
This problem is based on the experience of the authors at several companies.
The problem in this example, which is common, is that the guidelines the company has
3-28. (55 min.) Basic Decision Analysis Using CVP: Derby Phones.
a.
Profit
=
(P – V)X – F
($270 – $120)X – $300,000
b.
(P – V)X – F
($270 – $120)X – $300,000
$480,000
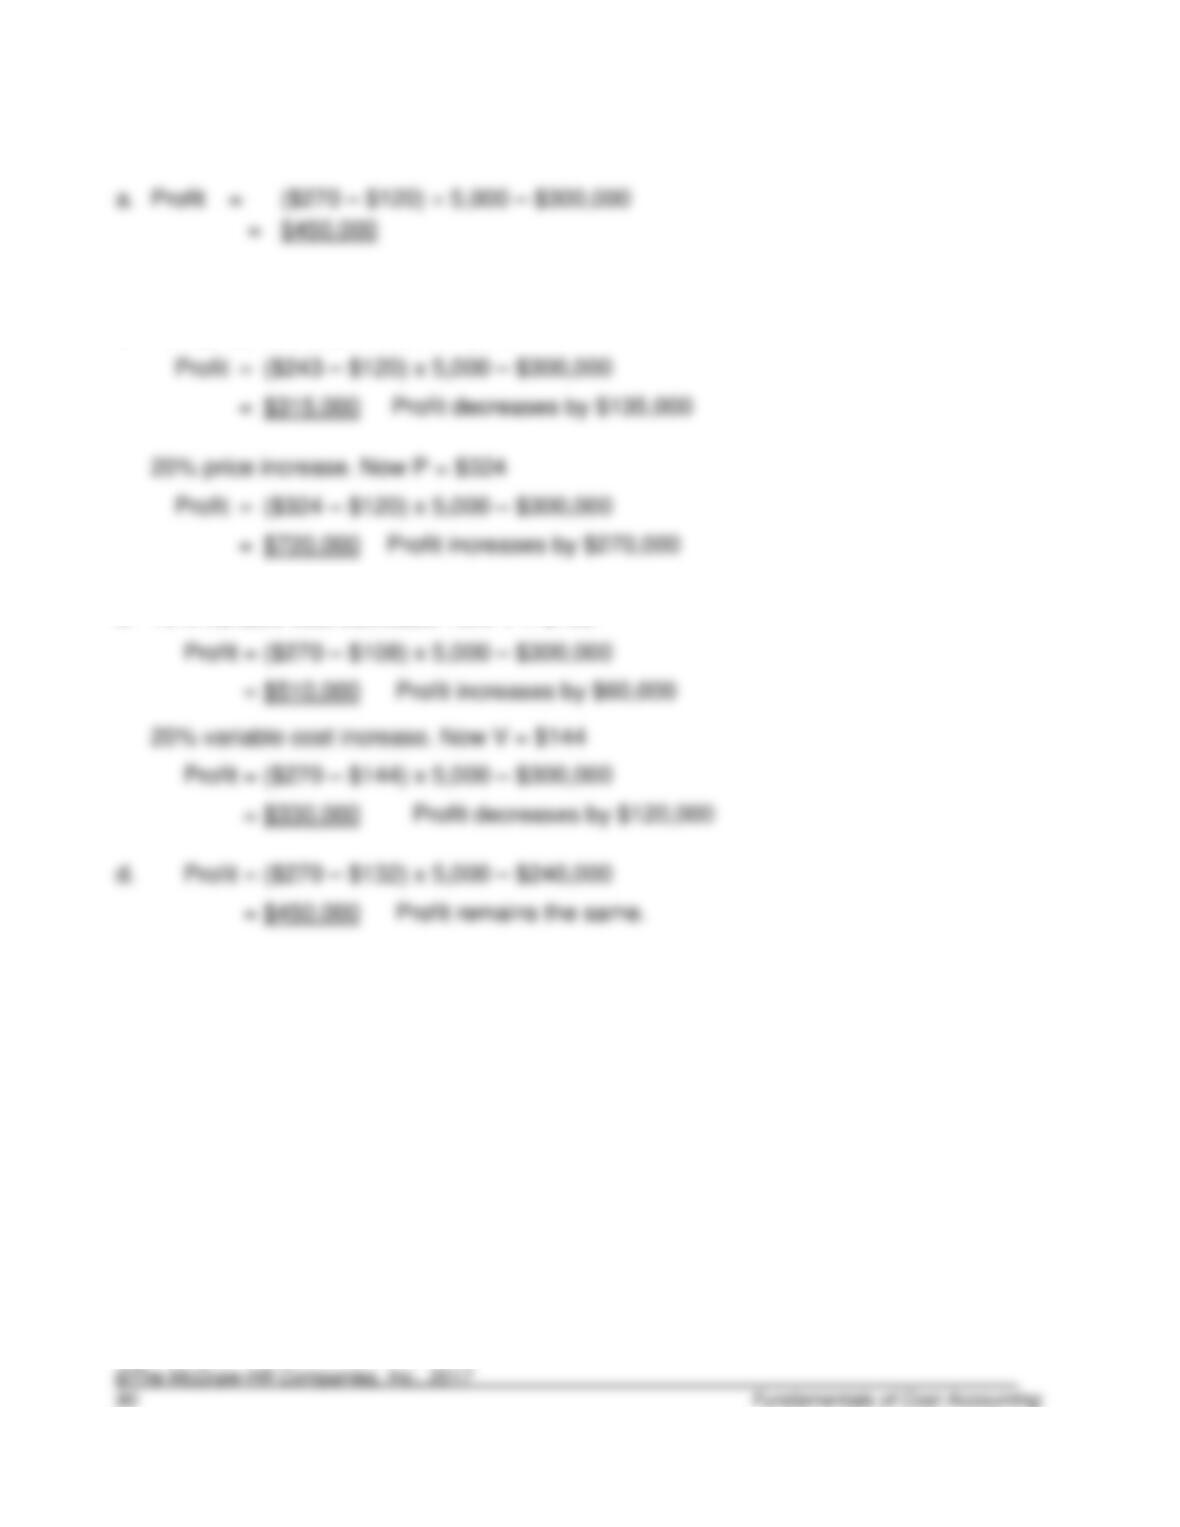
3-29. (55 min.) Basic Decision Analysis Using CVP: Derby Phones.
Profit
=
($270 – $120) 5,000 – $300,000
b.
10% price decrease. Now P = $243
20% price increase. Now P = $324
c.
10% variable cost decrease. Now V = $108
20% variable cost increase. Now V = $144
d.
3-30. (25 min.) Basic Decision Analysis Using CVP: Warner Clothing.
a.
Profit
=
(P – V)X – F
=
b.
Profit
=
(P – V)X – F
=
3-31. (30 min.) Basic Decision Analysis Using CVP: Warner Clothing.
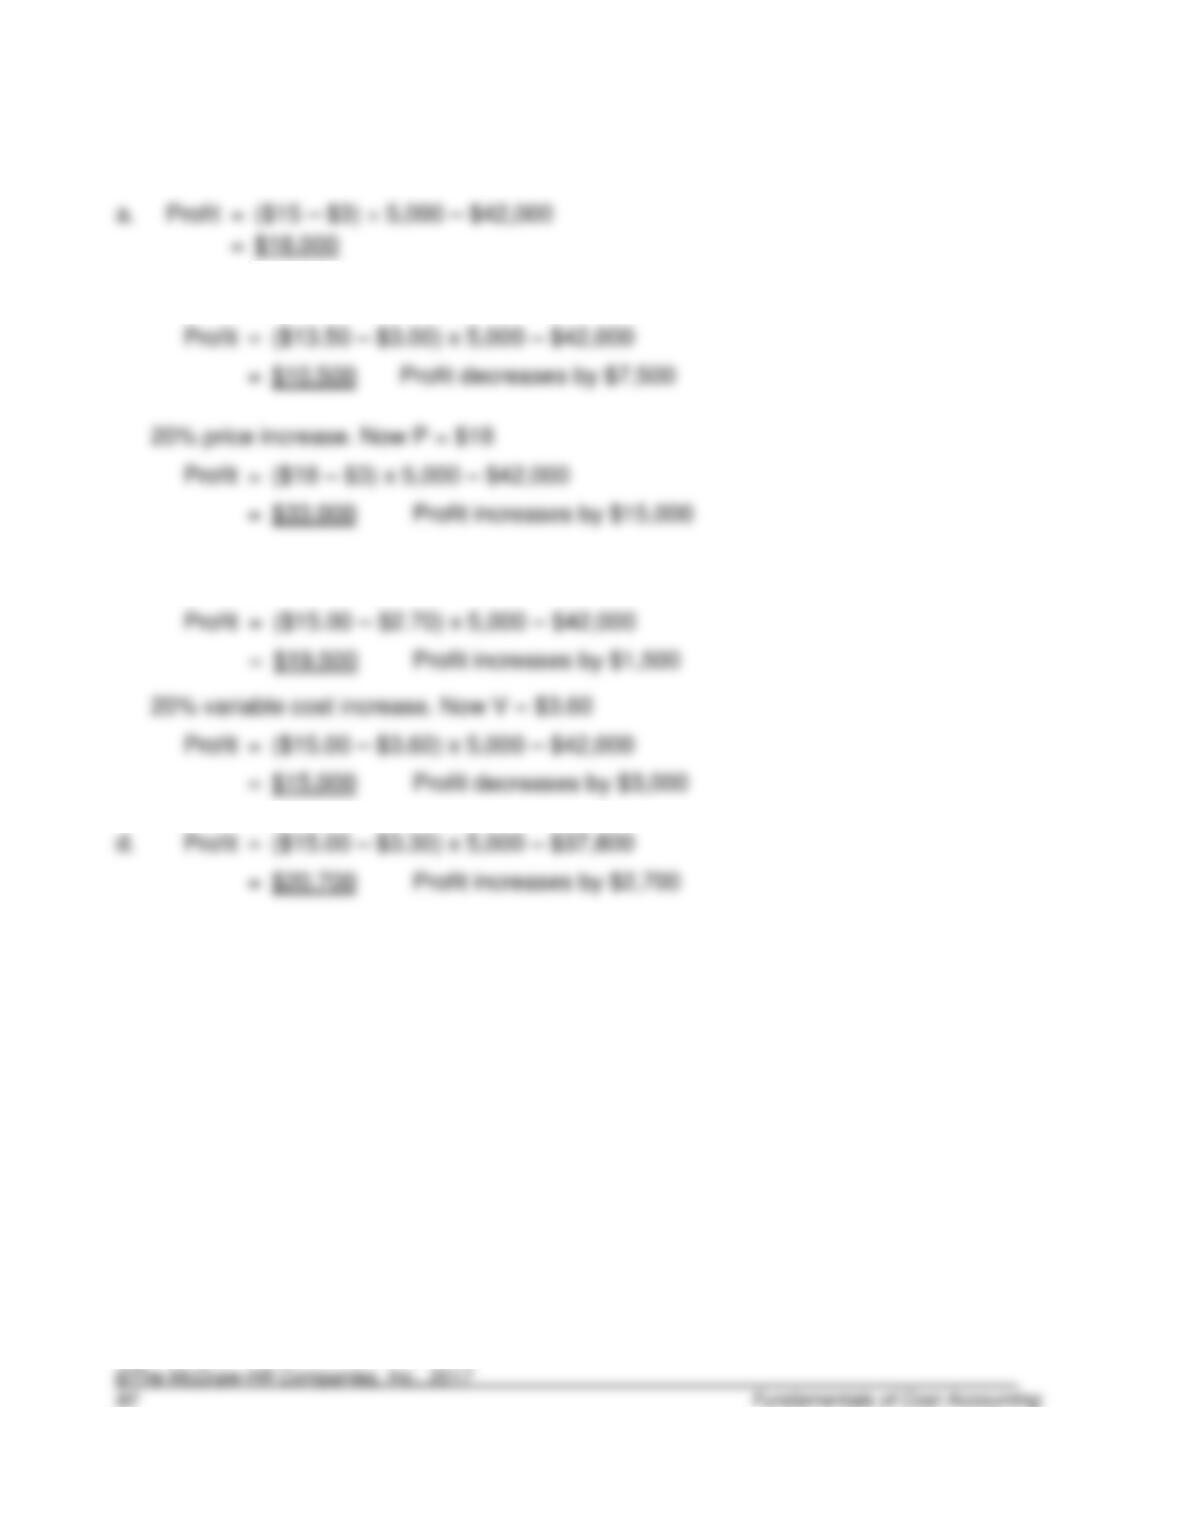
a.
b.
10% price decrease. Now P = $13.50
20% price increase. Now P = $18
c.
10% variable cost decrease. Now V = $2.70
20% variable cost increase. Now V = $3.60
d.
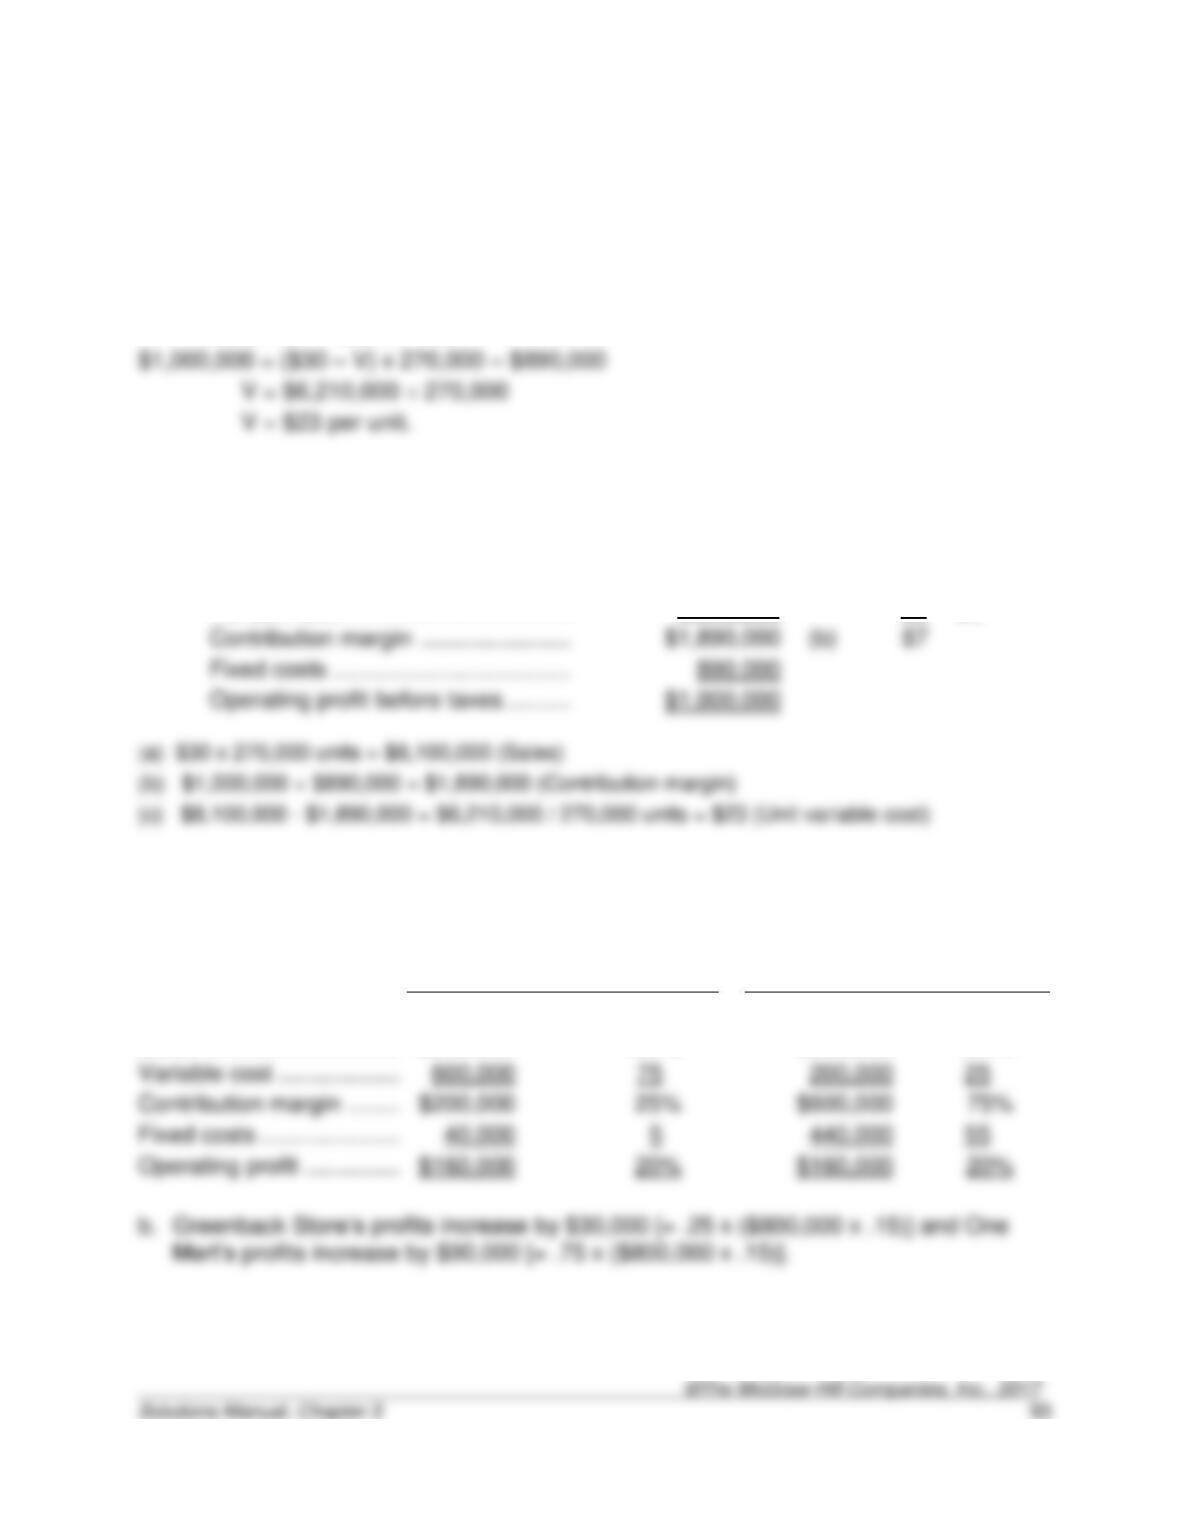
3-32. (30 min.) Basic CVP Analysis: Pacific Parts.
$23 per unit.
Using the profit equation:
Profit = (P – V) x X – FC
Using an income statement format (based on 270,000 units):
Amount
Unit
Sales ………………………………………..
$8,100,000
(a)
$30
Variable cost ………………………………
6,210,000
23
(c)
Contribution margin …………………….
(b)
Fixed costs …………………………………
3-33. (30 min.) Analysis of Cost Structure: The Greenback Store vs. One-Mart.
a.
Greenback Store
One-Mart
Amount
Percentage
Amount
Percentage
Sales …………………………….
$800,000
100%
$800,000
100%
Variable cost …………………..
Contribution margin …………
Fixed costs ……………………..
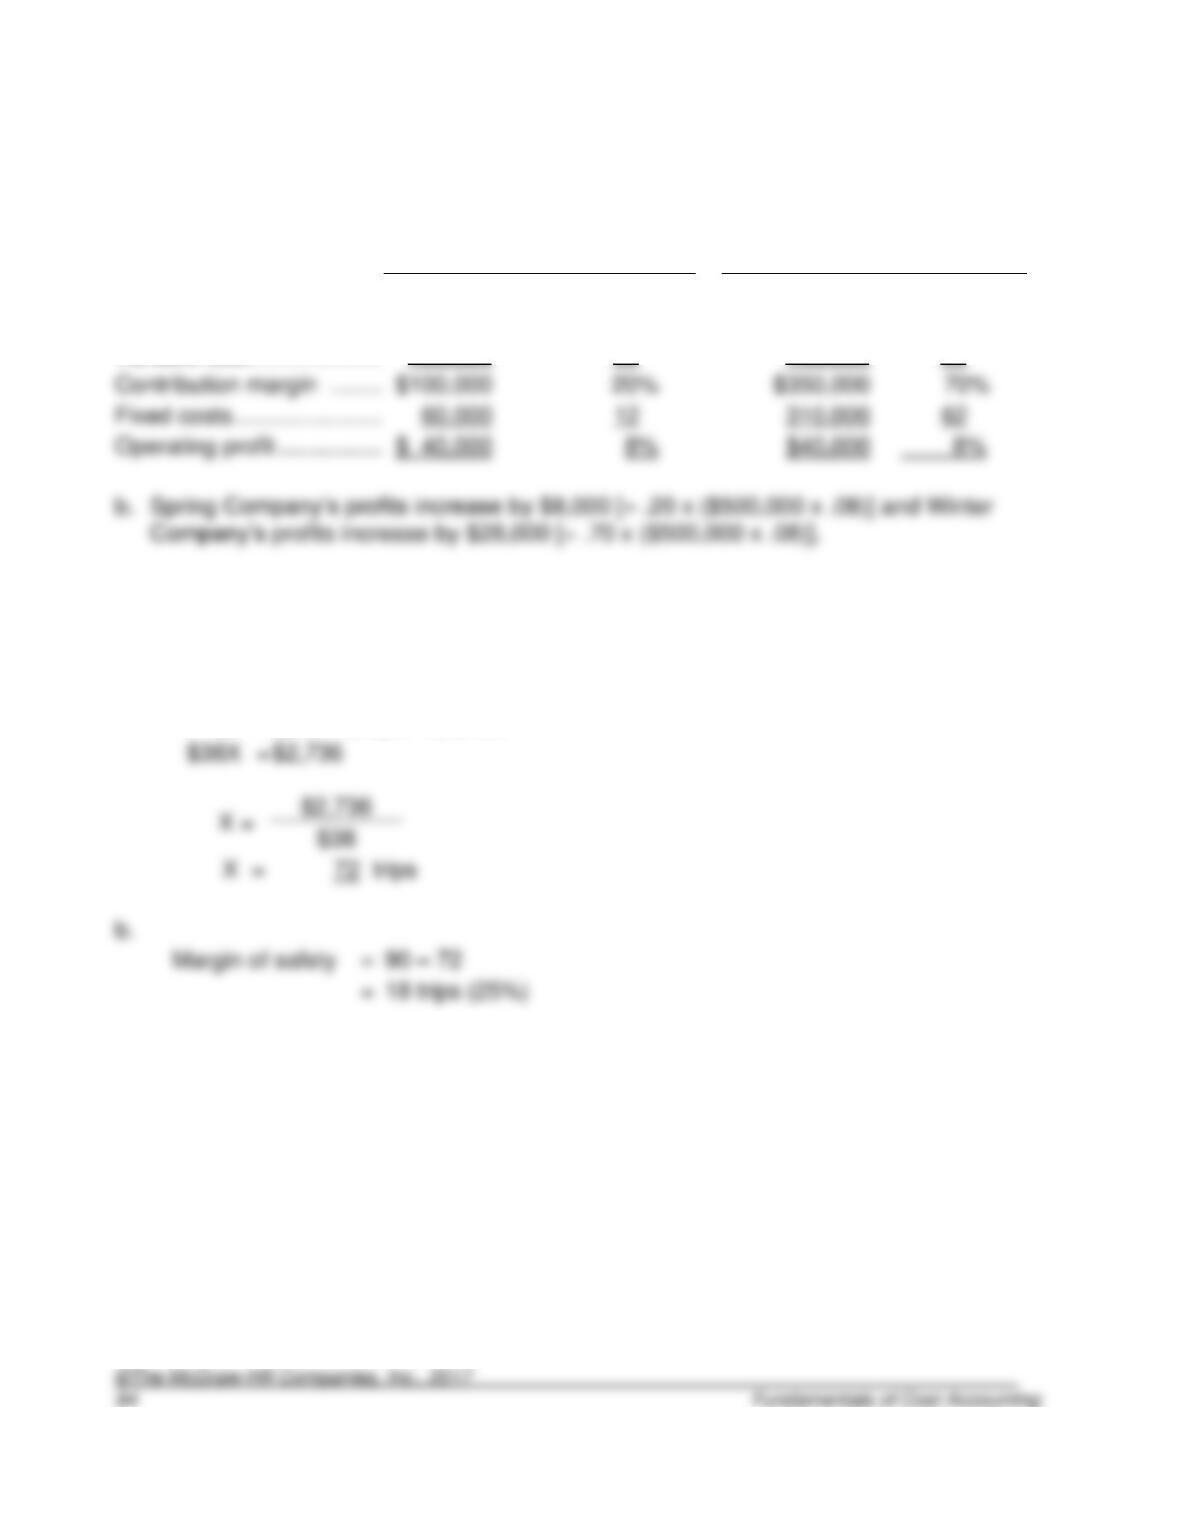
3-34. (30 min.) Analysis of Cost Structure: Spring Company vs. Winters
Company.
a.
Spring Company
Winters Company
Amount
Percentage
Amount
Percentage
Sales …………………………….
$500,000
100%
$500,000
100%
Variable cost …………………..
400,000
80
150,000
30
Contribution margin ………..
Fixed costs ……………………..
60,000
310,000
3-35. (15 min.) CVP and Margin of Safety: Bristol Car Service.
a.
Profit
=
(P – V)X – F
$0
=
($50 – $12)X – $2,736
$2,736
=
=
18 trips (25%)
3-36. (15 min.) CVP and Margin of Safety: Casey’s Cases.
a.
Profit
=
(P – V)X – F
$0
=
($30 – $26)X – $2,480
=
80 cases (12.9%)
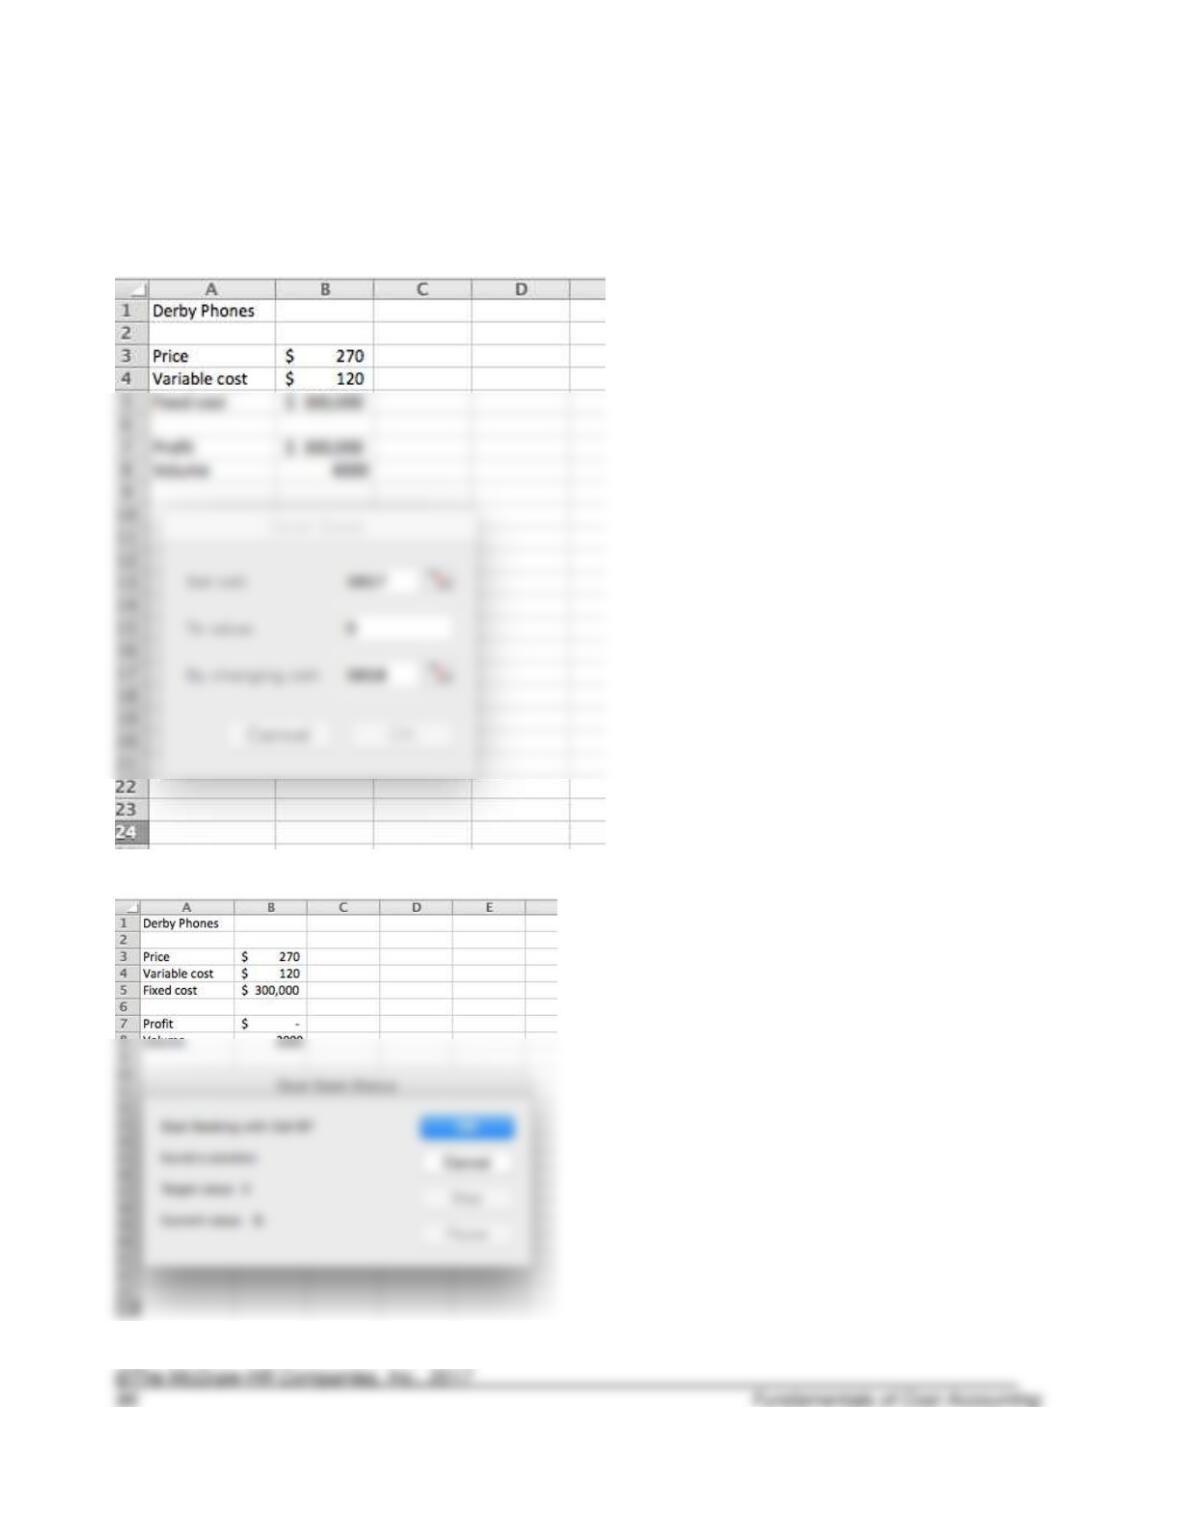
3-37. (20 min.) Using Microsoft Excel to Perform CVP Analysis: Derby Phones.
a. 2,000 units.
The following two screenshots show the setup and solution.
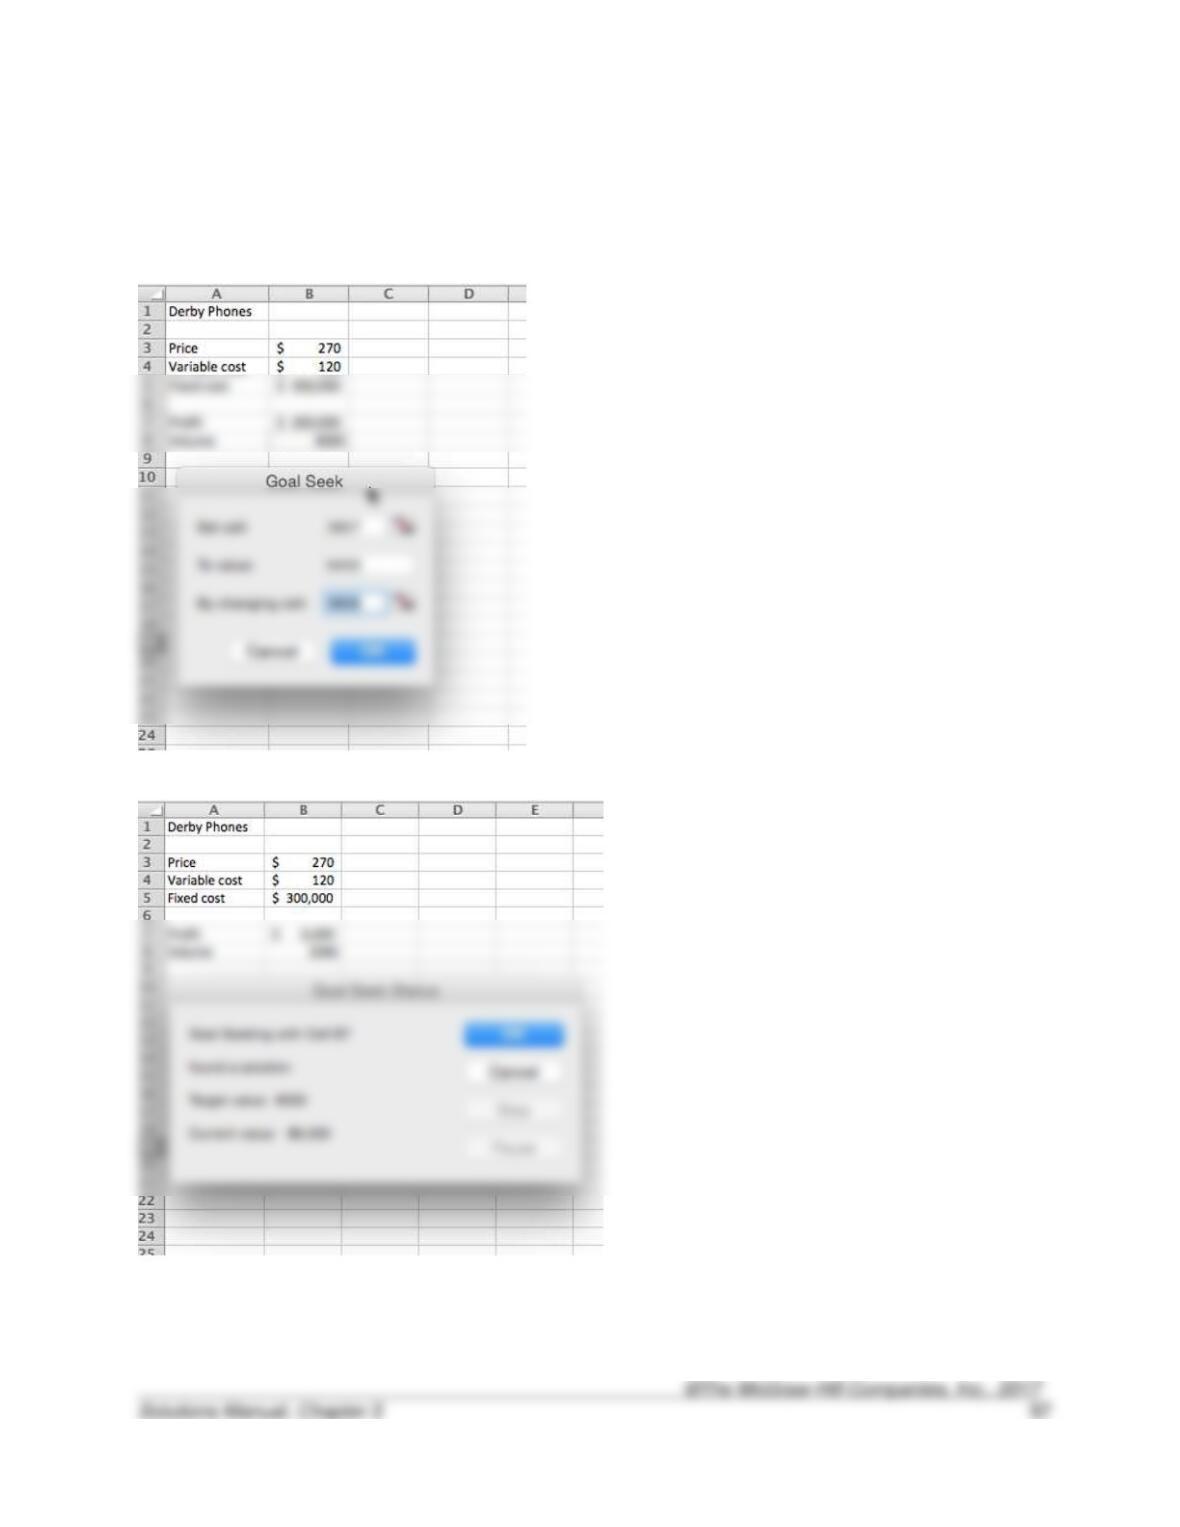
3-37 (continued).
b. 2,040 units.
The following two screenshots show the setup and solution.
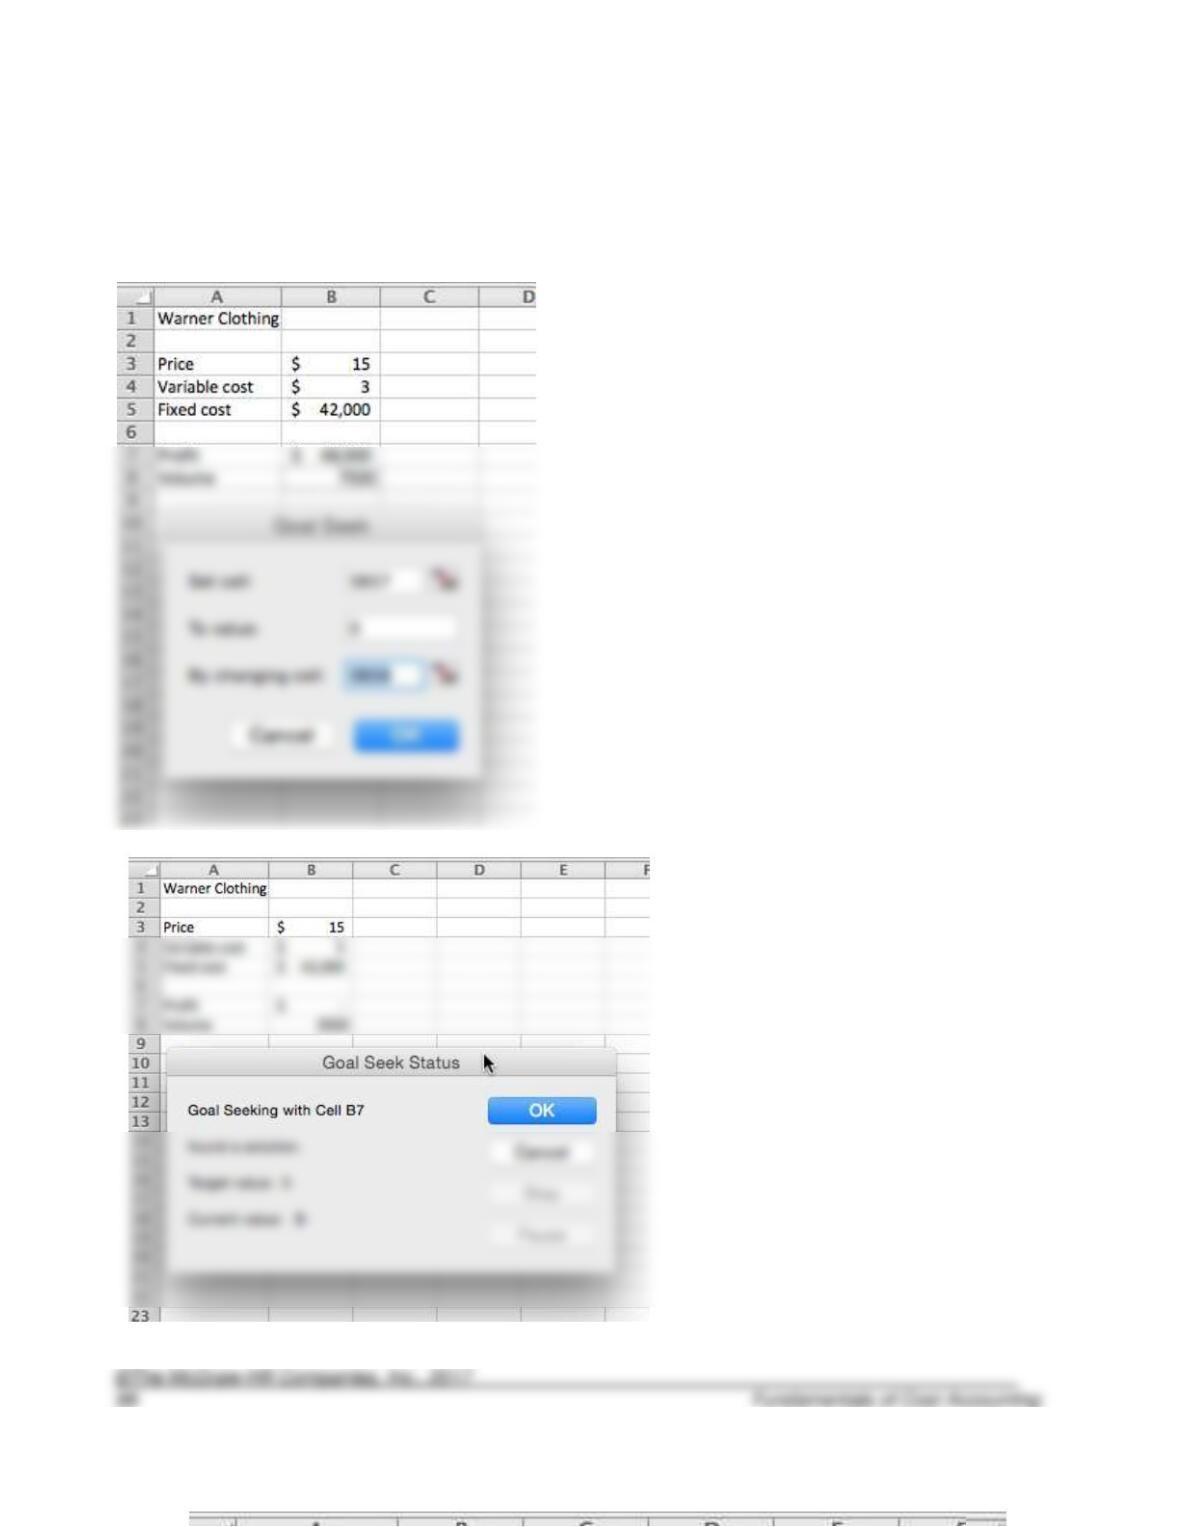
3-38. (20 min.) Using Microsoft Excel to Perform CVP Analysis: Warner Clothing.
a. 3,500 units.
The following two screenshots show the setup and solution.
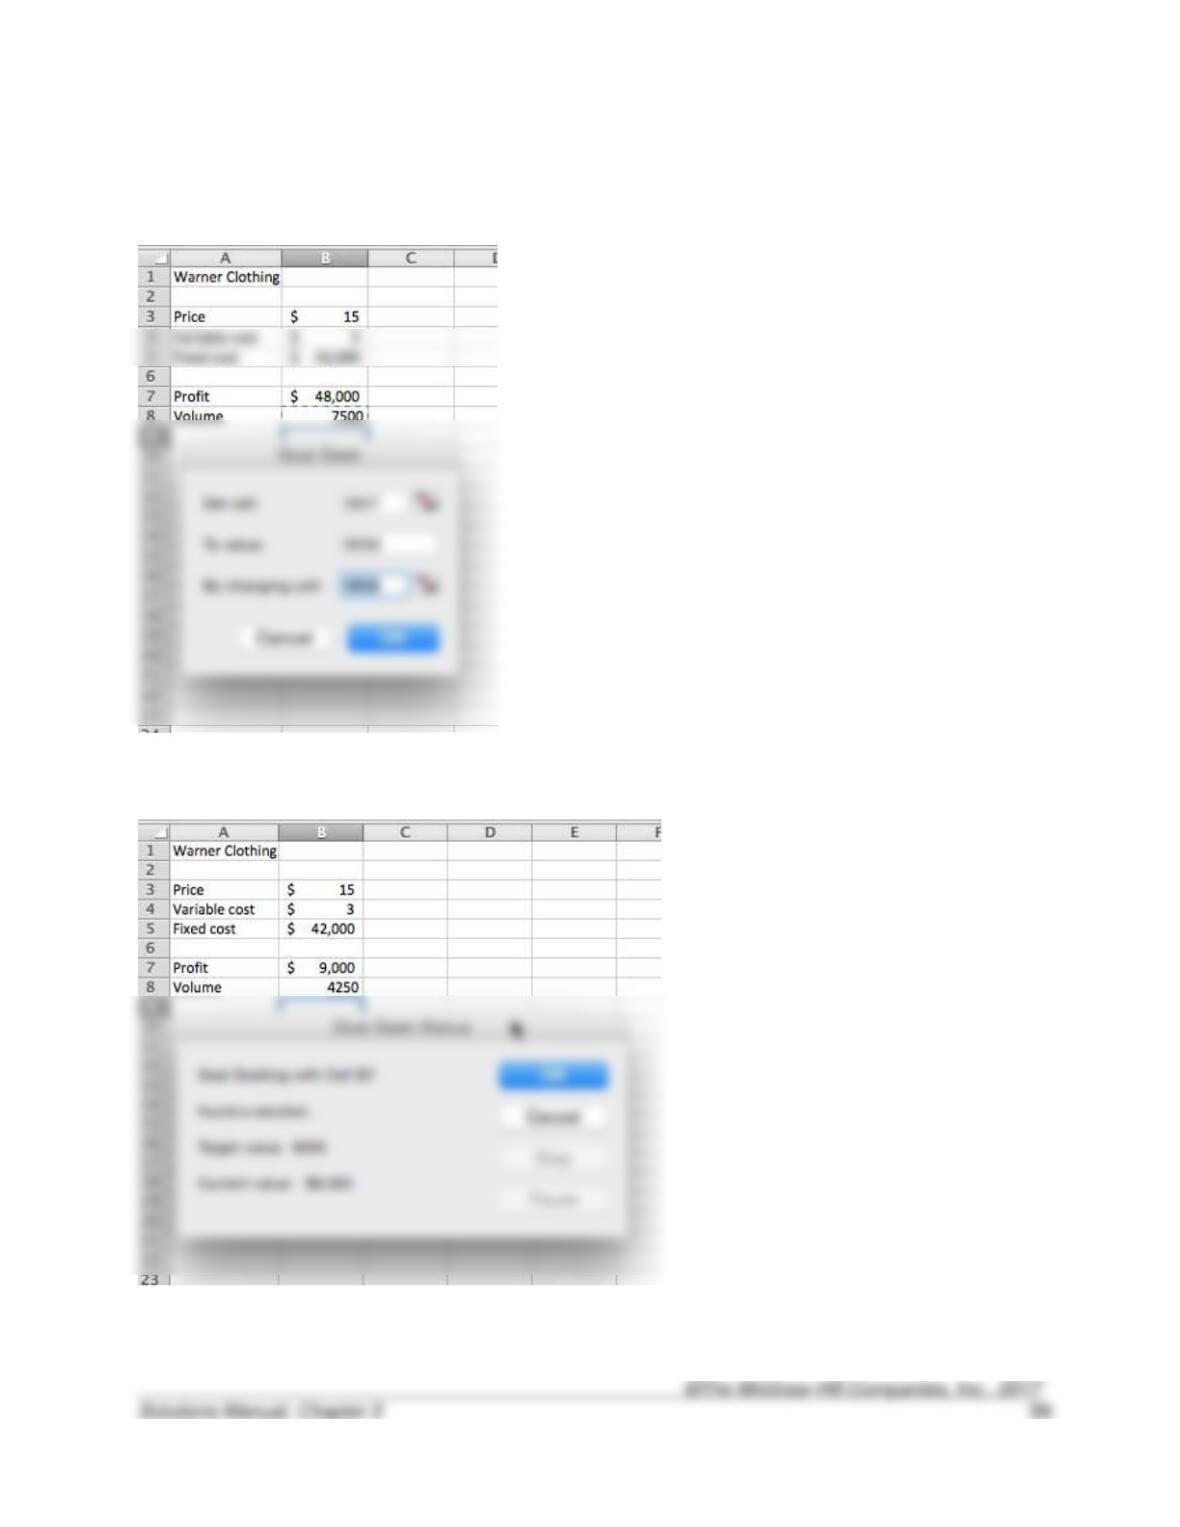
3-38(continued).
b. 4,250 units.
The following two screenshots show the setup and solution.
3-39. (20 min.) CVP With Income Taxes: Hunter & Sons.
a.
Profit
=
(P – V)X – F
=
b. In order to achieve a profit of $39,600 after tax, Hunter & Sons must earn:
3-40. (20 min.) CVP With Income Taxes: Hammerhead Charters.
a.
Profit
=
(P – V)X – F
=
b. In order to achieve a profit of $9,000 after tax, Hammerhead Charters must earn:
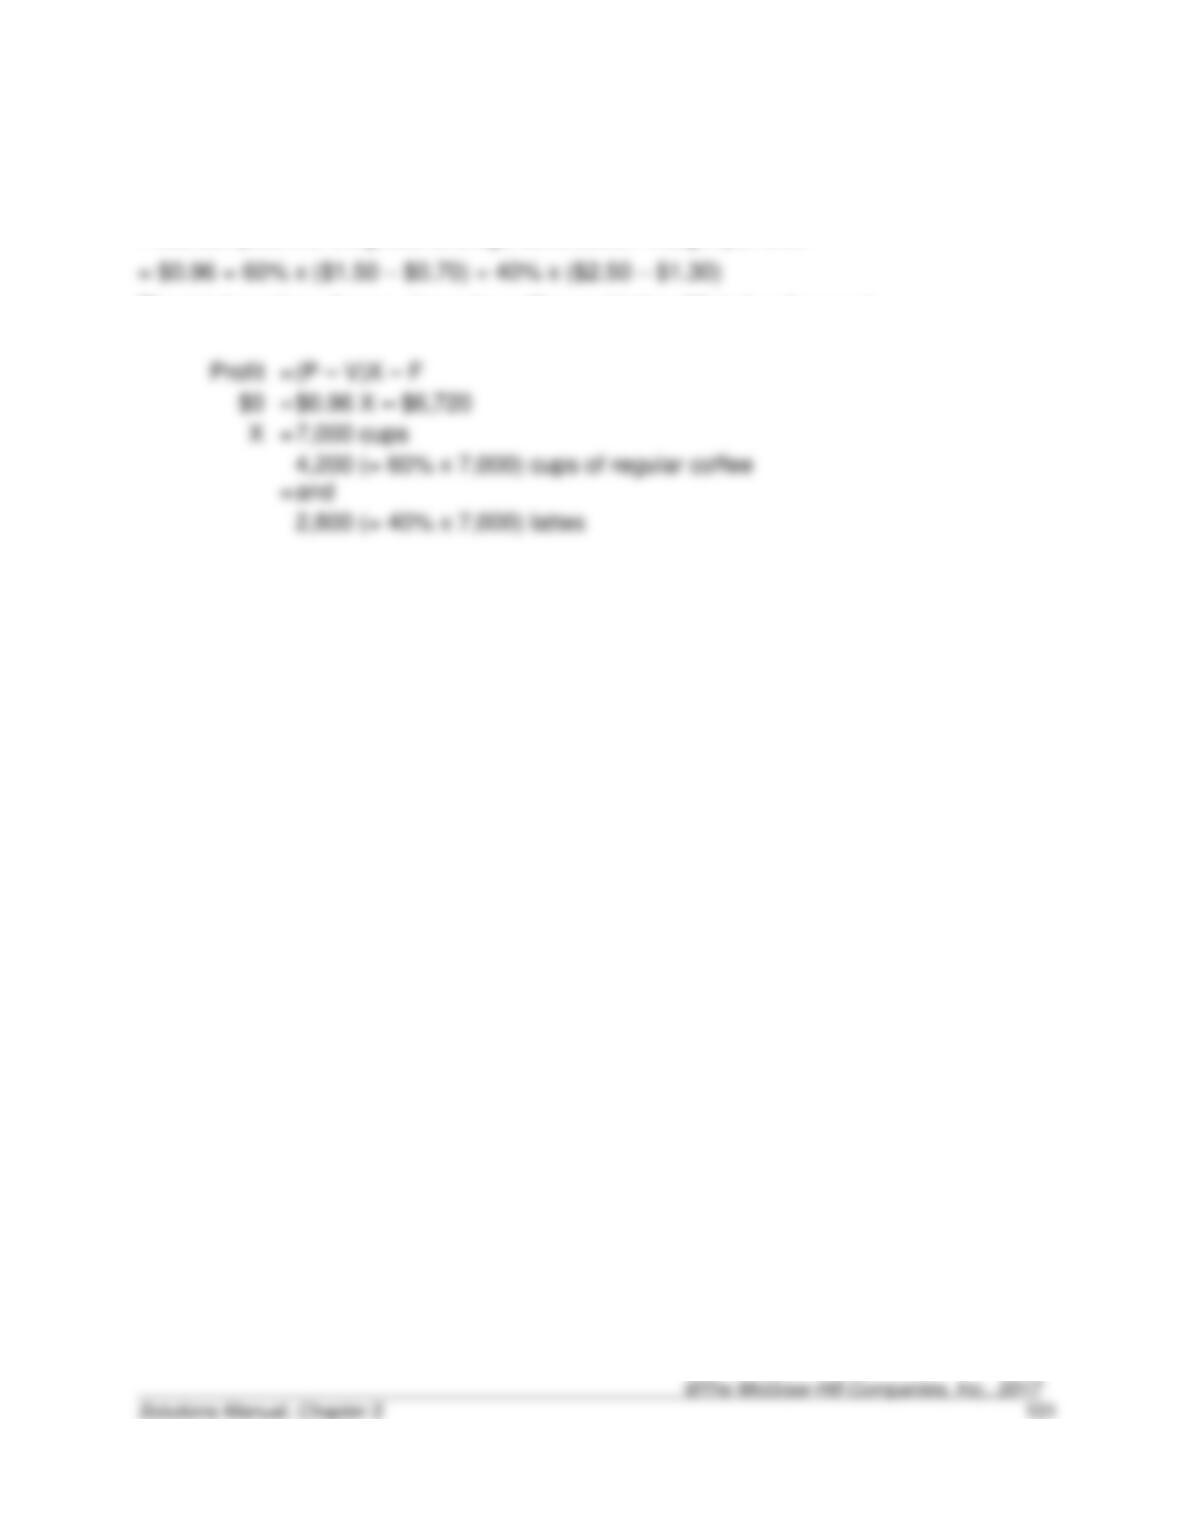
3-41. (20 min.) Multiproduct CVP Analysis: Rio Coffee Shoppe.’
First, compute the weighted-average contribution margin per unit:
The total number of cups of regular coffee and lattes (X) to break even is:
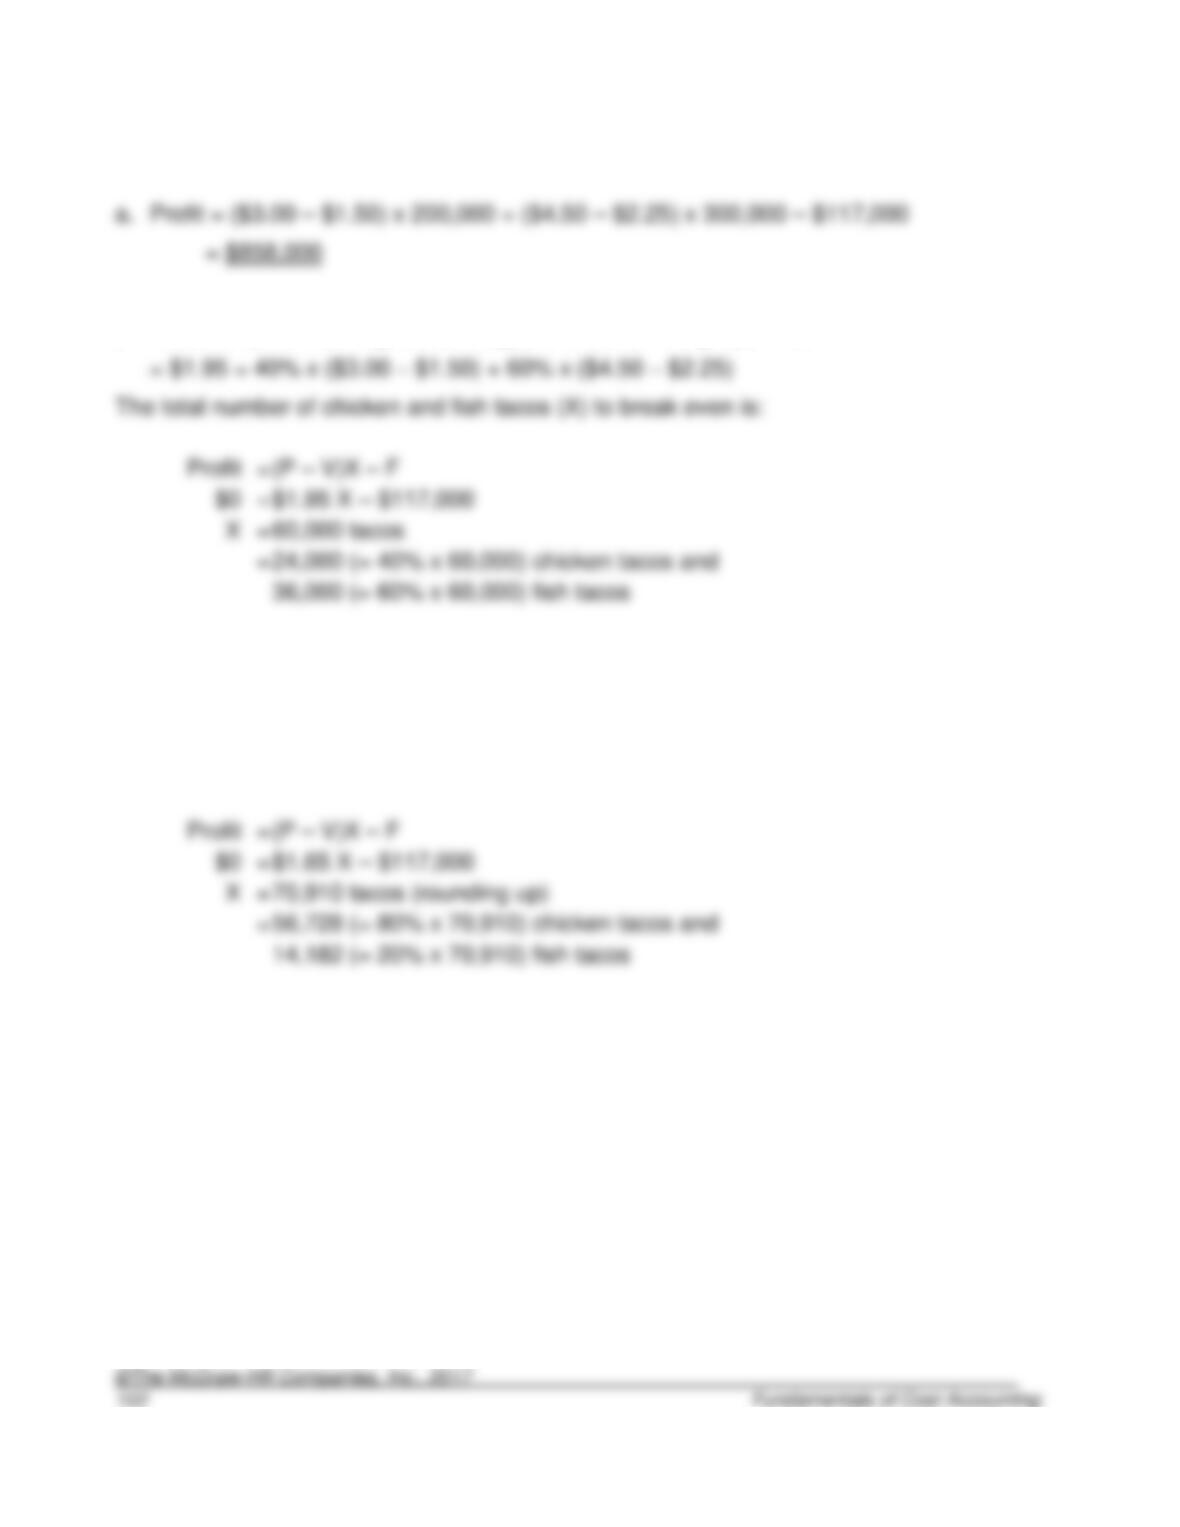
3-42. (20 min.) Multiproduct CVP Analysis: Mission Foods.
b. First, compute the weighted-average contribution margin per unit:
c. First, compute the weighted-average contribution margin per unit:
= $1.65 = 80% x ($3.00 – $1.50) + 20% x ($4.50 – $2.25)
The total number of chicken and fish tacos (X) to break even is:
Solutions to Problems
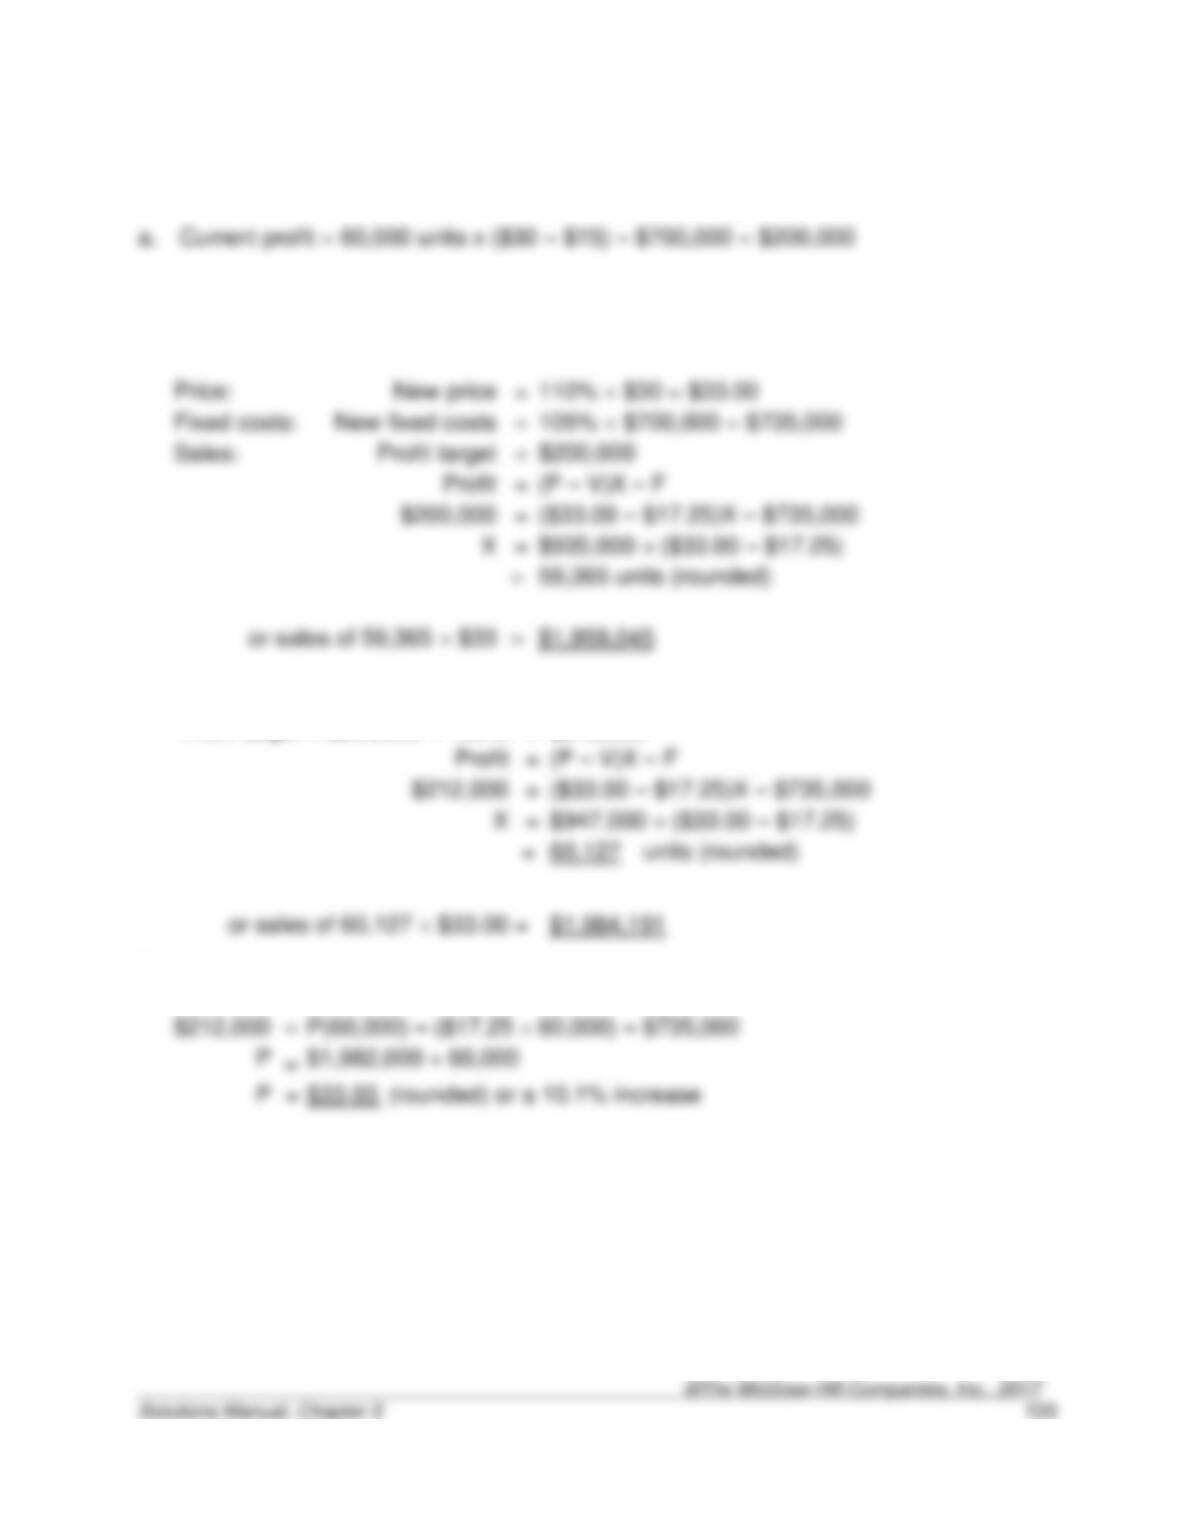
3-43. (35 min.) CVP Analysis and Price Changes: Argentina Partners.
Variable costs. New variable cost per unit:
Labor
+
Materials
+
Overhead
115% 50% $15
+
110% 25% $15
+
120% 25% $15
= $17.25
Price:
=
Fixed costs:
105% $700,000 = $735,000
Sales:
$200,000
=
(P – V)X – F
($33.00 – $17.25)X – $735,000
$935,000 ÷ ($33.00 – $17.25)
=
59,365 units (rounded)
b.
Profit target = $200,000 106%
=
$212,000
(P – V)X – F
($33.00 – $17.25)X – $735,000
=
$947,000 ÷ ($33.00 – $17.25)
c.
Profit
=
PX – VX – F
$212,000
=
P(60,000) – ($17.25 60,000) – $735,000
=
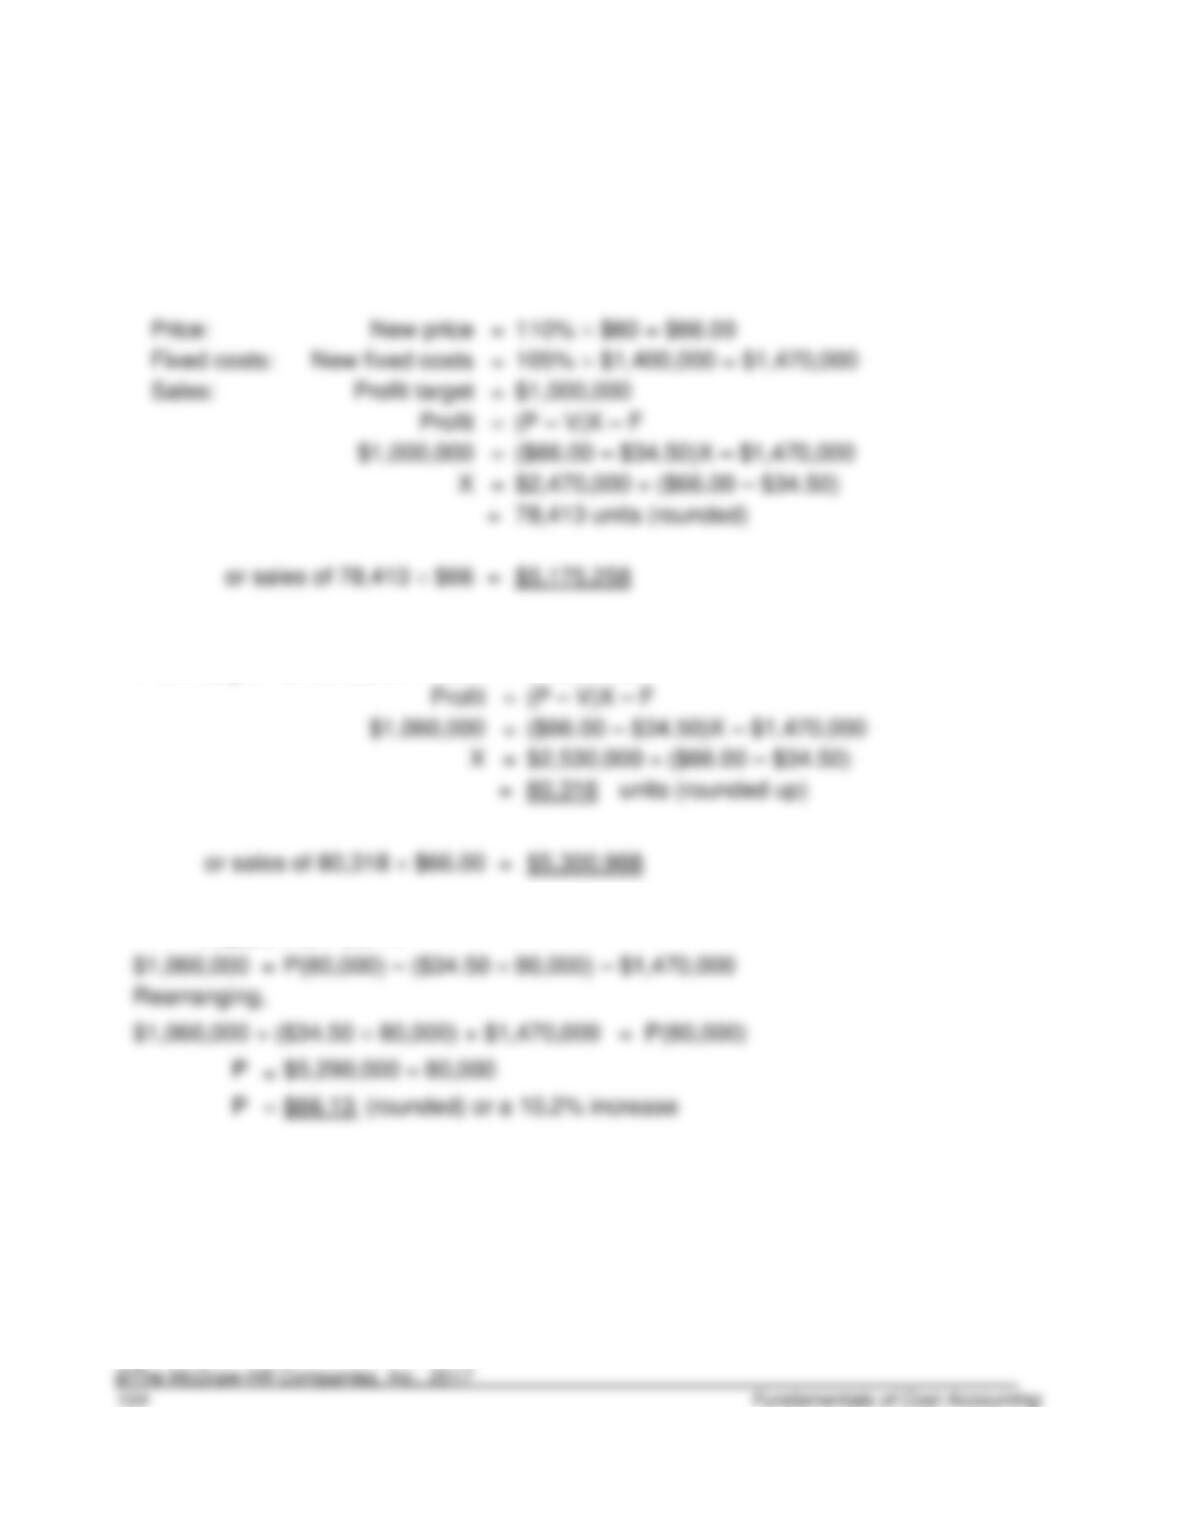
3-44. (35 min.) CVP Analysis and Price Changes: Scholes Systems.
a. Current profit = 80,000 units x ($60 – $30) – $1,400,000 = $1,000,000
Variable costs. New variable cost per unit:
Labor
+
Materials
+
Overhead
115% 50% $30
+
110% 25% $30
+
120% 25% $30
= $34.50
Price:
=
110% $60 = $66.00
Sales:
=
$1,000,000
=
(P – V)X – F
=
$2,470,000 ÷ ($66.00 – $34.50)
=
78,413 units (rounded)
b.
Profit target = $1,000,000 106%
=
$1,060,000
=
($66.00 – $34.50)X – $1,470,000
=
$2,530,000 ÷ ($66.00 – $34.50)
c.
Profit
=
PX – VX – F
$1,060,000
=
P(80,000) – ($34.50 80,000) – $1,470,000
=
Revenues – Costs
=
150,000 x Price – Costs
=
150,000 P
=
$8.20
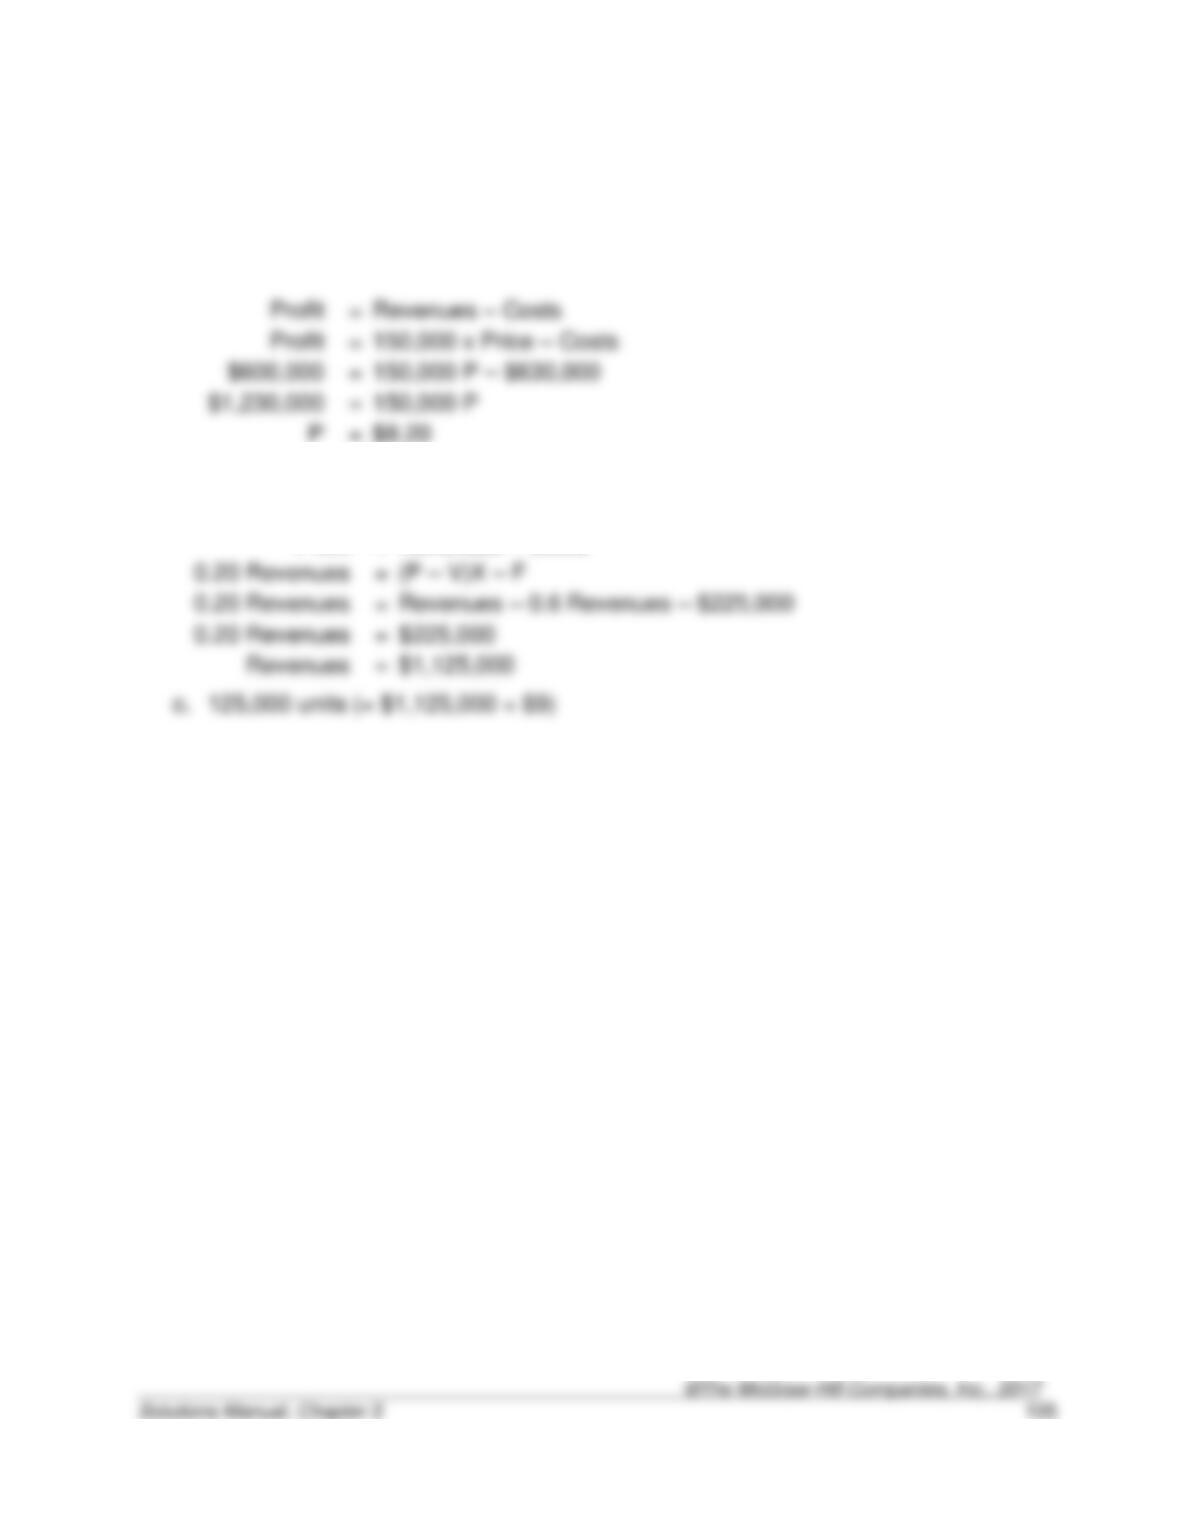
3-45. (20 min.) CVP Analysis―Missing Data: Breed Products.
a. $8.20
Because the volume is given, it is not necessary to know the fixed and variable costs
separately.
b. $1,125,000
Profit
=
Revenues – Costs
=
(P – V)X – F
=
=
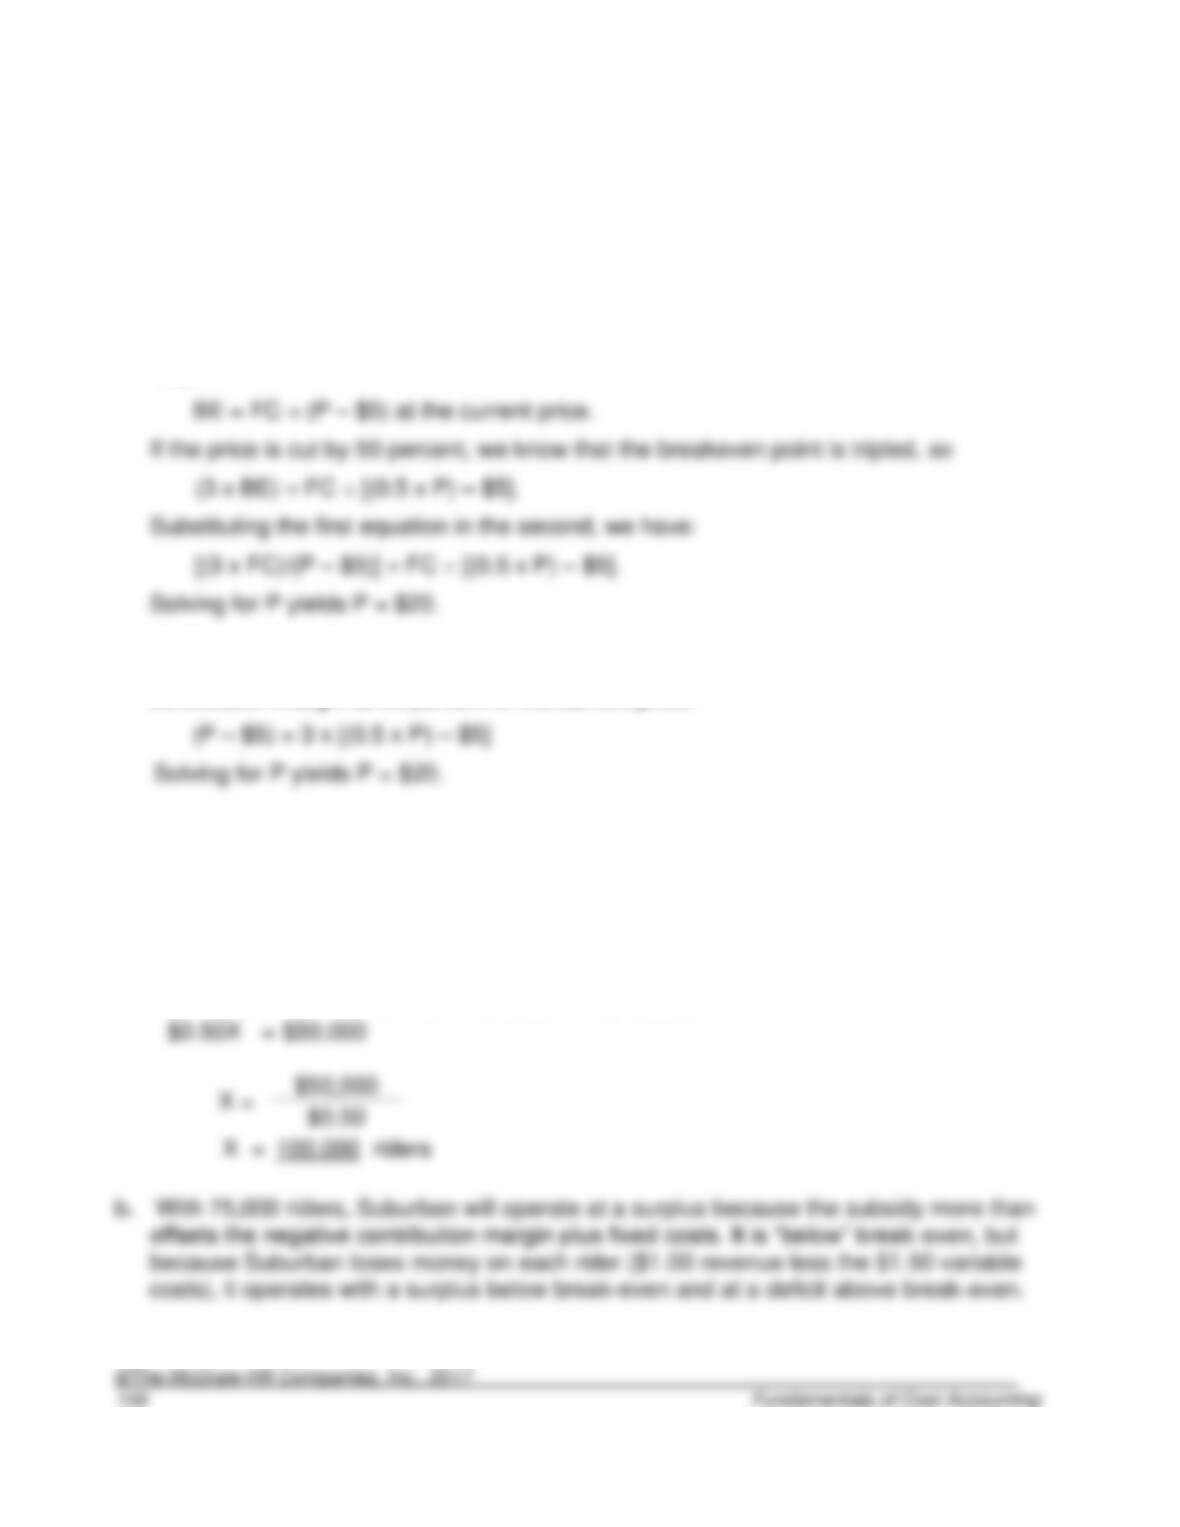
3-46. (20 min.) CVP Analysis―Missing Data: Remington Inc.
P = $20
There are several ways to approach this problem. Note that although we do not know
the fixed costs, they are irrelevant to the solution as we will see.
(1) Set this up as two equations with two unknowns (Price and the breakeven point).
Let P = Current price, BE the breakeven point at the current price, and FC fixed cost.
Then
(2) For the same fixed cost, if the new breakeven point is three times the old
breakeven point, the contribution margin at the current price must be three times the
contribution margin at 50 percent of the current price:
3-47. (20 min.) CVP Analysis With Subsidies: Suburban Bus Lines.
a.
Surplus
=
(P – V)X – F + Subsidy
$0
=
($1.00 – $1.50)X – $200,000 + $250,000
3-48. (35 min.) CVP Analysis―Sensitivity Analysis: Alameda Tile.
a.
Profit
=
(P – V) X – F
Profit
=
($800 – $480) X – $160,000
0
=
($800 – $480) X – $160,000
=
b.
=
($800 – $480) X – $160,000
=
$240,000 ÷ $320
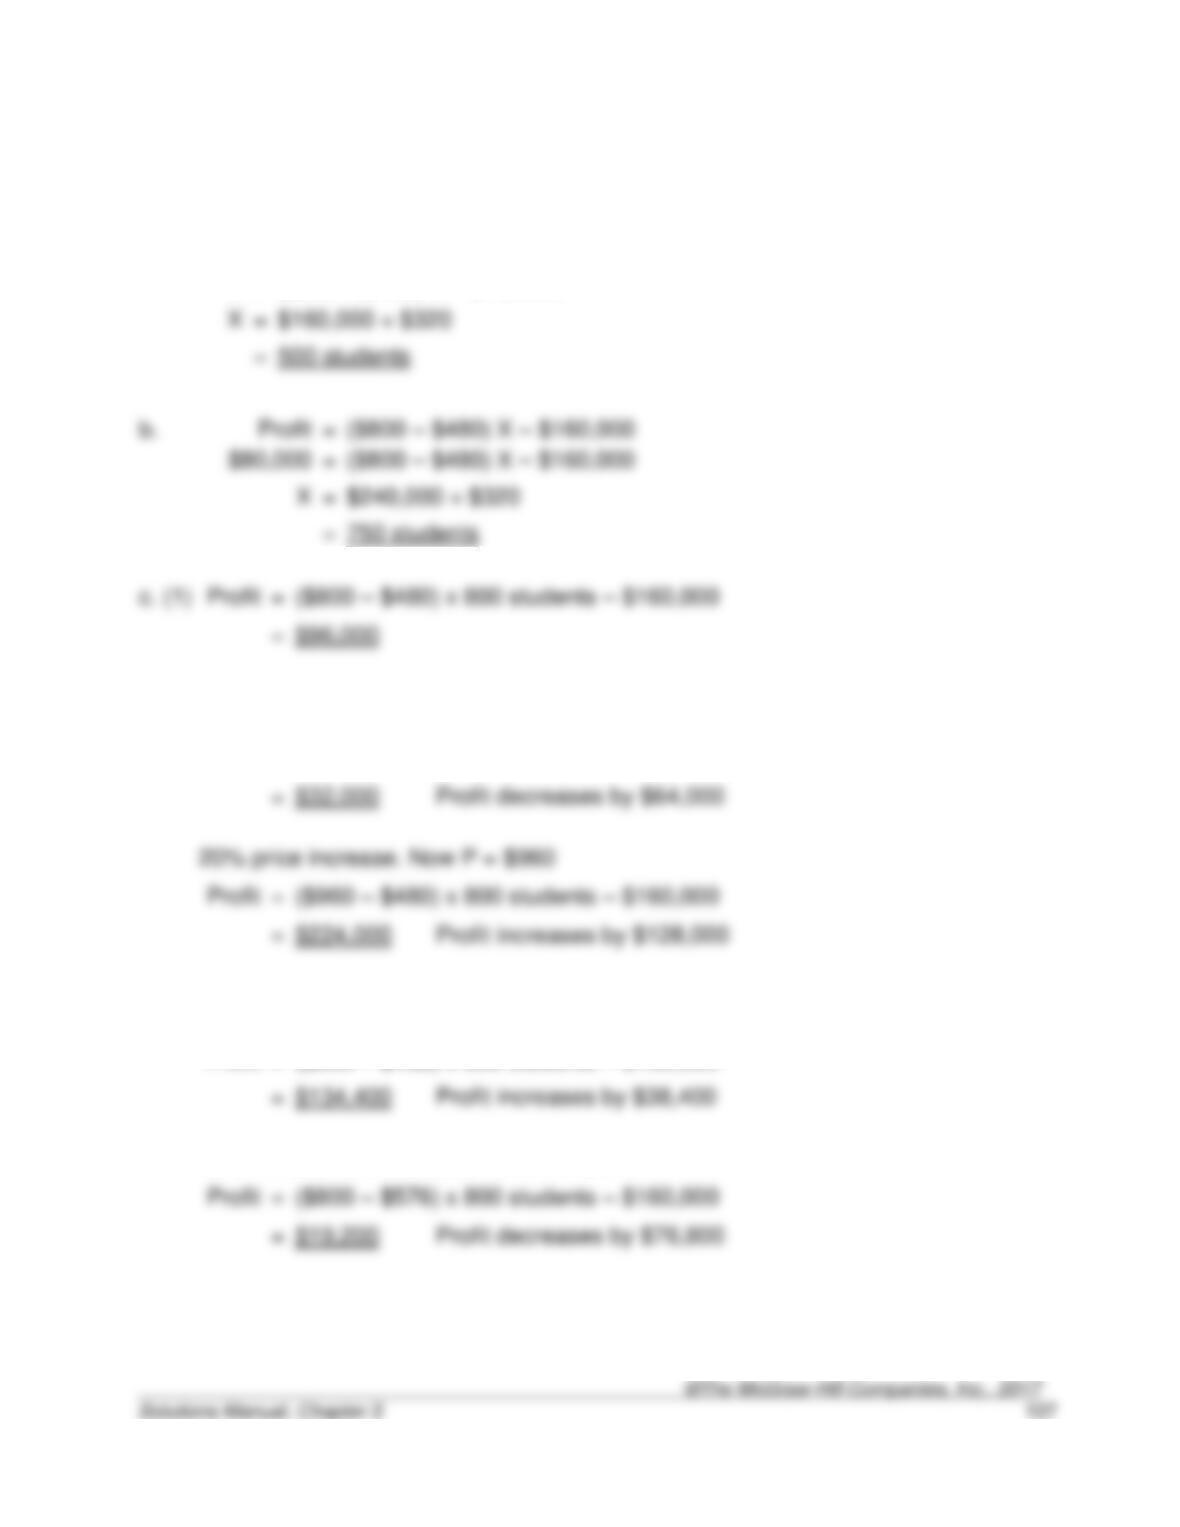
c. (1)
Profit
=
($800 – $480) x 800 students – $160,000
c. (2)
10% price decrease. Now P = $720
Profit
=
($720 – $480) x 800 students – $160,000
20% price increase. Now P = $960
Profit
=
($960 – $480) x 800 students – $160,000
c. (3)
10% variable cost decrease. Now V = $432
Profit
=
($800 – $432) x 800 students – $160,000
20% variable cost increase. Now V = $576
Profit
=
($800 – $576) x 800 students – $160,000
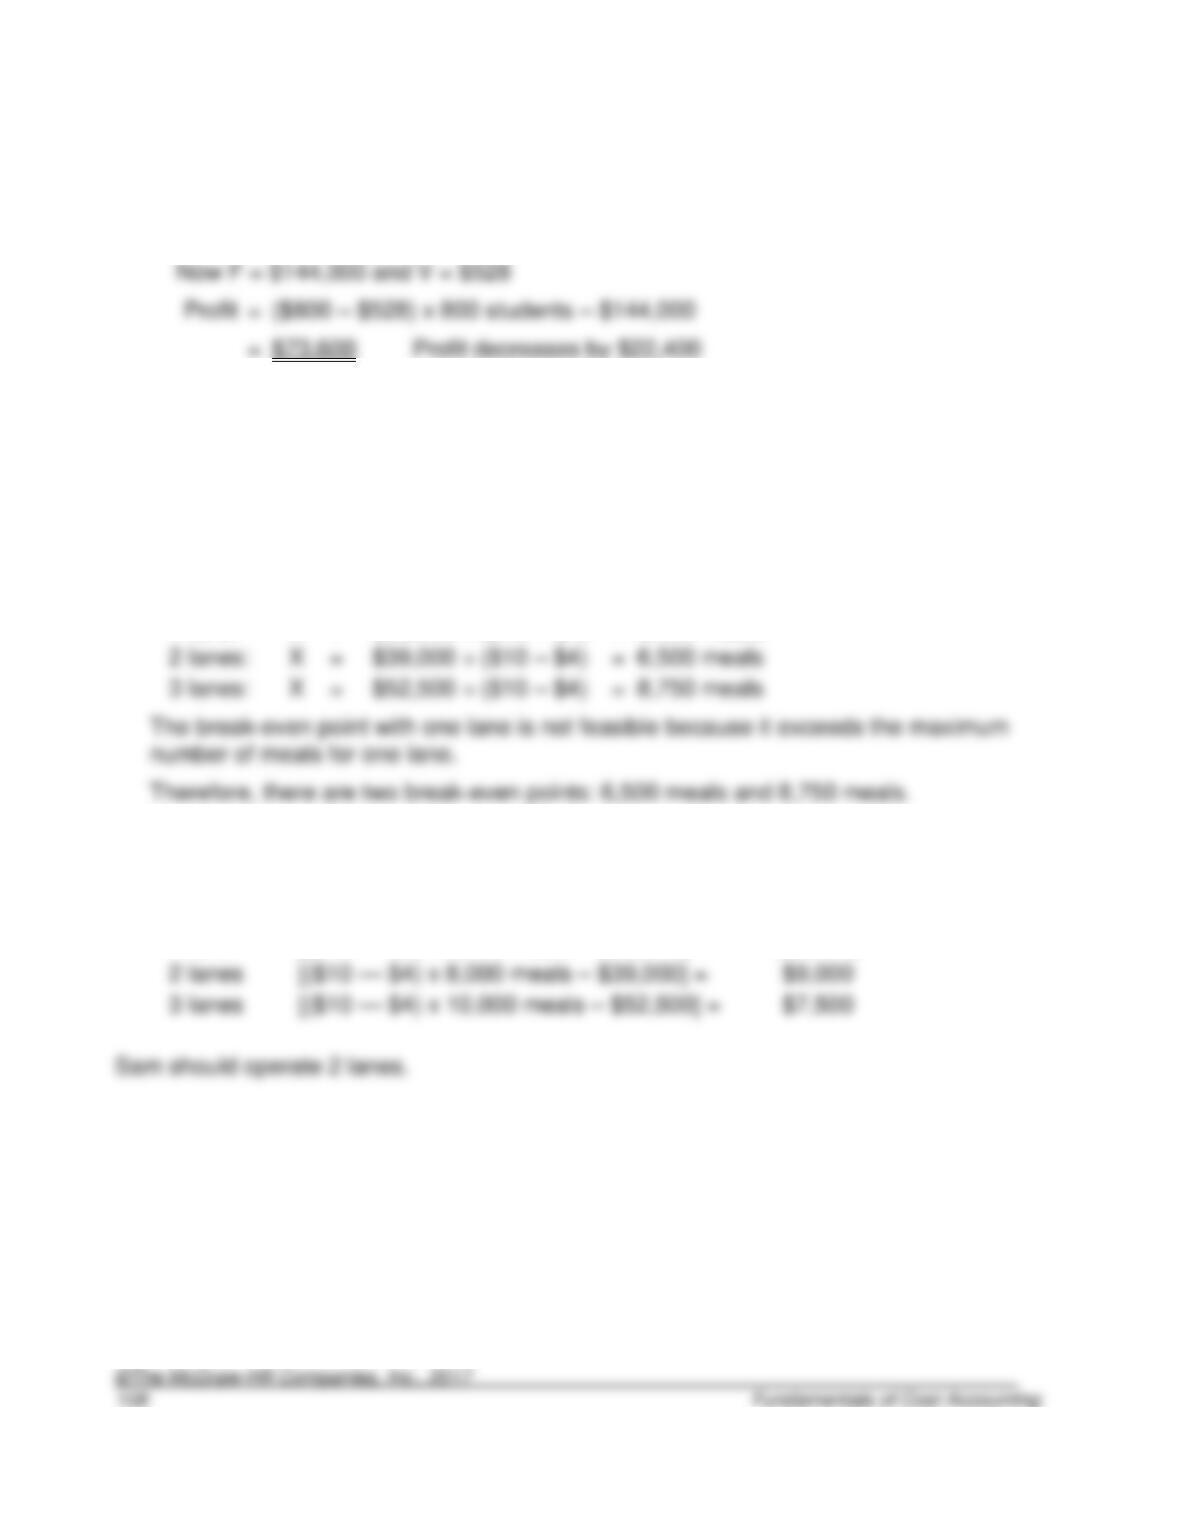
3-48 (continued).
c. (4)
=
10% fixed cost decrease, 10% variable cost increase.
3-49. (35 min.) Extensions of the CVP Model―Semifixed (Step) Costs: Sam’s
Sushi.
a. There are three possible break-even points (one with each additional lane):
1 lane:
X
=
$33,000 ÷ ($10 – $4)
=
5,500 meals
2 lanes:
X
=
6,500 meals
3 lanes:
X
=
$52,500 ÷ ($10 – $4)
=
8,750 meals
b. To answer this question, we just need to check at the three maximum levels for each
lane alternative:
Alternative
Profit (Loss)
1 lane
[($10 — $4) x 5,000 meals – $33,000] =
($3,000)
2 lanes
[($10 — $4) x 8,000 meals – $39,000] =
3 lanes
[($10 — $4) x 10,000 meals – $52,500] =
3-50. (35 min.) Extensions of the CVP Model―Semifixed (Step) Costs: Cesar’s
Bottlers.
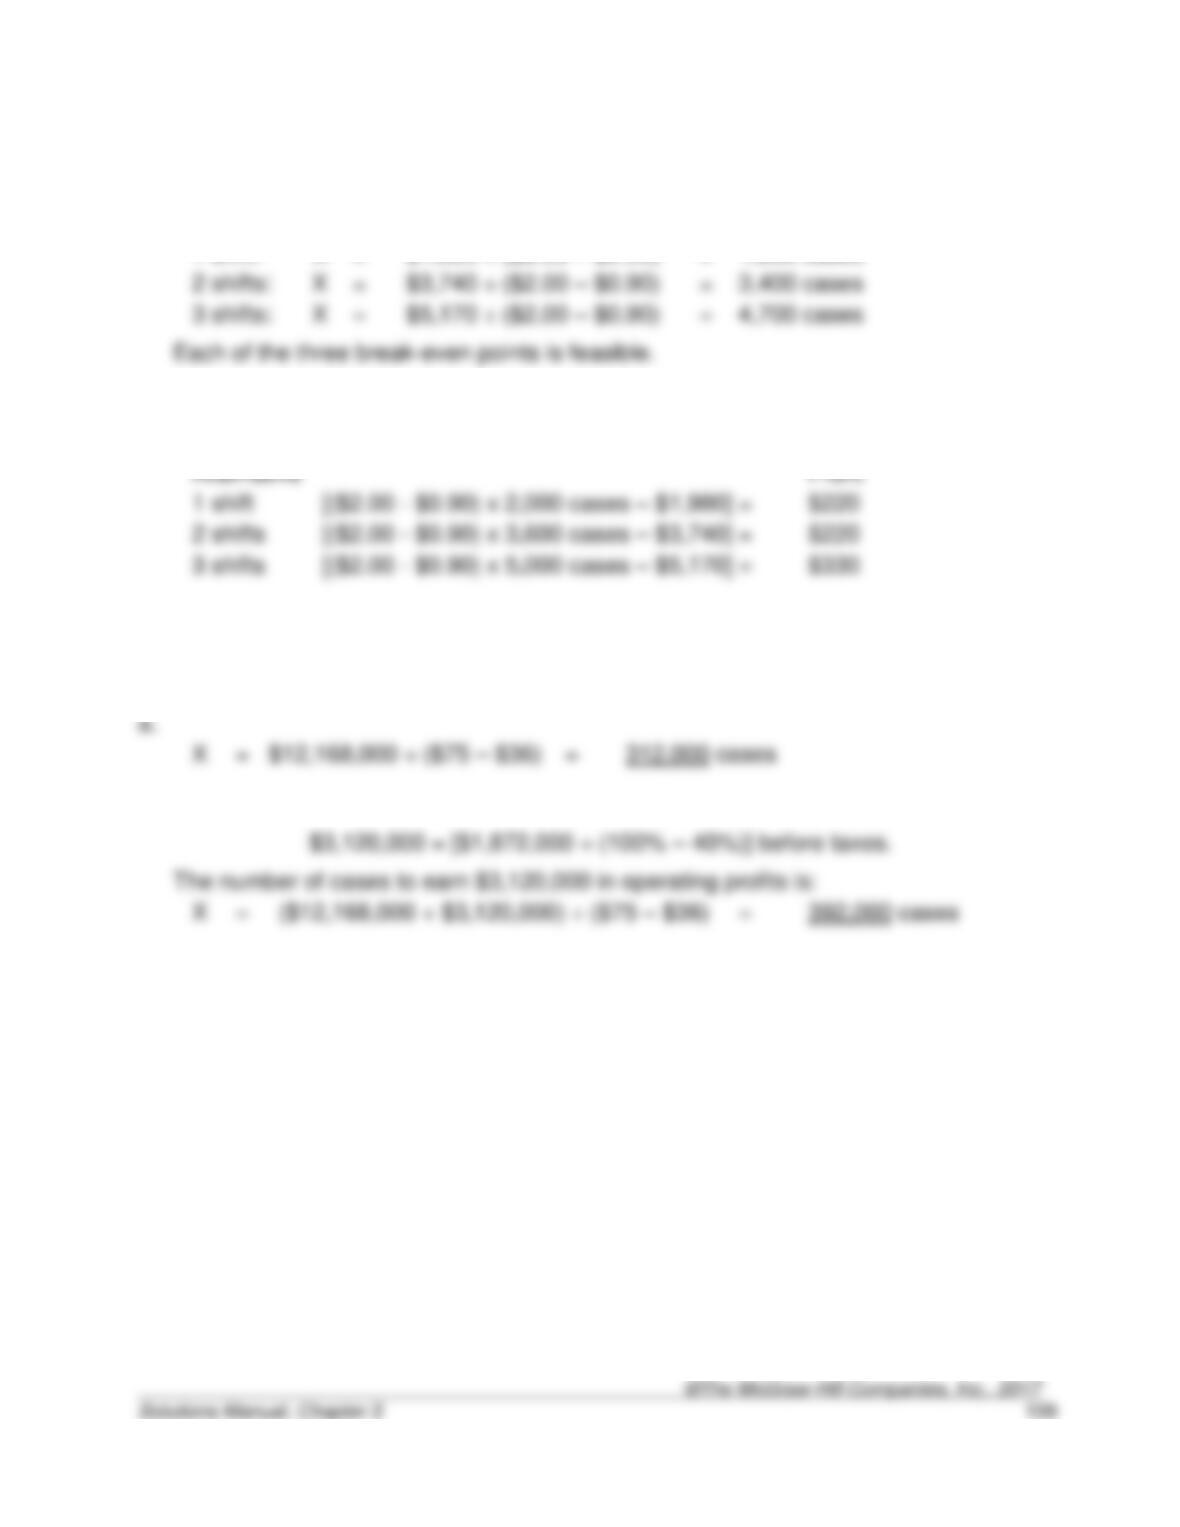
a. There are three possible break-even points (one with each additional shift):
1 shift:
X
=
$1,980 ÷ ($2.00 – $0.90)
=
1,800 cases
2 shifts:
X
=
$3,740 ÷ ($2.00 – $0.90)
=
3,400 cases
b. To answer this question, we just need to check at the three maximum levels for each
lane alternative:
1 shift
[($2.00 – $0.90) x 2,000 cases – $1,980] =
$220
3 shifts
[($2.00 – $0.90) x 5,000 cases – $5,170] =
$330
Cesar should operate 3 shifts.
3-51. (15 min.) Extensions of the CVP Model—Taxes: Odd Wallow Drinks.
b. In order to achieve a profit of $1,872,000 after tax, Odd Wallow must earn:
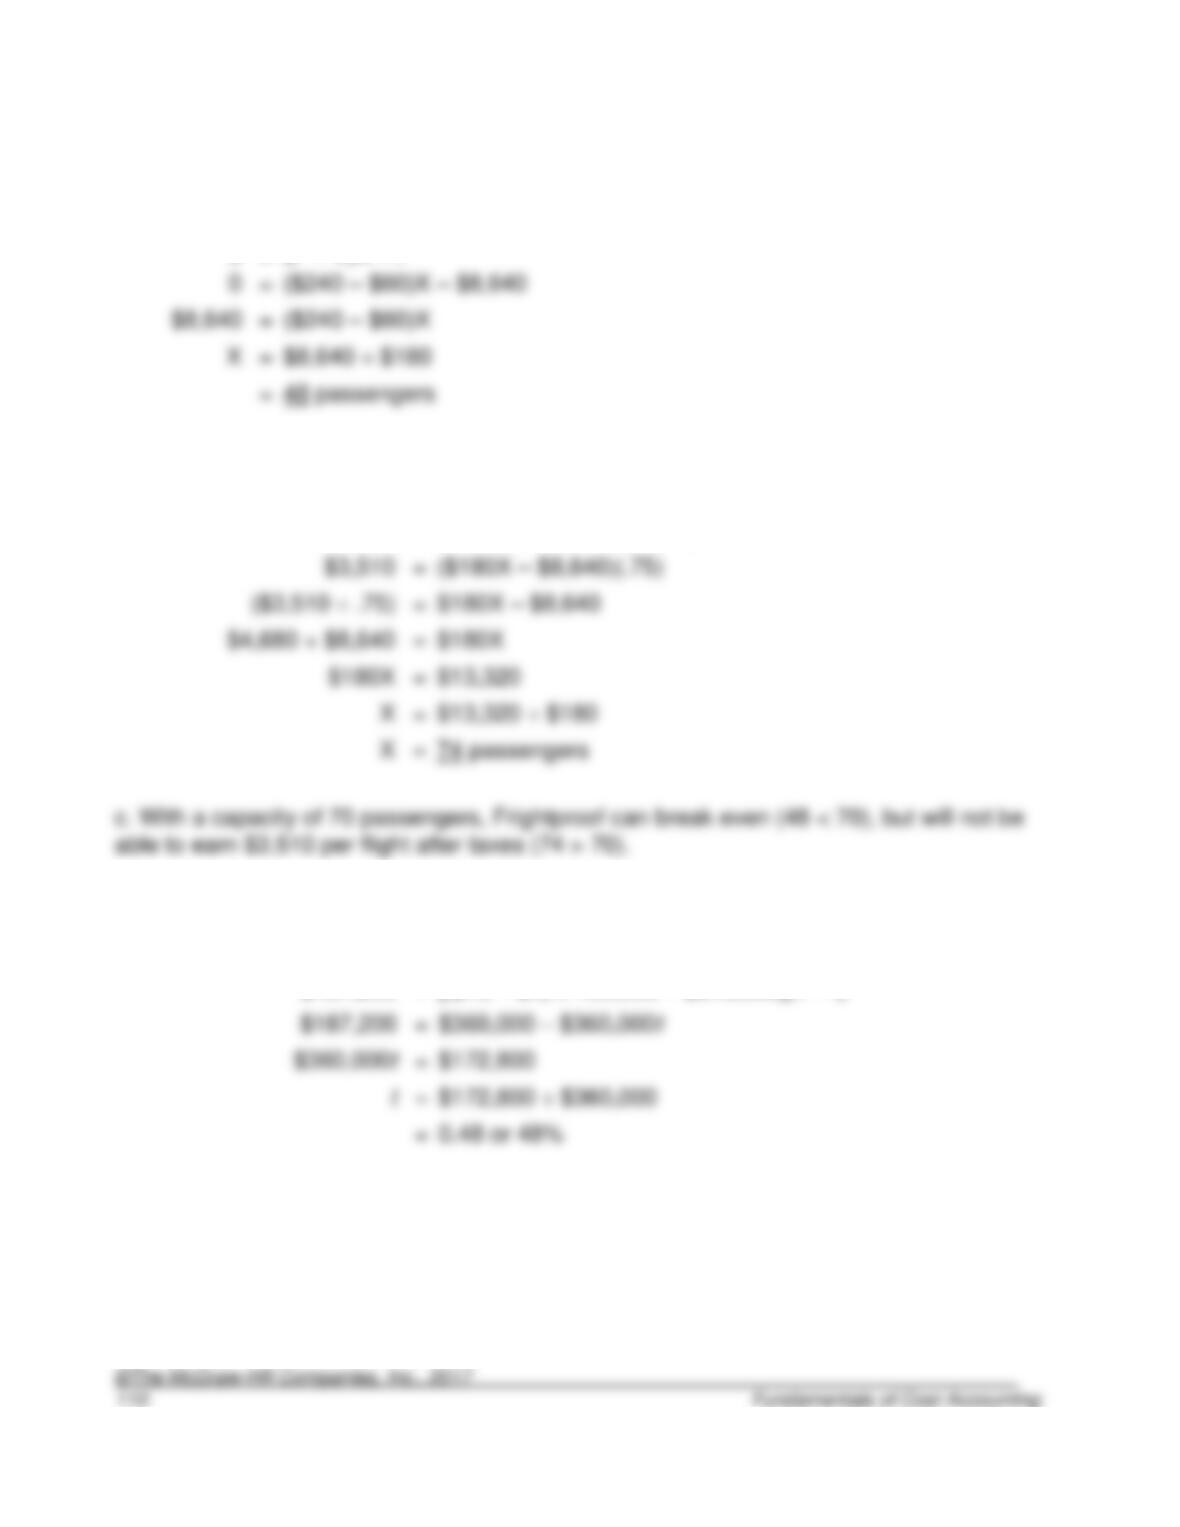
3-52. (20 min.) Extensions of the CVP Model—Taxes: Frightproof Commuter
Airlines.
a.
0
=
(P – V)X – F
=
$8,640 ÷ $180
=
b.
After-tax profits
=
[(P – V)X – F](1 – t)
$3,510
=
[($240 – $60)X – $8,640](1 – .25)
$3,510
=
=
$180X
=
$13,320
=
3-53. (20 min.) Extensions of the CVP Model—Taxes: Central Co.
After tax profits
=
[(P – V)X – F](1 – t)
$187,200
=
=
$172,800 ÷ $360,000
=
$187,200
=
[($13 – $4) x 100,000 – $540,000](1 – t)
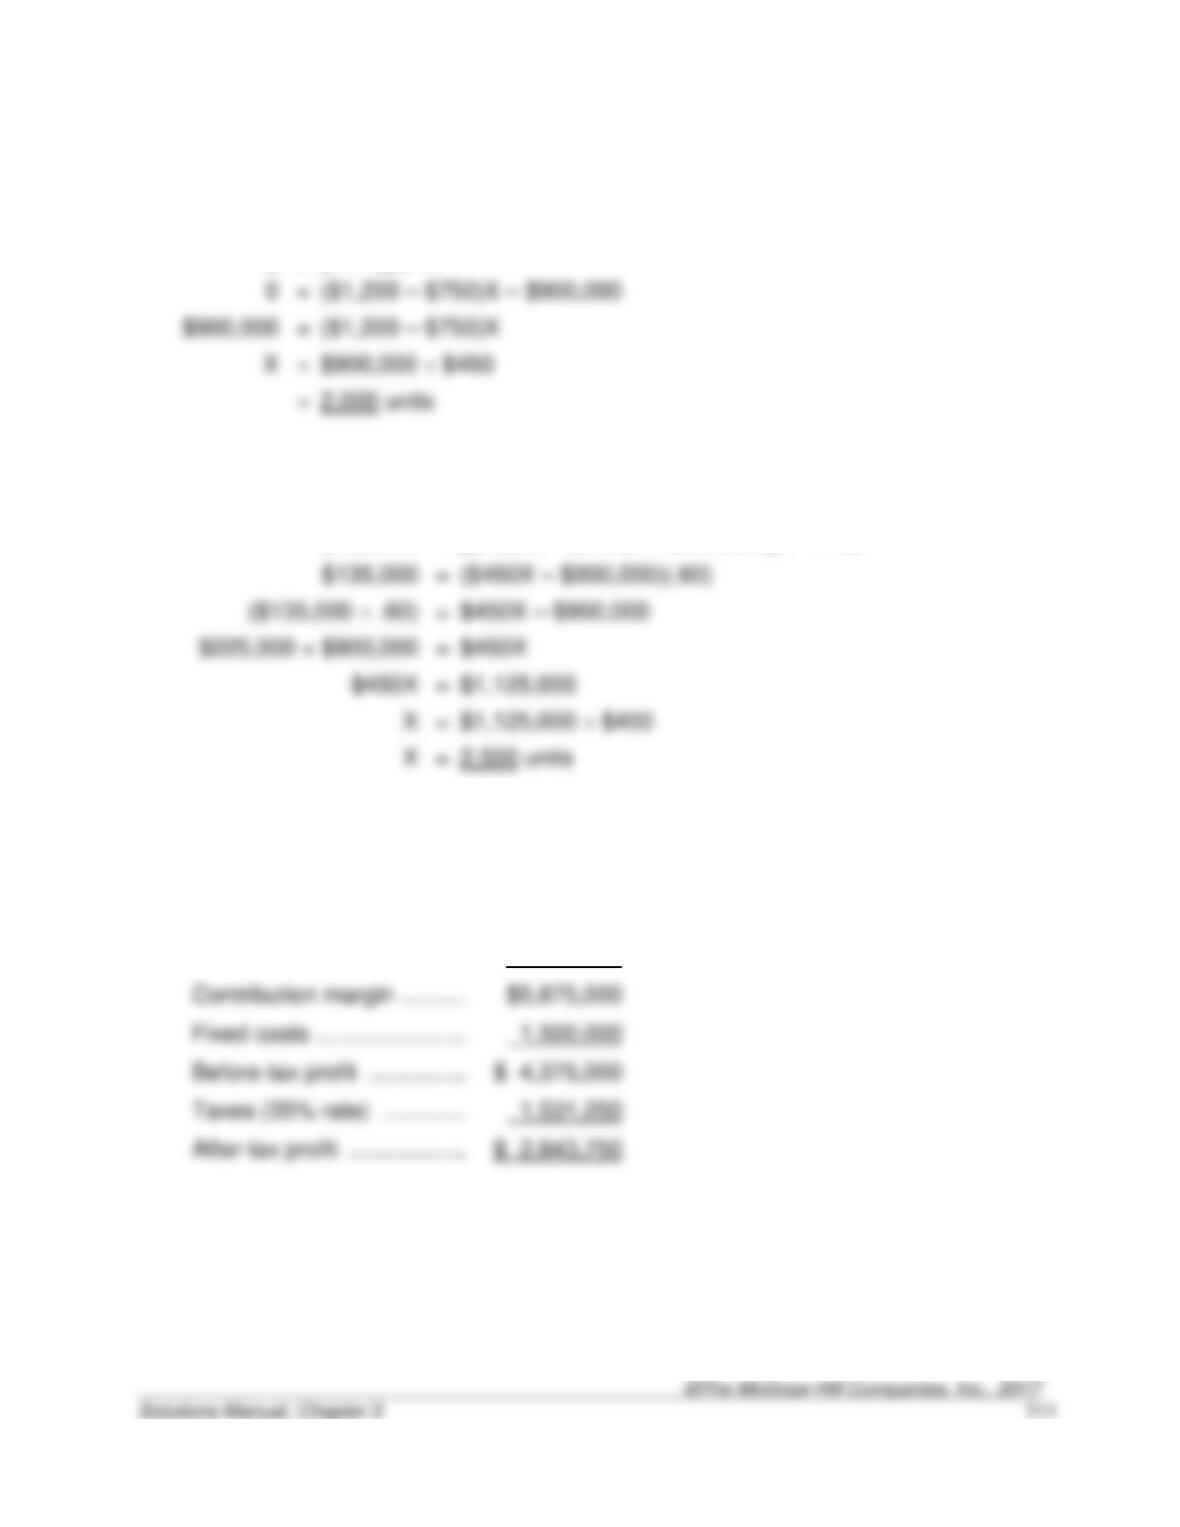
3-54. (20 min.) Extensions of the CVP Model—Taxes: Toys 4 Us.
a.
0
=
(P – V)X – F
=
($1,200 – $750)X
$900,000 ÷ $450
b.
After tax profits
=
[(P – V)X – F](1 – t)
$135,000
=
[($1,200 – $750)X – $900,000](1 – .40)
=
=
$450X
=
$1,125,000 ÷ $450
=
3-55. (40 min.) Extensions of the CVP Model—Taxes: Eagle Company.
a.
Sales …………………………..
$10,000,000
(= $400 x 25,000)
Variable costs ………………
4,125,000
(= $165 x 25,000)
Contribution margin ……….
Fixed costs …………………..
1,500,000
Before-tax profit ……………
$ 4,375,000
Taxes (35% rate) ………….
1,531,250
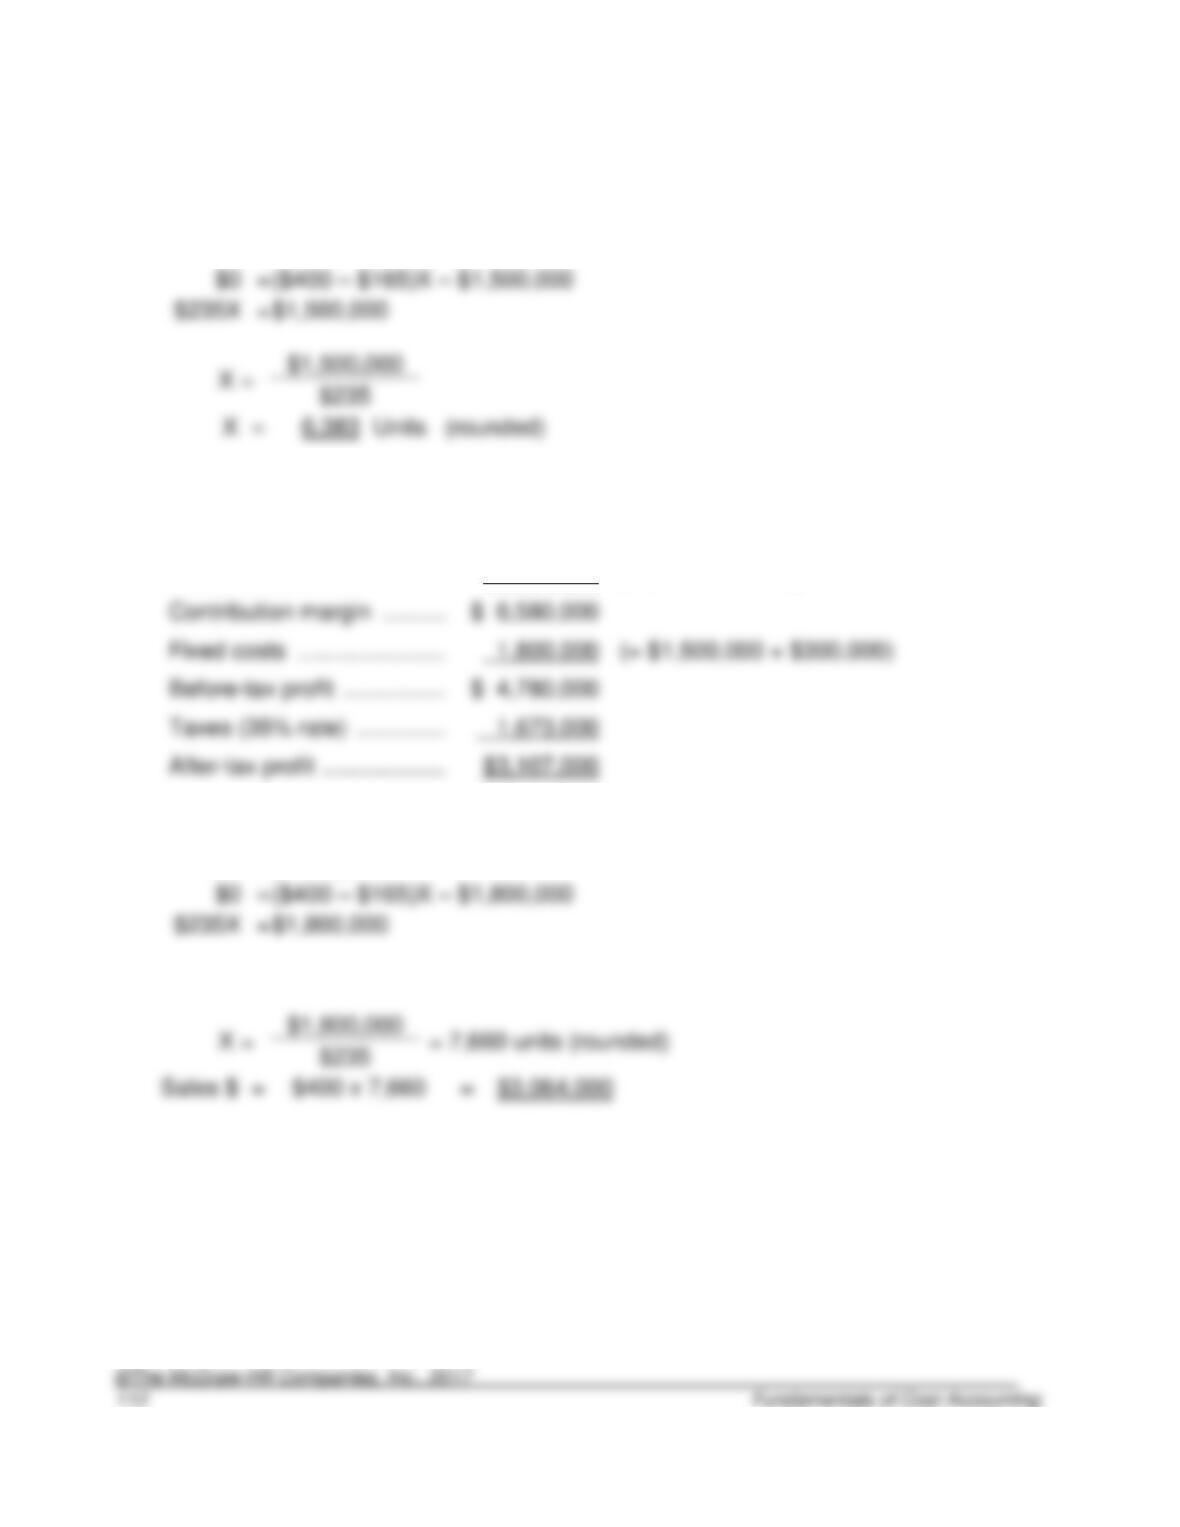
3-55 (continued).
b.
Profit
=
(P – V)X – F
=
$1,500,000
c.
Sales …………………………..
$11,200,000
(= $400 x 28,000)
Variable costs ……………….
4,620,000
(= $165 x 28,000)
Contribution margin ……….
$ 6,580,000
Fixed costs …………………..
1,800,000
(= $1,500,000 + $300,000)
Before-tax profit …………….
$ 4,780,000
Taxes (35% rate) …………..
d.
Profit
=
(P – V)X – F
=
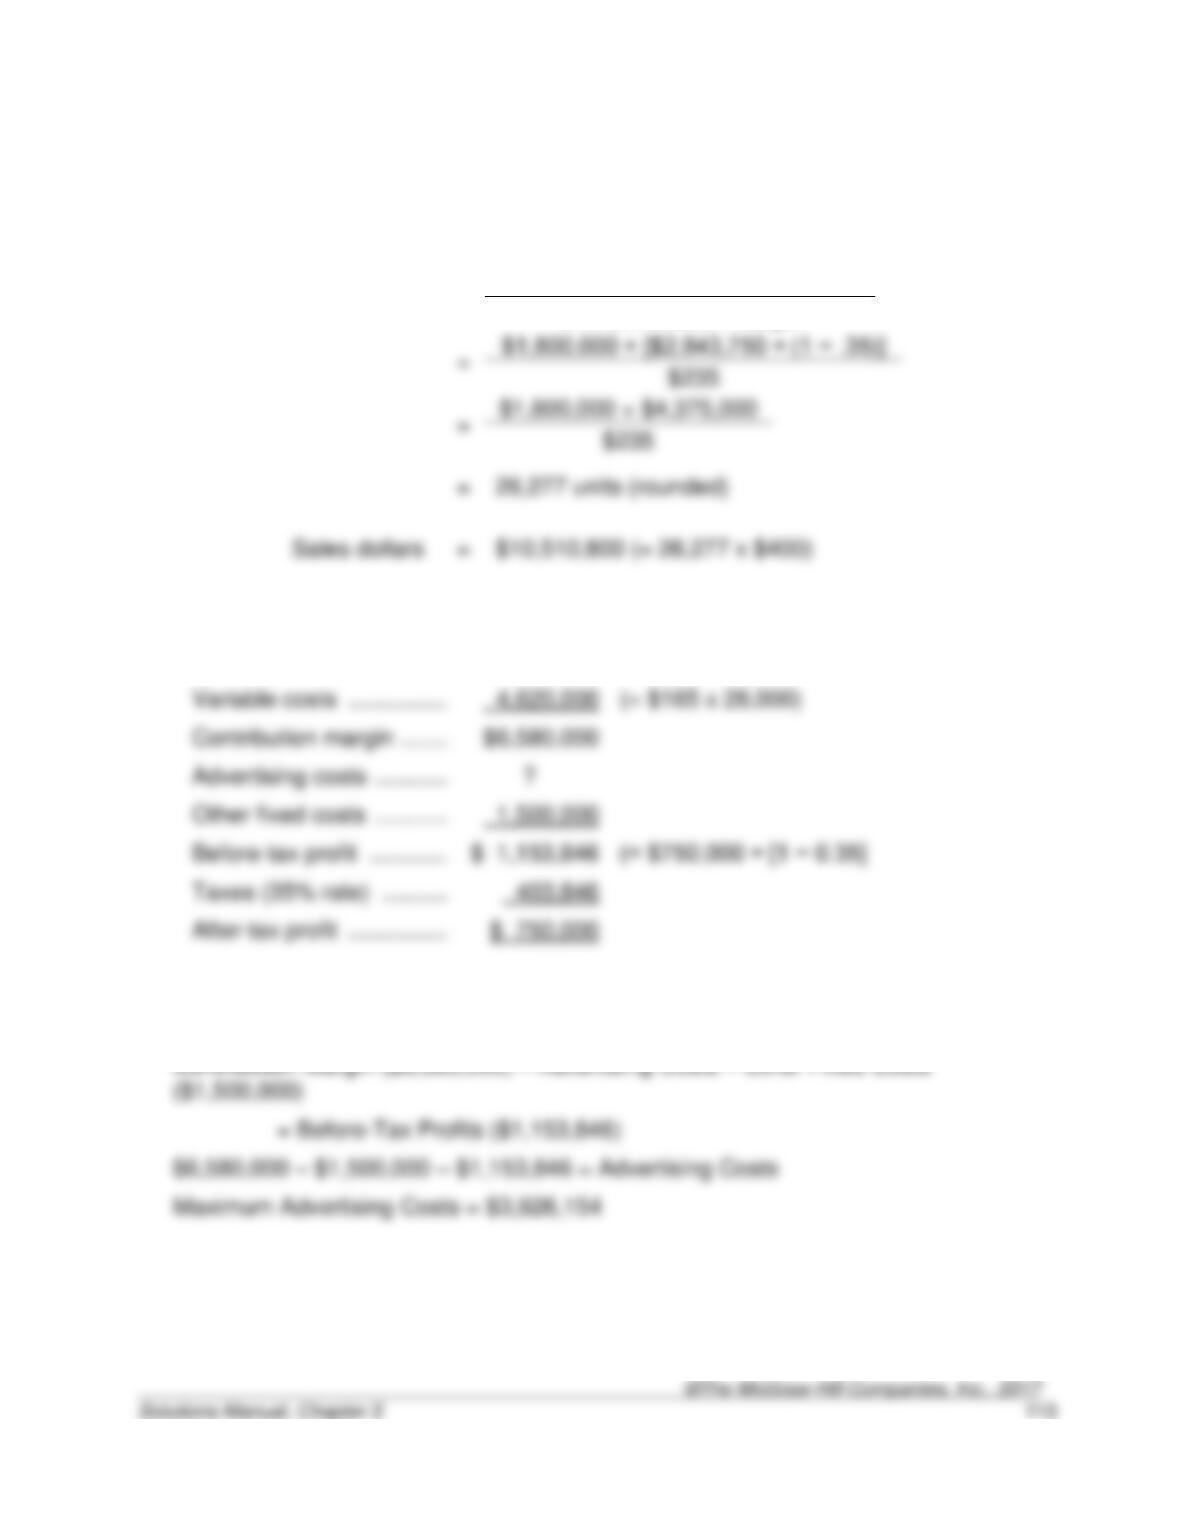
3-55 (continued).
e. $10,510,800
Target profit in units
=
Fixed costs + [Target profit ÷ (1 − t)]
Unit contribution margin
=
f. $3,926,154
Sales …………………………..
$11,200,000
(= $400 x 28,000)
Variable costs ………………
(= $165 x 28,000)
Contribution margin ……….
Advertising costs …………..
Other fixed costs …………..
Before-tax profit ……………
$ 1,153,846
Taxes (35% rate) ………….
To find the maximum advertising cost to maintain after-tax profit of $750,000, solve as
follows:
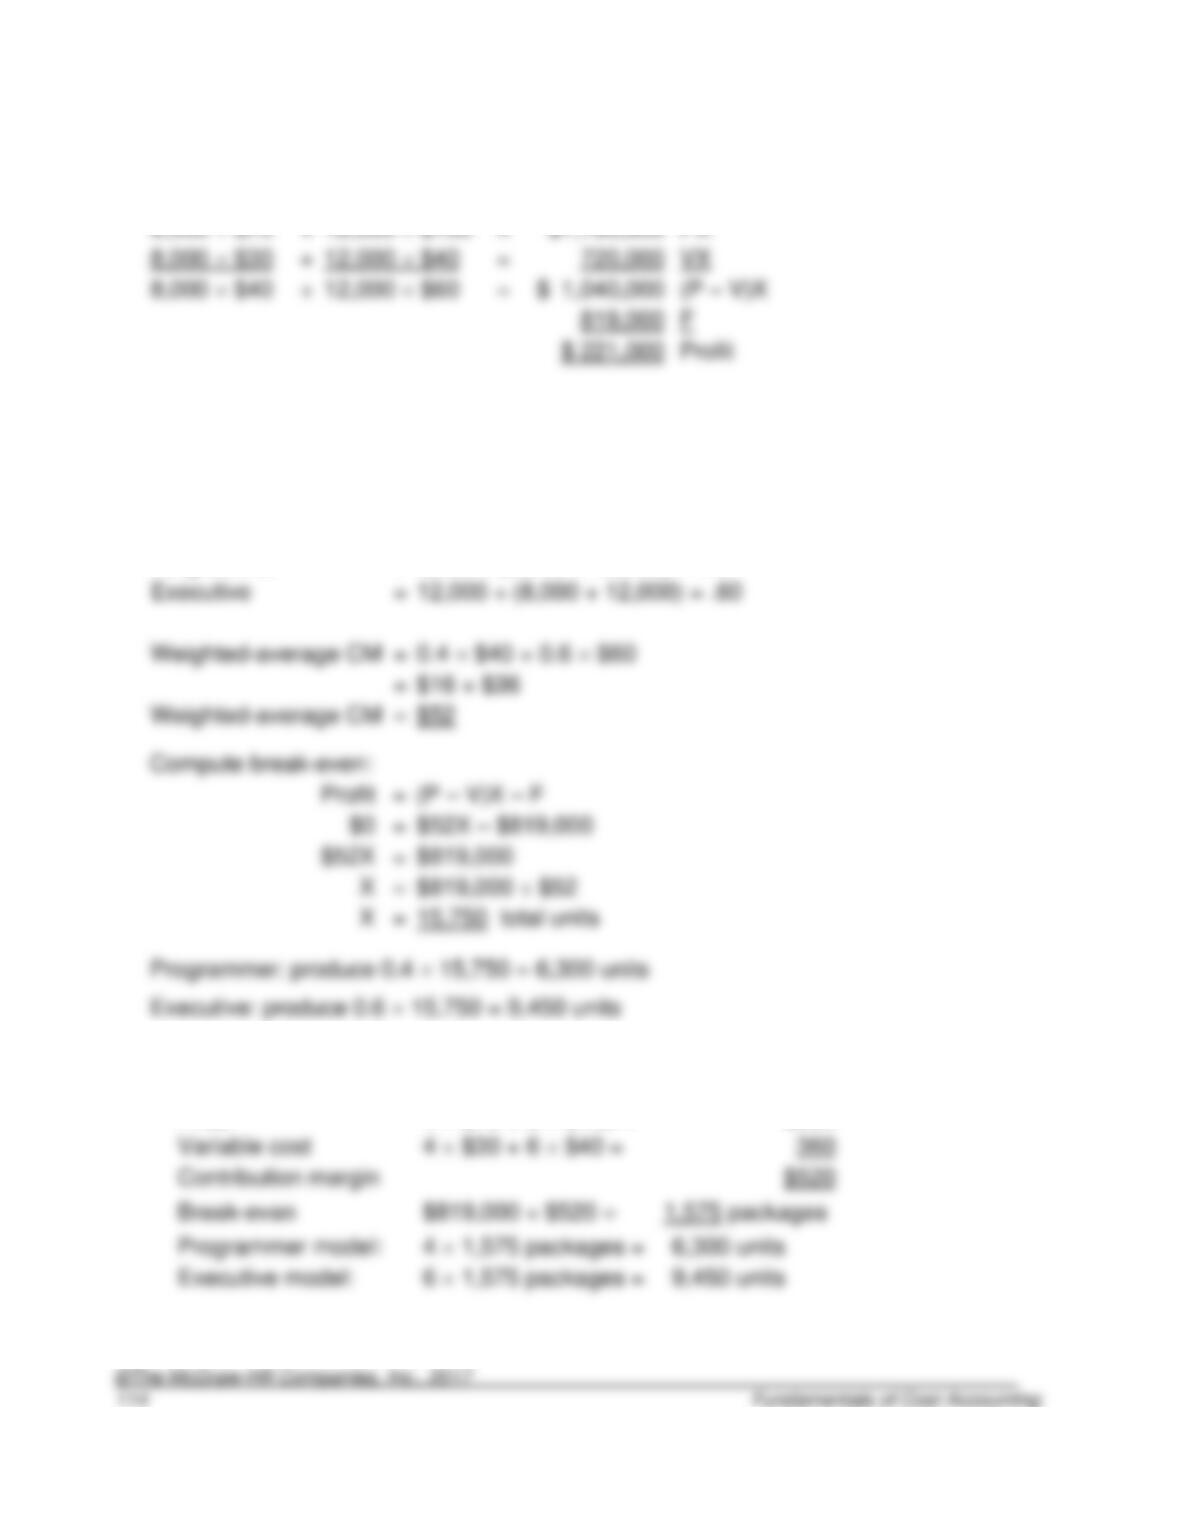
3-56. (30 min.) Extensions of the CVP Model—Multiple Products: On-the Go, Inc.
a.
Programmer
+
Executive
8,000 $70
8,000 $30
+
=
8,000 $40
+
=
(P – V)X
F
b.
Compute the weighted-average contribution margin.
Weights:
Programmer
=
8,000 ÷ (8,000 + 12,000) = .40
Executive
=
12,000 ÷ (8,000 + 12,000) = .60
Weighted-average CM
=
0.4 $40 + 0.6 $60
=
=
$819,000
$819,000 ÷ $52
Alternative approach:
Define a package containing 4 Programmer and 6 Executive models:
Price
4 $70 + 6 $100 =
$880
Variable cost
4 $30 + 6 $40 =
Executive model:
6 1,575 packages =
9,450 units
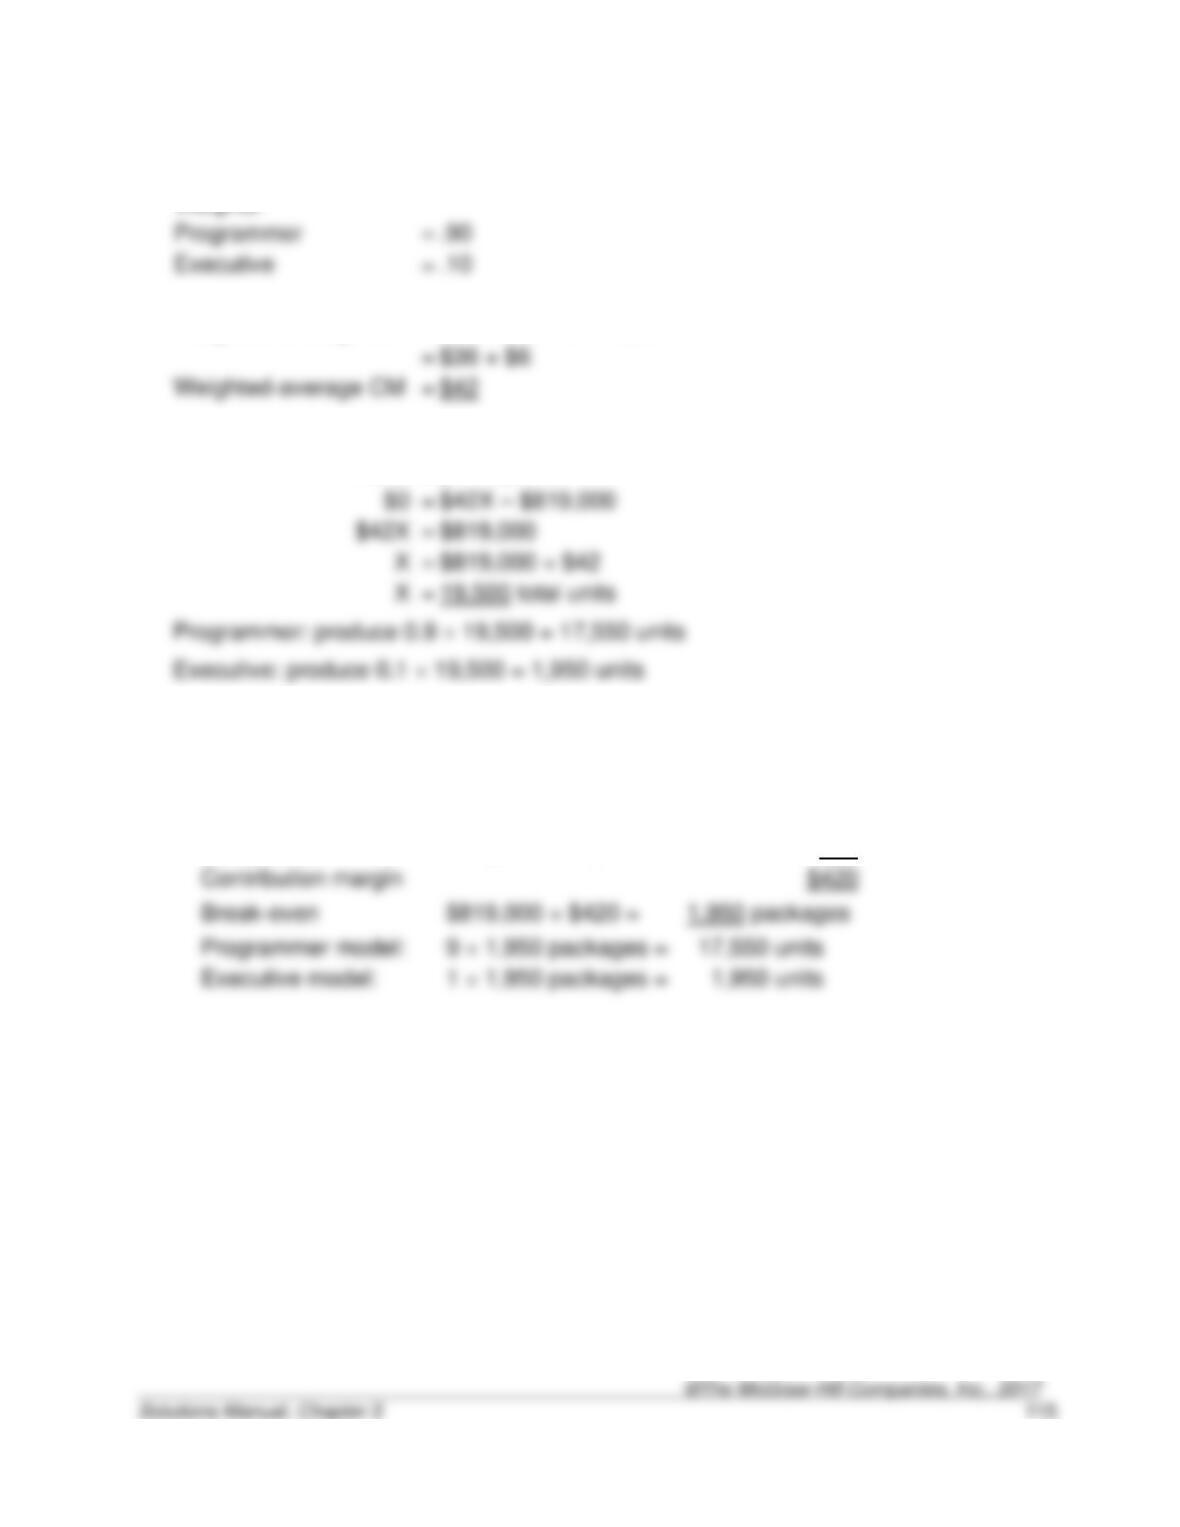
3-56. (continued).
c. New weights:
Weights:
Programmer
=
.90
Executive
.10
Weighted-average CM
=
0.9 $40 + 0.1 $60
Compute break-even:
Profit
=
(P – V)X – F
$819,000
=
$819,000 ÷ $42
19,500 total units
Alternative approach:
Define a package containing 9 Programmer and 1 Executive models:
Price
9 $70 + 1 $100 =
$730
Variable cost
9 $30 + 1 $40 =
310
Programmer model:
9 1,950 packages =
Executive model:
1 1,950 packages =
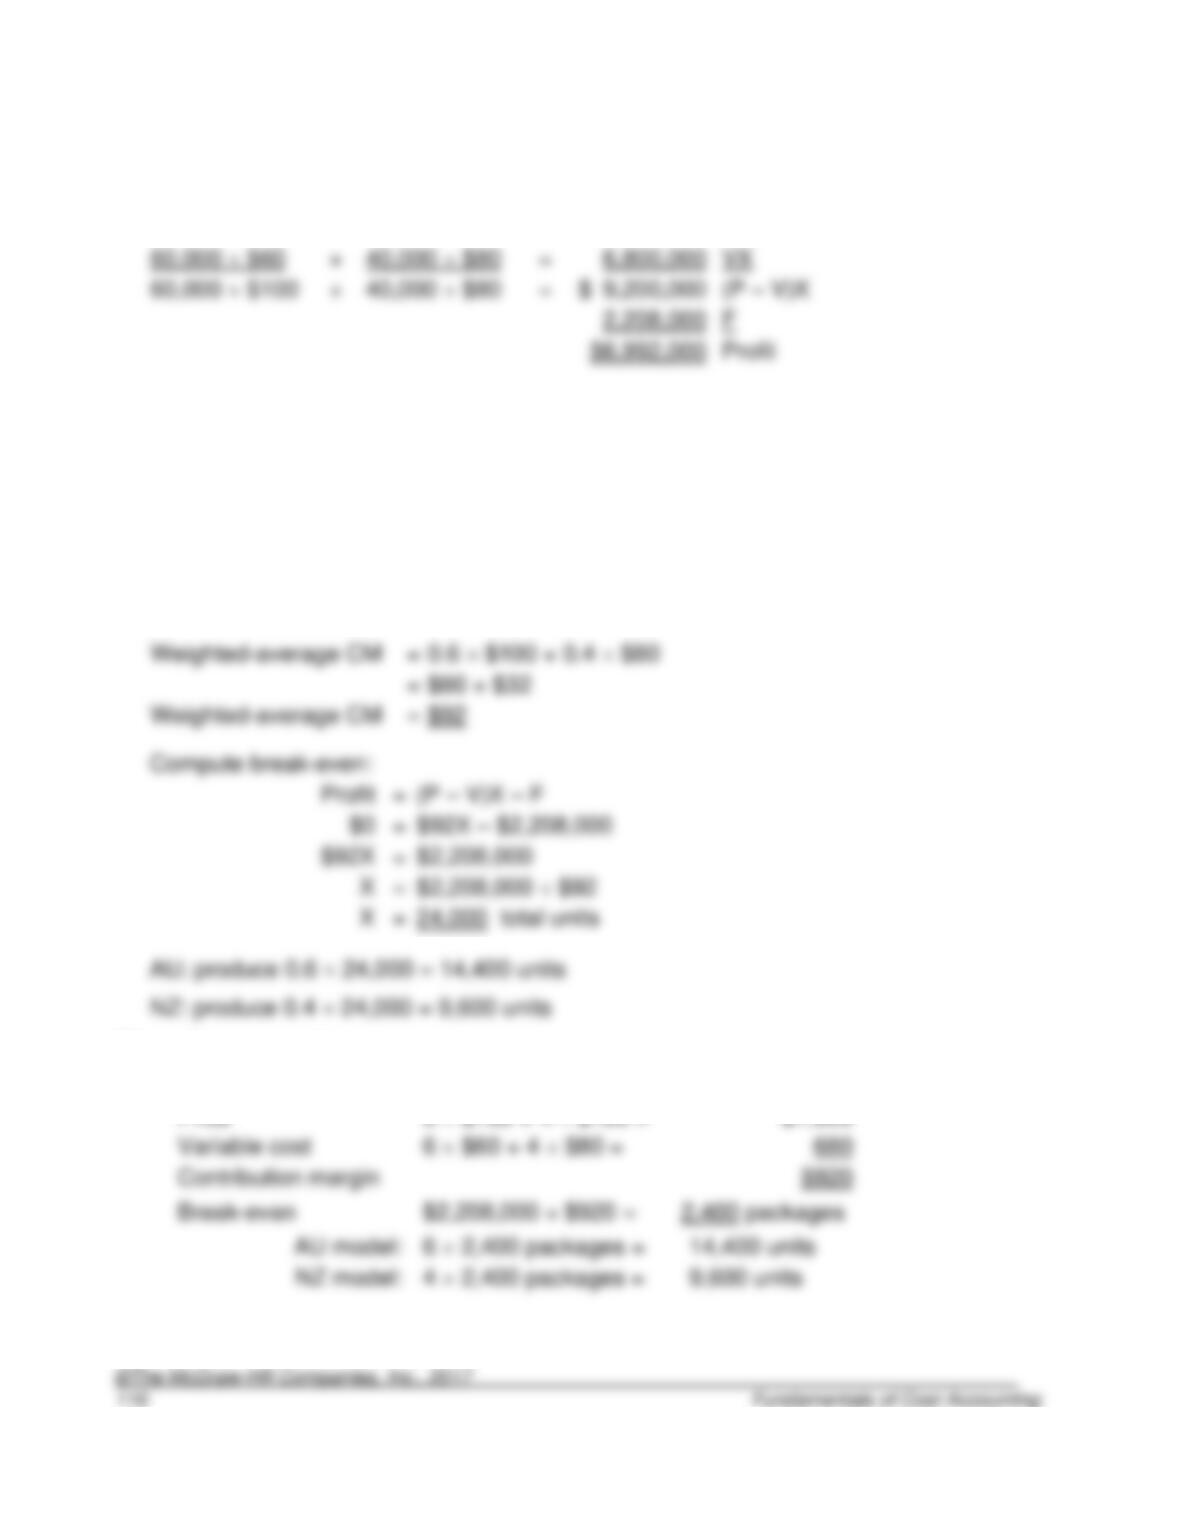
3-57. (30 min.) Extensions of the CVP Model—Multiple Products: Sundial, Inc.
a.
AU
+
NZ
60,000 $160
+
40,000 $160
=
$16,000,000
PX
(P – V)X
F
b.
Compute the weighted-average contribution margin.
Weights:
AU
=
60,000 ÷ (60,000 + 40,000) = .60
NZ
=
40,000 ÷ (60,000 + 40,000) = .40
Weighted-average CM
=
0.6 $100 + 0.4 $80
=
=
$2,208,000
$2,208,000 ÷ $92
Alternative approach:
Define a package containing 6 AU and 4 NZ models:
14,400 units
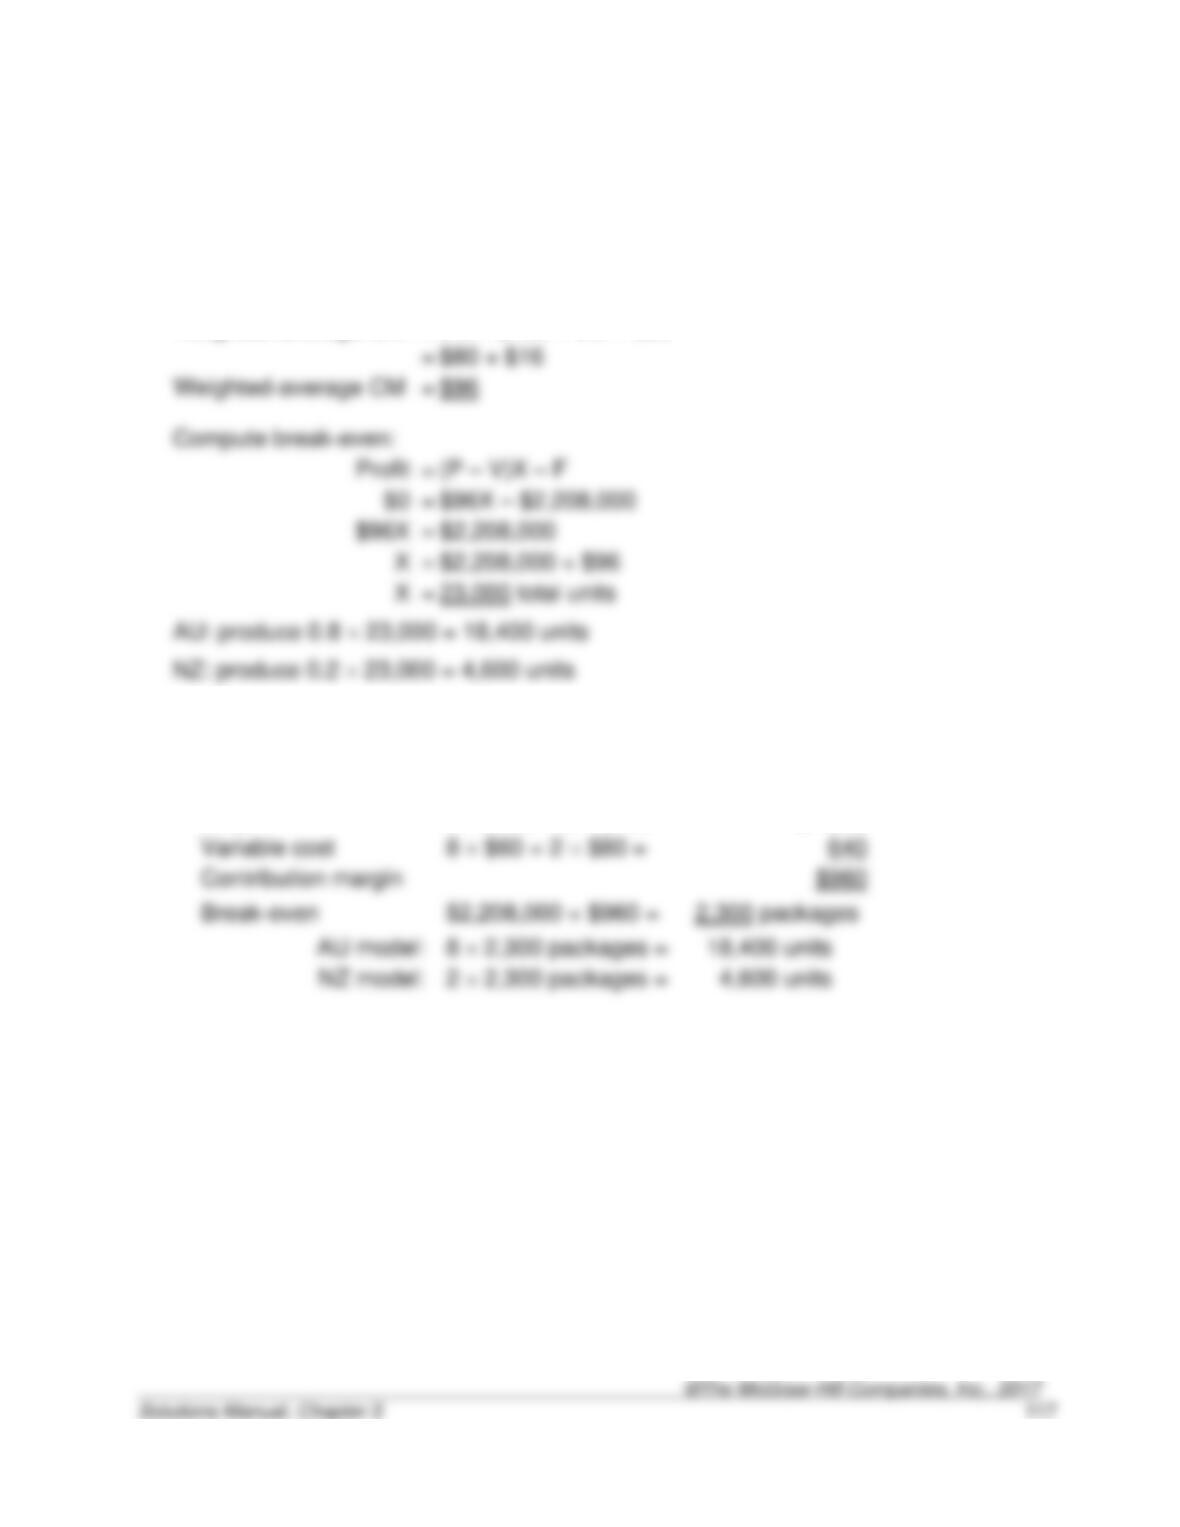
3-57. (continued).
c. New weights:
Weights:
AU
=
.80
NZ
=
.20
Weighted-average CM
=
0.8 $100 + 0.2 $80
=
=
(P – V)X – F
=
=
$2,208,000
=
$2,208,000 ÷ $96
=
23,000 total units
Alternative approach:
Define a package containing 8 AU and 2 NZ models:
Price
8 $160 + 2 $160 =
$1,600
2 2,300 packages =
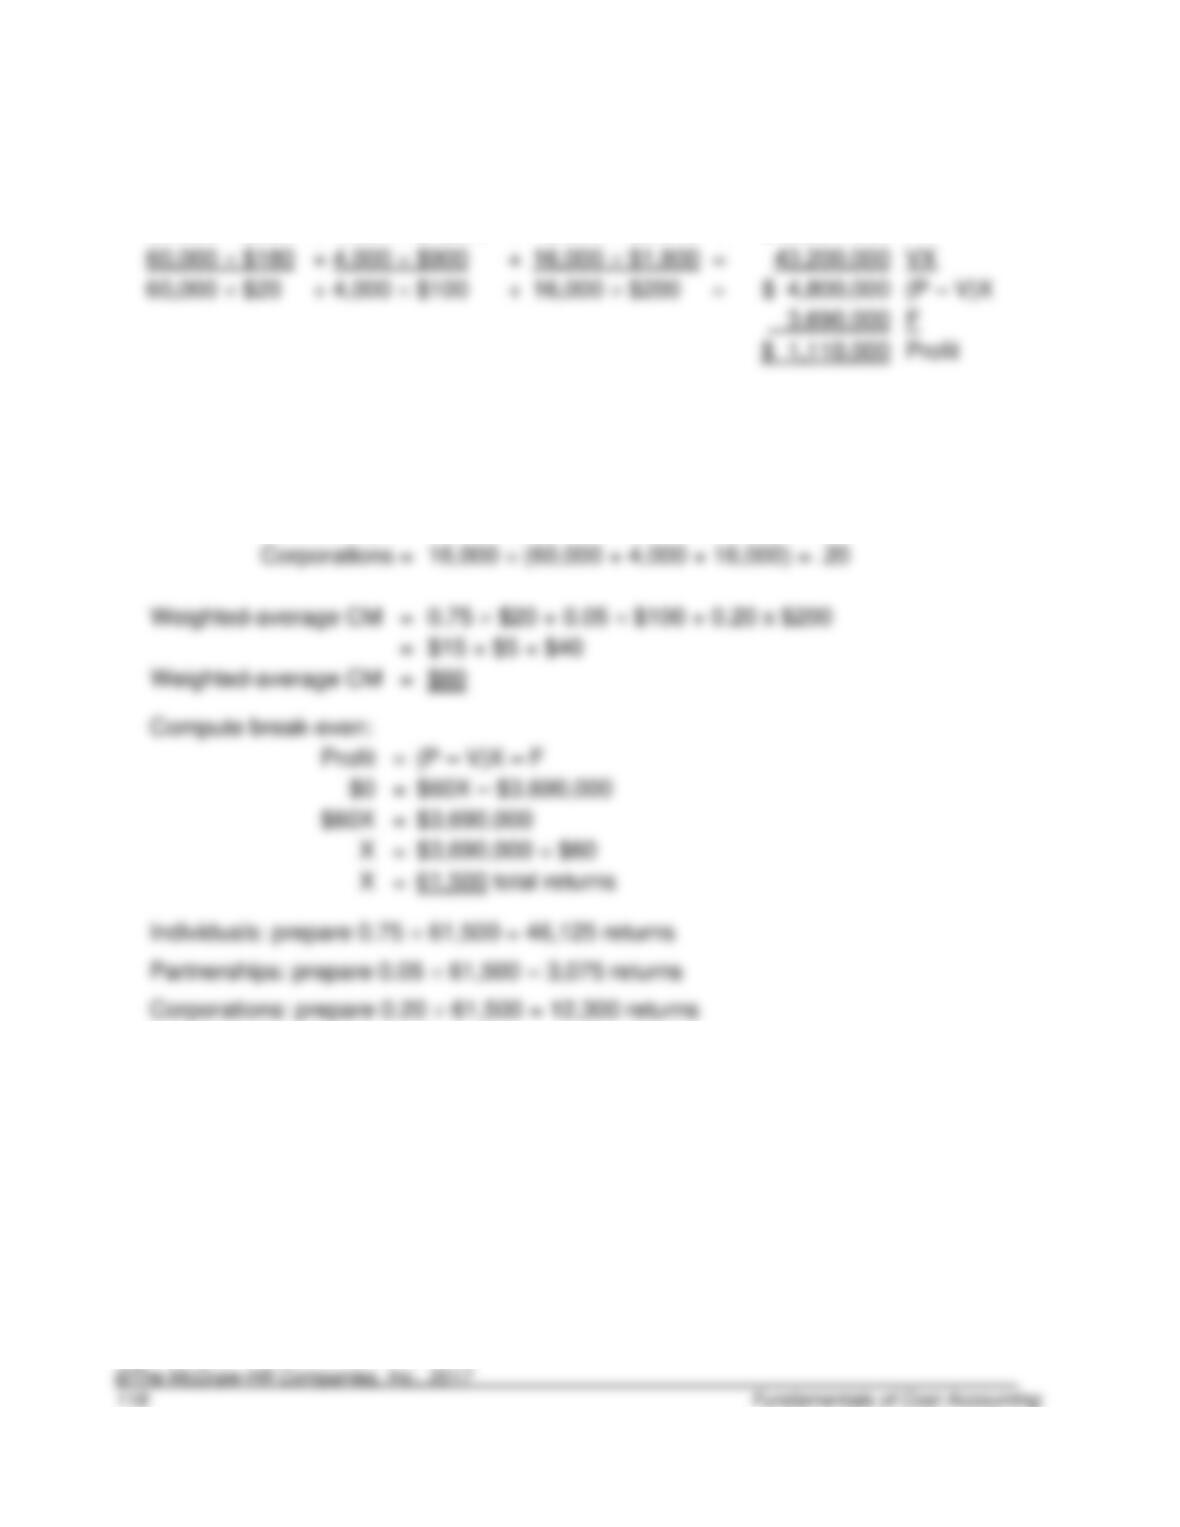
3-58. (30 min.) Extensions of the CVP Model—Multiple Products: Sell Block.
a.
Individuals
+
Partnerships
+
Corporations
60,000 $200
+
4,000 $1,000
+
16,000 $2,000
=
$48,000,000
PX
4,000 $900
60,000 $20
4,000 $100
(P – V)X
F
b. Compute the weighted-average contribution margin.
Weights:
Individuals
=
60,000 ÷ (60,000 + 4,000 + 16,000) = .75
Partnerships
=
4,000 ÷ (60,000 + 4,000 + 16,000) = .05
=
16,000 ÷ (60,000 + 4,000 + 16,000) = .20
Weighted-average CM
=
0.75 $20 + 0.05 $100 + 0.20 x $200
=
$15 + $5 + $40
(P – V)X – F
=
$3,690,000
$3,690,000 ÷ $60
3-58. (continued).
c. New weights:
Weights:
Individuals
=
.60
Partnerships
=
.10
Corporations
=
.30
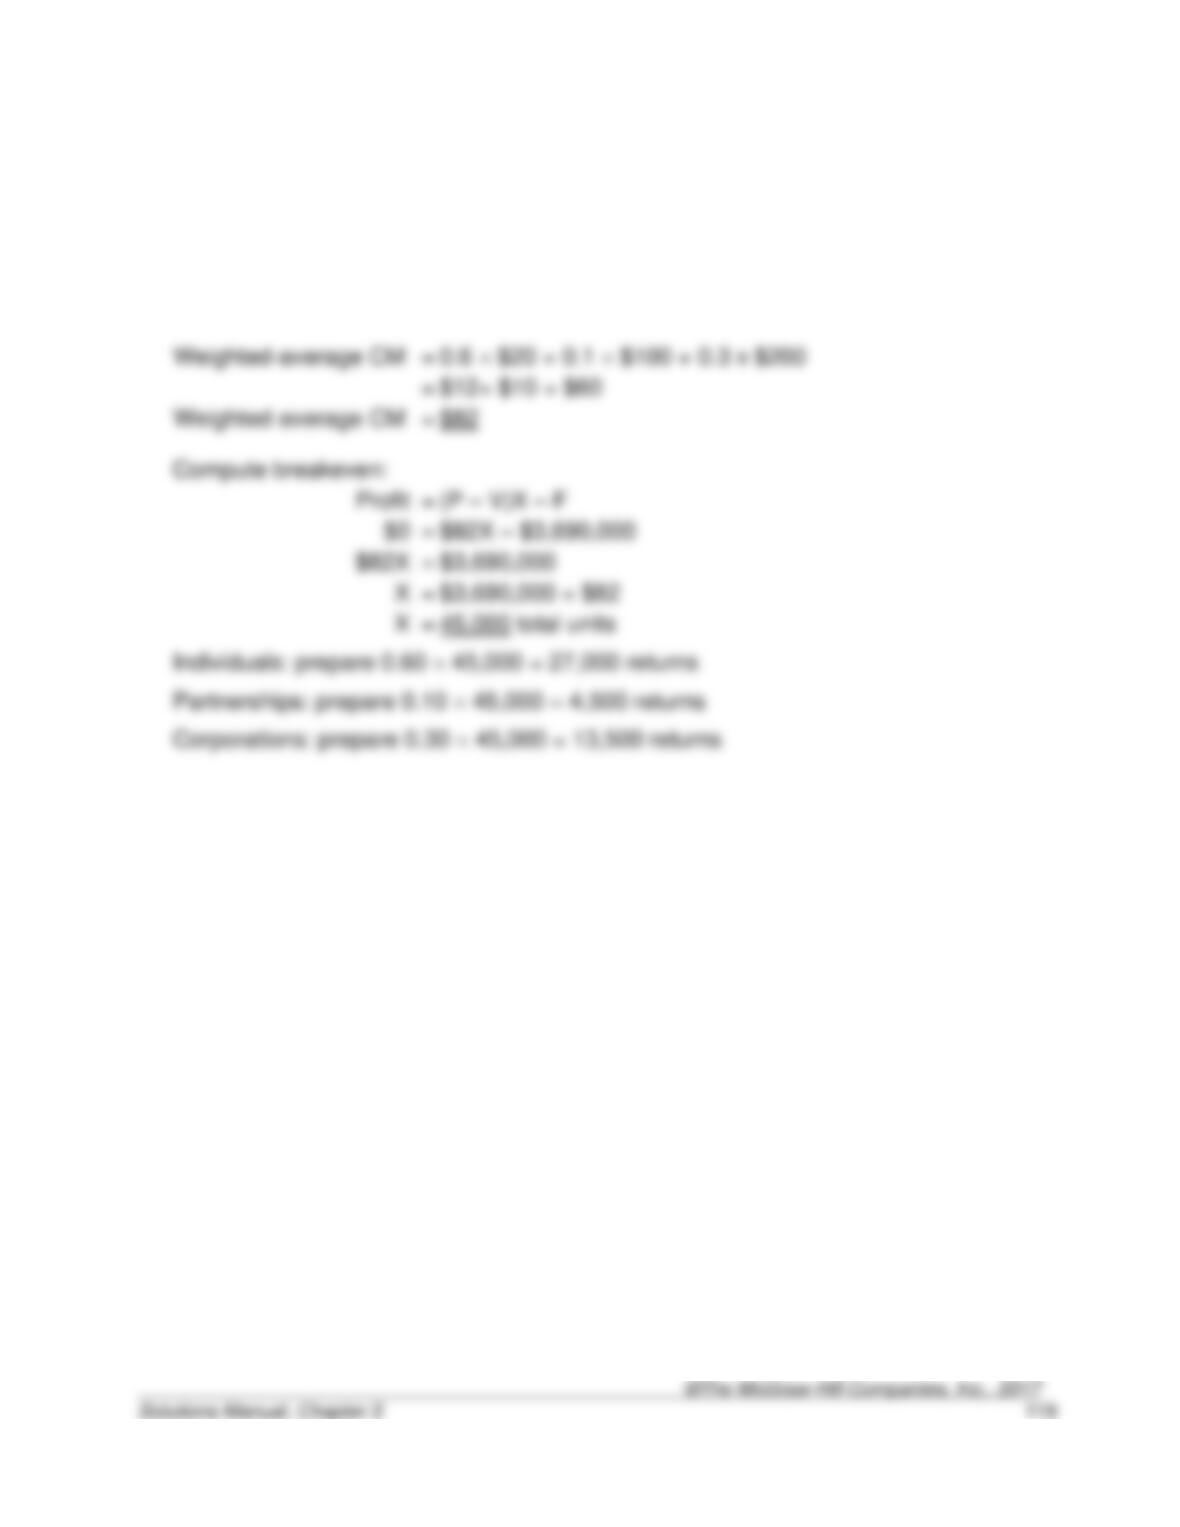
Weighted-average CM
=
0.6 $20 + 0.1 $100 + 0.3 x $200
=
$12+ $10 + $60
=
(P – V)X – F
=
=
$3,690,000
=
$3,690,000 ÷ $82
=
45,000 total units
3-59. (20 min.) Extensions of CVP Analysis—Multiple Products: Minot Furniture.
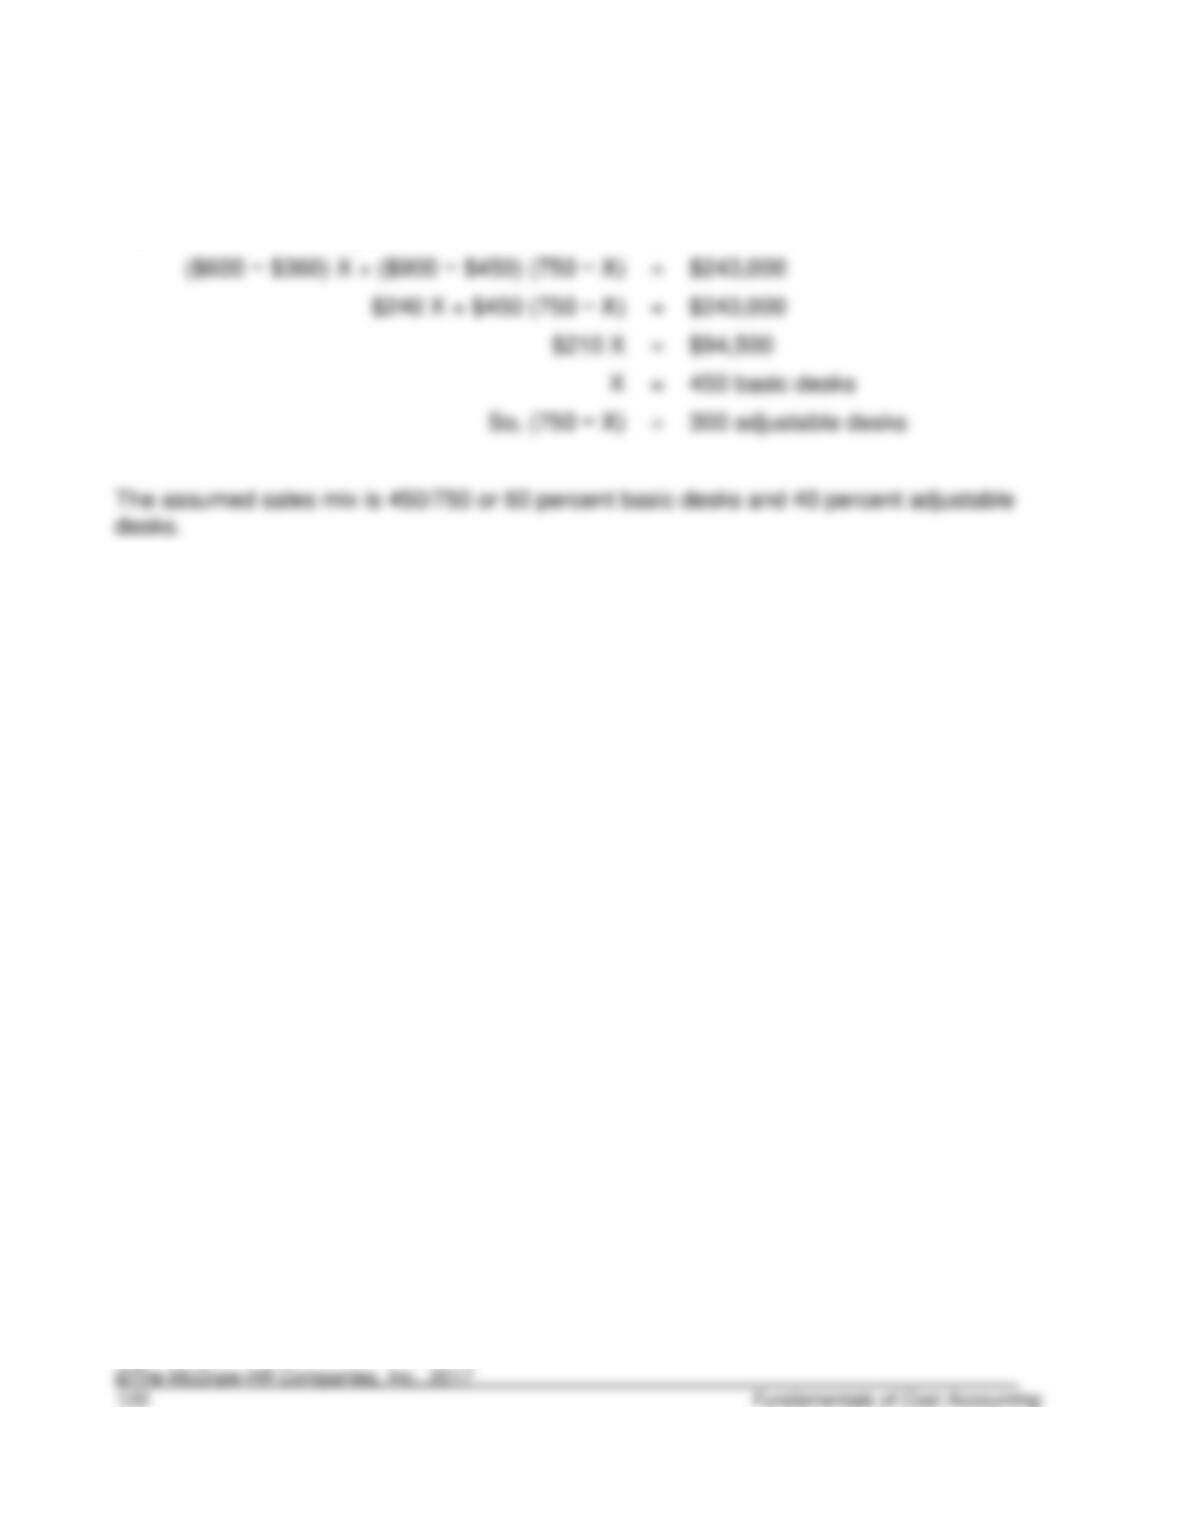
At the break-even point of 750 total units, the total contribution margin will equal the fixed
costs. Let X = the number of basic desks sold at the break-even point. Then (750 − X) will
equal the number of adjustable desks sold at the break-even point. Therefore,
3-60. (30 min.) Extensions of the CVP Basic Model—Multiple Products and Taxes:
Ocean King Products.
a. Compute weighted-average contribution margins for each product.
Weights
Selling
Price per
case
Variable
Cost per
Case
Contribution
Margin per
Case
Variety 1
.40
$ 3
$ 2
$1
Variety 2
.35
5
3
2
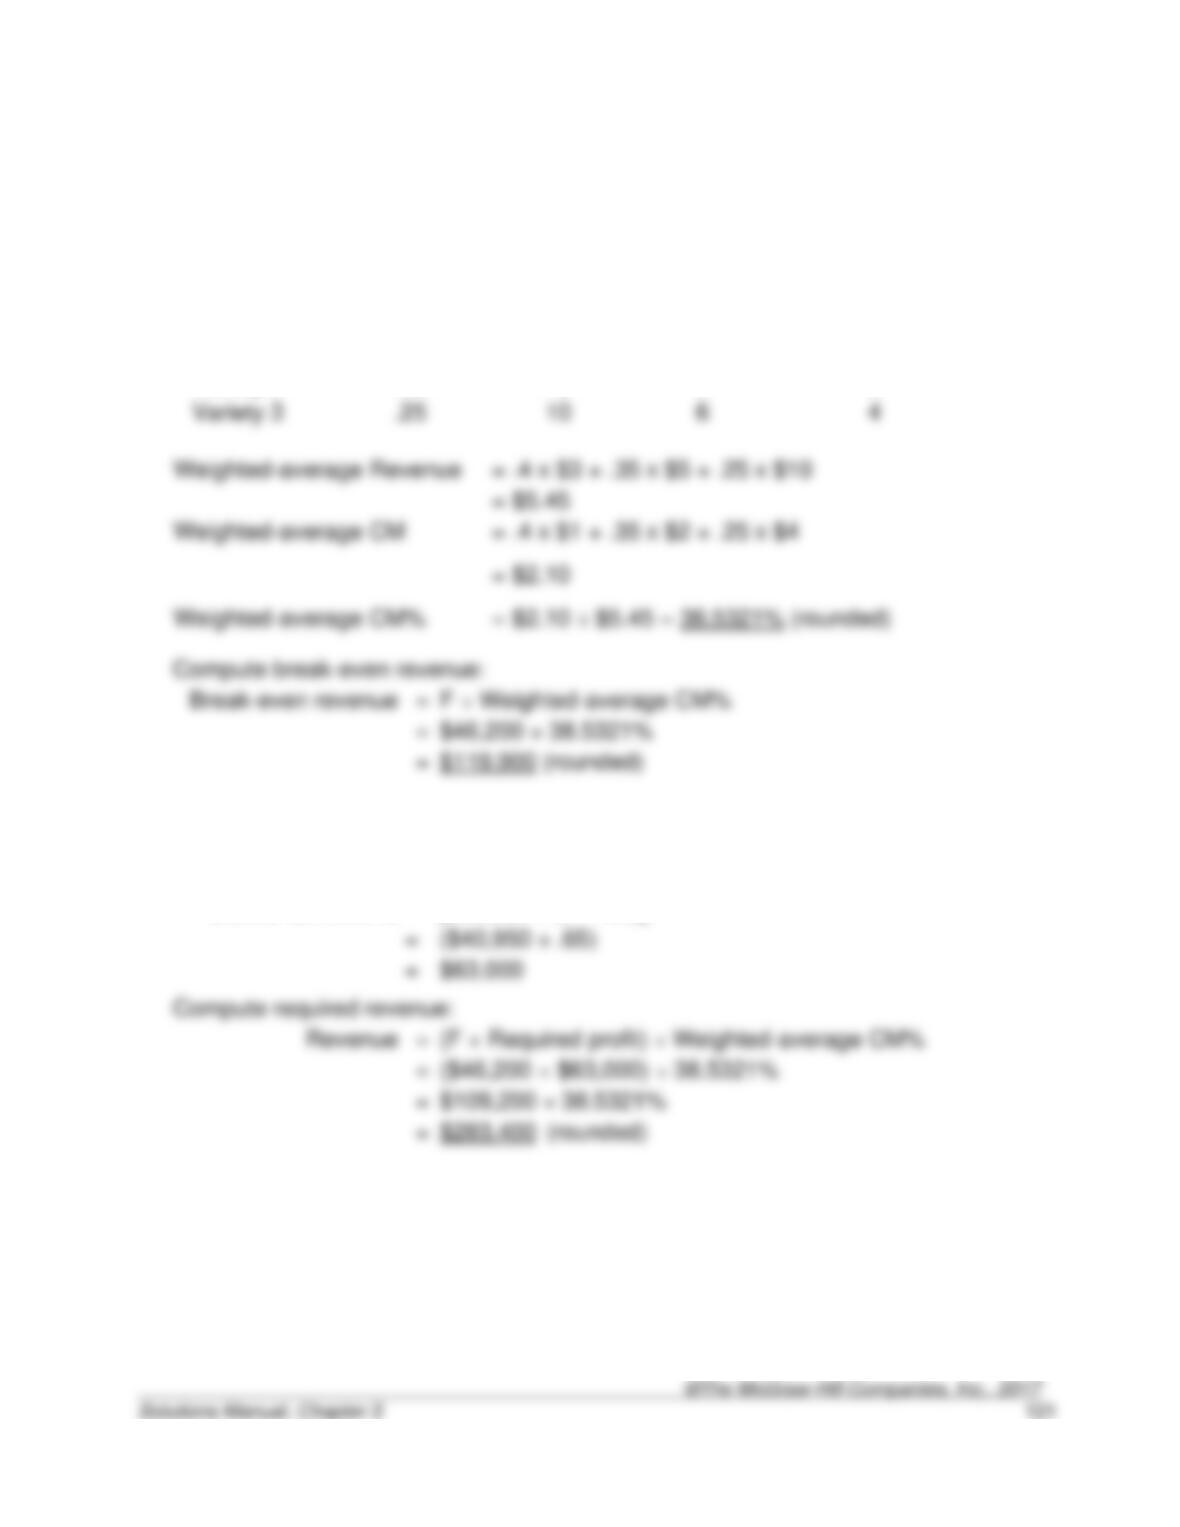
Variety 3
Weighted-average Revenue
.4 x $3 + .35 x $5 + .25 x $10
$5.45
=
F ÷ Weighted-average CM%
=
$46,200 ÷ 38.5321%
b.
After-tax income:
=
$40,950
Before-tax income
=
[$40,950 ÷ (1 – .35)]
=
($40,950 ÷ .65)
=
$63,000
=
(F + Required profit) ÷ Weighted-average CM%
=
($46,200 + $63,000) ÷ 38.5321%
=
$109,200 ÷ 38.5321%
3-61. (30 min.) Extensions of the CVP Model—Multiple Products and Taxes:
Limitless Labs, Inc.
a.
Basic
+
Retest
+
Vital
Total
Revenue
850 $500
+
100 $800
+
50 $4,000
=
$705,000
+
+
Fixed cost
b. Compute weighted-average contribution margin percentages for each product.
Weights
Selling Price
per Test
Variable Cost
per Test
Contribution
Margin per Test
Basic
.85
$ 500
$ 120
$380
Retest
.10
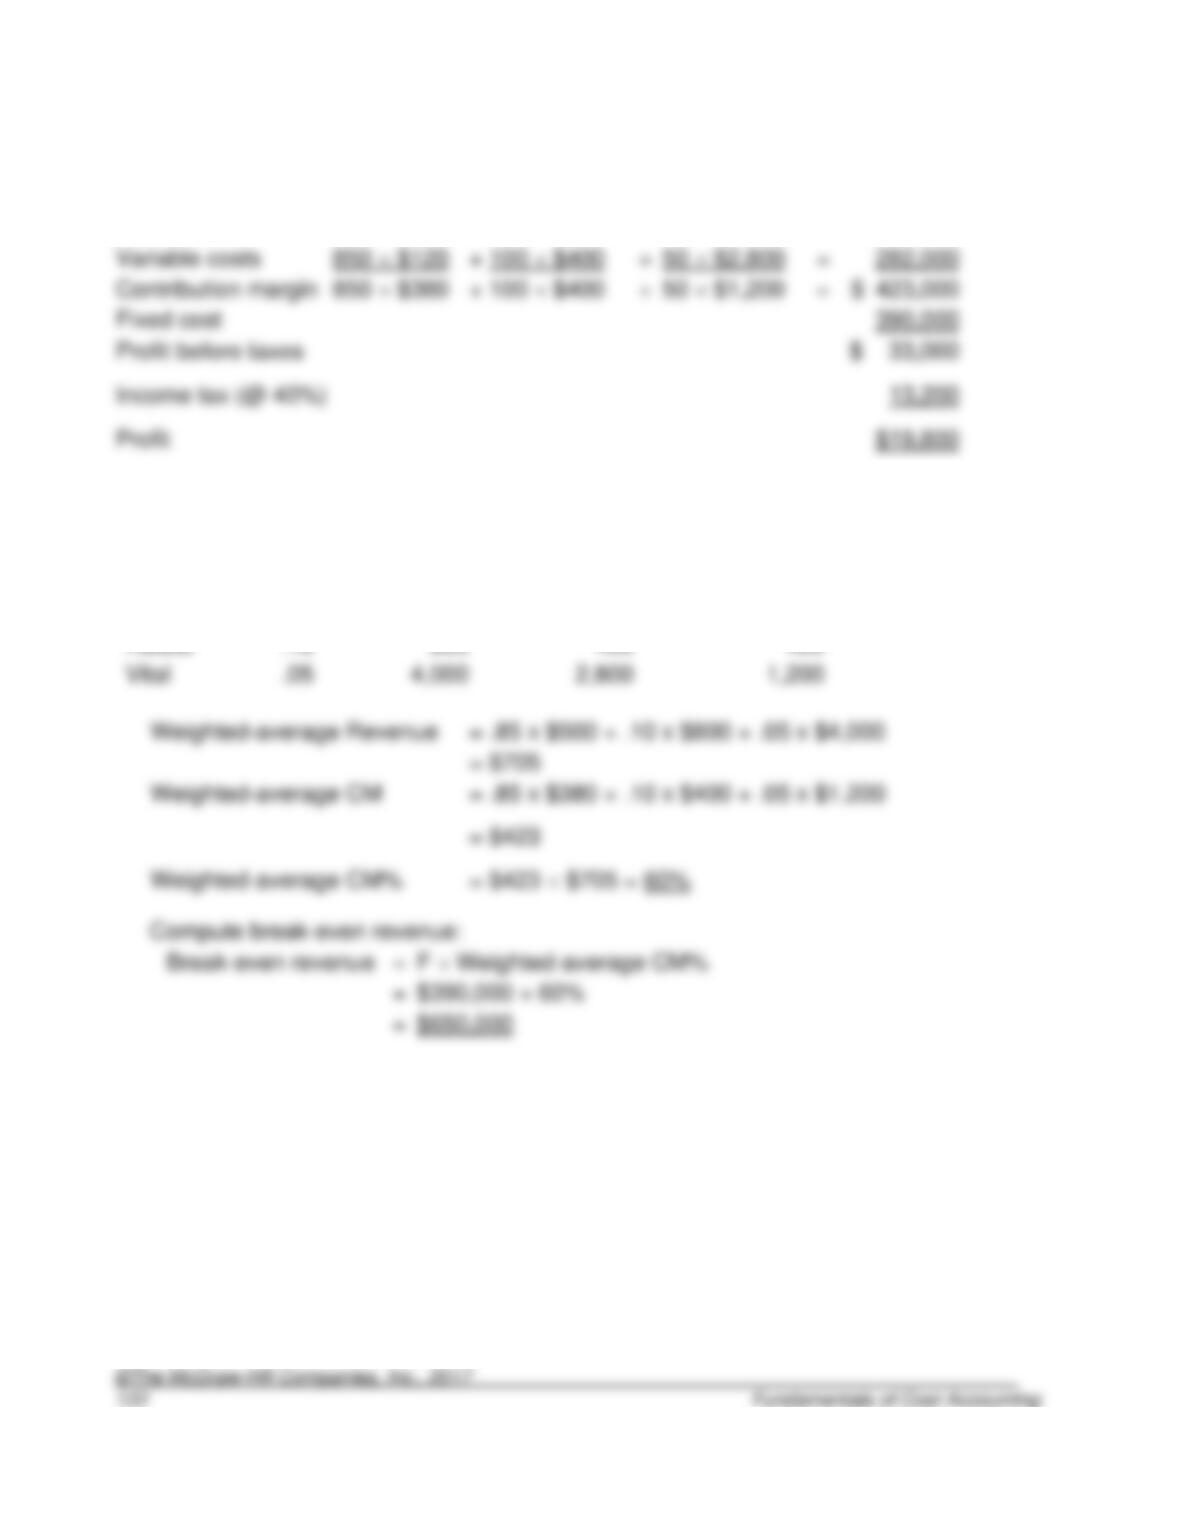
Vital
=
$705
=
=
$390,000 ÷ 60%
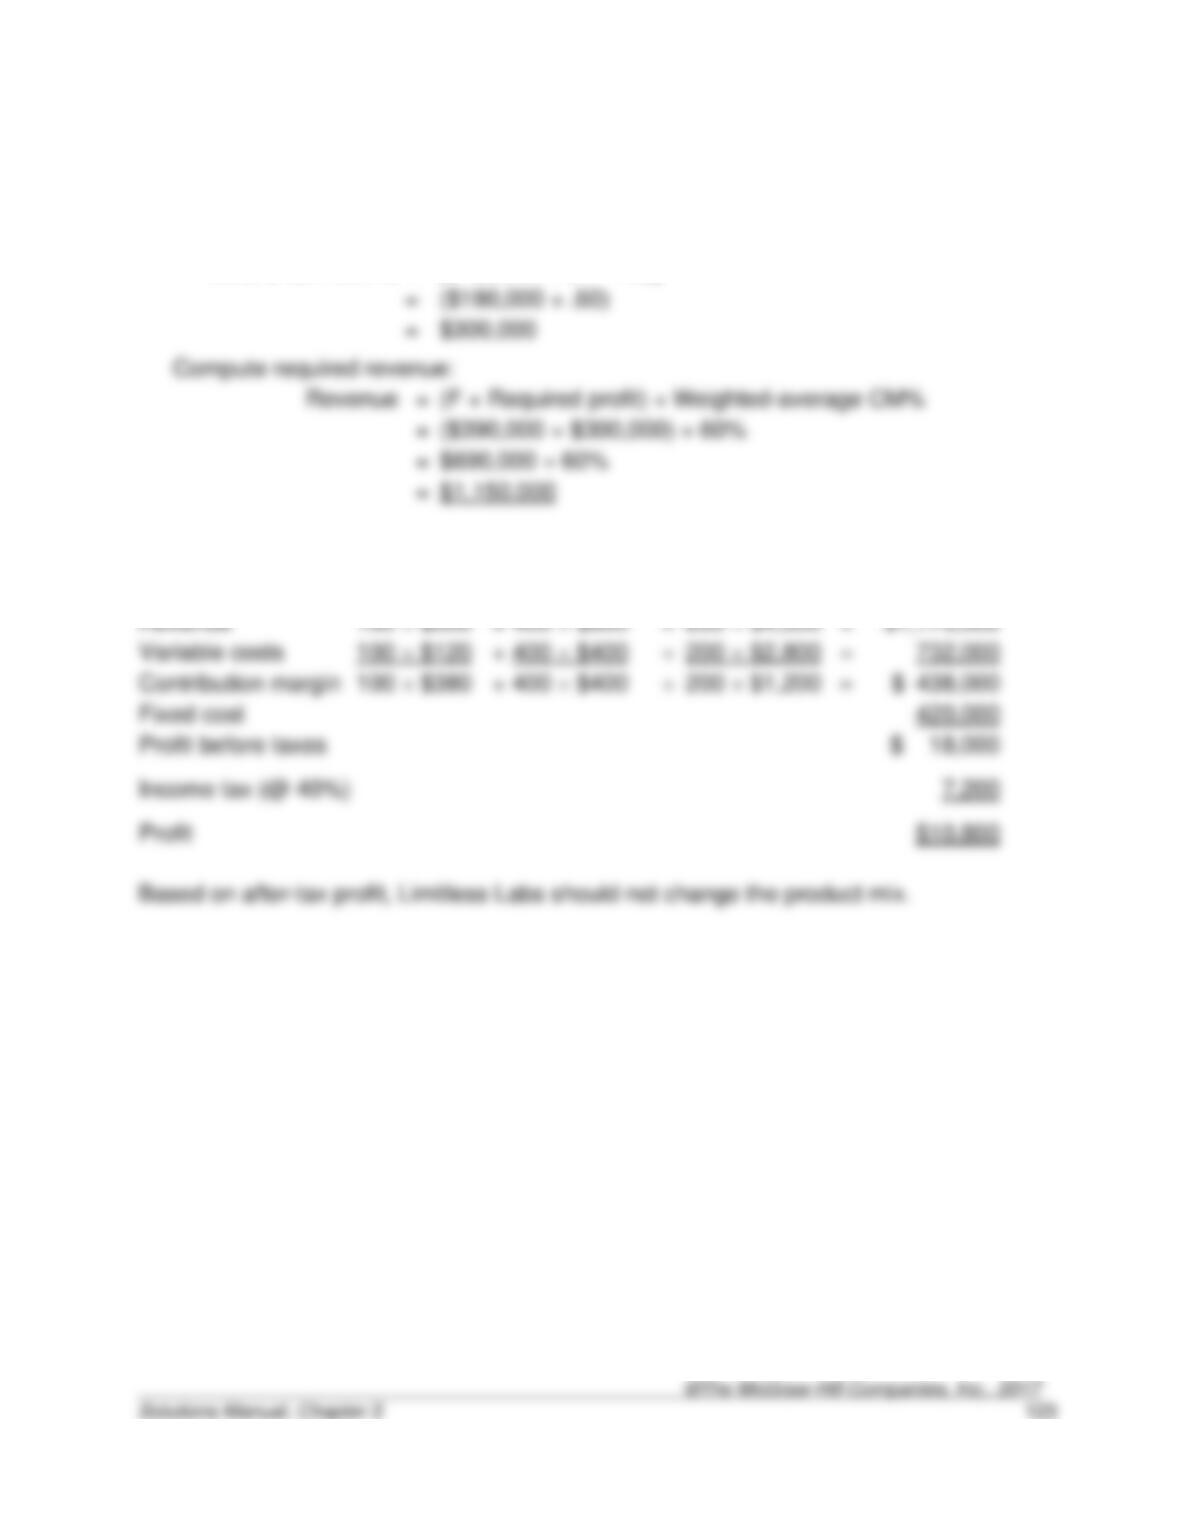
3-61. (continued).
c.
After-tax income:
=
$180,000
Before-tax income
=
[$180,000 ÷ (1 – .40)]
=
($180,000 ÷ .60)
=
$300,000
(F + Required profit) ÷ Weighted-average CM%
($390,000 + $300,000) ÷ 60%
$690,000 ÷ 60%
d.
Basic
+
Retests
+
Vital
Total
Revenue
Variable costs
Contribution margin
Fixed cost
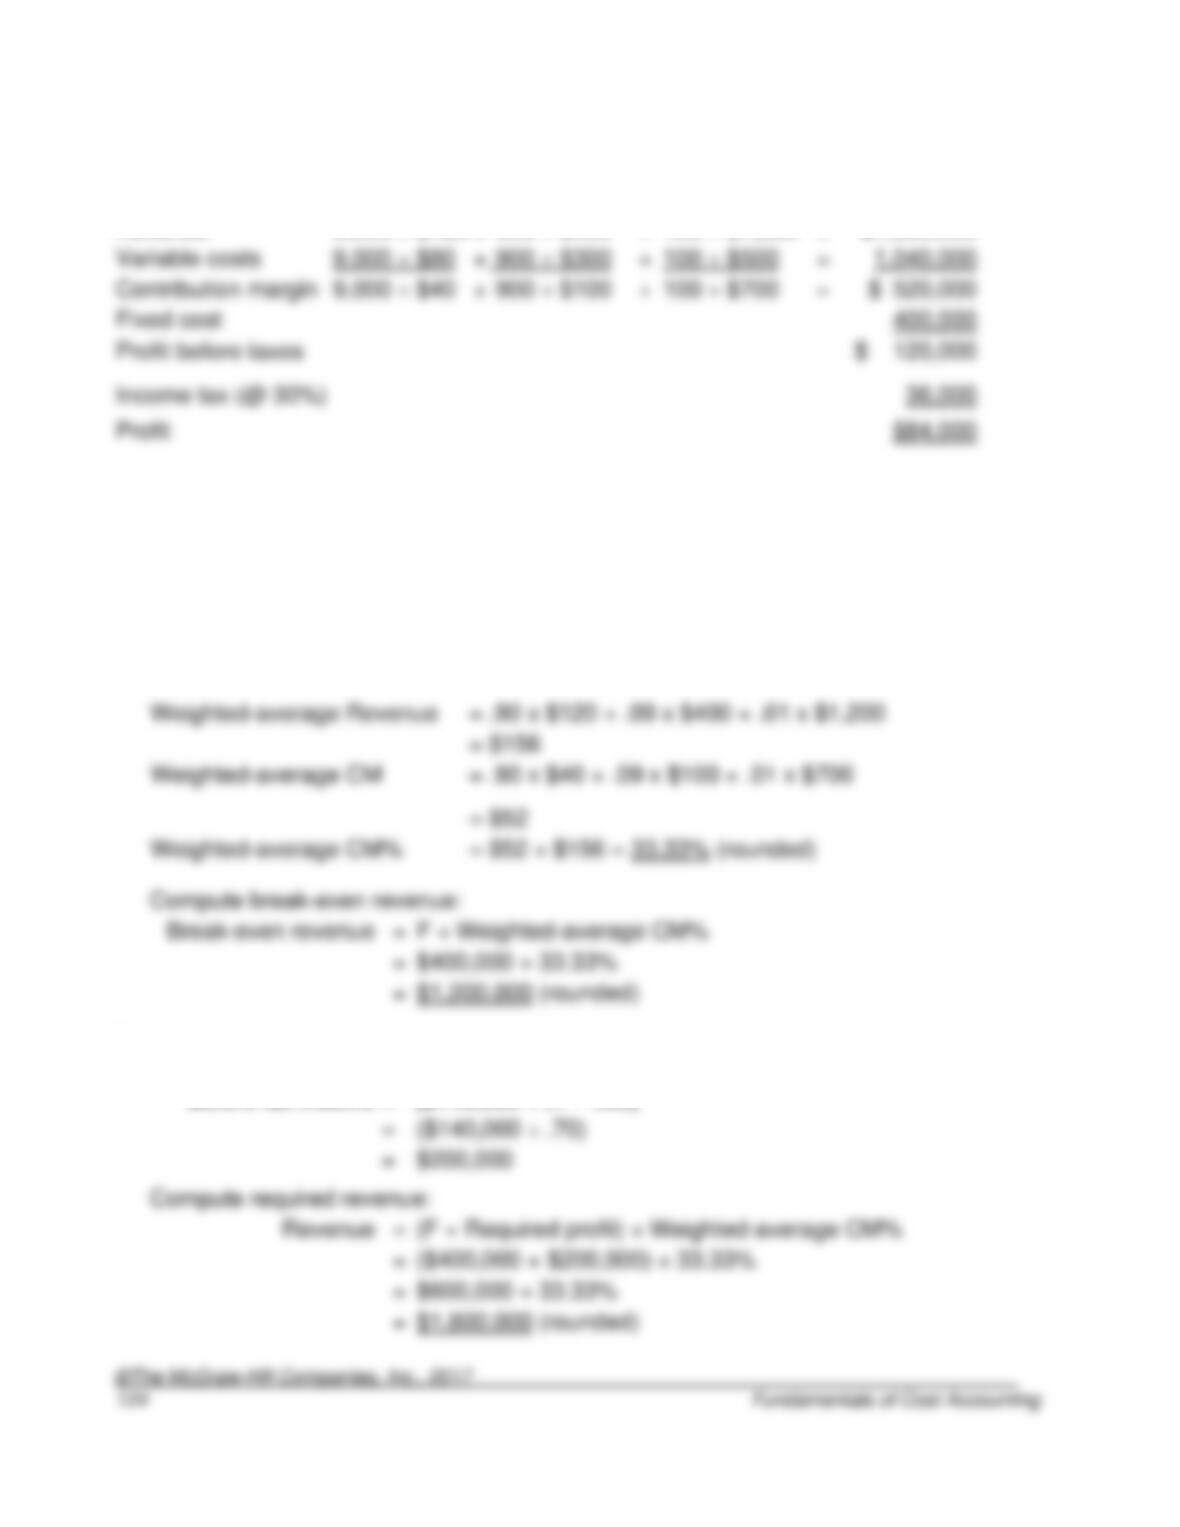
3-62. (30 min.) Extensions of the CVP Model—Multiple Products and Taxes:
Painless Dental Clinics, Inc.
a.
Cleaning
+
Filling
+
Capping
Total
Revenue
9,000 $120
+
900 $400
+
100 $1,200
=
$1,560,000
Variable costs
9,000 $80
900 $300
+
Contribution margin
9,000 $40
900 $100
+
Fixed cost
b. Compute weighted-average contribution margin percentages for each product.
Weights
Selling Price
per Service
Variable Cost
per Service
Contribution Margin
per Service
Cleaning
.90
$ 120
$ 80
$ 40
Filling
.09
400
300
100
Capping
.01
1,200
500
700
Weighted-average Revenue
.90 x $120 + .09 x $400 + .01 x $1,200
$156
=
F ÷ Weighted-average CM%
=
$400,000 ÷ 33.33%
c.
After tax income:
=
$140,000
Before tax income
=
[$140,000 ÷ (1 – .30)]
=
($140,000 ÷ .70)
=
$200,000
=
(F + Required profit) ÷ Weighted-average CM%
=
($400,000 + $200,000) ÷ 33.33%
=
$600,000 ÷ 33.33%
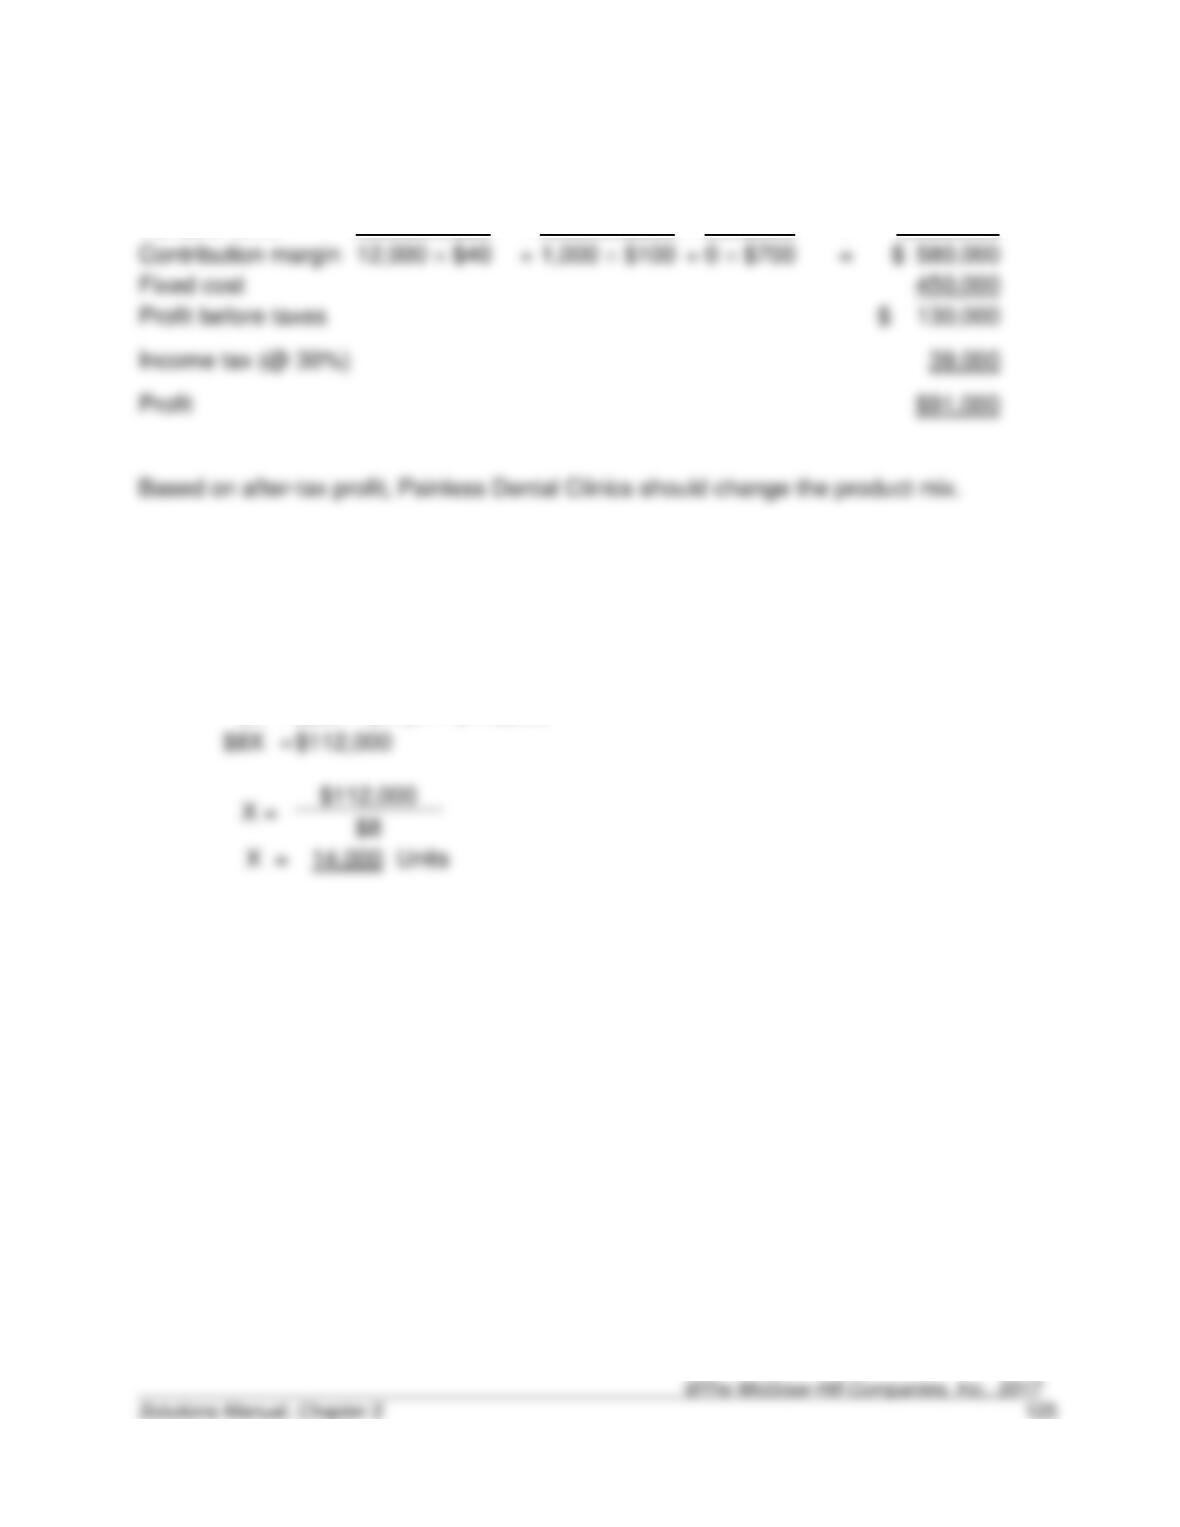
3-62. (continued).
d.
Cleaning
+
Filling
+
Capping
Total
Revenue
12,000 $120
+
1,000 $400
+
0 $1,200
=
$1,840,000
Variable costs
12,000 $80
+
1,000 $300
+
0 $500
=
1,260,000
Contribution margin
12,000 $40
+
1,000 $100
+
0 $700
Fixed cost
3-63. (20 min.) Extensions of the CVP Model—Taxes With Graduated Rates:
Hastings & Daughters.
a.
Profit
=
(P – V)X – F
$0
=
($25 – $17)X – $112,000
=
$112,000
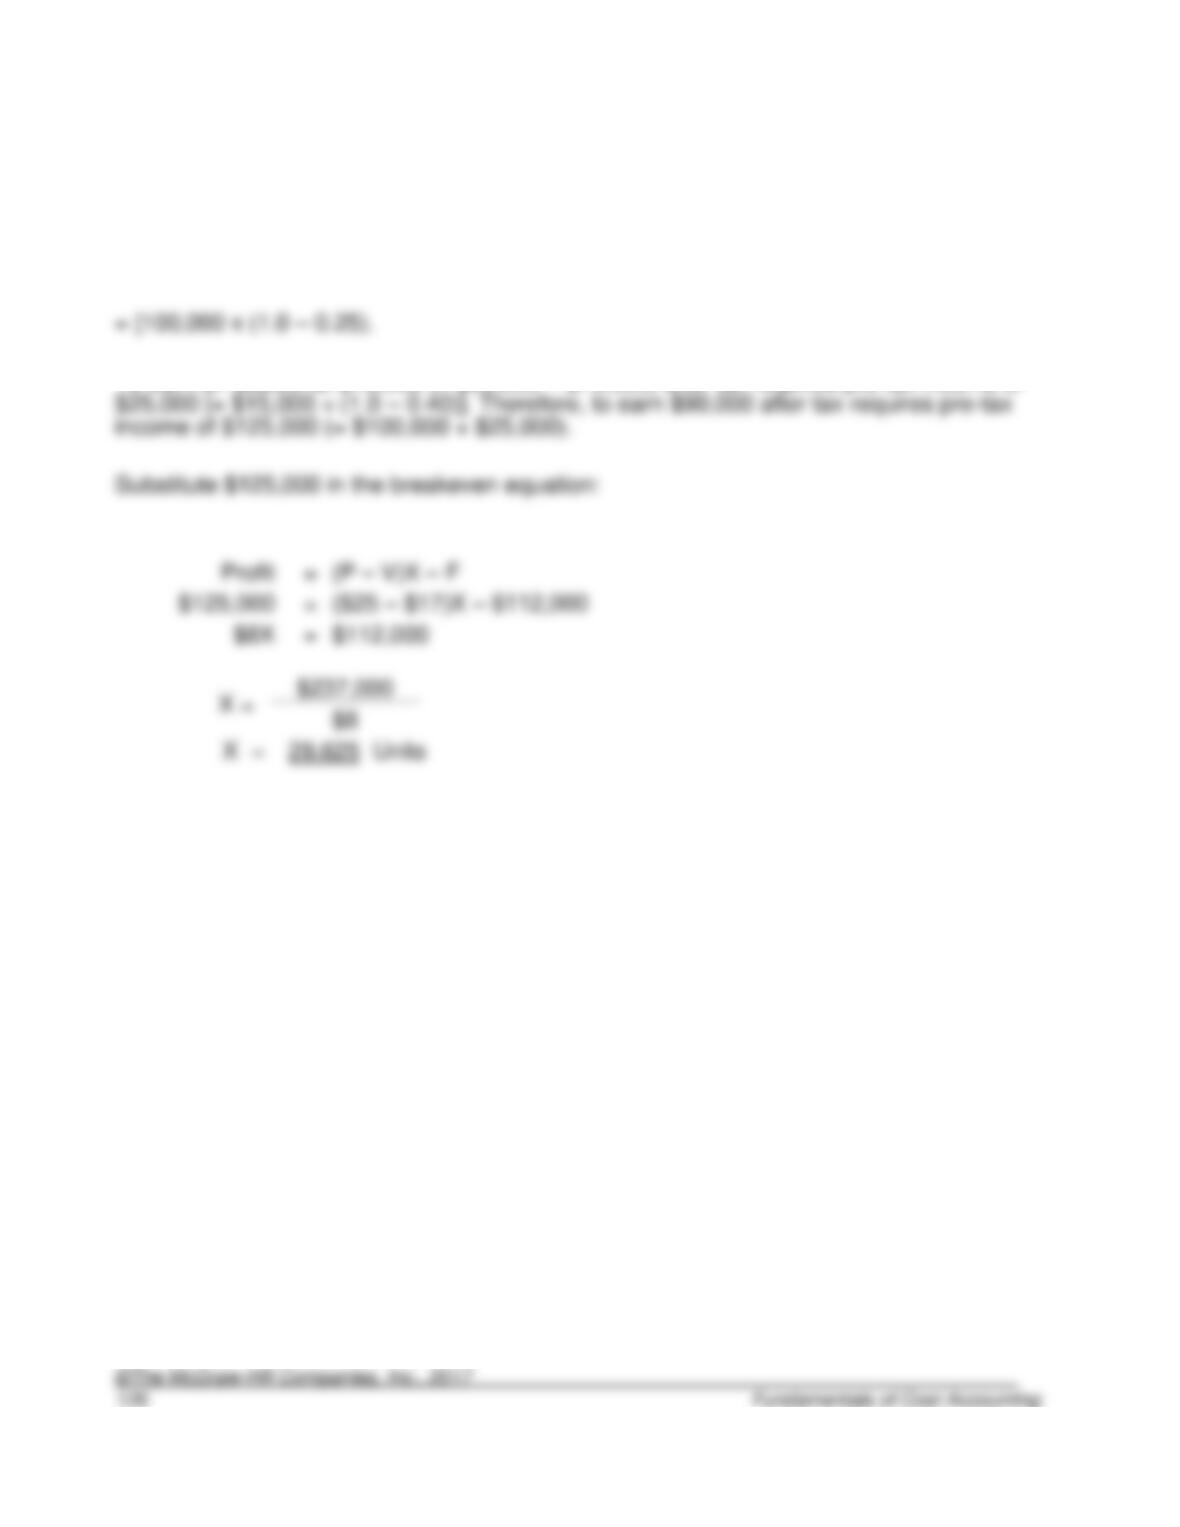
3-63. (continued).
b.
First, determine the pre-tax income necessary to earn $90,000 after-tax. The first
$100,000 of income is taxed at 25 percent, so the after-tax income is $75,000:
To earn an additional $15,000 (= $90,000 – $75,000) after tax requires pre-tax income of
Solutions to Integrative Case
3-64. (60 min.) Financial Modeling: Roseville Brewing Company.
a. Potential investors and bankers were concerned about the accuracy of the income
statement projections. They wanted to know what would happen if the projections
b. The first income statement was in the traditional format. In the traditional format, costs
c. The best way to quickly check for reasonableness is to compare the operating profit as
d. The cost of a pint of beer can range from $0.15 to $1.40 depending on what is included
in the cost. Should we include only the materials? Should we include direct labor?
Indirect labor? Manufacturing overhead? The point is to understand what is included
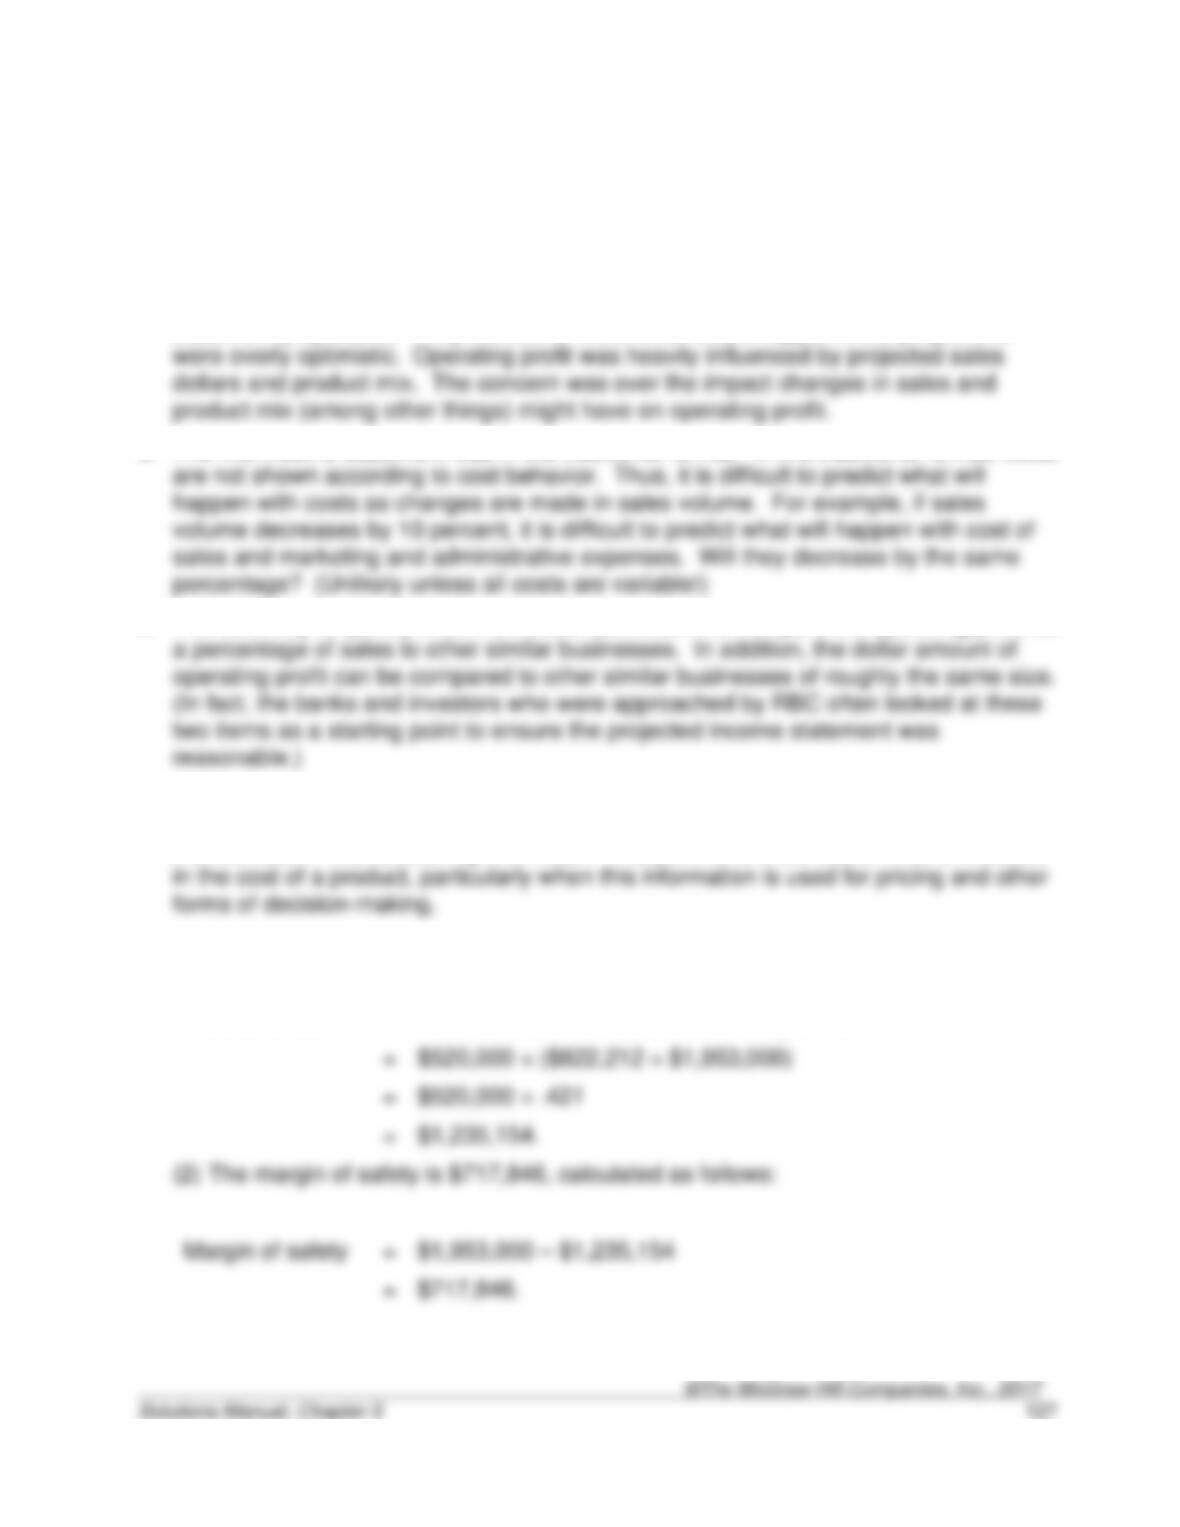
e. (1) The break-even point in sales dollars is $1,235,154, calculated as follows:
Breakeven point
=
Total fixed costs ÷ contribution margin ratio
=
$520,000 ÷ ($822,212 ÷ $1,953,000)
=
$520,000 ÷ .421
=
$1,235,154.
Margin of safety
=
=
$717,846.
3-64 (continued).
(3) RBC is selling many different products that change daily. It is difficult if not
impossible, to measure units of product for a brew pub. This same argument holds
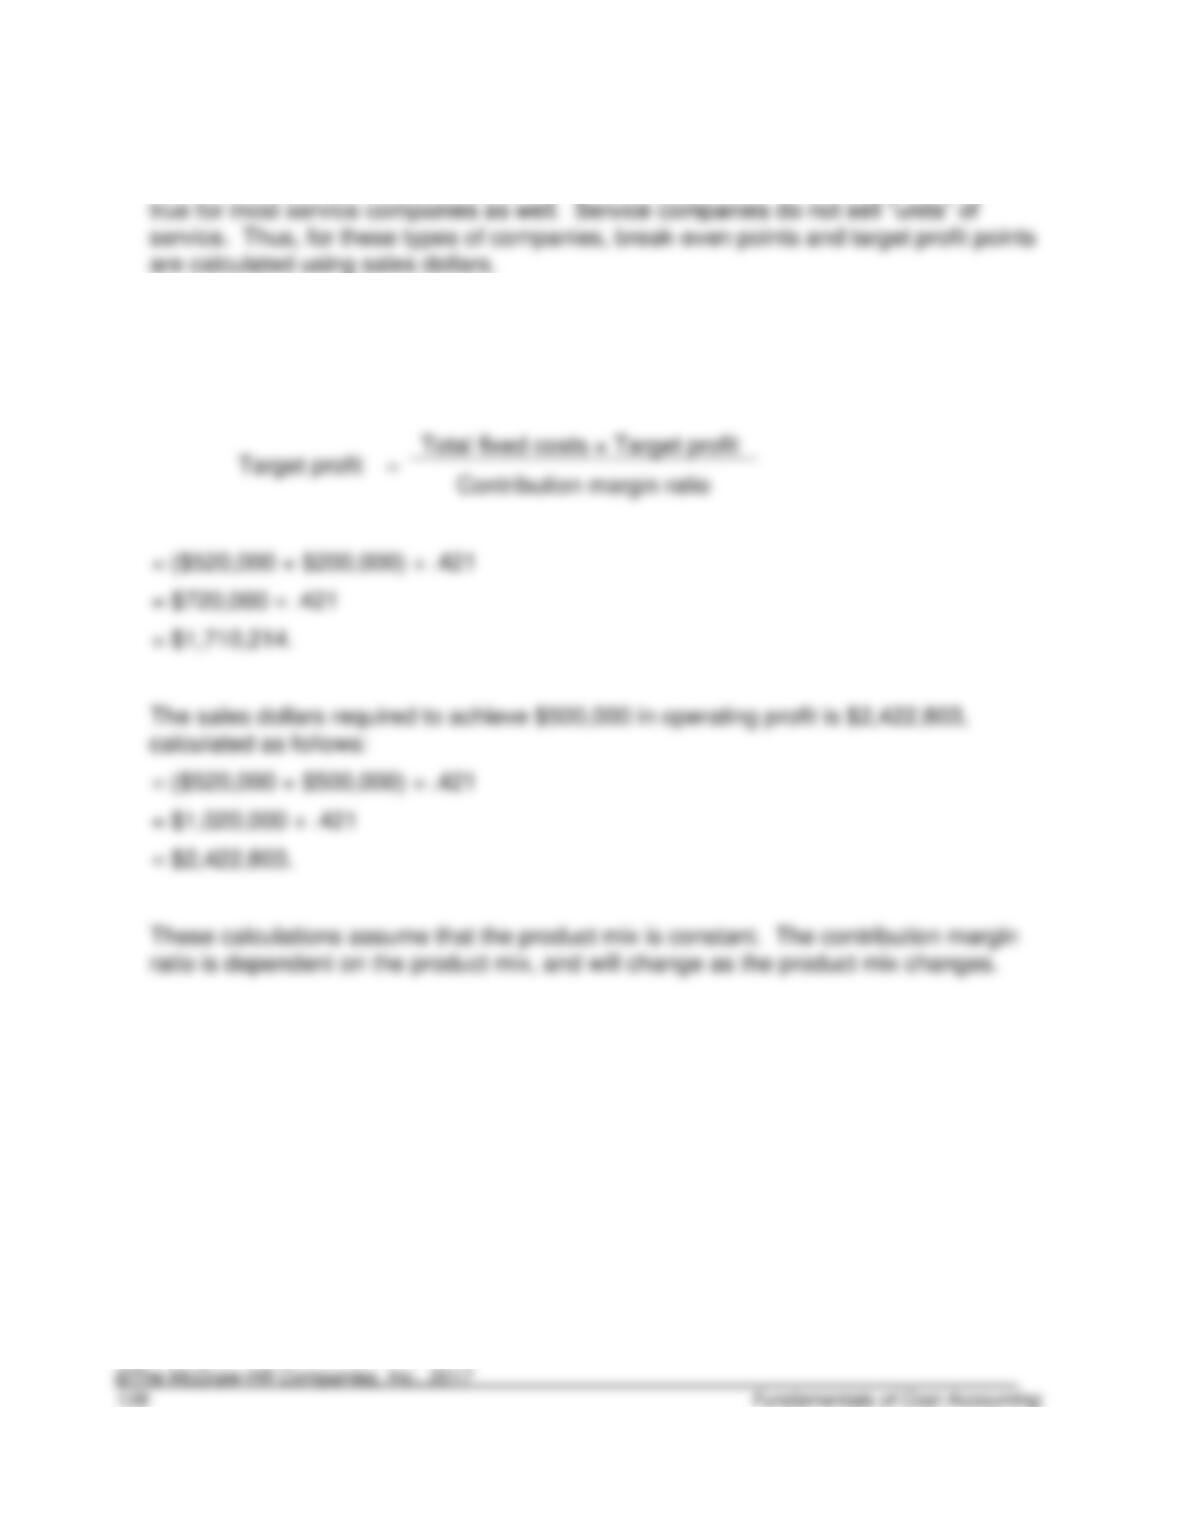
(4) The sales dollars required to achieve $200,000 in operating profit is $1,710,214,
calculated as follows: