Chapter 3
Fundamentals of Cost-Volume-Profit Analysis
Learning Objectives
1. Use cost-volume-profit (CVP) analysis to analyze decisions.
2. Understand the effect of cost structure on decisions.
4. Incorporate taxes, multiple products, and alternative cost structures into the CVP analysis.
Chapter Overview
I. COST-VOLUME-PROFIT ANALYSIS
• Profit Equation
• CVP Example
o Finding Break-Even and Target Volumes
▪ Break-Even Volume in Units
▪ Break-Even Volume in Sales Dollars
▪ Target Volume in Units
▪ Target Volume in Sales Dollars
II. CVP ANALYSIS WITH SPREADSHEETS
III. EXTENSIONS OF THE CVP MODEL
• Income Taxes
• Multiproduct CVP Analysis
o Fixed Product Mix
o Weighted-Average Contribution Margin
▪ Find Breakeven in Sales Dollars
Chapter Outline
LO 3-1 Use cost-volume-profit (CVP) analysis to analyze decisions.
COST-VOLUME-PROFIT ANALYSIS
• Cost-Volume-Profit (CVP) Analysis
o Cost-volume-profit (CVP) analysis is a study of the relations among revenues, costs, and
volume and their effect on profit.
o Managers make decisions on volume, pricing, or incurring a cost that will impact profit.
(See Business Application box “Cost-Volume-Profit Analysis and On-Demand Services.”)
• Profit equation
o Profit equation: operating profit equals total revenue less total costs.
o Contribution margin is the amount that units sold contribute toward (1) covering fixed
costs and (2) providing operating profits
▪ Unit contribution margin
• The difference between sales price and variable cost per unit
• Unit contribution margin = Price – Variable cost per unit = P – V
▪ Total contribution margin
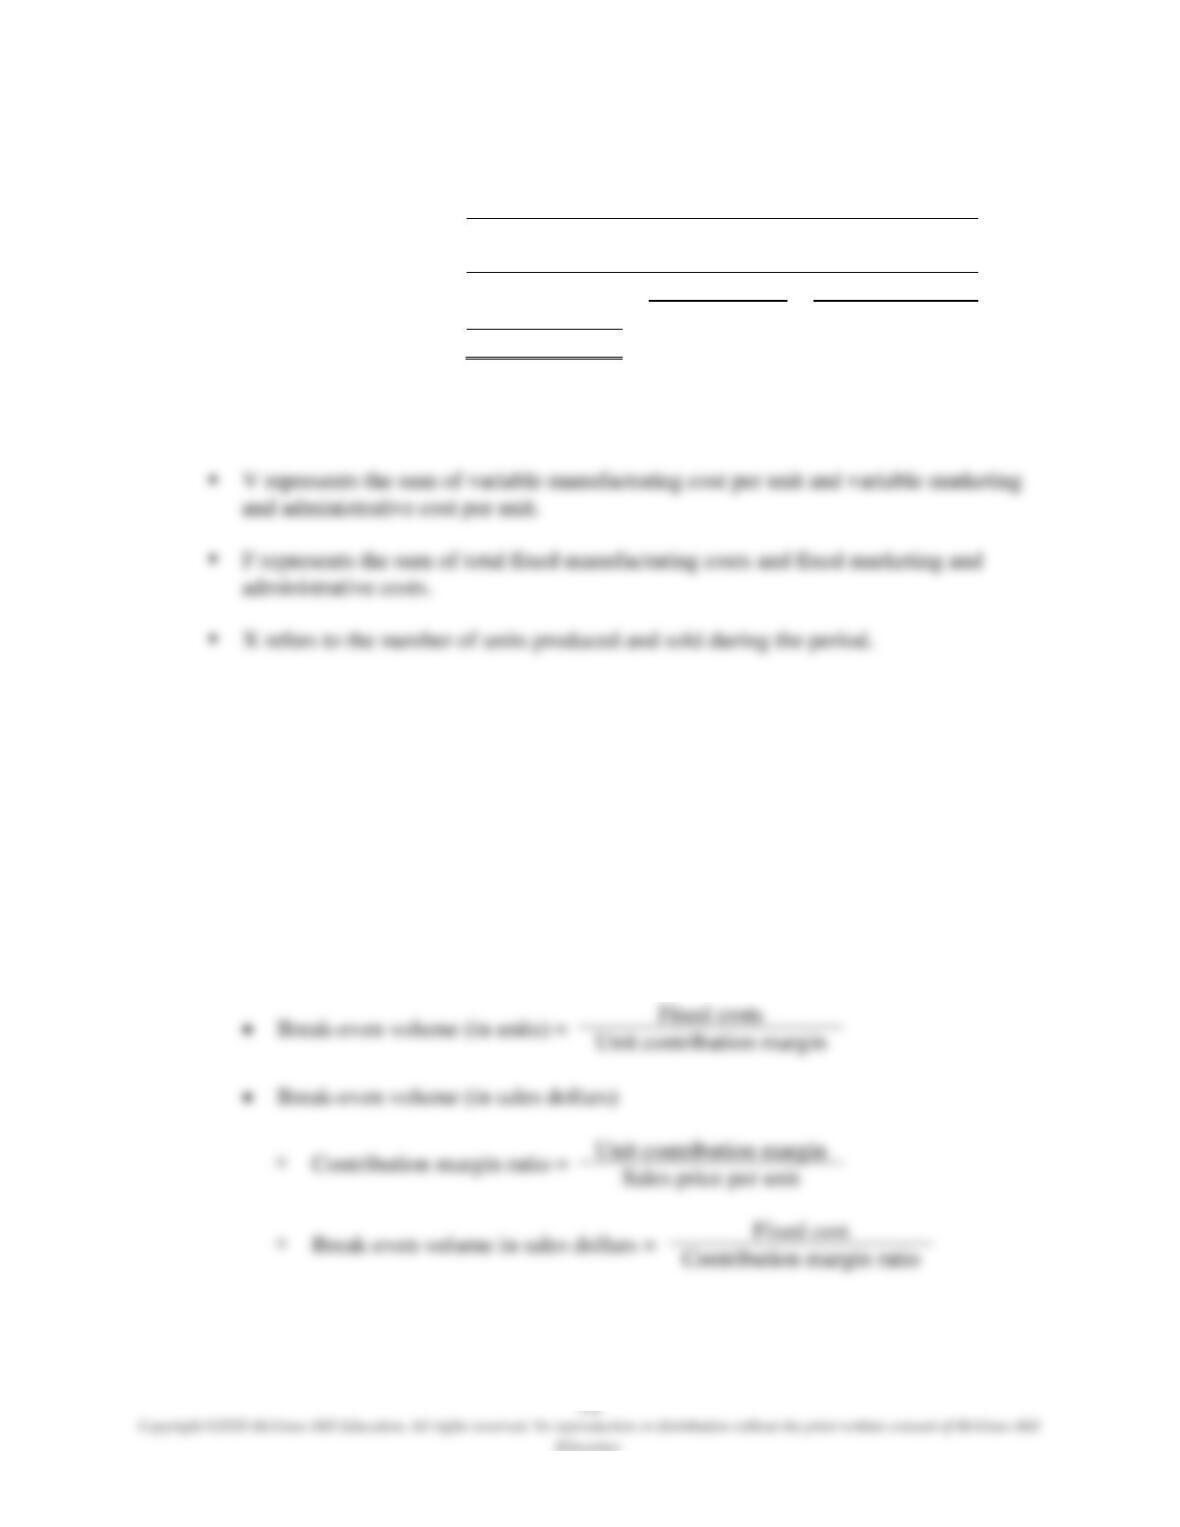
▪ Alternatively, in CVP income statement format,
Total
Unit
Percentage
Sales revenue
PX
P
100%
– Variable costs
VX
V
V ÷ P
= Contribution margin
(P – V)X
P – V
(P – V) ÷ P
– Fixed costs
F
= Profit
(P – V)X – F
o Financial accounting classifies costs as either manufacturing or administrative; for
decision making, costs are classified as fixed or variable.
• CVP Example
o Exhibit 3.1 illustrates a contribution margin income statement; profit equals contribution
less fixed costs.
o Finding Break-Even and Target Volumes
▪ Break-even point is the volume level at which profits equal zero If the company
makes many products, the volume is usually expressed in terms of sales dollars, and if
the company makes only one product, the volume is usually expressed in terms of
volume.
Contribution margin ratio
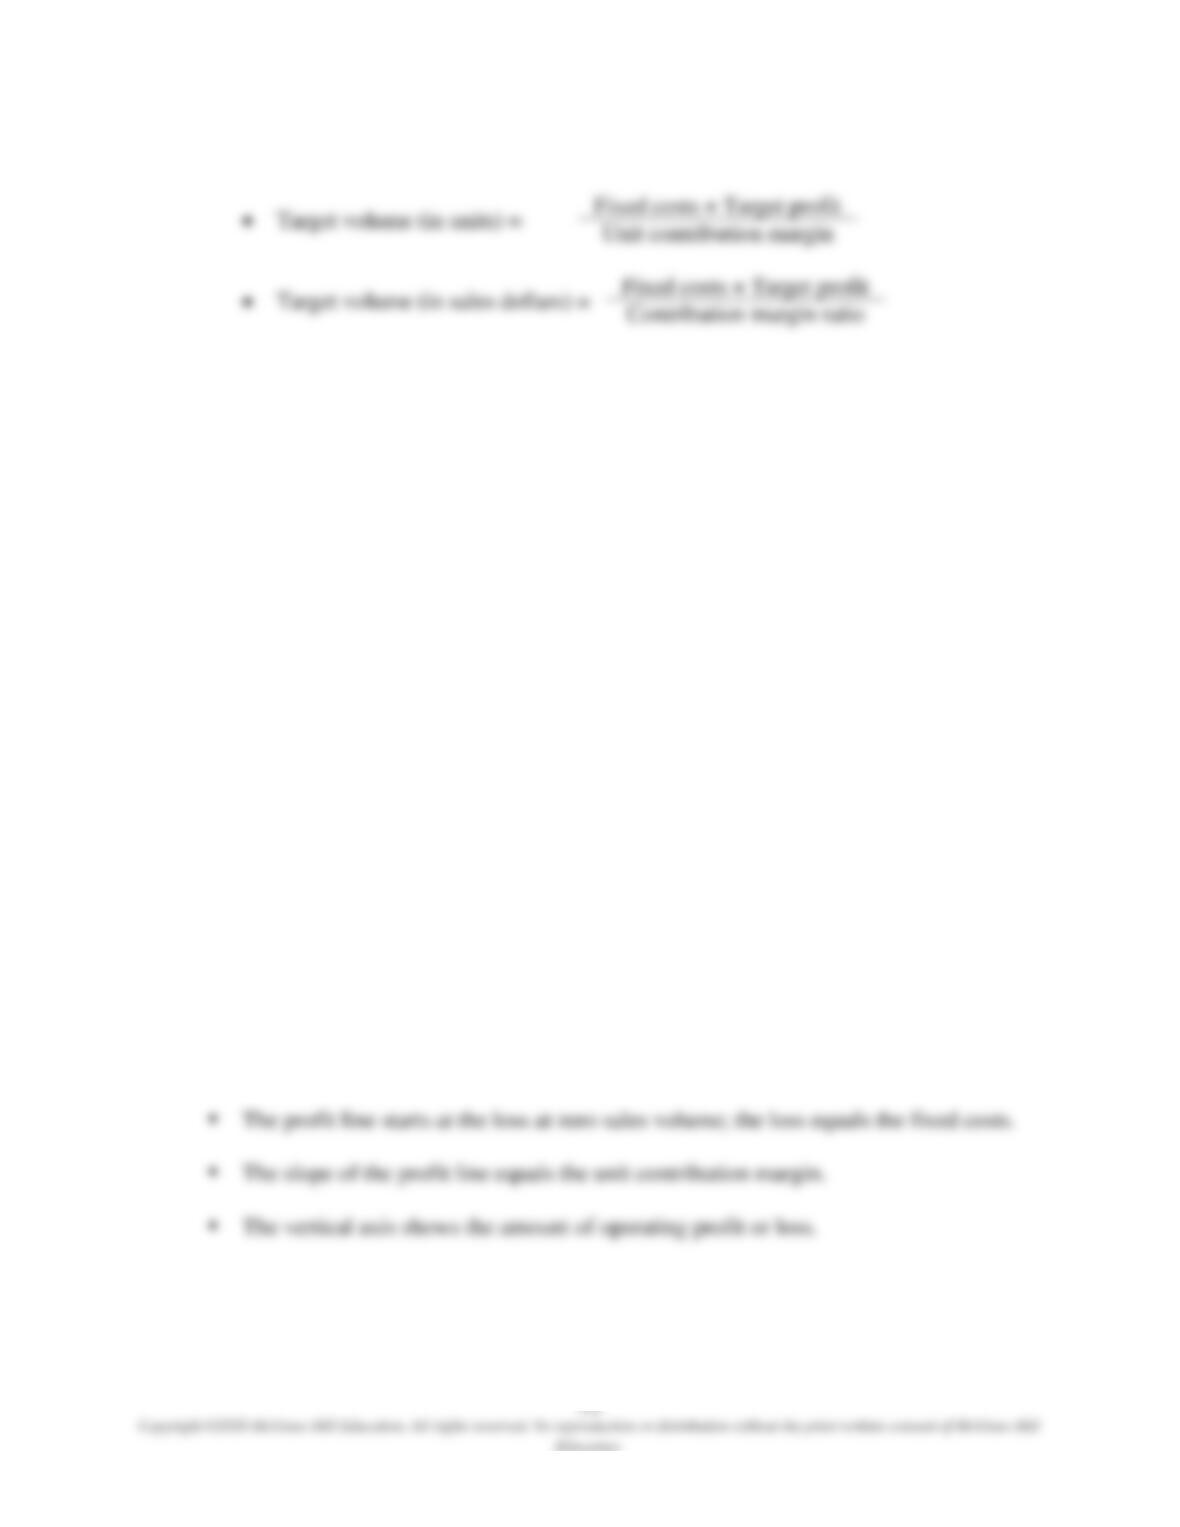
▪ Target volume is the level at which profits equal a target profit.
▪ Exhibit 3.2 summarizes the break-even and target volume formulas.
See Demonstration Problem 1
• Graphic Presentation
o Exhibit 3.3 plots total revenues against total costs at various activity levels (volumes).
▪ The total revenue line (TR) starts at the origin (0, 0) with slope P, the price per unit.
▪ The total cost line (TC) starts at intercept F with slope V, the variable cost per unit.
▪ The two lines intersect at the break-even volume where TR = TC.
o Volumes lower than breakeven result in an operating loss (TR < TC); volumes higher
than breakeven result in an operating profit (TR > TC).
o The vertical distance between TR and TC determines the amount of operating profit or
loss.
• Profit-Volume Model
o Profit-volume analysis is a version of cost-volume-profit analysis using a single profit
line.
o A Profit-Volume graph collapses the cost and revenue lines into a single profit line in the
profit-volume graph.
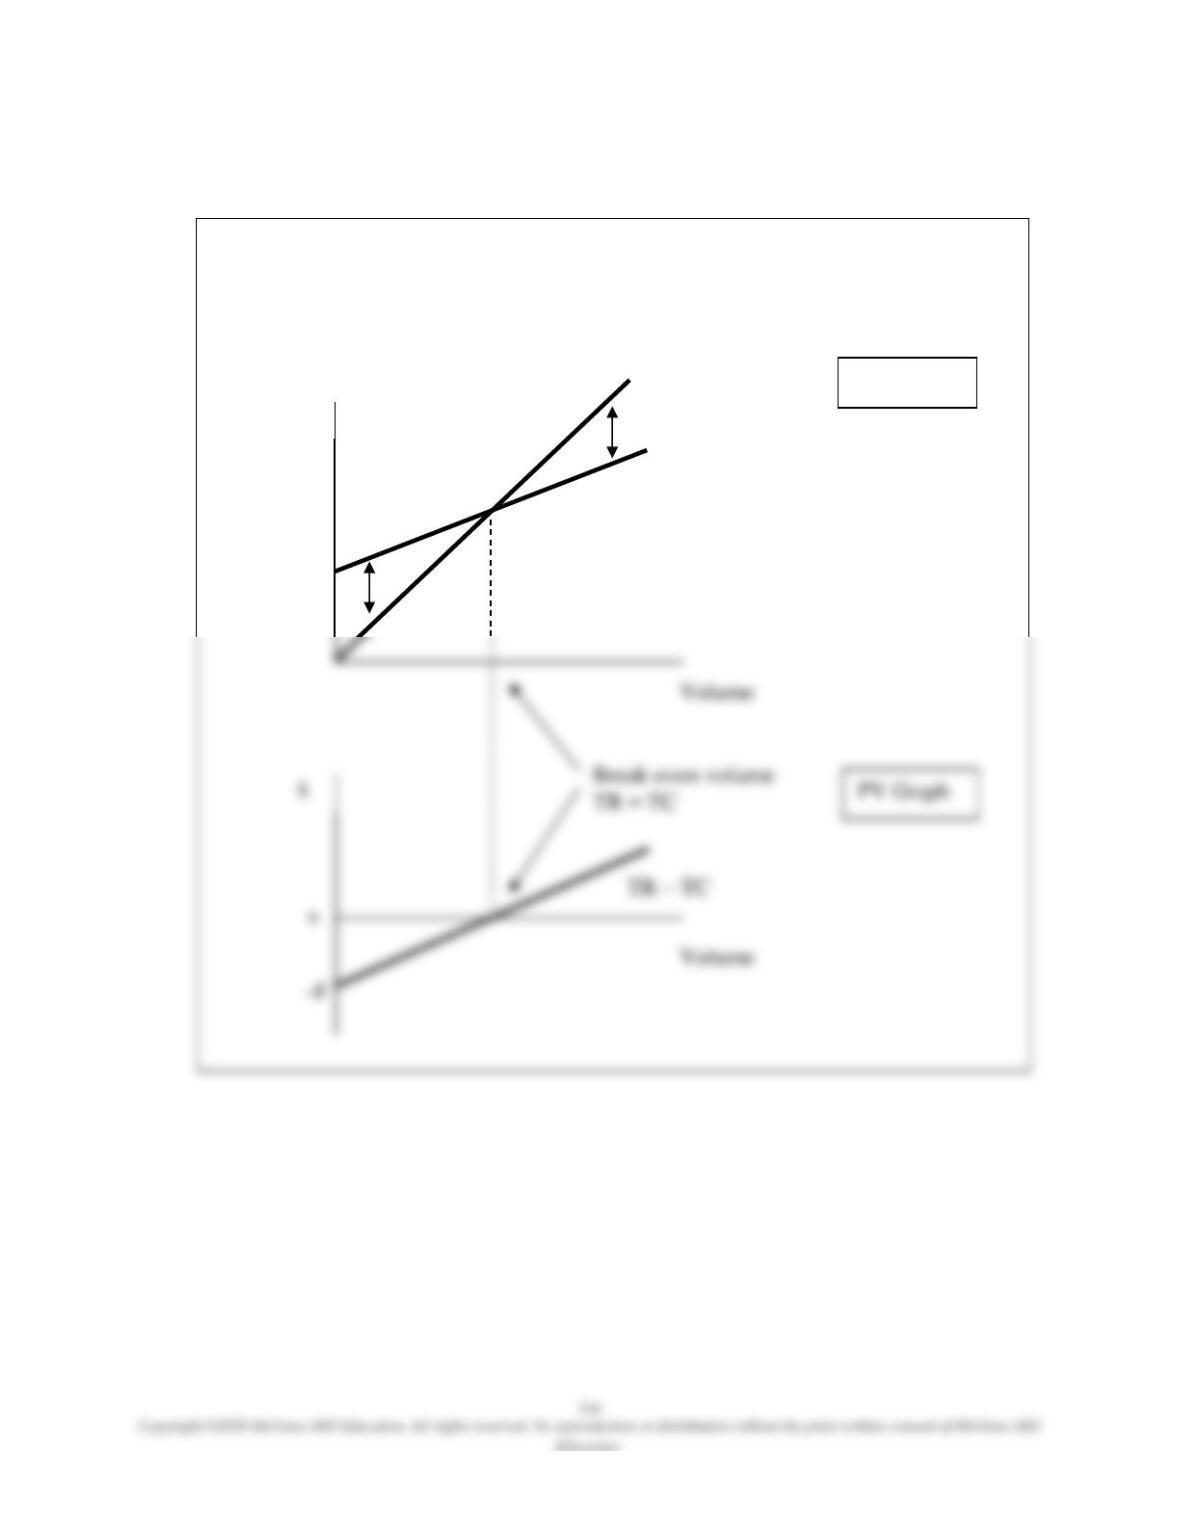
o Exhibit 3.4 (shown in a more generic form below) is a comparison of a CVP graph and a
Profit-Volume graph using the same background information.
Comparison of CVP Graph and PV Graph
$
F
TR = PX
TC = F + VX
Operating profit
Operating loss
CVP Graph
LO 3-2 Understand the effect of cost structure on decisions.
• Use of CVP to Analyze the Effect of Different Cost Structures
o An organization’s cost structure is the proportion of fixed and variable costs to total
costs; it has a significant effect on the sensitivity of its profits to changes in volume.
▪ A firm with a high proportion of fixed costs, such as electric utilities, is considered
capital intensive.
▪ A firm with a high proportion of variable costs, such as a grocery retailer, may be
considered labor intensive.
o Operating leverage describes the extent to which an organization’s cost structure is
made up of fixed costs.
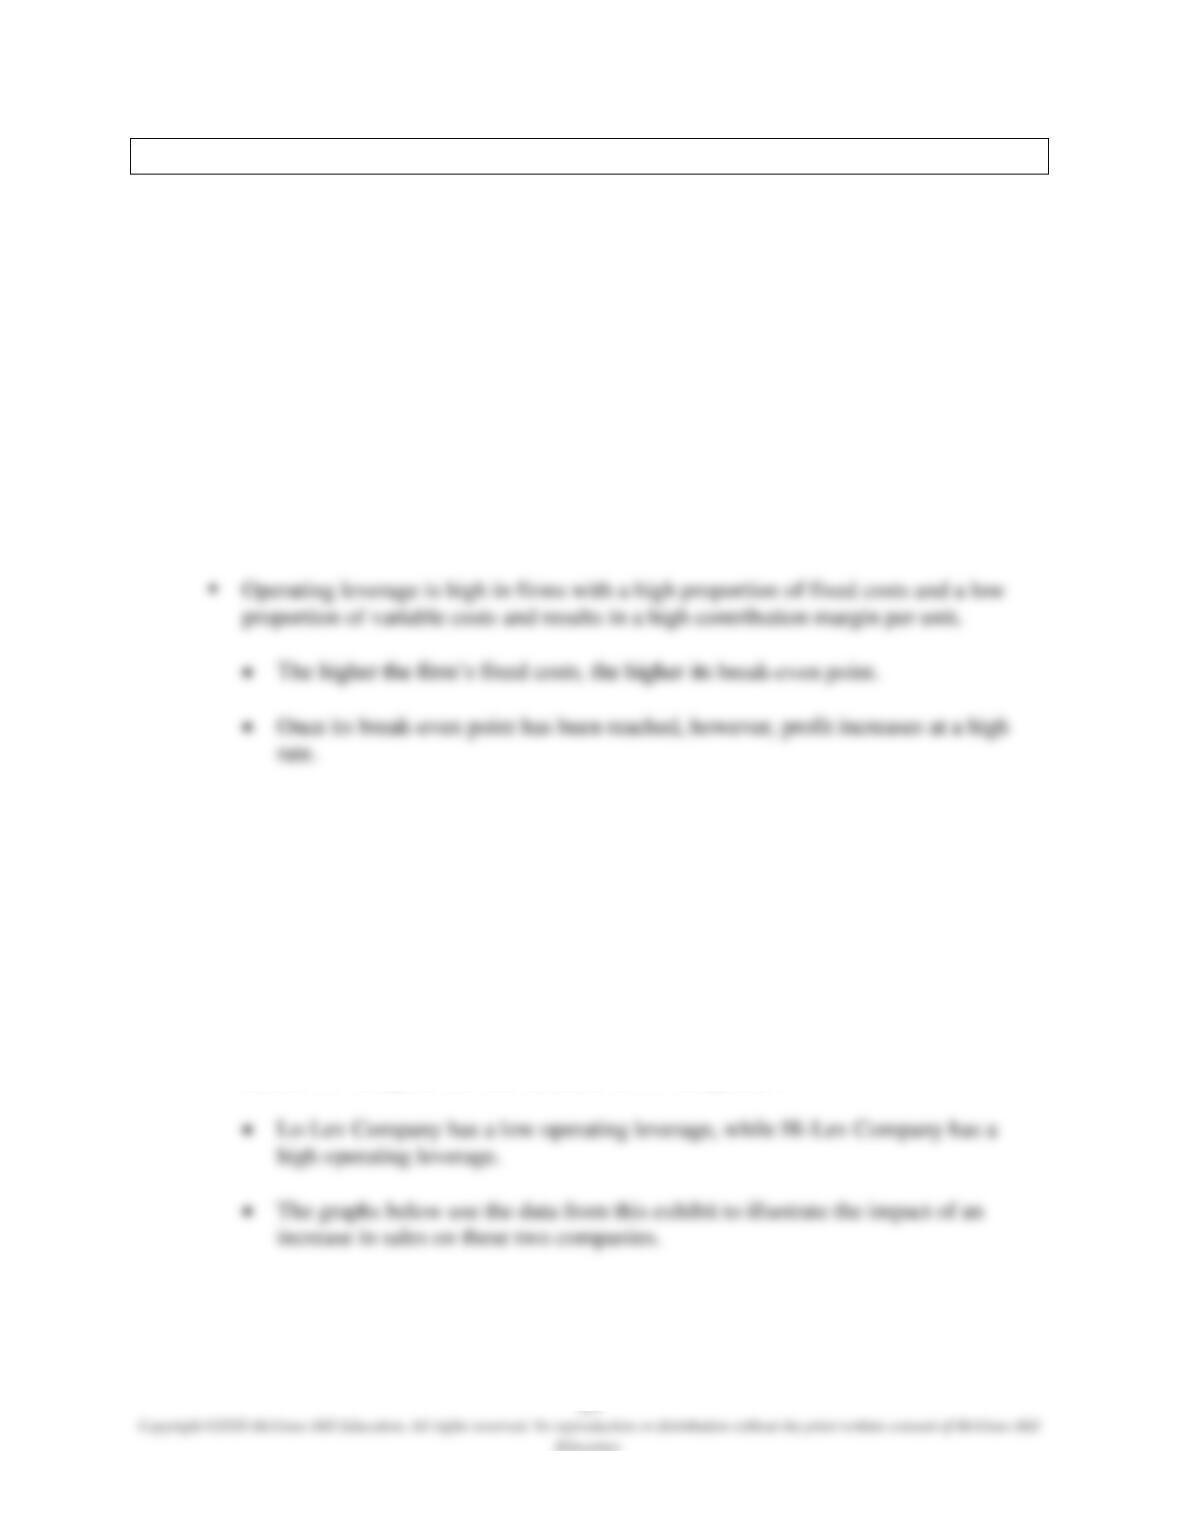
▪ Operating leverage is low in firms with a low proportion of fixed costs and a high
proportion of variable costs and results in a low contribution margin per unit.
• Firms with lower operating leverages are more flexible and better at withstanding
economic downtimes.
▪ Profit increase (decrease) as a result of improved (declining) sales can be calculated
as the product of operating leverage and sales increase (decrease) in percentage. (See
Business Application box “Break-Even Analysis Used by “Big Oil.”)
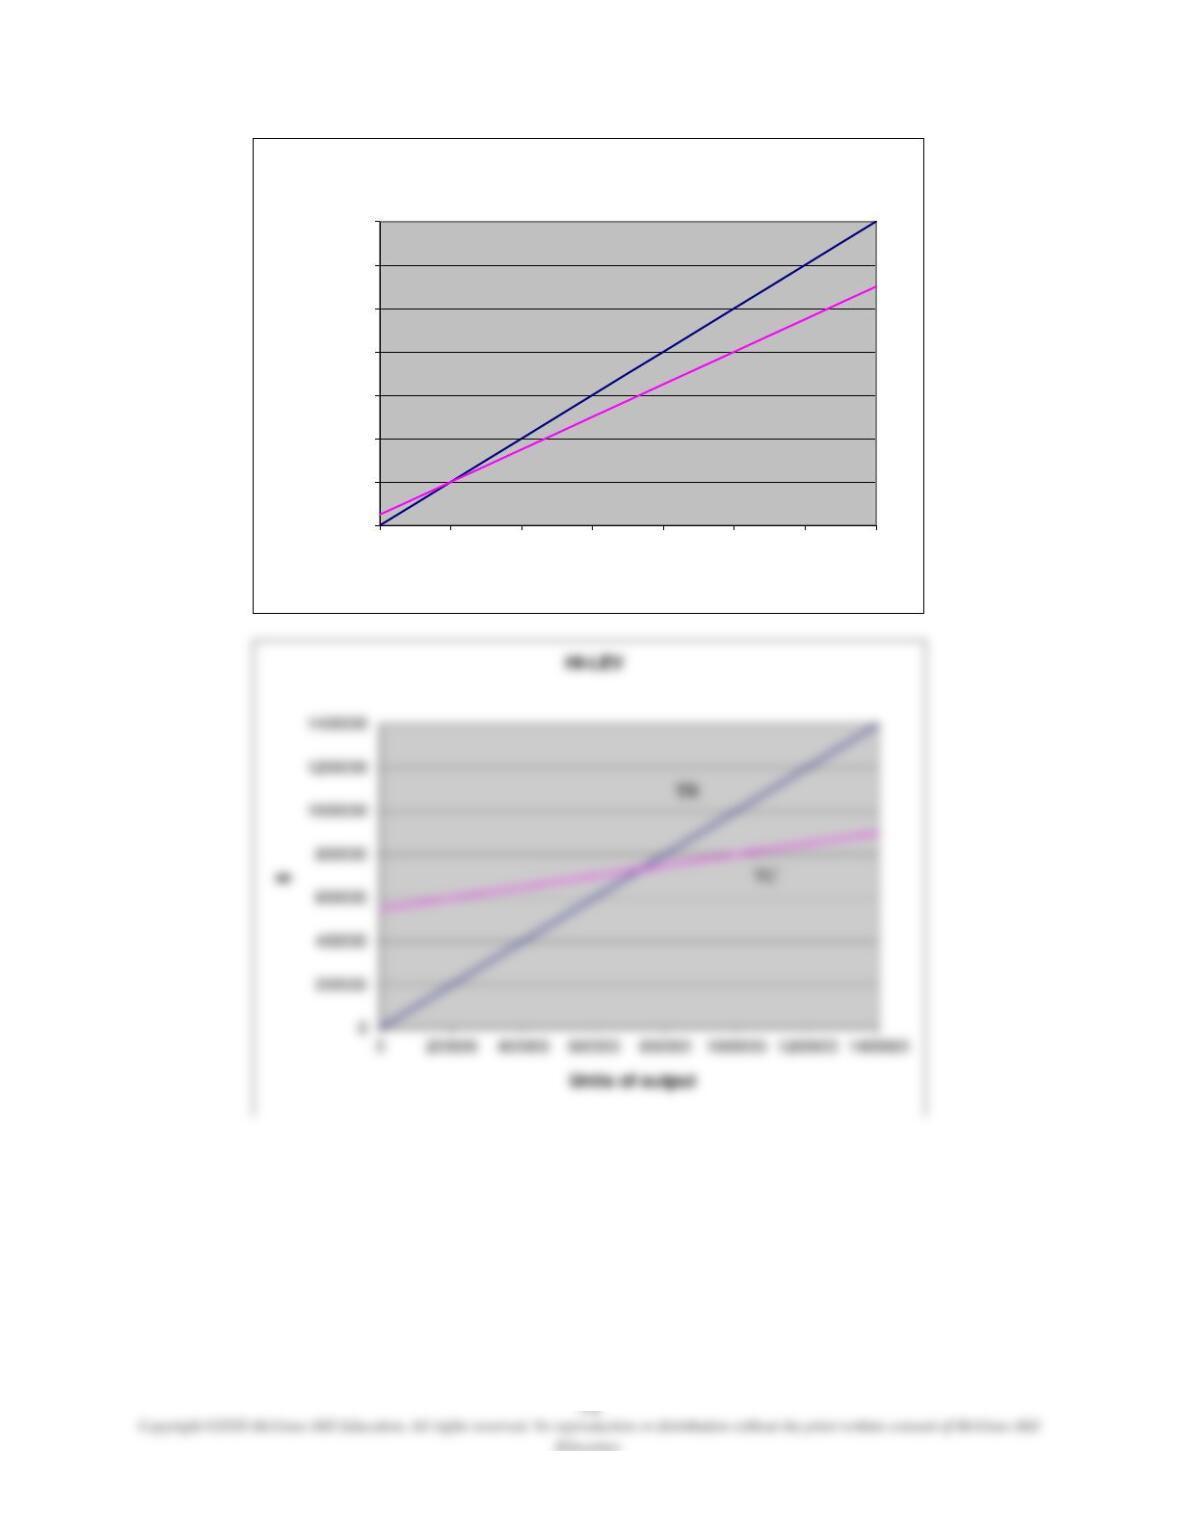
▪ Exhibit 3.5 compares the cost structure of two companies.
0
200000
400000
600000
800000
1000000
1200000
1400000
0200000 400000 600000 800000 1000000 1200000 1400000
$
Units of output
LO-LEV
TR
TC
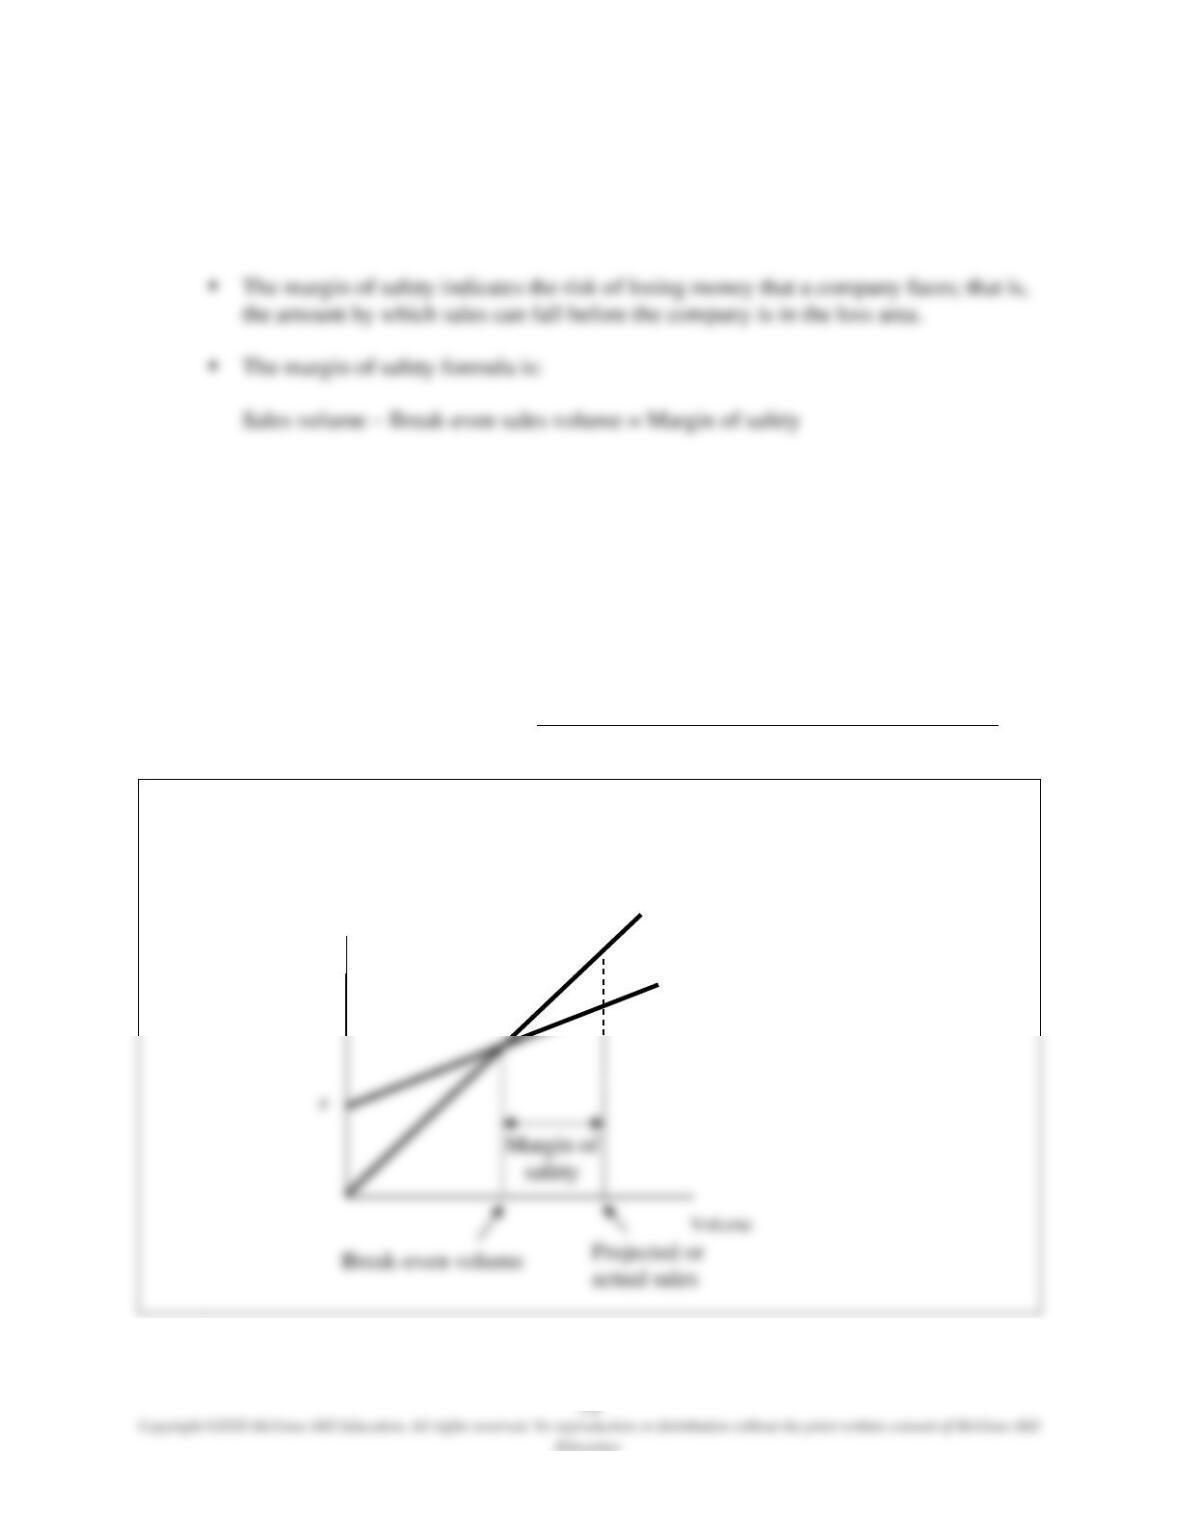
• Margin of Safety
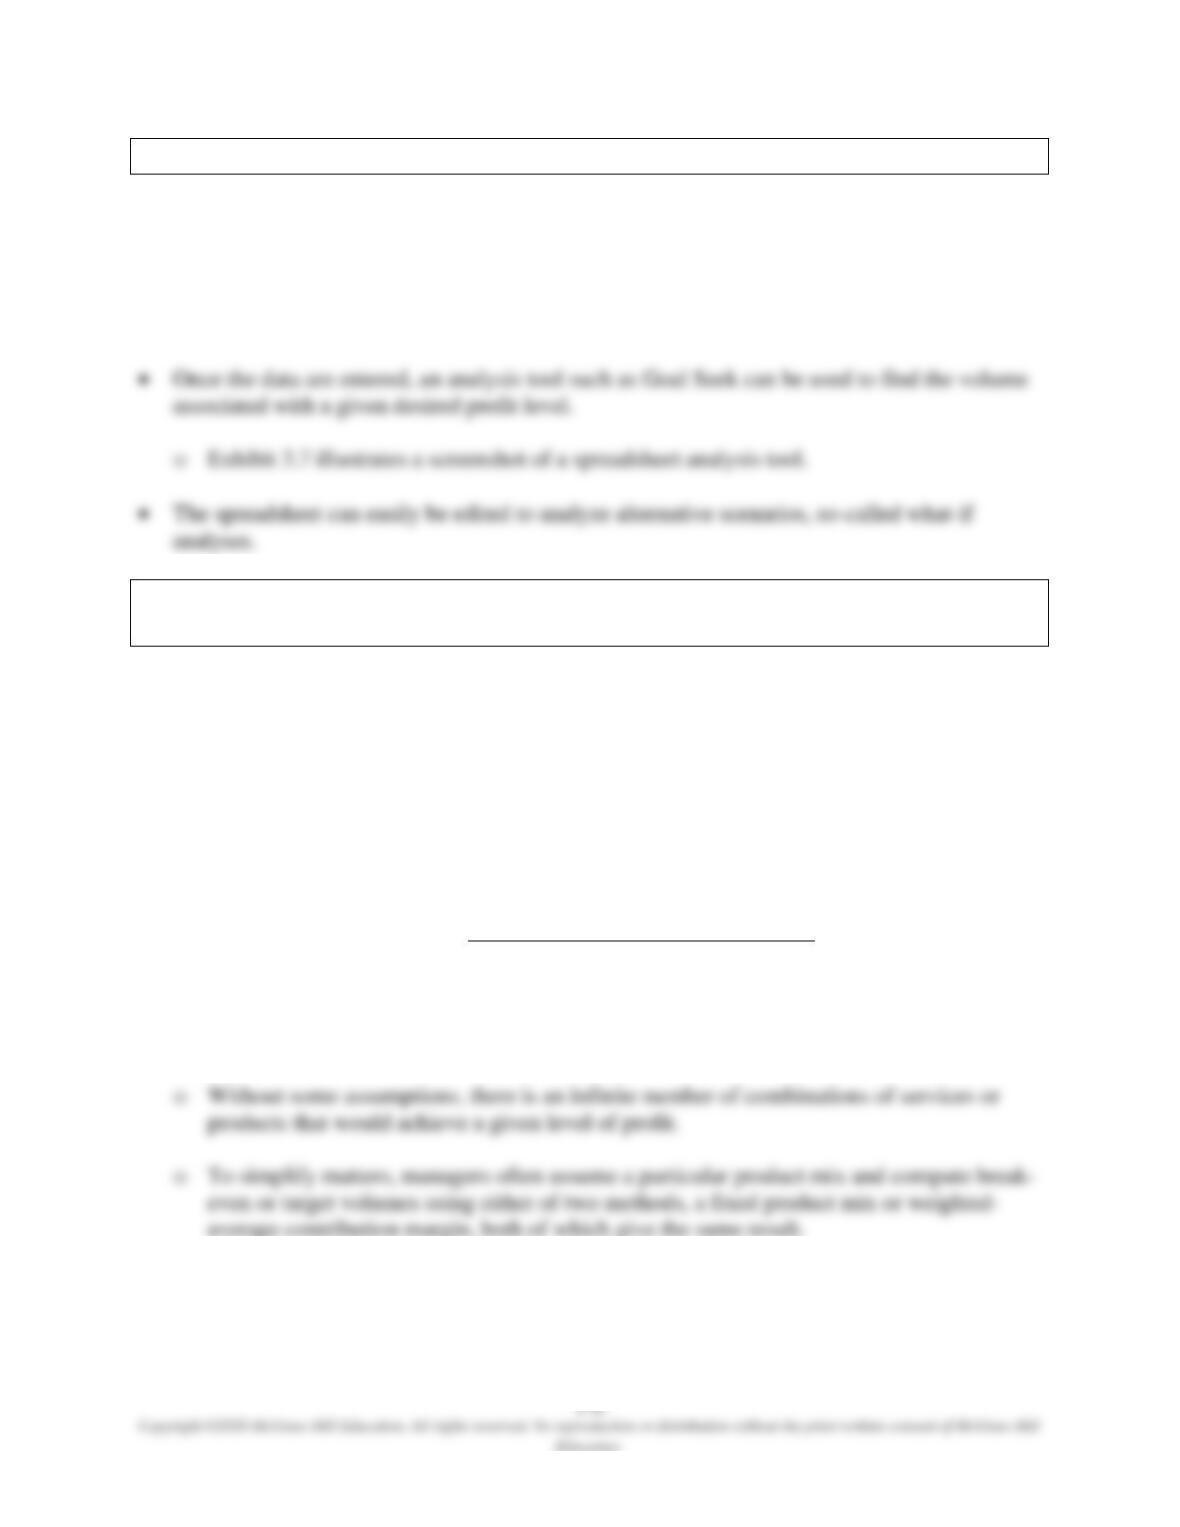
o Margin of safety is the excess of projected (or actual) sales over the break-even sales
level.
o The margin of safety percentage is the excess of projected (or actual) sales over the
break-even volume expressed as a percentage of the actual volume.
▪ The margin of safety percentage indicates the percentage decline in sales volume
before the company finds itself operating at a loss.
▪ The margin of safety percentage formula is:
Margin of safety percentage =
Projected (or actual) sales – Break-even sales
volume
Break-even volume
Margin of safety is presented below.
$
TR = PX
TC = F + VX
LO 3-3 Use Microsoft Excel to perform CVP analysis.
CVP ANALYSIS WITH SPREADSHEETS
• Spreadsheet programs such as Microsoft Excel® are ideally suited to doing CVP routinely.
o Exhibit 3.6 illustrates a screenshot of a spreadsheet program for CVP Analysis.
LO 3-4 Incorporate taxes, multiple products, and alternative cost structures
into the CVP analysis.
EXTENSIONS OF THE CVP MODEL
• Income Taxes
o Assuming that operating profits before taxes and taxable income are the same, income
taxes may be incorporated into the basic model as follows (where t is the tax rate):
After-tax profit = [(P – V) X – F] × (1 – t)
o Target volume (in units) =
Fixed costs + [Target profit/(1 – t)]
Unit contribution margin
See Demonstration Problem 2
• Multiproduct CVP Analysis
o Fixed Product Mix
▪ Using the fixed product mix method, managers define a package or bundle of
products in the typical product mix and then compute the break-even or target volume
for the package.
▪ Once the break-even point is calculated for the number of packages required, the
product mix in the package will be multiplied to determine the required units for each
product.
o Weighted-Average Contribution Margin
See Demonstration Problem 3
• Alternative Cost Structures
o When more complicated cost structures are considered, the basic setup developed so far
must be adapted to deliver relevant information for decision making.
▪ Consider the fixed cost that follows a step-cost pattern over the relevant range as
machine capacity is limited. If the break-even calculation results in a required volume
that is within the existing capacity, no further consideration is needed.
LO 3-5 Understand the assumptions and limitations of CVP analysis.
• Assumptions and Limitations of CVP Analysis
o CVP analysis relies on certain assumptions that may limit the applicability of the results
for decision making.
▪ The limitations are due to the assumptions made; they are not inherent to the method
of CVP analysis itself.
▪ It is usually assumed that unit variable cost and unit price are constant for all levels of
volume.