3
Fundamentals of Cost-Volume-Profit Analysis
Solutions to Review Questions
3-1.
Profit
=
TR – TC
=
PX – VX – F
=
(P – V)X – F
where
Profit
=
operating profit,
TR
=
total revenue,
TC
=
total costs,
P
=
average unit selling price,
V
=
average unit variable cost,
X
=
quantity of units,
F
=
total fixed costs for the period.
3-2.
Total costs = Total variable costs plus total fixed costs.
3-3.
Total contribution margin: Total selling price – Variable manufacturing costs expensed –
Variable nonmanufacturing costs expensed = Total contribution margin.
Gross margin: Total selling price – Variable manufacturing costs expensed – Fixed
manufacturing costs expensed = Gross margin.
3-4.
3-5.
3-6.
Operating leverage is the proportion of fixed costs in an organization’s cost structure. It is
important for managers because it determines how an increase in volume affects the
change in profits.
3-7.
3-8.
Goal Seek is the function in Microsoft Excel that can be used for CVP analysis.
3-9.
Target volume (units)
=
Fixed costs + [Target profit/(1-t)]
Unit contribution margin
3-10.
3-11.
It is common to assume a fixed sales mix when solving for break-even volumes with
3-12.
Two common assumptions in CVP analysis are that unit prices and unit variable costs are
constant. It is also common to assume that fixed costs are constant over relatively large
volume ranges. Although these assumptions are common, they are not a necessary part
of CVP analysis. CVP analysis can accept many forms of price and cost relations with
volume. However, when more general relations are used, the common break-even
formulas will no longer hold.
Solutions to Critical Analysis and Discussion Questions
3-13.
There may be a difference between costs used in cost-volume-profit analysis and costs
expensed in financial statements. A common example is fixed manufacturing costs. Cost-
3-14.
The accountant makes use of a linear representation to simplify the analysis of costs and
revenues. These simplifying assumptions are generally reasonable within a relevant range
of activity. Within this range, it is generally believed that the additional costs required to
employ nonlinear analysis cannot be justified in terms of the benefits obtained. Thus,
within this range, the linear model is considered the “best” in a cost-benefit sense.
3-15.
As volume rises, it is likely that product markets will be saturated, leading to a need to cut
prices to maintain or increase volume. This price-cutting would result in a nonlinear
3-16.
Although the assumptions of CVP analysis appear relatively simplistic, CVP analysis is a
useful tool for understanding the relations among costs, volumes, and the resulting profit.
Clearly, the more important the decision, the more time that should be spent developing
good assumptions. However, CVP analysis is useful for developing intuition about the cost
structure of the firm.
3-17.
Although there are no “profits” in a not-for-profit organization, these organizations are still
3-18.
Most business schools have relatively high fixed costs when volume is measured by the
3-19.
High (or low) operating leverage is not a good (or bad) thing. It is the result of managerial
decisions about the resources to be used (and the structure of the costs that result).
Therefore, if it is better to use resources, which are more flexible, it might be preferable to
rent (lease). As a result, the operating leverage would be lower than a similar business
where a manager decided that is was better not to bear the risks of rising rents.
3-20.
The “product” or “service” for an airline consists of a flight between two city-pairs (for
3-21.
Because the price Luxe pays for the leased parking space is fixed (it does not depend on
how many times it is used), the cost per use falls as the number of times it is used
increases. This is the same phenomenon we saw in Chapter 2 when considering fixed
manufacturing overhead and fixed administrative costs.
3-22.
The per-unit lease cost is not appropriate to decide where to park the cars, because the
lease costs will not be affected by that decision.
3-23.
The major difference is that the measure used in the article is based on cash whereas in
Solutions to Exercises
3-24. (15 min.) Profit Equation Components.
3-25. (15 min.) Profit Equation Components.
a. Total fixed costs (loss at zero volume)
b. Break-even point
c. Slope = contribution margin per unit
d. Profit line
3-26. (20 min.) Basic Decision Analysis Using CVP: Anu’s Amusement Center.
a. $2,400,000 75,000 tickets = $32 per ticket
b. $1,350,000 75,000 tickets = $18 per ticket
c. ($32.00 – $18.00) = $14 per ticket
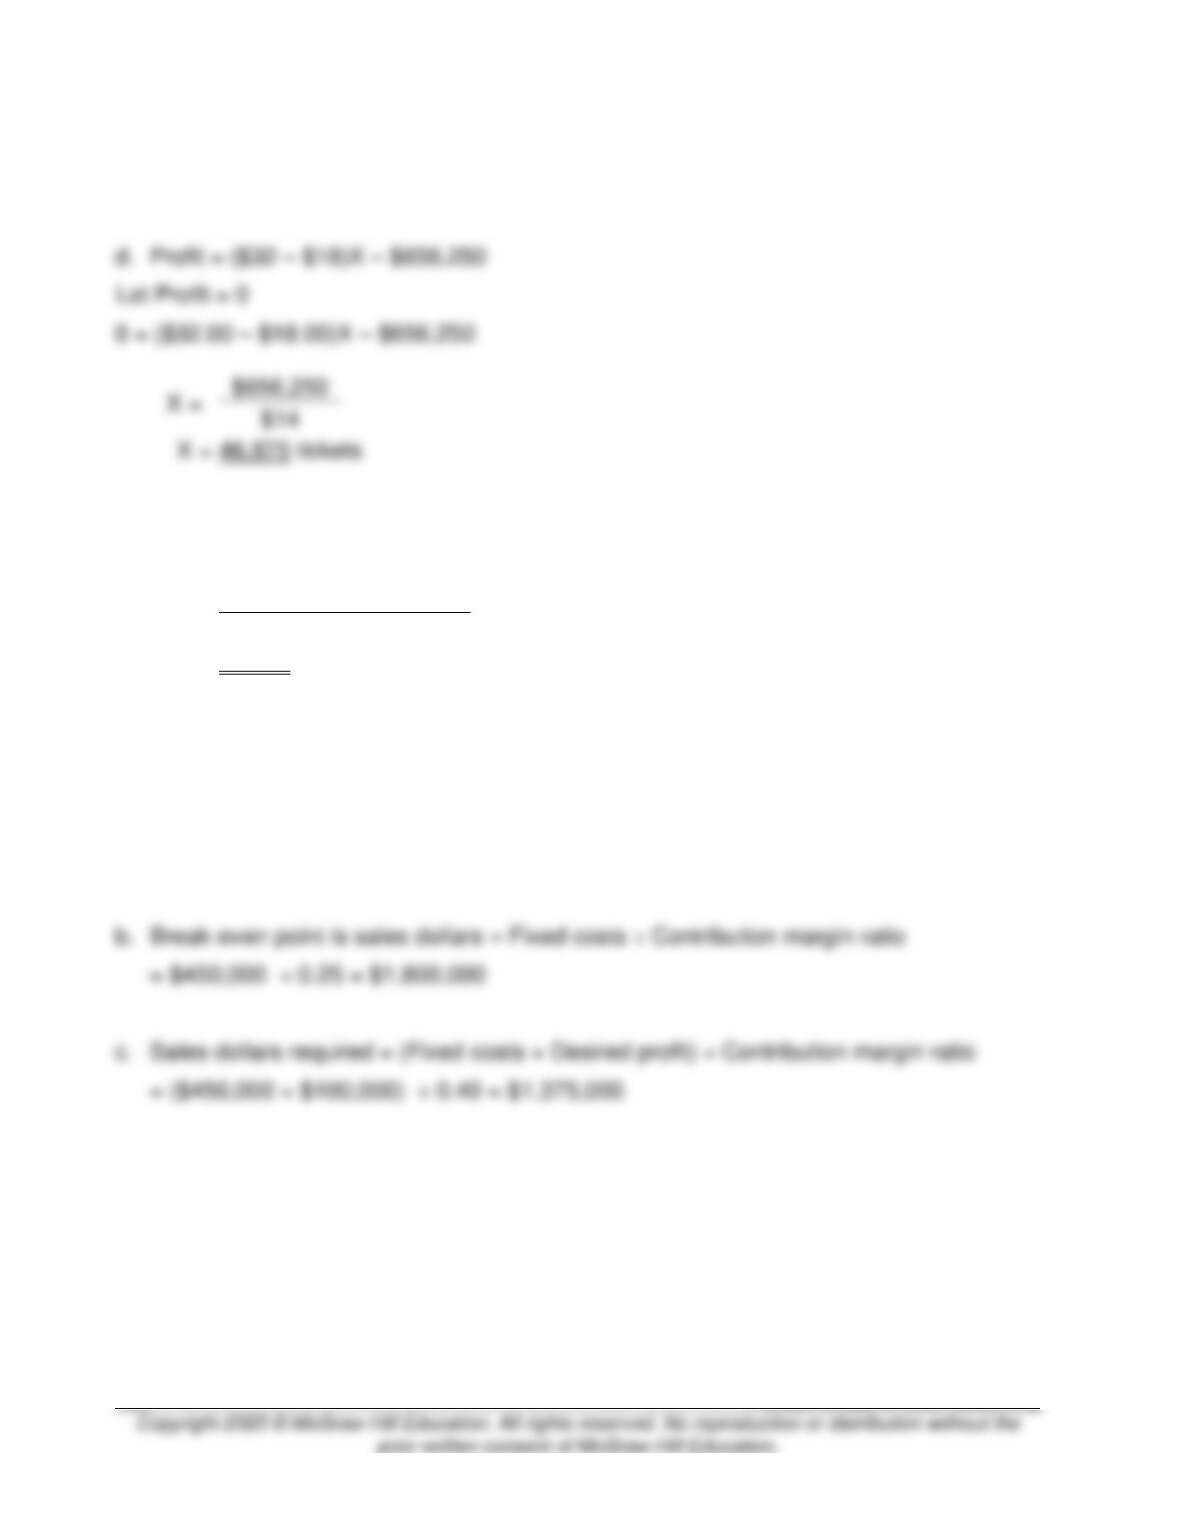
X =
e. Let Profit = $131,250
$131,250 = ($32 – $18)X – $656,250
X =
$656,250 + $131,250
$14
X =
56,250 tickets
3-27. (20 min.) Basic CVP Analysis: Dukey’s Shoe Station.
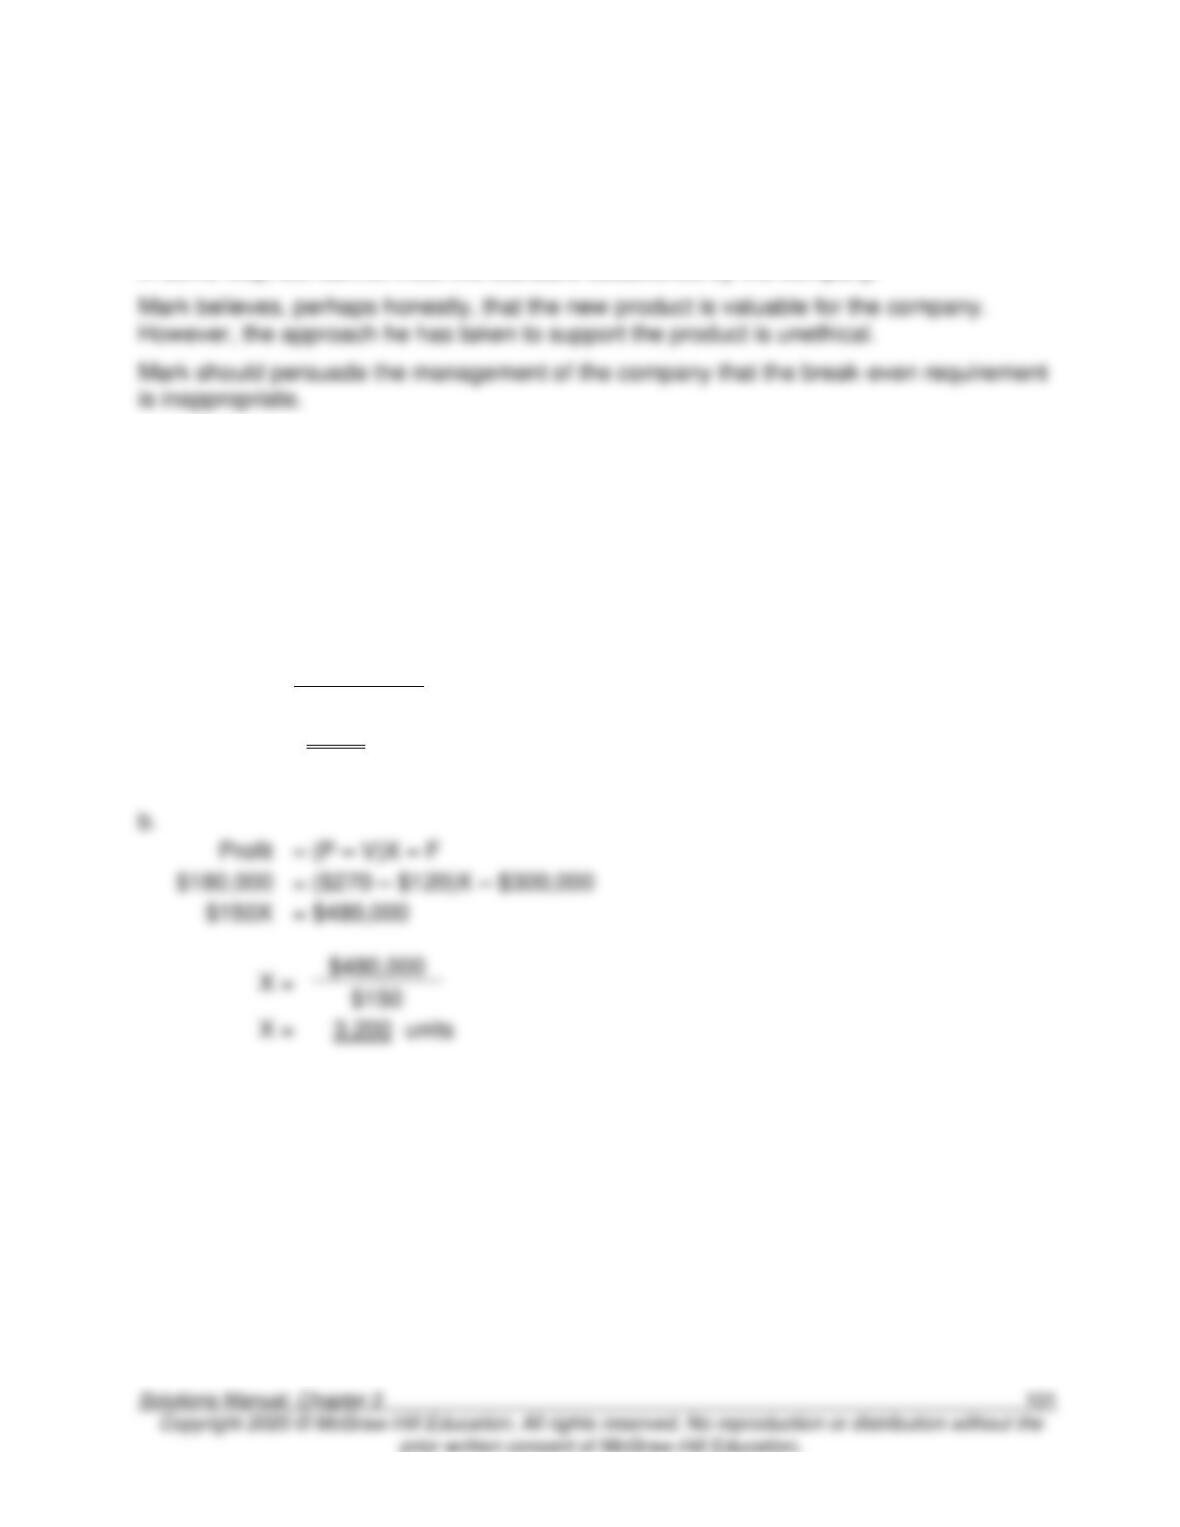
a. Break-even point is sales dollars = Fixed costs ÷ Contribution margin ratio
= $450,000 ÷ 0.40 = $1,125,000
3-28. (25 min.) CVP Analysis—Ethical Issues: Mark Ting.
This problem is based on the experience of the authors at several companies.
The problem in this example, which is common, is that the guidelines the company has
established (for example, a high break-even point) lead to projects that would be valuable
3-29. (55 min.) Basic Decision Analysis Using CVP: Derby Phones.
a.
Profit
=
(P – V)X – F
$0
=
($270 – $120)X – $300,000
$150X
=
$300,000
X =
$300,000
$150
X
=
2,000
units
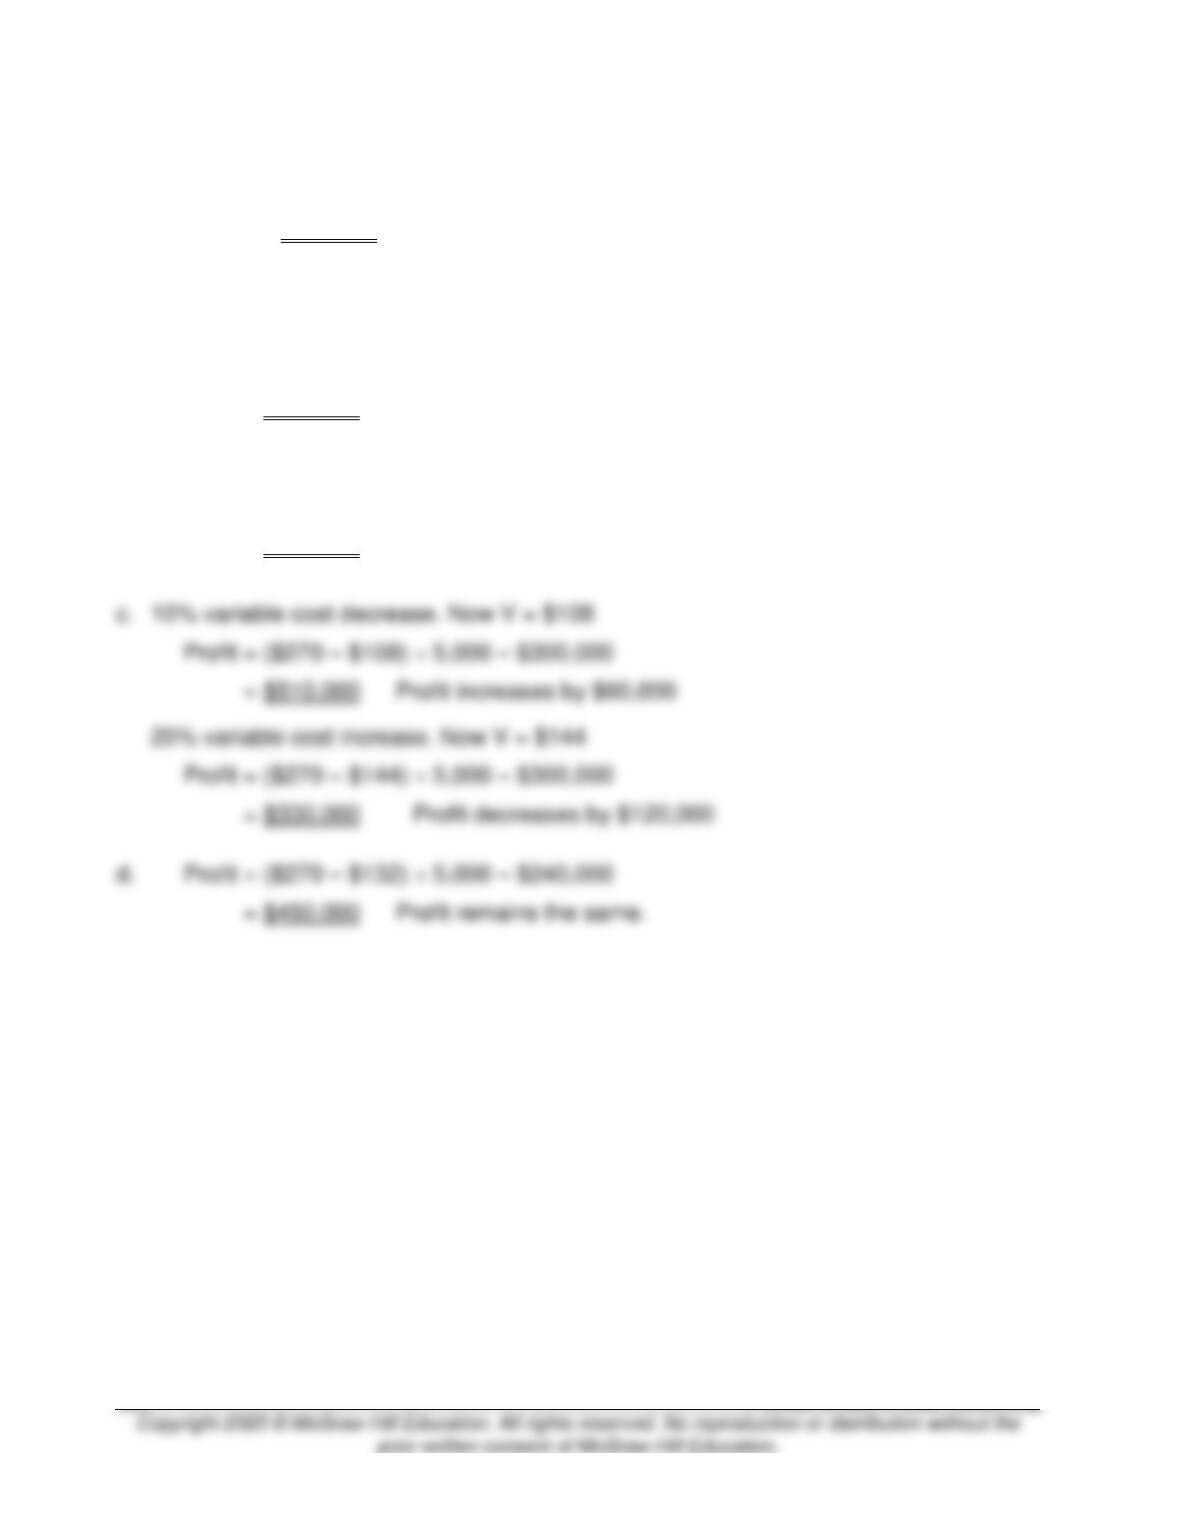
(P – V)X – F
$180,000
($270 – $120)X – $300,000
$480,000
$150
3-30. (55 min.) Basic Decision Analysis Using CVP: Derby Phones.
a.
Profit
=
($270 – $120) 5,000 – $300,000
=
$450,000
b.
10% price decrease. Now P = $243
Profit
=
($243 – $120) 5,000 – $300,000
=
$315,000
Profit decreases by $135,000
20% price increase. Now P = $324
Profit
=
($324 – $120) 5,000 – $300,000
=
$720,000
Profit increases by $270,000
c.
10% variable cost decrease. Now V = $108
($270 – $108) 5,000 – $300,000
20% variable cost increase. Now V = $144
($270 – $144) 5,000 – $300,000
d.
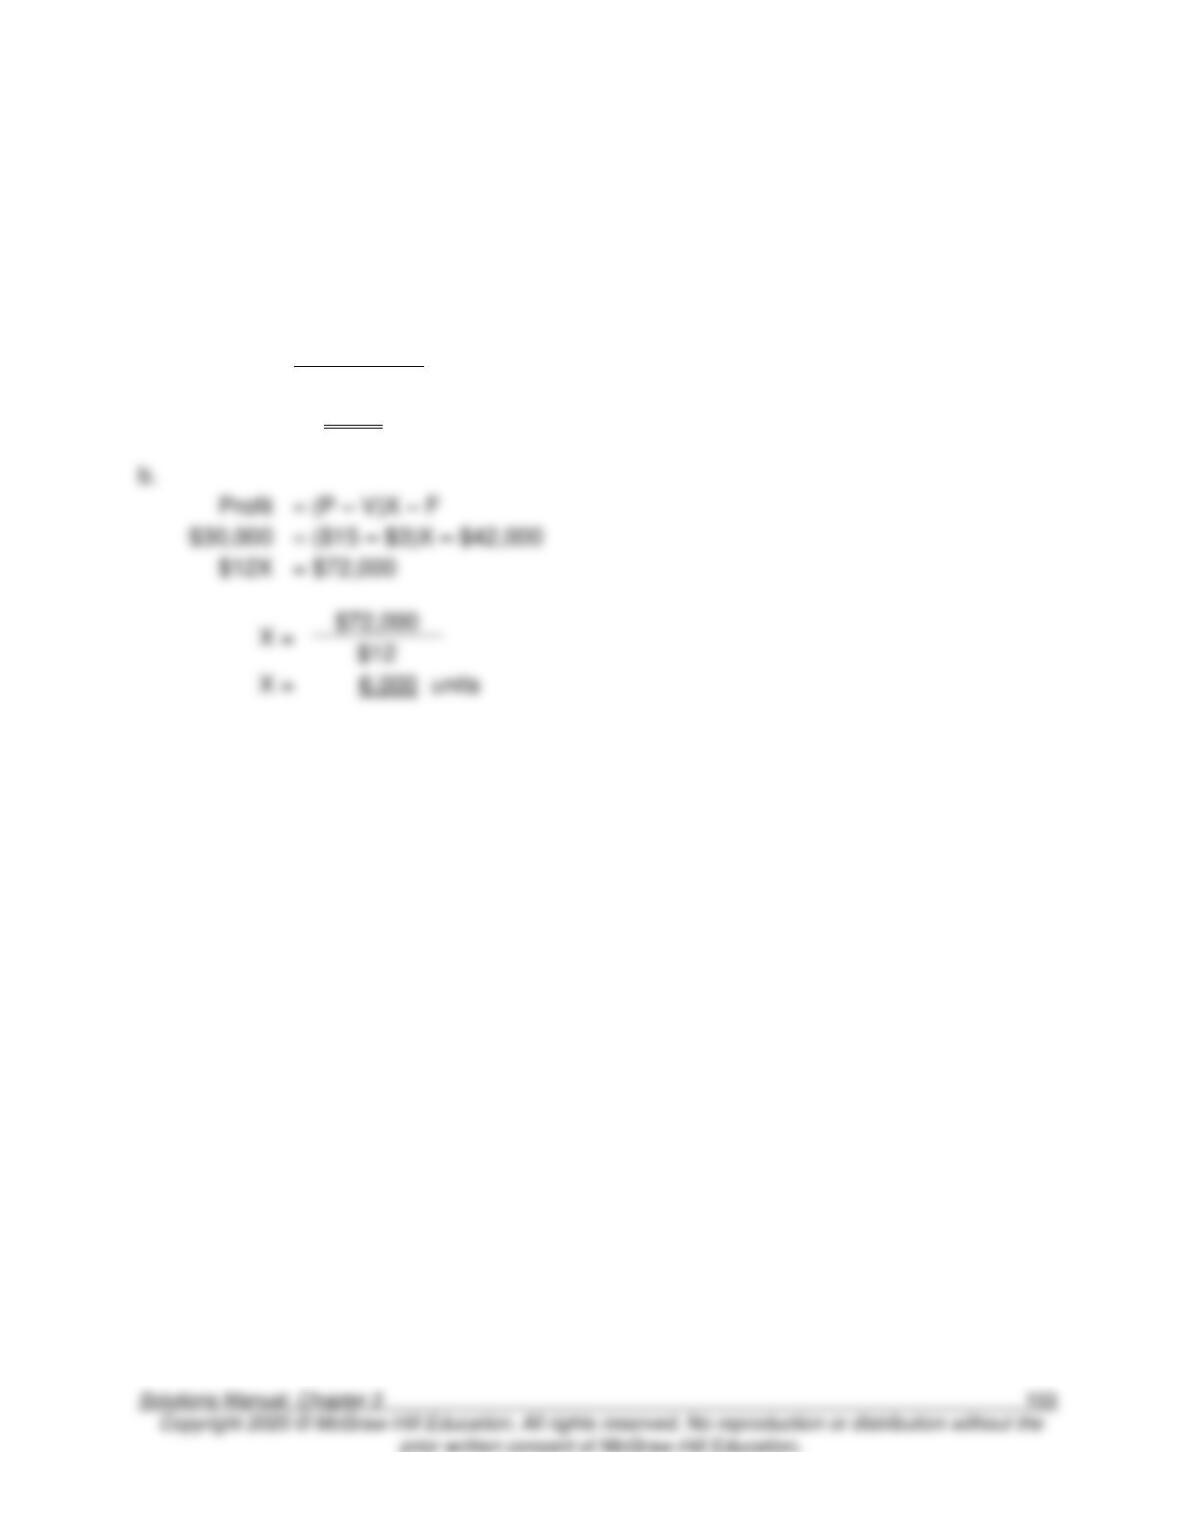
($270 – $132) 5,000 – $240,000
3-31. (25 min.) Basic Decision Analysis Using CVP: Warner Clothing.
a.
Profit
=
(P – V)X – F
$0
=
($15 – $3)X – $42,000
$12X
=
$42,000
X =
$42,000
$12
X
=
3,500
units
(P – V)X – F
$12
units
3-32. (30 min.) Basic Decision Analysis Using CVP: Warner Clothing.
a.
Profit
=
($15 – $3) 5,000 – $42,000
=
$18,000
b.
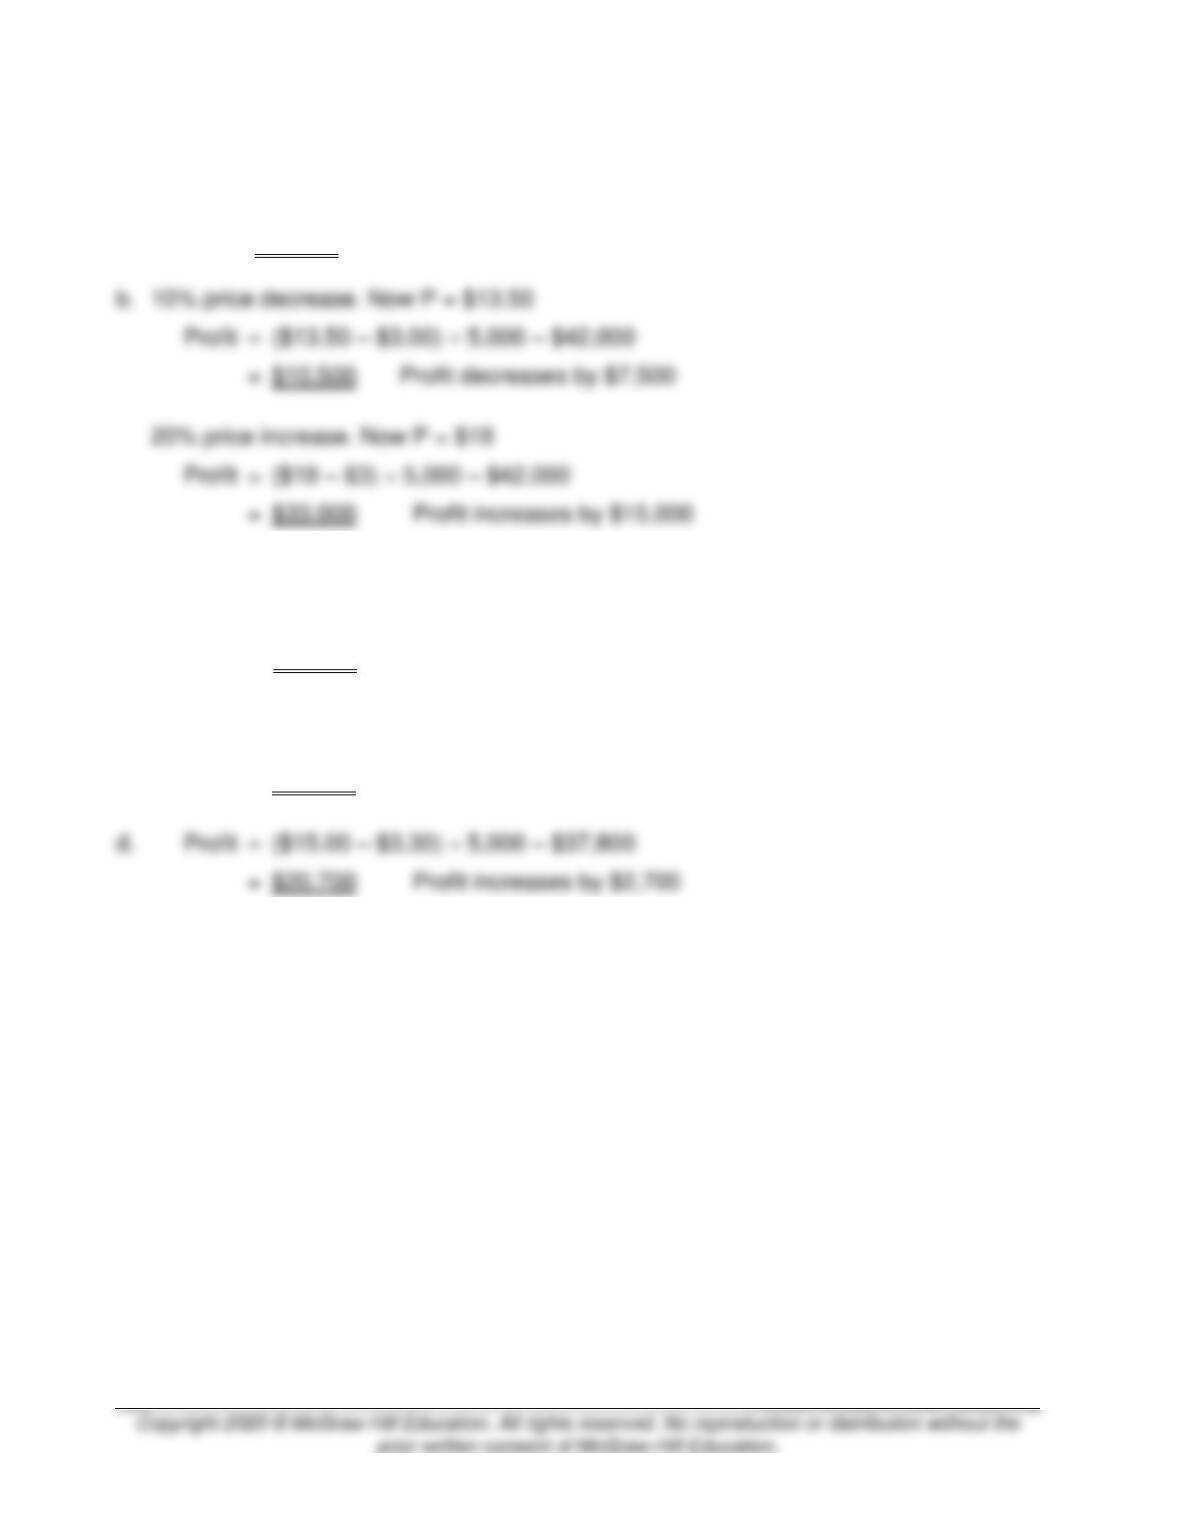
10% price decrease. Now P = $13.50
Profit
=
($13.50 – $3.00) 5,000 – $42,000
20% price increase. Now P = $18
c.
10% variable cost decrease. Now V = $2.70
Profit
=
($15.00 – $2.70) 5,000 – $42,000
=
$19,500
Profit increases by $1,500
20% variable cost increase. Now V = $3.60
Profit
=
($15.00 – $3.60) 5,000 – $42,000
=
$15,000
Profit decreases by $3,000
d.
Profit
=
($15.00 – $3.30) 5,000 – $37,800
3-33. (30 min.) Basic CVP Analysis: Pacific Parts.
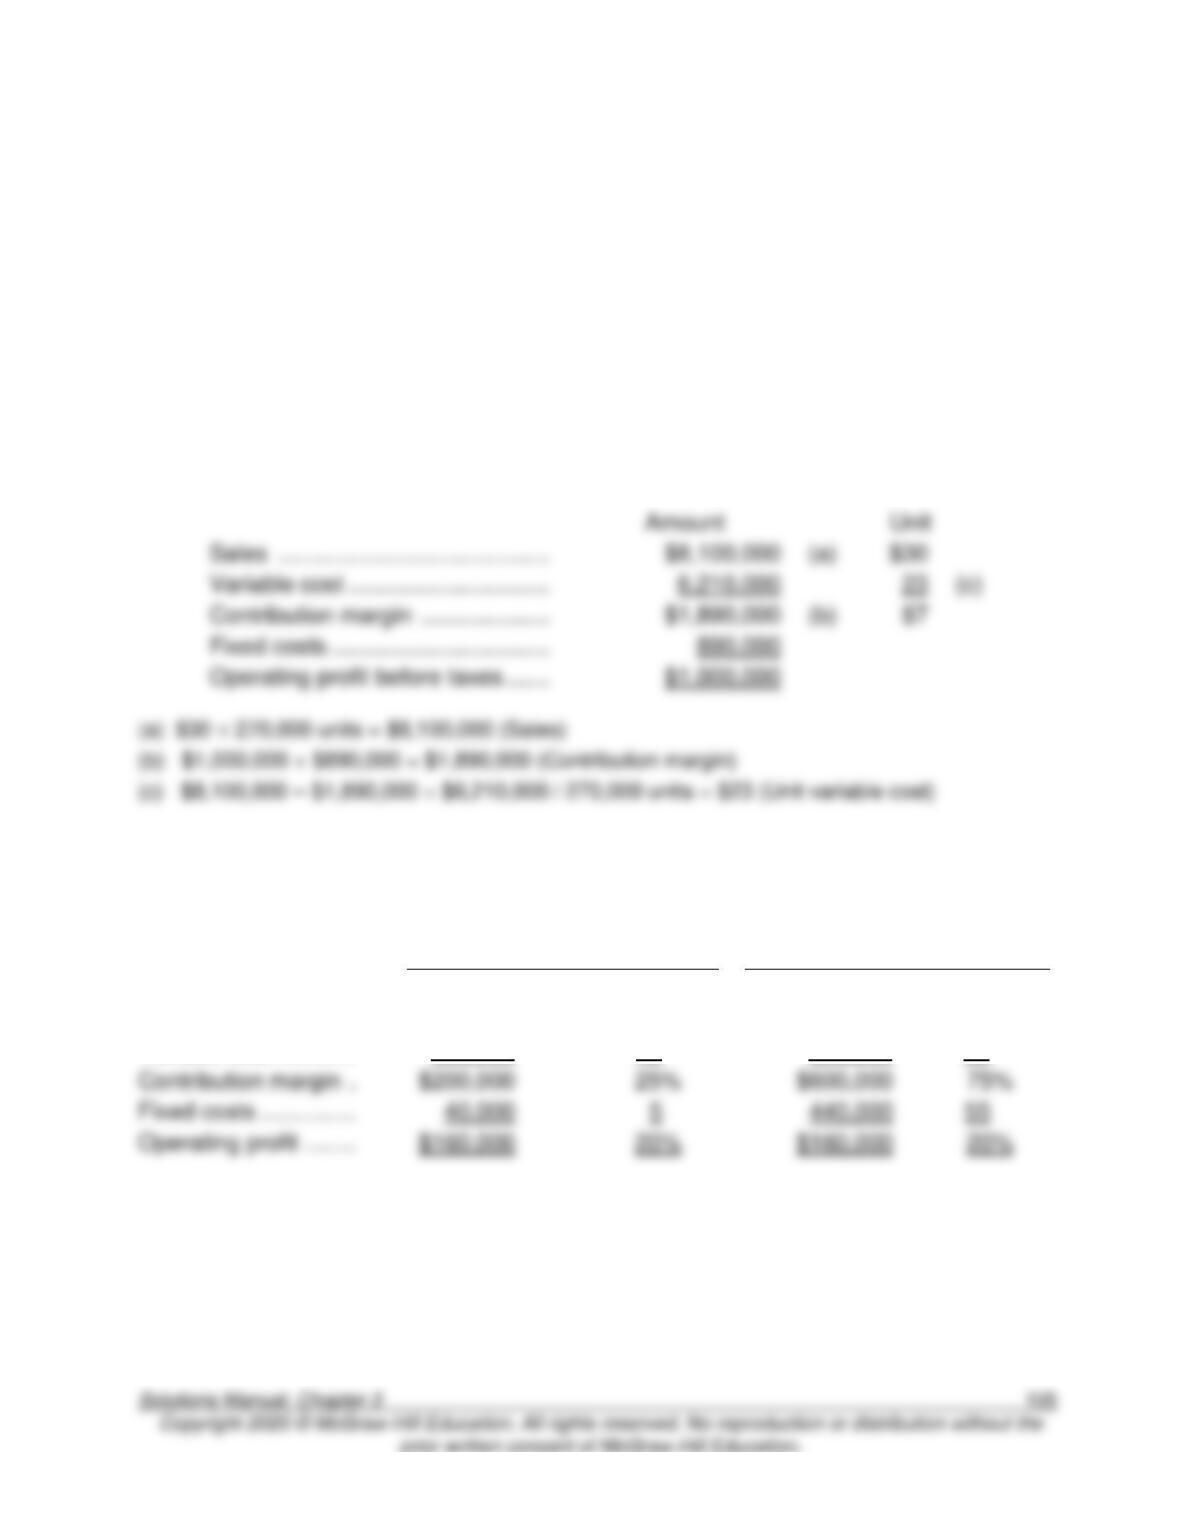
$23 per unit.
Using the profit equation:
Profit = (P – V) X – FC
$1,000,000 = ($30 – V) 270,000 – $890,000
V = $6,210,000 ÷ 270,000
V = $23 per unit.
Using an income statement format (based on 270,000 units):
Sales ……………………………………
(a)
Variable cost ………………………….
(c)
Contribution margin ………………..
(b)
Fixed costs …………………………….
3-34. (30 min.) Analysis of Cost Structure: The Greenback Store vs. One-Mart.
a.
Greenback Store
One-Mart
Amount
Percentage
Amount
Percentage
Sales …………………..
$800,000
100%
$800,000
100%
Variable cost …………
600,000
75
200,000
25
Contribution margin .
Fixed costs ……………
b. Greenback Store’s profits increase by $30,000 [= .25 ($800,000 .15)] and One
Mart’s profits increase by $90,000 [= .75 ($800,000 .15)].
3-35. (30 min.) Analysis of Cost Structure: Spring Company vs. Winters
Company.
a.
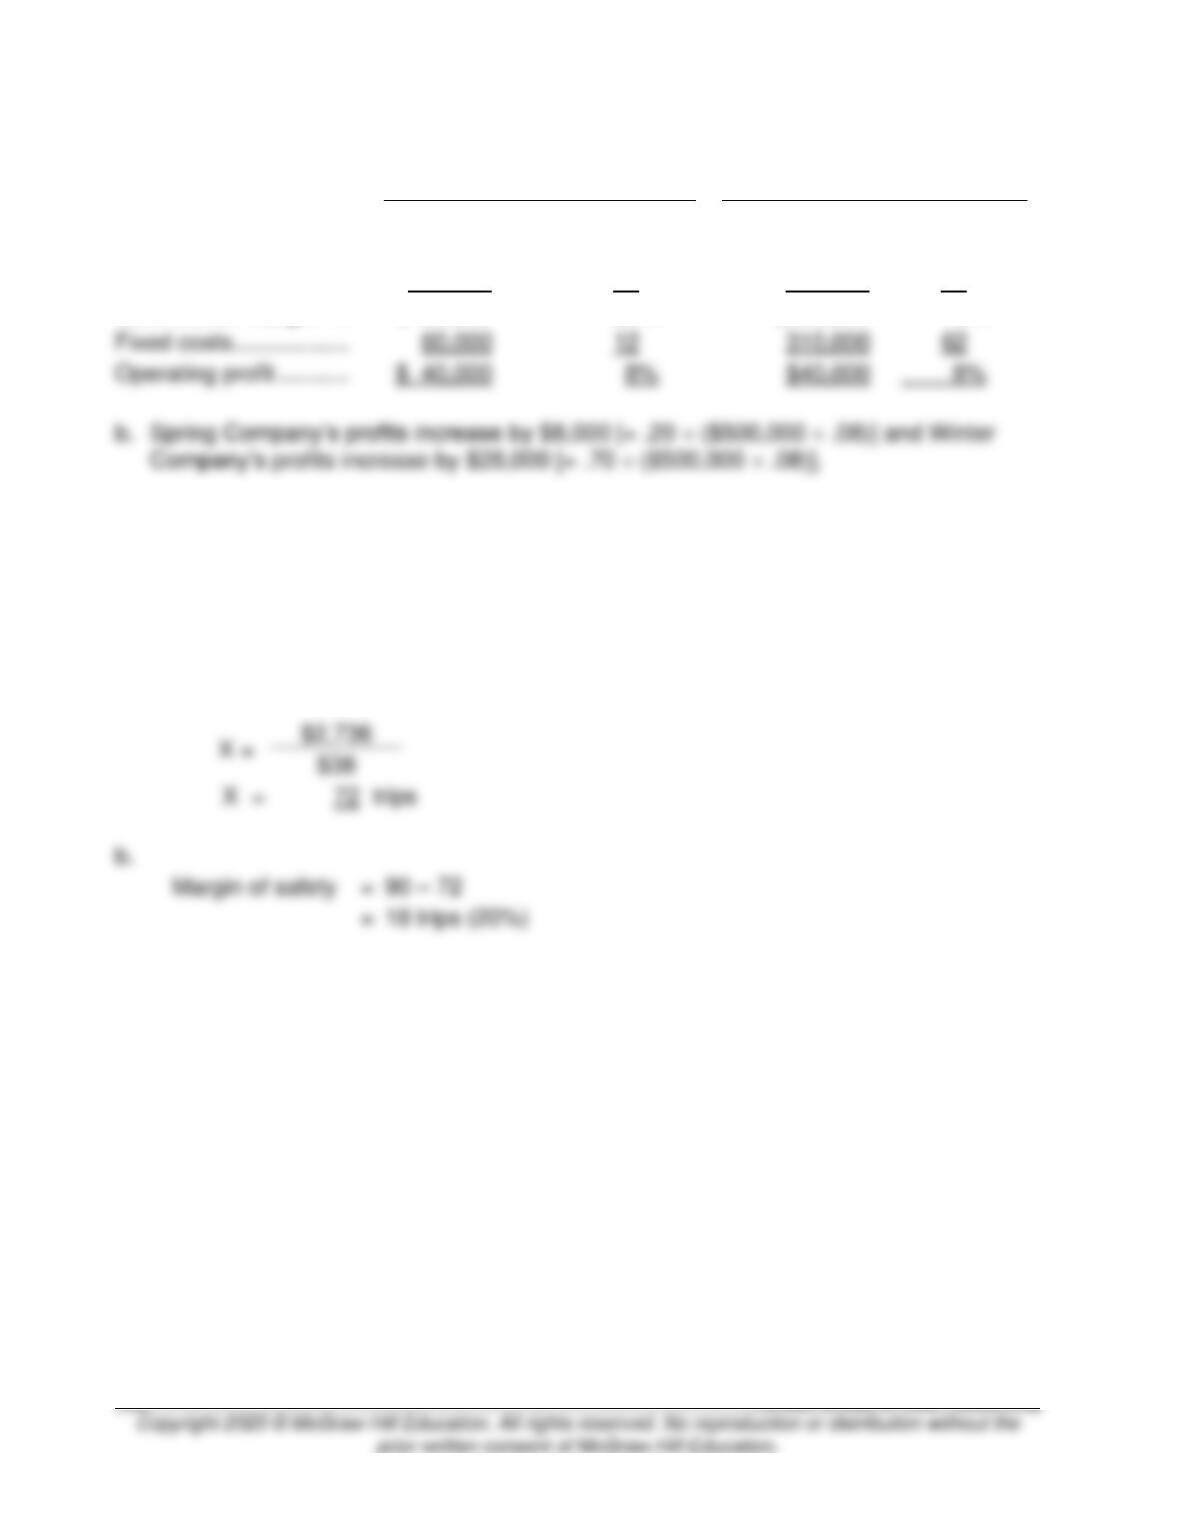
Spring Company
Winters Company
Amount
Percentage
Amount
Percentage
Sales ……………………..
$500,000
100%
$500,000
100%
Variable cost ……………
400,000
80
150,000
30
Contribution margin …
$100,000
20%
$350,000
70%
Fixed costs ………………
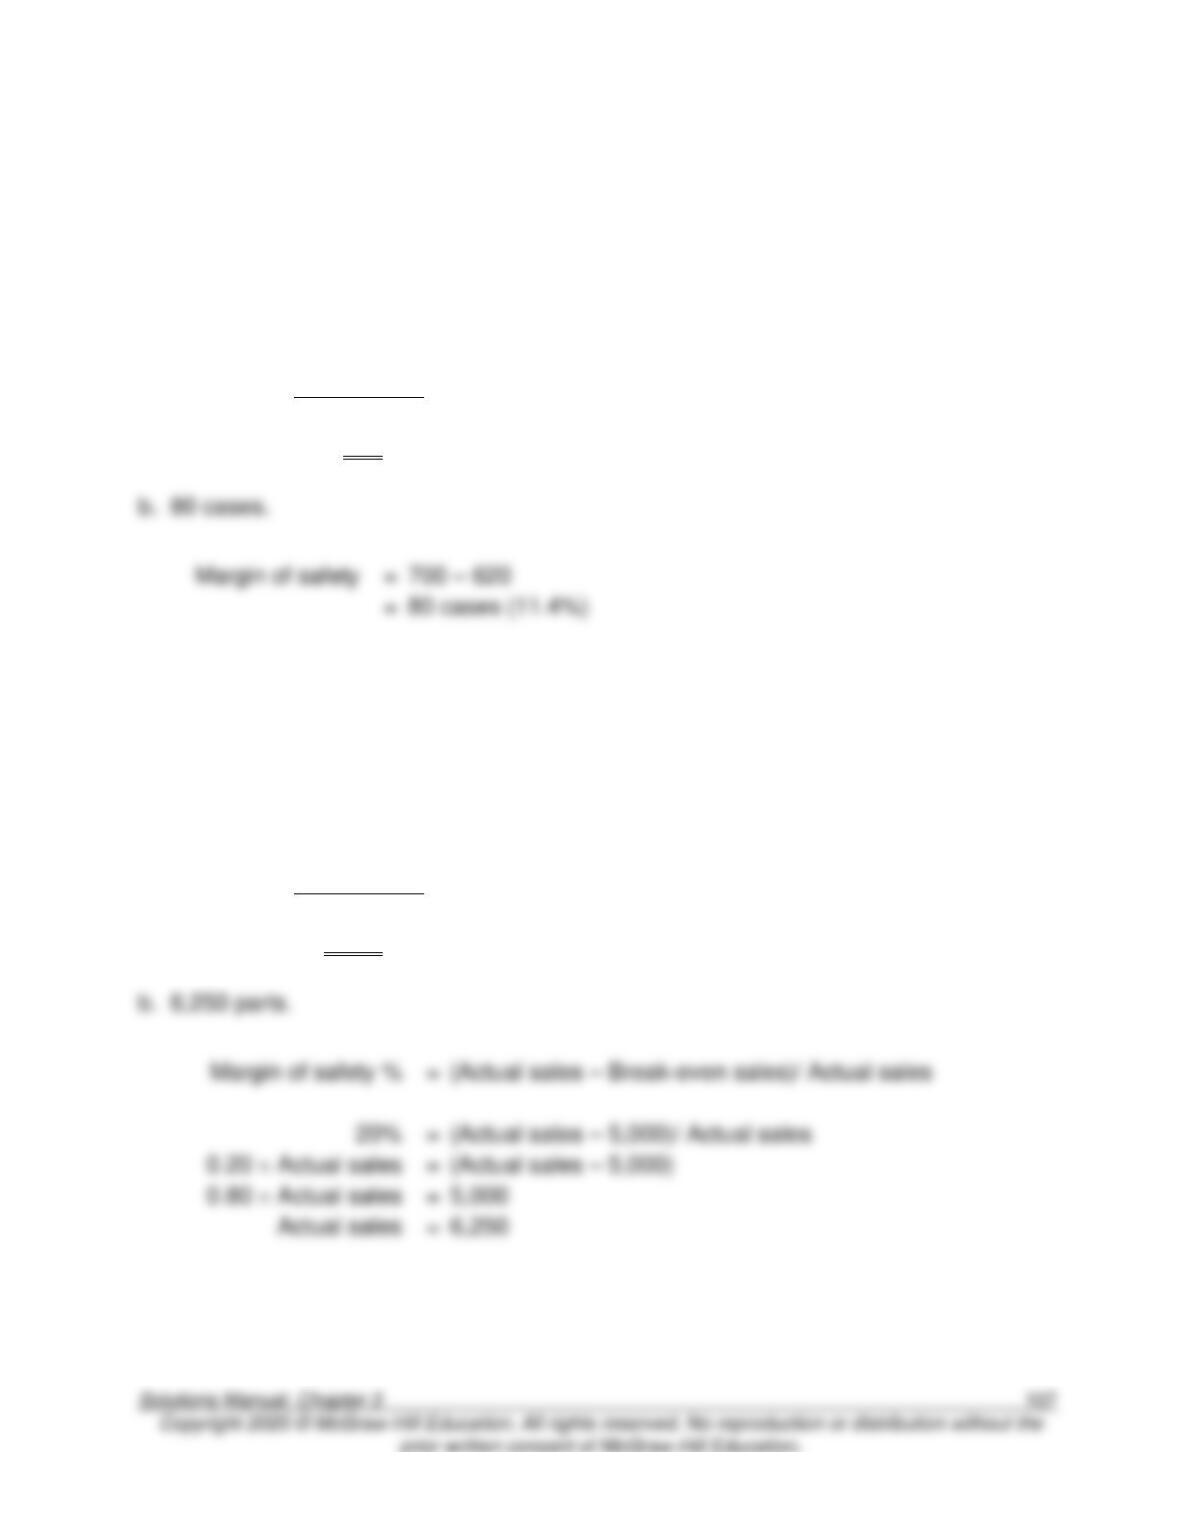
3-36. (15 min.) CVP and Margin of Safety: Bristol Car Service.
a.
Profit
=
(P – V)X – F
$0
=
($50 – $12)X – $2,736
$38X
=
$2,736
$2,736
=
=
18 trips (20%)
3-37. (15 min.) CVP and Margin of Safety: Casey’s Cases.
a. 620 cases.
Profit
=
(P – V)X – F
$0
=
($30 – $26)X – $2,480
$4X
=
$2,480
X =
$2,480
$4
X
=
620
cases
80 cases (11.4%)
3-38. (20 min.) CVP and Margin of Safety: Bando Corp.
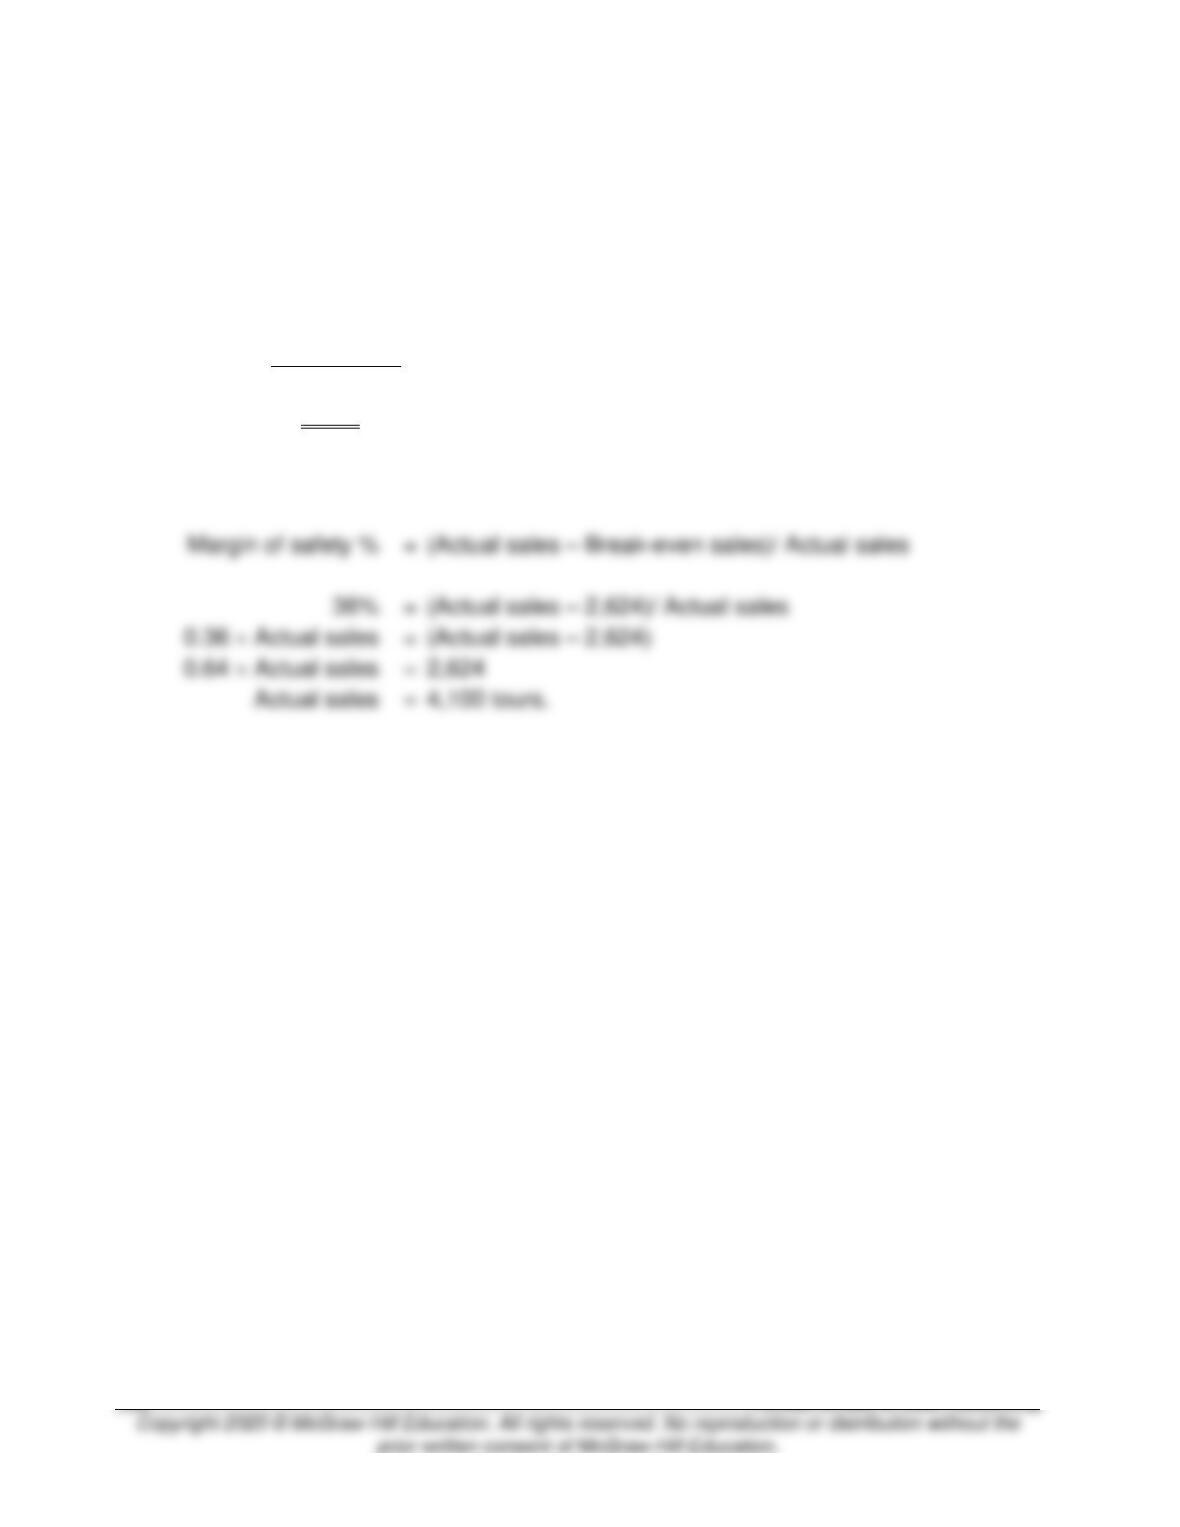
a. 5,000 parts.
Profit
=
(P – V)X – F
$0
=
($37 – $13)X – $120,000
$24X
=
$120,000
X =
$120,000
$24
X
=
5,000
parts
Margin of safety %
(Actual sales – Break-even sales)/ Actual sales
(Actual sales – 5,000)
5,000
6,250
3-39. (20 min.) CVP and Margin of Safety: Hamilton Tours.
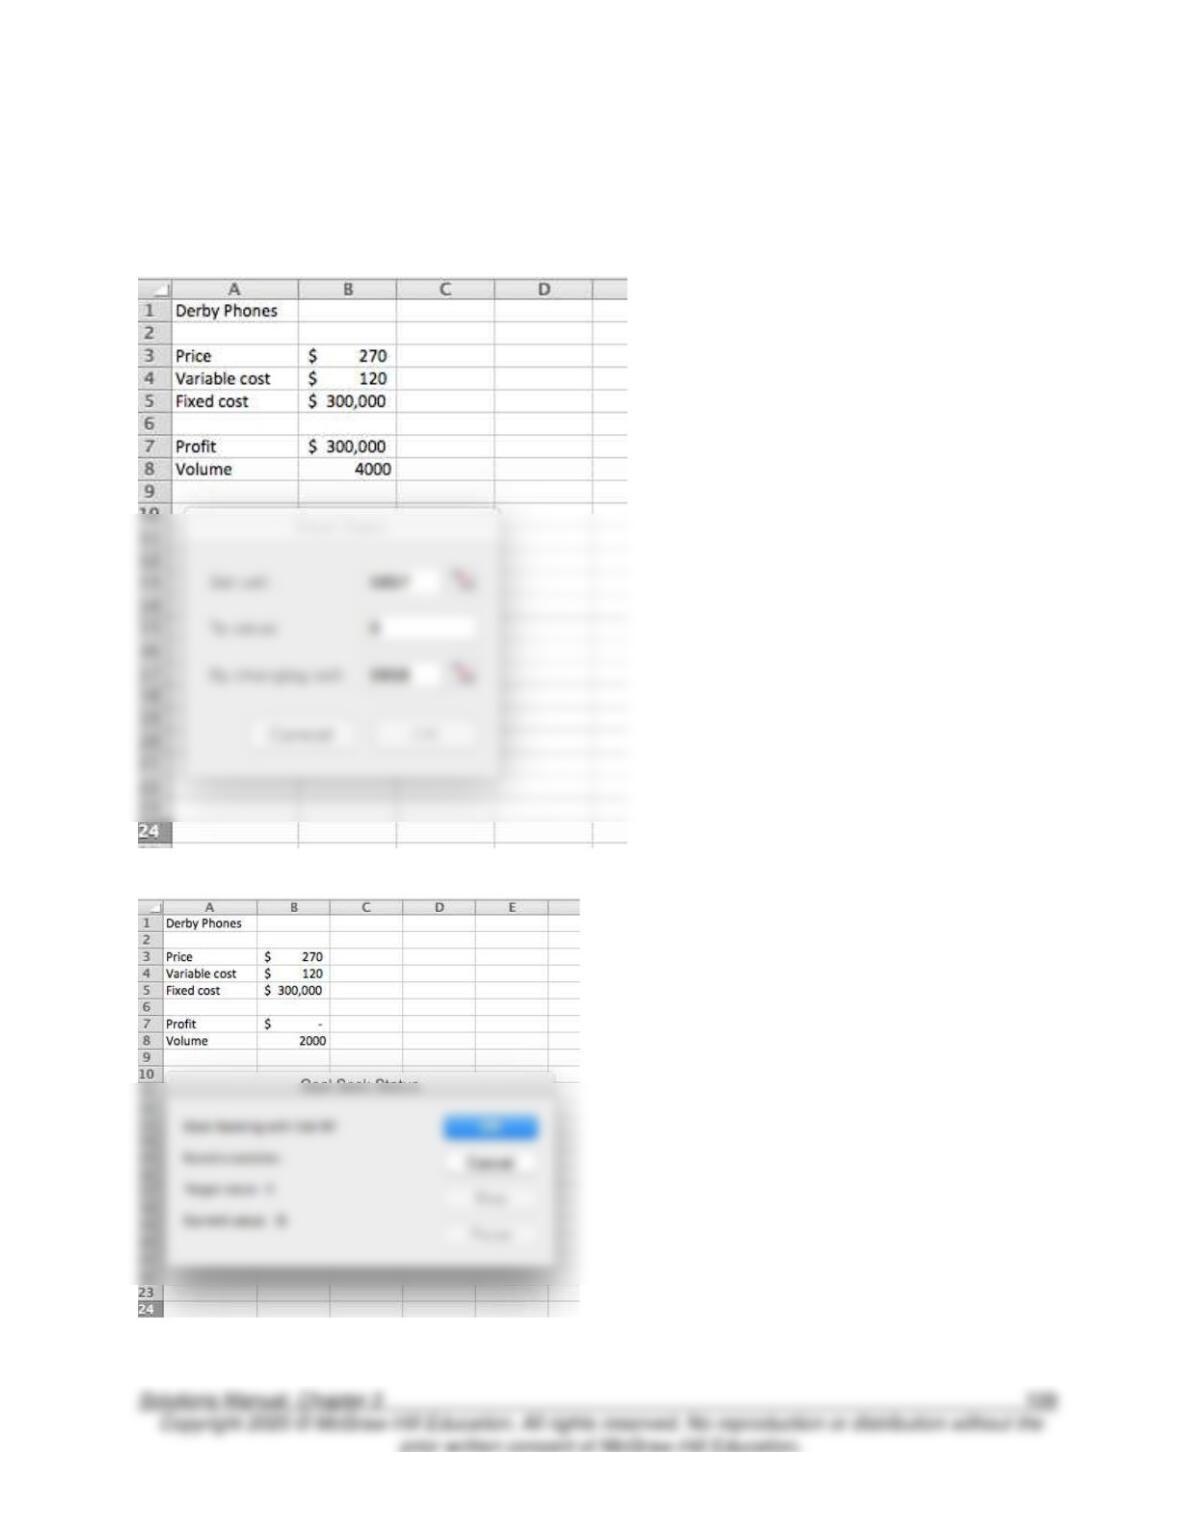
a. 2,624 tours.
Profit
=
(P – V)X – F
$0
=
($125 – $50)X – $196,800
$75X
=
$196,800
X =
$196,800
$75
X
=
2,624
tours
b. 4,100 parts.
(Actual sales – 2,624)/ Actual sales
2,624
4,100 tours.
3-40. (20 min.) Using Microsoft Excel to Perform CVP Analysis: Derby Phones.
a. 2,000 units.
The following two screenshots show the setup and solution.
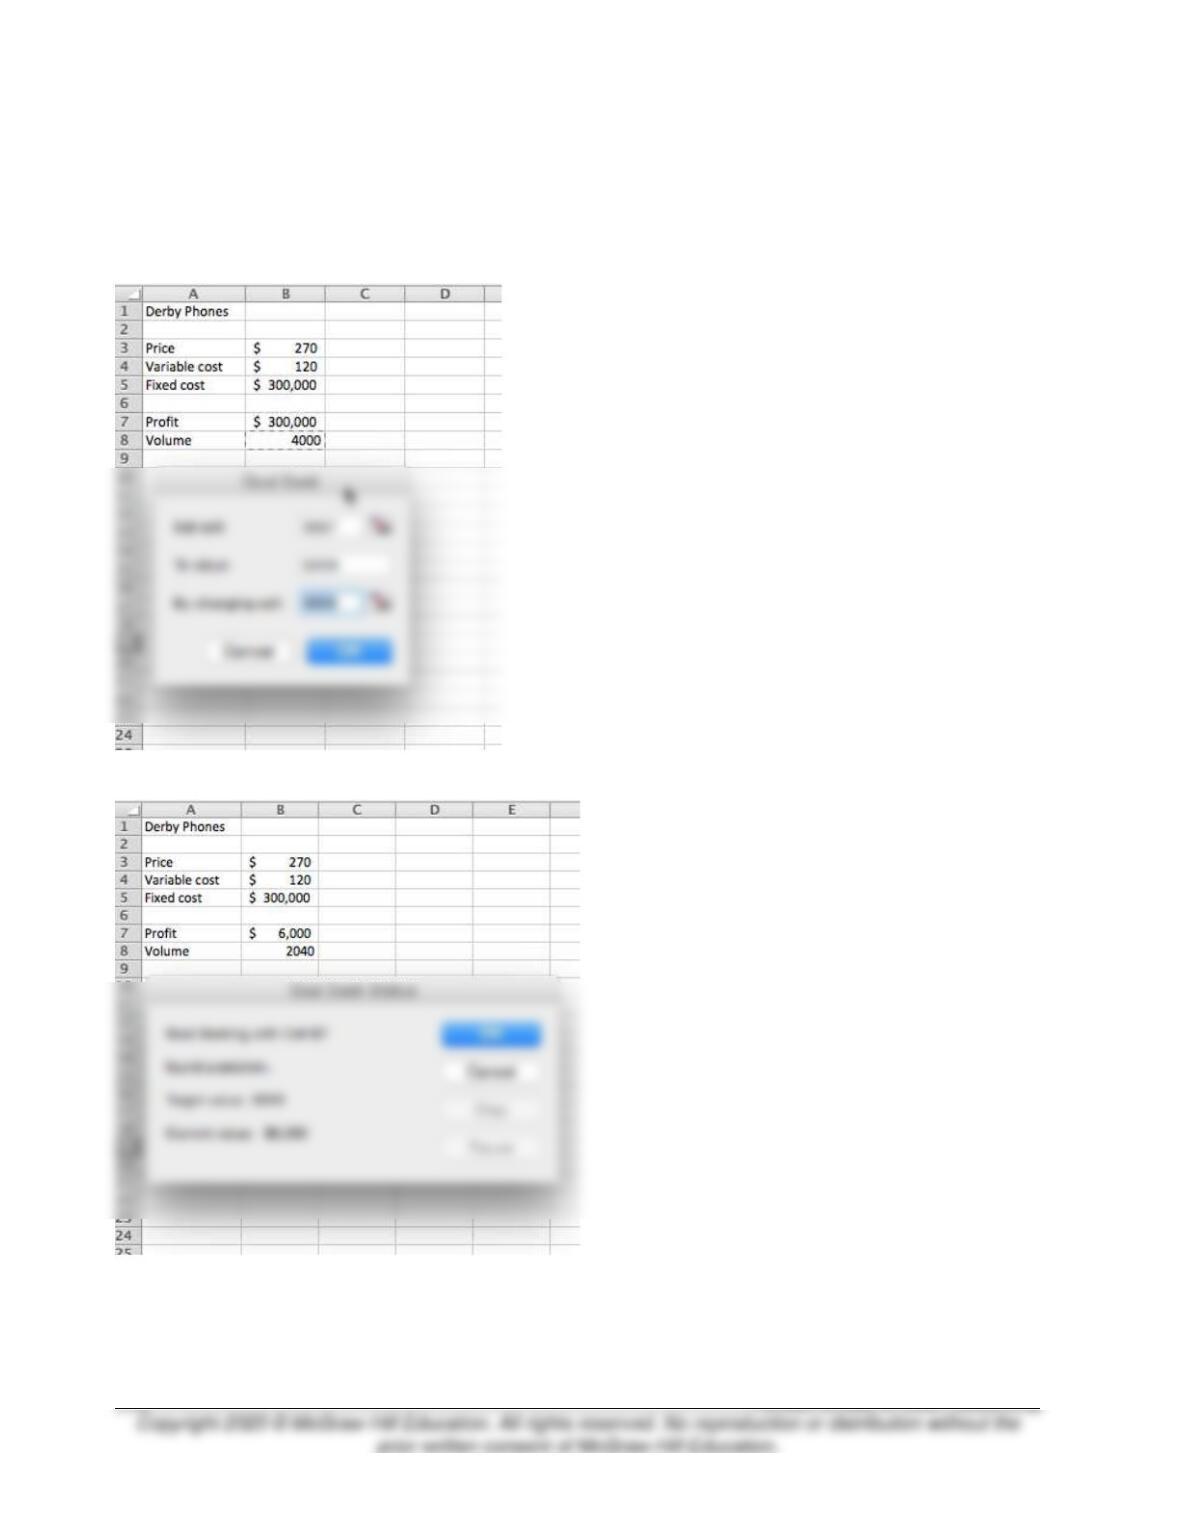
3-40 (continued).
b. 2,040 units.
The following two screenshots show the setup and solution.
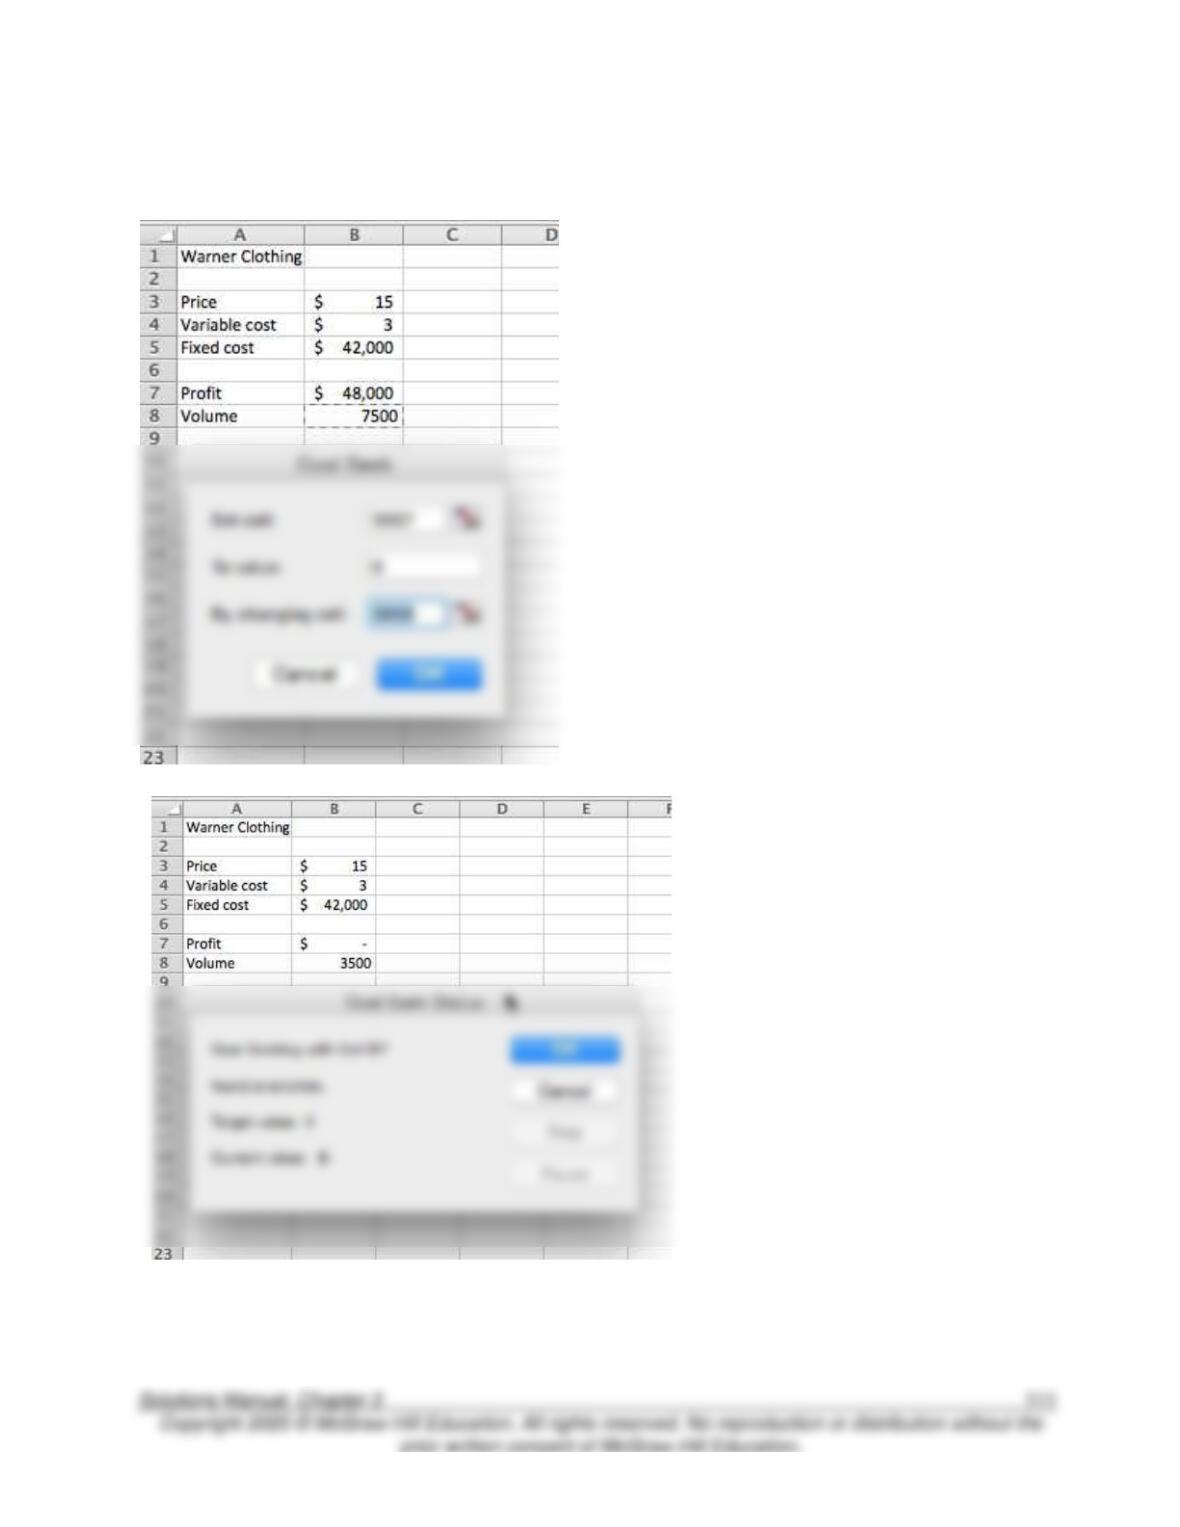
3-41. (20 min.) Using Microsoft Excel to Perform CVP Analysis: Warner Clothing.
a. 3,500 units.
The following two screenshots show the setup and solution.
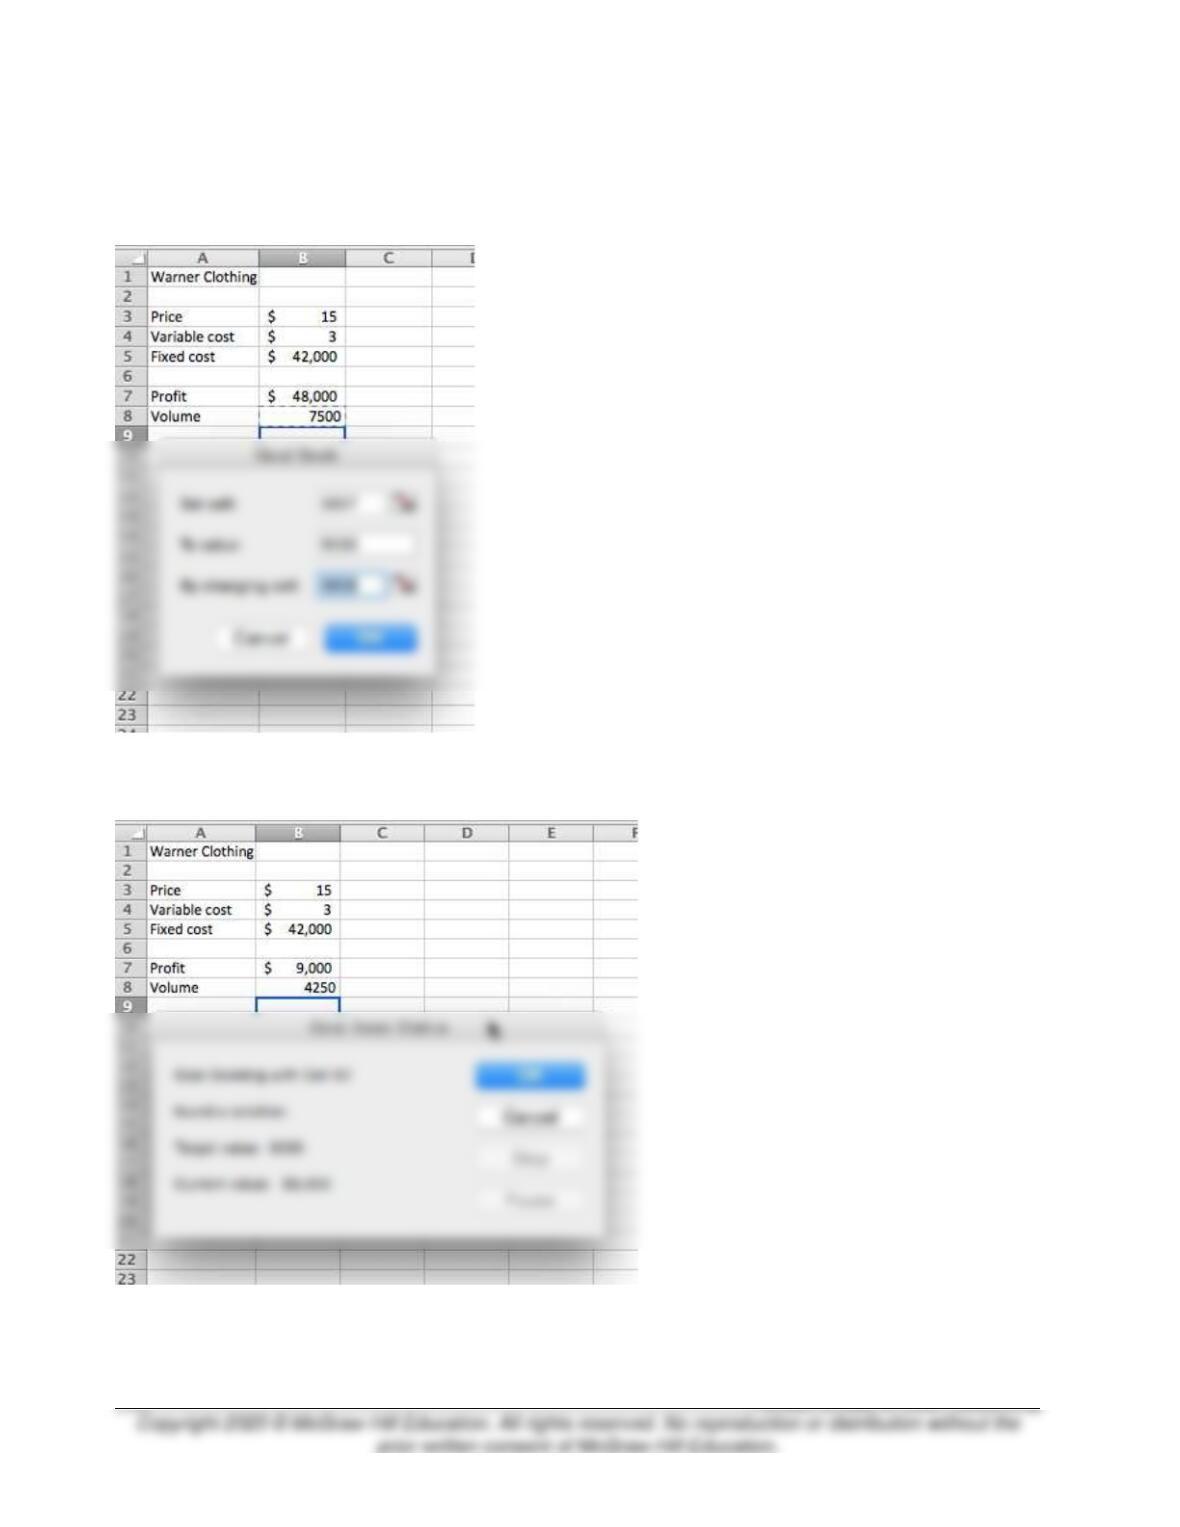
3-41 (continued).
b. 4,250 units.
The following two screenshots show the setup and solution.
3-42. (20 min.) CVP With Income Taxes: Hunter & Sons.
a.
Profit
=
(P – V)X – F
$0
=
($550 – $330)X – $143,000
X =
$143,000
$220
X
=
650
units
3-43. (20 min.) CVP With Income Taxes: Hammerhead Charters.
a.
Profit
=
(P – V)X – F
$0
=
($50 – $20)X – $6,000
X =
$6,000
$30
X
=
200
trips
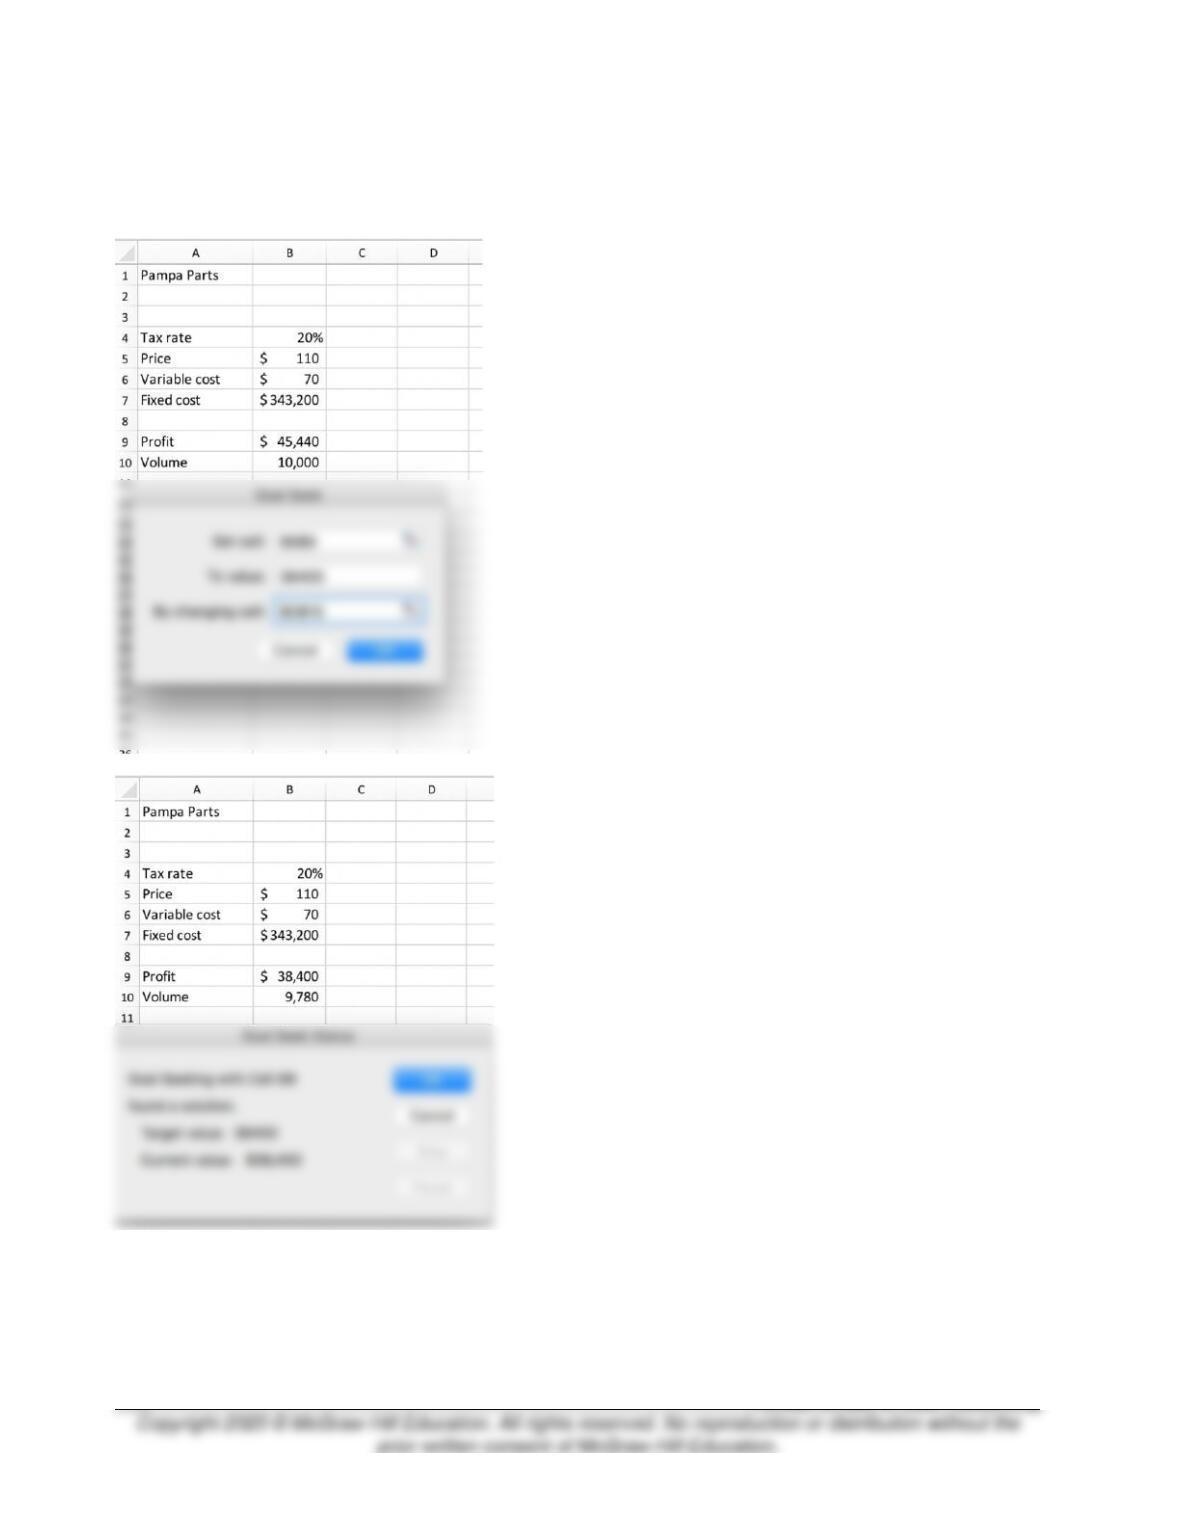
3-44. (15 min.) Using Microsoft Excel to Perform CVP Analysis with Taxes: Pampa
Parts.
9,780 units.
The following two screenshots show the setup and solution.