
6e Income Statement Page 77 Chapter 3
ACTIVITY 23 CROSSWORD PUZZLE FOR CHAPTER 3
Across
2. Statement of profit and loss or the P&L (2 words)
11. Cost of purchasing or manufacturing products sold
18. (Revenues and Gains) minus (Expenses and Losses)
(2 words)
Down
1. A high ratio indicates a low-cost, high-volume business
6. Results when the selling price is less than the book value
16. Income Statement reporting all amounts as a
percentage of revenue (2 words)
6e Income Statement Page 78 Chapter 3
ACTIVITY 24 THE MULTI–STEP INCOME STATEMENT
Purpose: • Identify the types of accounts presented on the income statement.
• Understand the organization of the multi-step income statement.
When amounts are requested, refer to the income statement of Apple, Inc. on the next page.
Revenues are inflows from a company’s primary operations. Expenses are the costs of bringing in
revenues. Cost of Goods Sold (COGS), also referred to as Cost of Sales, is the cost of purchasing or
manufacturing the actual products sold. It is an operating expense.
Q1 Sales revenue earned from the sale of Mac computers, iPods, iPhones, iPads, iTunes, and other
Operating expenses include all costs of generating sales besides COGS. Nonoperating revenues and
expenses affect income, but have little relevance to operations. These typically include financing
expenses, investment income, and gains and losses on the sale of assets other than inventory.
Provision for income tax is income tax expense based on the amount reported for income before income
tax. Nonrecurring items are gains and losses which accountants deem unusual and infrequent. They
include (D)iscontinued operations, and (E)xtraordinary items.
Identify each of the following as either a (D)iscontinued or (E)xtraordinary type of nonrecurring
reported at the bottom of the income statement.
6e Income Statement Page 79 Chapter 3
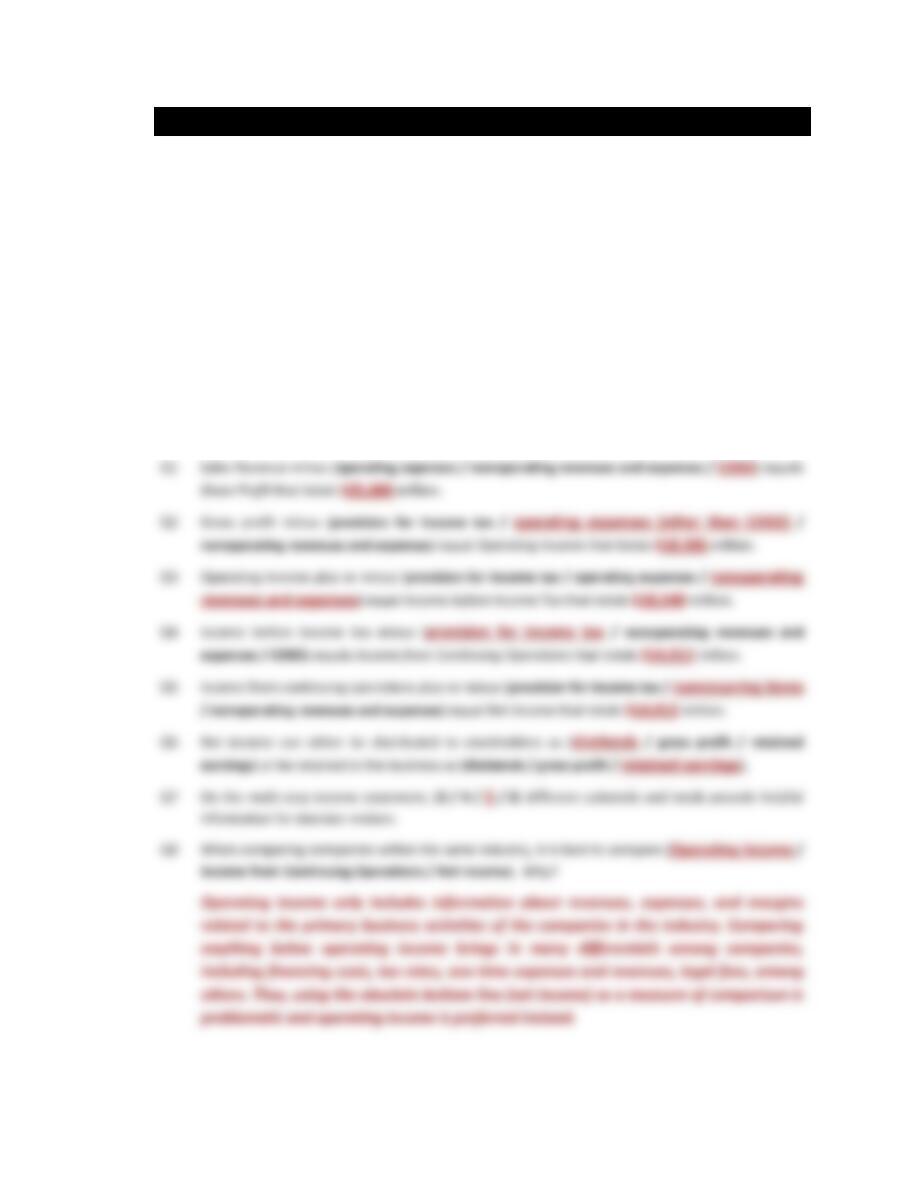
Apple Computer (AAPL)
INCOME STATEMENT
($ in millions)
Fiscal year ended (FYE)
9/25/2010
Sales revenue
$
65,225
Cost of goods sold (COGS)
39,541
Gross profit
25,684
Research and development expense (R&D)
$
1,782
Selling, general, administrative expense (SGA)
5,517
Depreciation and amortization expense
0
Other operating expenses
0
Total operating expenses
Operating Income
18,385
Interest income (expense)
0
Investment income (expense)
0
Gains (losses) on the sale of assets
0
Other revenues (expenses)
Total nonoperating revenues and expenses
Income before income tax
18,540
Provision for income tax
Income from continuing operations
14,013
Nonrecurring items
6e Income Statement Page 80 Chapter 3
ACTIVITY 25 MULTI–STEP SUBTOTALS AND TOTALS
Purpose: • Identify subtotals and totals on the multi-step income statement and how they are
computed.
• Understand the information presented by each multi-step subtotal and total.
Gross profit is the difference between sales revenue (inflows from a company’s primary operations) and
cost of sales (the cost of purchasing or manufacturing the actual products sold). It is the first indication of
profitability.
Operating income is gross profit less all operating expenses. It indicates how well a firm is managed.
Income before income tax indicates profitability from both operating and nonoperating activities.
Income from continuing operations indicates profitability from operating and nonoperating activities
including the impact of income tax.
Net income is all revenues and gains less all expenses and losses from operating, nonoperating, and
nonrecurring items. It is also referred to as earnings, the bottom line, or profit (loss).
When amounts are requested, refer to the income statement of Apple Computer for the fiscal year ended
on 9/25/2010 on the previous page.
6e Income Statement Page 81 Chapter 3
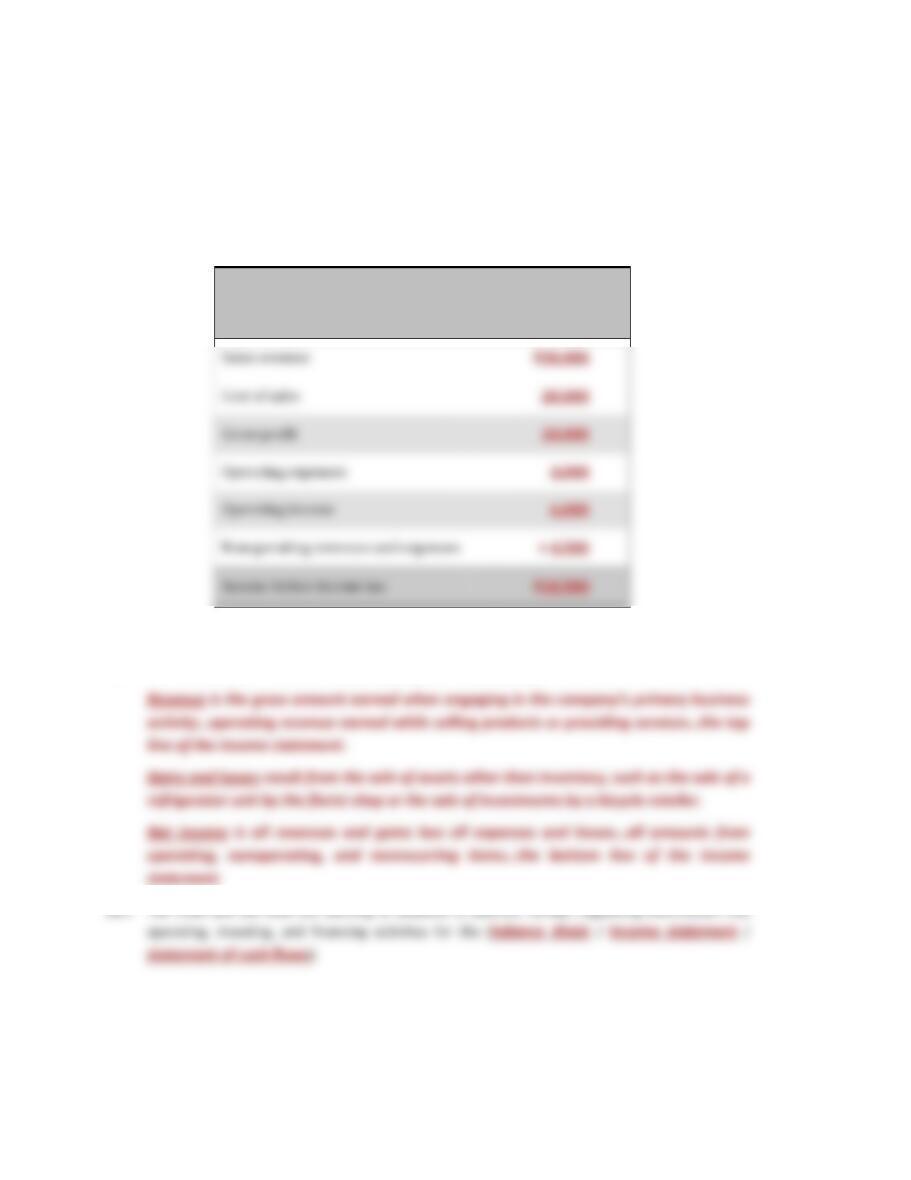
Q9 In this accounting period BLOOMIN’ FLOWERS, a florist shop, purchased flowers from a wholesaler
costing $24,000 and sold them to customers for $32,000. Wages and other operating expenses
total $3,000. Back in the year 2003, the company purchased land for $2,000 (that was never
utilized) and sold it during this accounting period for $6,000. Using these events, prepare the
income statement for Bloomin’ Flowers below.
Bloomin’ Flowers
INCOME STATEMENT
Q10 What is the difference between revenue, a gain, and net income?
6e Income Statement Page 82 Chapter 3
ACTIVITY 26 ACCRUAL ACCOUNTING AND GAAP
Purpose: • Understand accrual accounting and how it differs from cash accounting.
• Apply the Realization Concept and the Matching Concept.
GAAP requires companies to use accrual accounting to report revenues and expenses, which means that
companies must comply with the Revenue Recognition and Matching Principles described below.
GAAP #2: Accountants record revenue according to the Revenue Recognition Principle. This means
revenues are recorded in the period earned, not necessarily in the period that the company
collects the money. Revenues are typically earned when merchandise is delivered or when
services are provided.
Q1 On December 1, Year 1 RETAIL STORE sells a $1,500 computer. Customer Nancy pays $500 in cash
and signs an installment agreement for the remaining $1,000 to be paid the following year, Year 2.
GAAP #3: The Matching Principle requires accountants to record expenses in the period they help to
generate revenues. Therefore:
1) If there is an associated cause and effect, report the expense in the same period as the
revenues it helped to generate. Examples include cost of goods sold and commissions.
2) If no association can be found, then expense immediately. Examples include advertising,
utility, and administrative expenses.
3) If neither (1) nor (2) apply, then use a systematic and rational allocation method if you
can. Examples include depreciation and amortization.
Q2 In this accounting period, CYCLES GALORE purchased 10 bicycles for $200 each at wholesale and
sold 6 bicycles for $500 each to customers. On the income statement of CYCLES GALORE, how
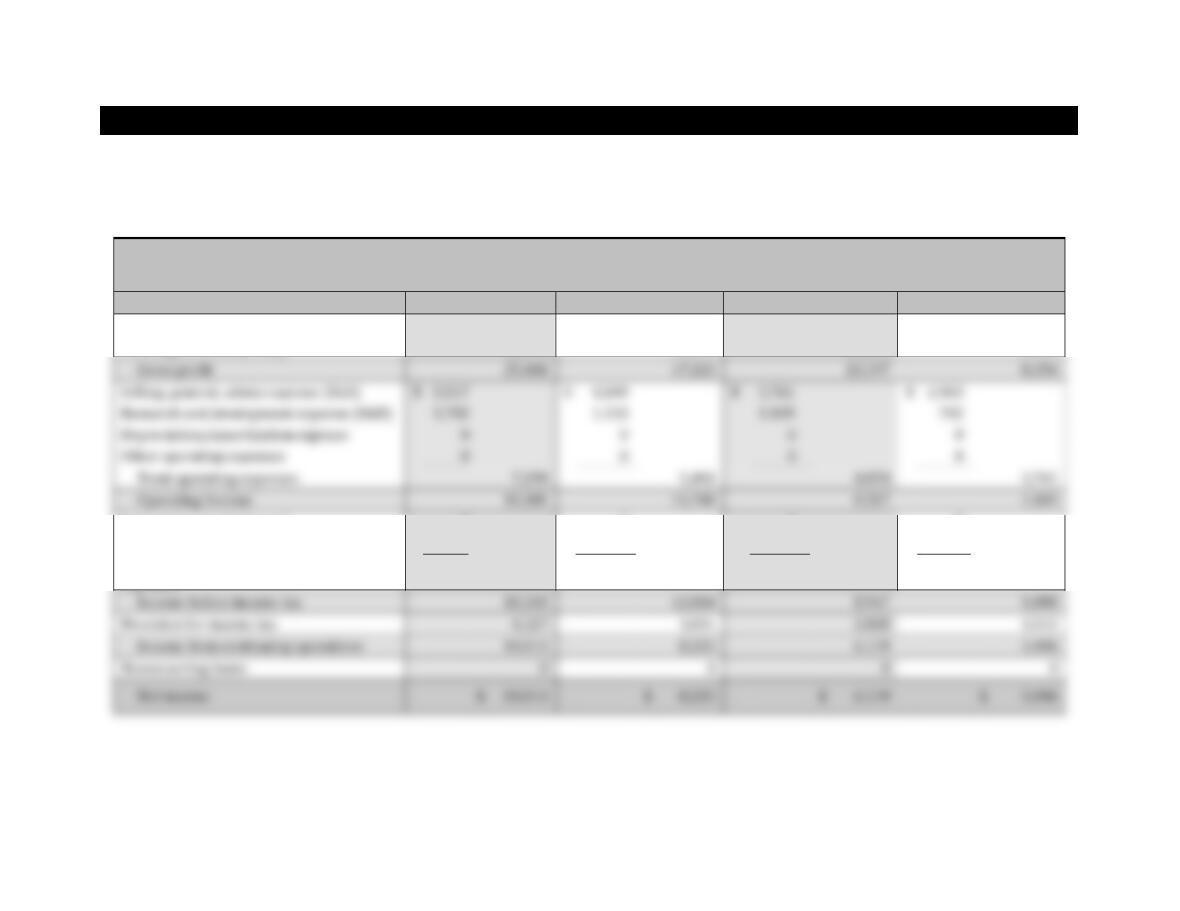
Q3 Kiger Kayaking, a sporting goods retailer, began operations on August 1 with the following
transactions during the first month of operation. Compute August net income (using accrual-based
accounting) and the August 31 cash balance.
Accrual
Cash
6e Income Statement Page 83 Chapter 3
ACTIVITY 27 A SERIES OF MULTI–STEP INCOME STATEMENTS
Purpose: • Understand the relationship between the trend of revenue and the trends of other income statement accounts.
• Interpret the meaning of increases and decreases in the various income statement accounts.
• Identify the meaning of parentheses reported on financial statements.
• Develop strategies for analyzing the income statement.
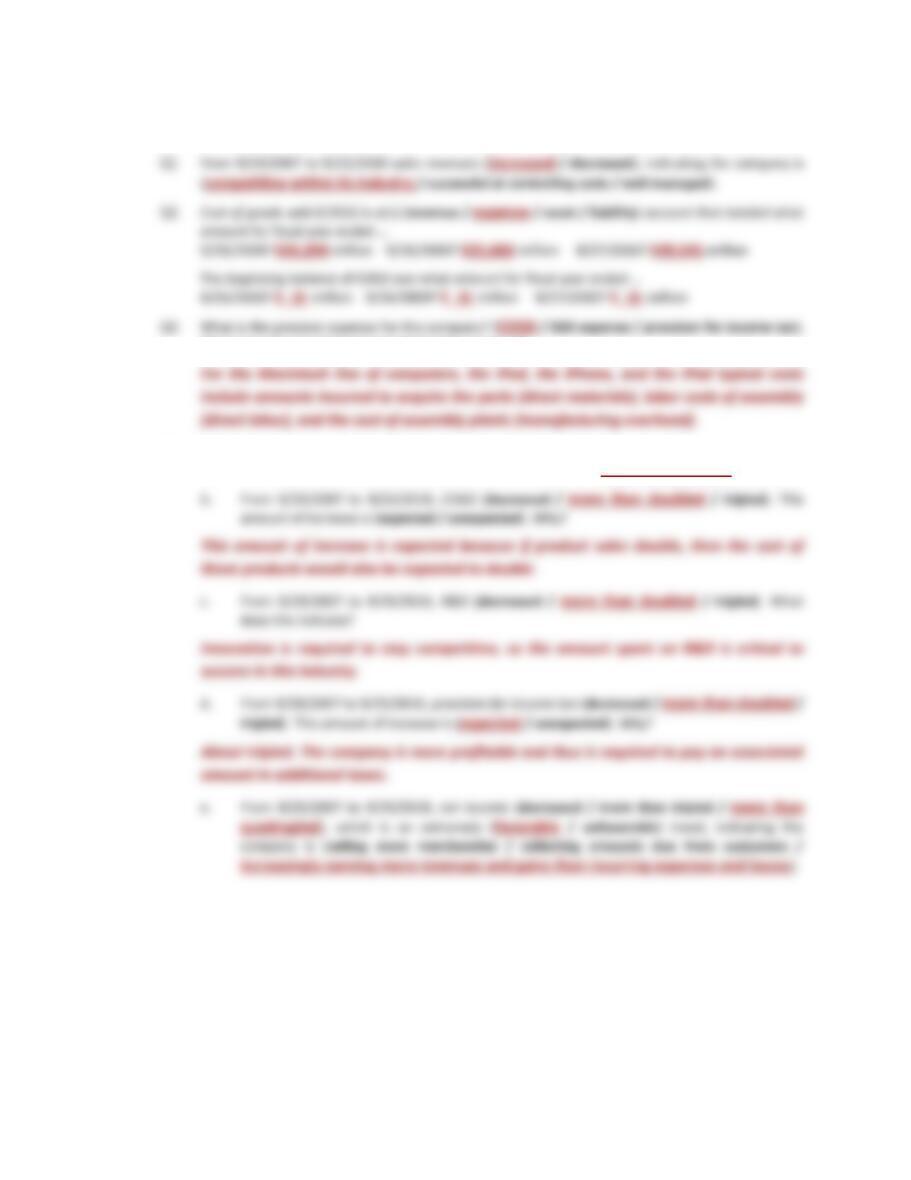
APPLE (AAPL) INCOME STATEMENT ($ in millions)
Fiscal year ended (FYE)
9/25/2010
09/26/2009
09/27/2008
09/29/2007
Sales revenue
$
65,225
$
42,905
$
37,491
$
24,006
Cost of goods sold (COGS)
39,541
25,683
24,294
15,852
Interest income (expense)
0
0
0
0
Other revenues (expenses)
155
326
620
599
Total nonoperating revenues and
expenses
+ 155
+ 326
+ 620
+ 599
Income before income tax
18,540
12,066
Provision for income tax
Income from continuing operations
Selling, general, admin expense (SGA)
$
$
$
$
Research and development expense (R&D)
782
Depreciation/amortization expense
0
0
0
0
Other operating expenses
0
0
0
0
Total operating expenses
Operating Income
18,385
11,740
6e Income Statement Page 84 Chapter 3
When amounts are requested, refer to the series of income statements of Apple Computer presented on
the previous page.
What typical costs might be included in this expense?
Q4 Let’s compare some trends in the data:
a. From 9/29/2007 to 9/25/2010, Sales Revenue (decreased / more than doubled / tripled).
6e Income Statement Page 85 Chapter 3
Q5 When preparing financial statements, use the following rules for placing parentheses.
• Accounts that are typically added or that can either be added or subtracted to compute
net income … use no parentheses when added and parentheses when subtracted.
• Accounts that are typically subtracted to compute net income … use no parentheses
when subtracted and parentheses when added. A minus sign may be used instead of
parentheses.
Q6 Develop a strategy to evaluate the income statement. Which line of the income statement would
you look at first? Second? Third? Why?
Answers will vary. One possible response is:
6e Income Statement Page 86 Chapter 3
ACTIVITY 28 ANALYSIS: RATIOS
Purpose: • Understand the information provided by profitability ratios.
• Understand that an increasing trend is preferred for profitability ratios.
• Understand that the expected range of ratios varies by industry.
• Understand that comparing a ratio to industry norms enhances meaning.
• Understand that reviewing a number of ratios helps to provide an overall impression
of profitability.
The three types of analysis are Ratio Analysis, Trend Analysis (horizontal analysis), and Common-Size
Statement Analysis (vertical analysis). Analysis reveals relationships by comparing amounts to:
(a) Other amounts for the same period (ratios and common–size statements),
(b) The same information from a prior period (trend analysis),
(c) Competitor information, and industry norms.
RATIOS
Profitability Ratios measure the ability to generate profits; the overall performance of a firm. A higher
ratio indicates greater profitability. See Appendix B—Ratios for additional profitability ratios.
Return on Sales (ROS) measures the profitability from each dollar of revenue. It expresses net
income as a percentage of revenue. This ratio is also referred to as Net Profit Margin.
ROS
=
Net income
Sales revenue
Asset Turnover
=
Sales revenue
Total assets
Net income
=
Gross profit
Sales revenue
6e Income Statement Page 87 Chapter 3
Q1 Use the information below for J.C. Penney and Intel to answer the following questions.
FYE 2010 ($ in millions)
J.C. Penney Corp
(JCP)
Intel
(INTC)
greater than revenue for JCP, whereas net income for INTC is approximately
b. Examine the relationship between Sales Revenue and Net Income.
Q2 Let’s examine three companies within the Personal Computer Systems industry. Use the chart
below to answer the following questions. Stock symbols are shown in parentheses.
Personal Computer Systems
Industry
FYE 2011
Industry
Average
Apple
Computer
(AAPL)
DELL
(DELL)
Hewlett
Packard
(HPQ)
Return on Sales (ROS)
12.1%
29.54%
5.67%
7.61%
Asset Turnover (Asset TO)
Return on Assets (ROA)
24.2%
25.75%
7.84%
Gross Profit Margin (GP%)
37.3%
39.30%
18.84%
22.3%
c. Companies invest in assets to generate additional revenue, to increase net income. AAPL
Sales revenue
Expense
Net income
ROS