32 CHAPTER 3/PROBABILITY
3.78 We know that
3.79 RR=Pr(B|A)/Pr(B|A
ࡄ). Here, B={Clearance} and A={Amoxicillin}
Tabulated statistics: Antibo, Clear
Rows: Antibo Columns: Clear
0 1 All
Results for Bilateral = 0
Rows: Antibo Columns: Clear
0 1 All
Results for Bilateral = 1
Rows: Antibo Columns: Clear
0 1 All
PV P
r
Pr DBP DBP
t t
true test
manual 10 mm Hg automated 10 mm Hg
”
CHAPTER 3/PROBABILITY 33
3.80 Yes, age appears to be an important factor in determining clearance of OM. In general, older children have
greater clearance rates. We have not explicitly discussed relative risk when more than 2 levels are present.
Tabulated statistics: Age, Clear
Rows: Age Columns: Clear
0 1 All
3.81 Here, we set B={Clearance} and A={Amoxicillin}, and calculate RR = Pr(B|A)/Pr(B|A
ࡄ) separately for each
age level.
3.82 If we create separate variables Clear_1 and Clear_2 representing clearance for ear 1 and ear 2, respectively,
Results for Bilateral = 1
34 CHAPTER 3/PROBABILITY
3.85 Predictive value positive
3.86 A false negative is a woman who tests negative, but is actually pregnant.
Thus, the total misclassification cost per woman
We can evaluate the total cost for the new and standard test as follows:
Test Sensitivity Specificity Cost
N
ew .95 .99
u
u
u
PV
p
revalence sensitivity
prevalence sensitivity prevalence specificity11
c .2 .05 .9 .01 .019c
CHAPTER 3/PROBABILITY 35
3.89 We have the following table of sensitivities and specificities according to the cutoff point used
Cutoff point for dementia sensitivity specificity
< 0 0 1.0
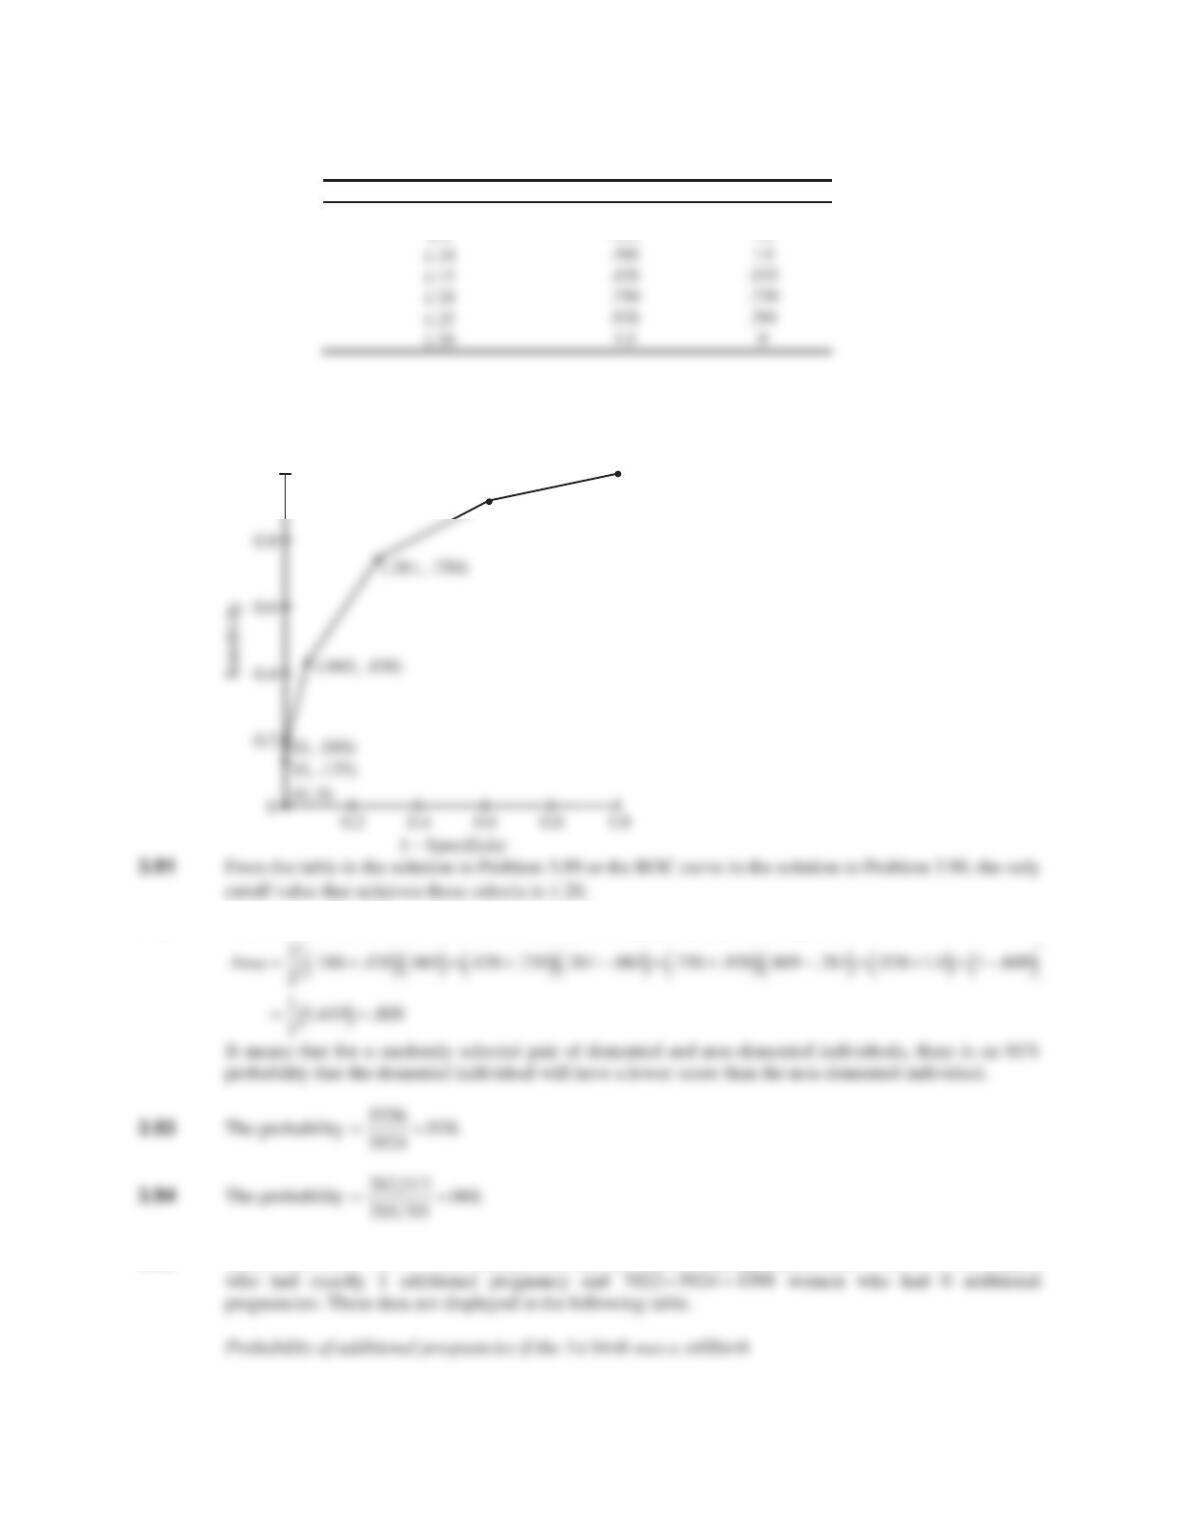
3.90 The ROC curve is a plot of sensitivity vs 1-specificity for different cutoff values. This is shown below.
3.92 The area under the ROC curve is evaluated by the trapezoidal rule, which gives
3.95 There were women who had 2 additional pregnancies, women
1.0
(1.0, 1.0)
(.609, .938)
3916 277 4193 5924 4193 1731
36 CHAPTER 3/PROBABILITY
Number of additional pregnancies n
0 1098 15.6
3.96 If the first birth was a live birth, then women had 2 additional pregnancies,
3.100 If we consider a subject as test – if they either have a clinical diagnosis of other causes of dementia or
have no 4APOE allele then
3.102 The expected proportion of Hispanic men who will be identified as having a prior heart attack in the past
2 444 79 450 81894,,,
CHAPTER 3/PROBABILITY 37
3.106 We use Bayes’ Theorem. Let C = (dominant with complete penetrance) and A = {2 out of 2 offspring
3.107 We let D = {3rd child is affected}. From the total probability rule,
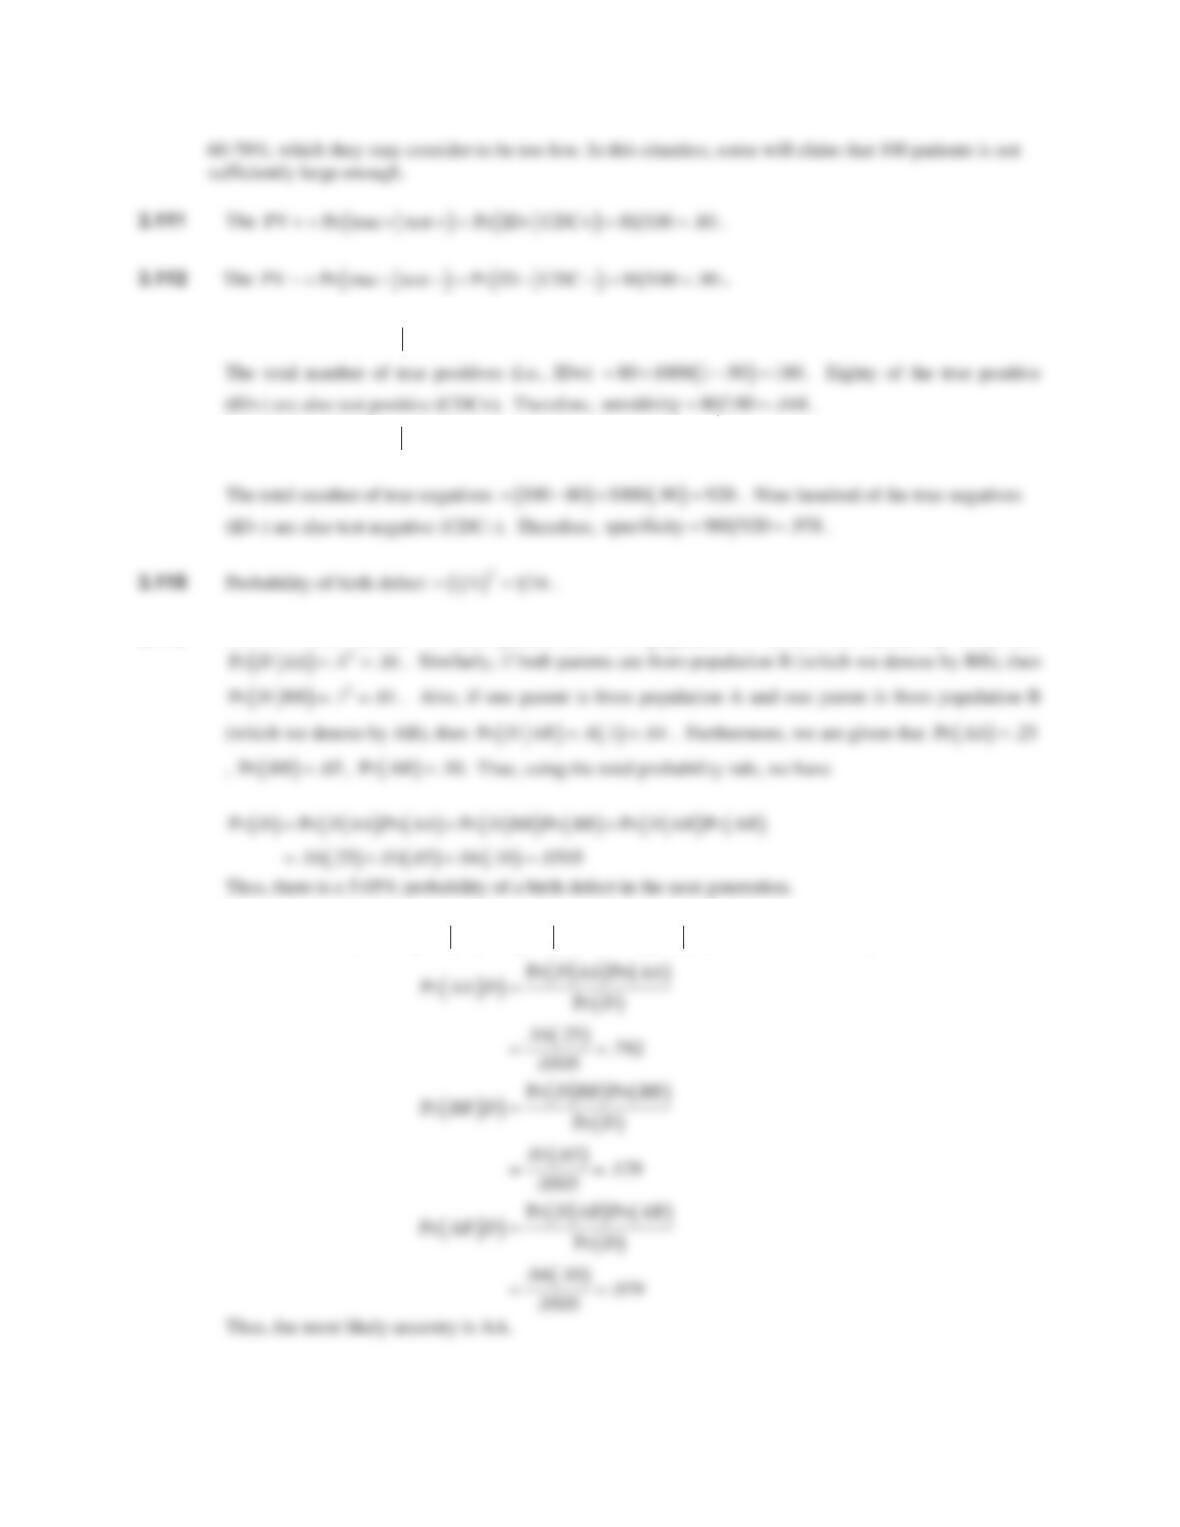
3.108 Example: In this data set, 4 of the 20 trials had at least 88 successes. This would indicate power of 20%.
Given a larger number of trials, we expect a power of ~25%, but in this example, students could observe
anywhere from 1 to 10 “successful” trials, yielding an “observed power” of 5%-50%
Variable Sum
Trial 1 80.0000
Trial 2 83.0000
3.109 True power for these settings are a) 2.5%, b) 80%, and c) 99.9%
Again, due to the small number of trials, the expected range for observed successful trials is
3.110 Example, using observed values 0,4,17, and 20.
38 CHAPTER 3/PROBABILITY
3.113
Sensitivity Pr test + true + .
3.114
Specificity Pr test true
.
3.116 Let D = birth defect. If both parents are from population A (which we denote by AA), then
3.117 We need to compute
Pr AA D ,
Pr BB D and
Pr AB D . We have from Bayes’ Theorem that
CHAPTER 3/PROBABILITY 39
3.120 We have the following table of sensitivities and specificities according to the cutpoint chosen for the
VAS.
test positive sensitivity specificity 1-specificity
VAS 0t 22 22 1.0 038 0.0 38 38 1.0
The ROC curve appears as indicated in the figure.
3.121 The area under the ROC curve
1
¬
3.124 Let B = breast cancer and E = serum estradiol 20tpg/ml. We wish to compute
Pr BE . We use
Bayes’ rule as follows:
40 CHAPTER 3/PROBABILITY
3.126 The expected CHD mortality rates in 2011 by gender and location are as follows:
Gender Location mortality rate per 105
3.127 P(CHD death) = 189.4/105 in 2011.
3.128 We use the total probability rule. Let B = breast cancer, A1 = age group 50-54, A2 = age group 55-59, A3 =
1
0
1
0
3.129 We have:
CHAPTER 3/PROBABILITY 41
3.131 Let X = number of women with breast cancer and n = 100 the total number of women who are age 55 in the
year 1995. For each woman, the probability of developing breast cancer is p = 422/105. Hence,
P
r
(
X
0
)
P
(
no wo
m
an has
b
r
eas
t
cance
r
)
3.132 We have:
3.133 We have:
3.134 We wish to compute:
Pr(LCD + Ipad +) = Pr(LCD + Ipad +)
Pr(Ipad +)
42 CHAPTER 3/PROBABILITY
3.140 Since the AAI test is not perfect, we can imagine that some patients with a true AAI value < 1.0 were
3.143-3.144
D M N Saliva+ (Estimated) Saliva – (Estimated)
+ + 6685 6685(0.97) =
6685(0.03)=