An asterisk (*) will appear to the right of an incorrect entry. The essay answer will not be graded.
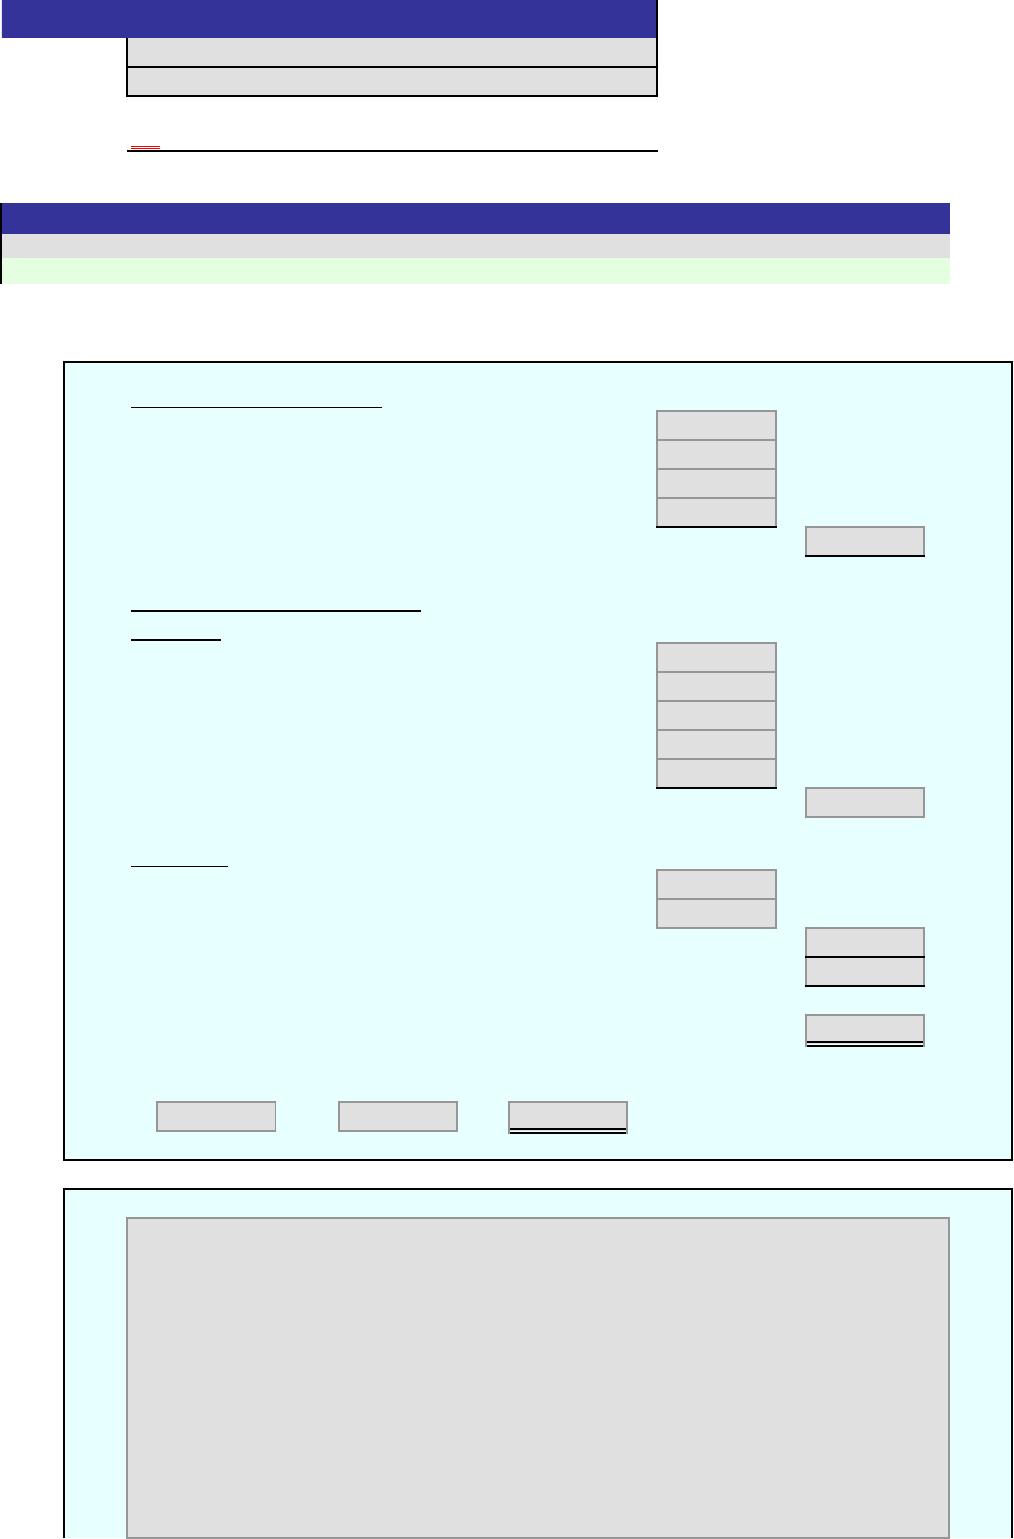
1.
Value-added time (minutes):
Assembly of PC board
Stereo assembly
Time to test one unit
Pack and label
Total
Non-value-added time (minutes):
Wait time:
Within-batch wait time – PC board assembly
Within-batch wait time – final assembly
Within-batch wait time – testing
Within batch wait time – shipping
Test setup
Total wait time
Move time:
Move from PC board assembly to final assembly
Move from final assembly to testing
Total move time
Total non-value-added time
Total lead time (minutes)
Value-Added Time / Total Time = Value-Added Ratio
2.
[Key essay answer here]
[Key code here]
Answers are entered in the cells with gray backgrounds.
Score:
Key Code:
Instructions
Cells with non-gray backgrounds are protected and cannot be edited.
0%
Problem 27(12)-2A
Name:
Section:
An asterisk (*) will appear to the right of an incorrect entry. The essay answer will not be graded.
1.
Value-added time (minutes):
Assembly of PC board 5
Stereo assembly 15
Non-value-added time (minutes):
Wait time:
Within-batch wait time – PC board assembly 220
Within-batch wait time – final assembly 660
Move time:
Move from PC board assembly to final assembly 10
Move from final assembly to testing 20
2.
Cells with non-gray backgrounds are protected and cannot be edited.
The existing process is very wasteful. The company could improve the process by changing
the layout from a process orientation to a product orientation. Each stereo model could be
formed into a production cell. Each cell would have PC board assembly, final assembly, and
shipping next to each other. In this way, the batch sizes could be reduced significantly.
Score:
Instructions
Answers are entered in the cells with gray backgrounds.
ON
Problem 27(12)-2A
Name:
Solution
Section:
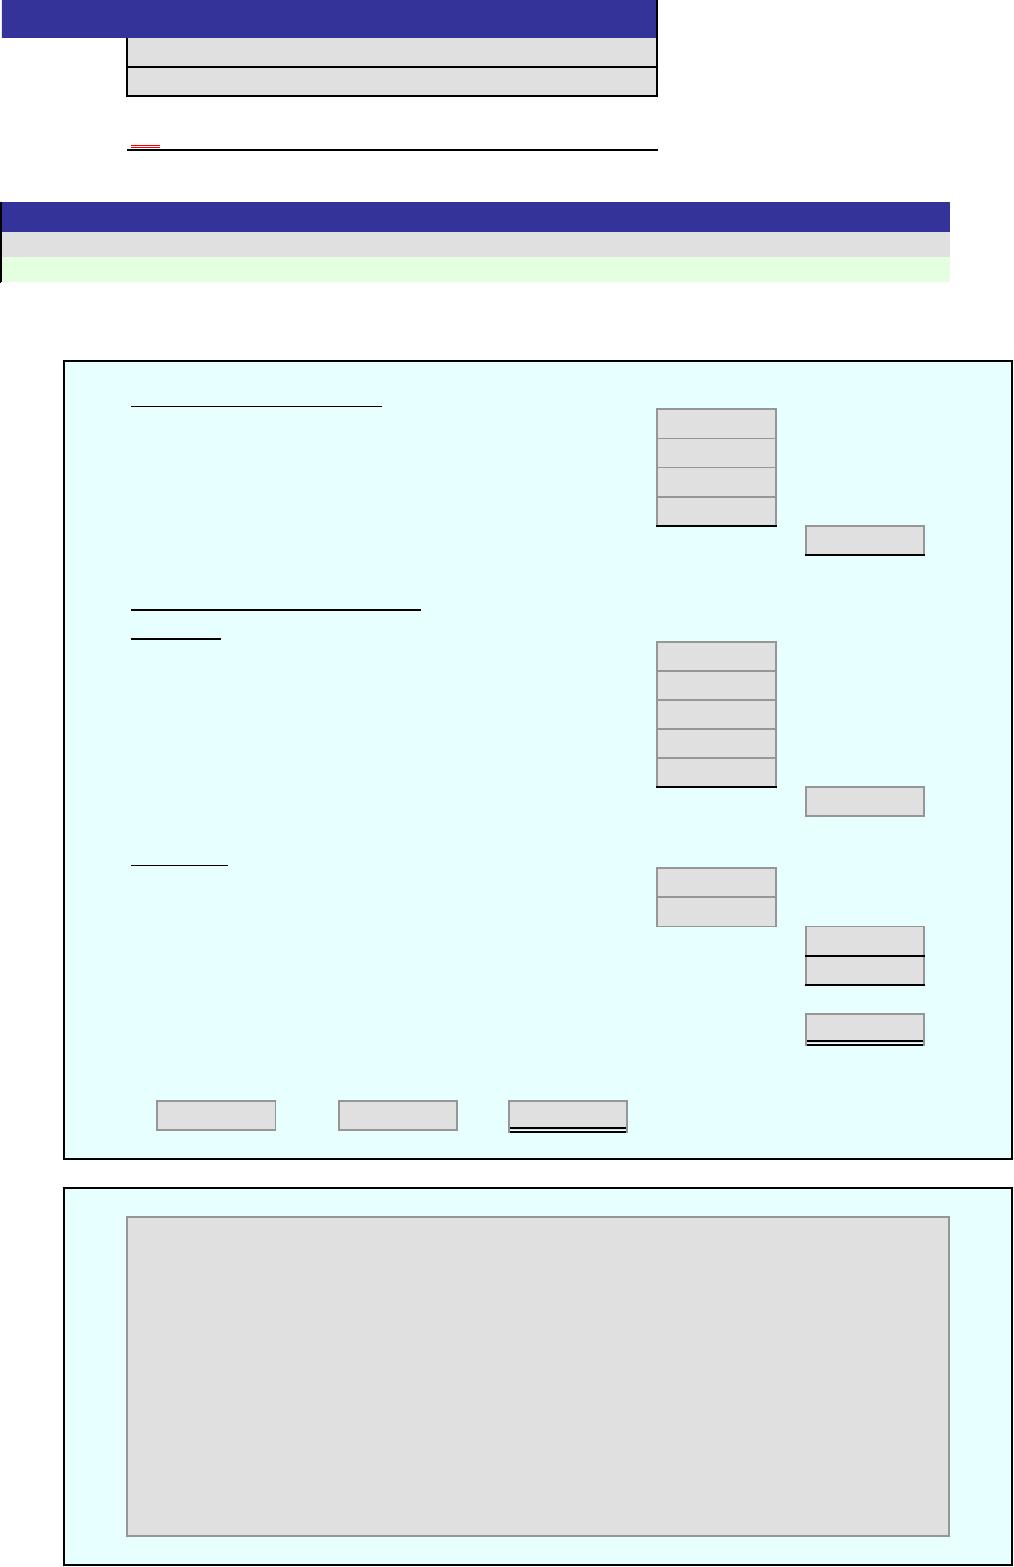
An asterisk (*) will appear to the right of an incorrect entry. The essay answer will not be graded.
1.
Value-added time (minutes):
Stamping
Appliance assembly
Time to test one unit
Pack and label
Total
Non-value-added time (minutes):
Wait time:
Within-batch wait time – stamping
Within-batch wait time – final assembly
Within-batch wait time – testing
Within batch wait time – shipping
Stamping setup
Total wait time
Move time:
Move from stamping to final assembly
Move from final assembly to testing
Total move time
Total non-value-added time
Total lead time (minutes)
Value-Added Time / Total Time = Value-Added Ratio
2.
[Key essay answer here]
[Key code here]
Answers are entered in the cells with gray backgrounds.
Score:
Key Code:
Instructions
Cells with non-gray backgrounds are protected and cannot be edited.
0%
Problem 27(12)-2B
Name:
Section:
An asterisk (*) will appear to the right of an incorrect entry. The essay answer will not be graded.
1.
Value-added time (minutes):
Stamping 5
Non-value-added time (minutes):
Wait time:
Within-batch wait time – stamping 195
Within-batch wait time – final assembly 858
Move time:
2.
Cells with non-gray backgrounds are protected and cannot be edited.
The existing process is very wasteful. The company could improve the process by changing
the layout from a process orientation to a product orientation. Each appliance model could
be formed into a production cell. Each cell would have stamping, final assembly, and
Score:
Instructions
Answers are entered in the cells with gray backgrounds.
Problem 27(12)-2B
Name:
Solution
Section:
ON
An asterisk (*) will appear to the right of an incorrect entry. The essay answer will not be graded.
1.
Budgeted cell conversion cost rate:
Total Conversion Cost / Planned Production Hours = Rate per Hour
2.
Budgeted cell conversion cost per unit
Rate per Hour Time = Cost per Unit
3. Debit Credit
a.
b.
c.
d.
4.
Ending balances:
Raw and In Process Inventory
Finished Goods Inventory
5.
[Key essay answer here]
0%
[Key code here]
Answers are entered in the cells with gray backgrounds.
Score:
Key Code:
Instructions
Account
Cells with non-gray backgrounds are protected and cannot be edited.
Problem 27(12)-3A
Name:
Section:
An asterisk (*) will appear to the right of an incorrect entry. The essay answer will not be graded.
1.
Budgeted cell conversion cost rate:
Total Conversion Cost / Planned Production Hours = Rate per Hour
$660,000 2,200 $300.00
2.
Budgeted cell conversion cost per unit
Rate per Hour Time = Cost per Unit
$300 0.250 $75.00
3. Debit Credit
a. 1,620,000
1,620,000
4.
Ending balances:
Raw and In Process Inventory $74,250
5.
Lean accounting is different from traditional accounting in a number of respects. Most importantly, lean
accounting is simplified and uses minimal control. As a result, the number of transactions are reduced,
and the control intervals between adjacent work in process transaction points are widened. In many
these costs do not need to be allocated, since they are included directly in the cell’s conversion cost.
Problem 27(12)-3A
Name:
Solution
Section:
Raw and In Process Inventory
Accounts Payable
Score:
Instructions
Answers are entered in the cells with gray backgrounds.
ON
Key Code:
Account
Cells with non-gray backgrounds are protected and cannot be edited.
Conversion Costs
Finished Goods Inventory
Raw and In Process Inventory
Accounts Receivable
Finished Goods Inventory
Cost of Goods Sold
Raw and In Process Inventory

“raw and in process inventory” account. Direct labor is frequently eliminated as a cost category and is
An asterisk (*) will appear to the right of an incorrect entry. The essay answer will not be graded.
1.
Budgeted cell conversion cost rate:
Total Conversion Cost / Planned Production Hours = Rate per Hour
2.
Budgeted cell conversion cost per unit:
Rate per Hour Time = Cost per Unit
3. Debit Credit
a.
b.
c.
d.
4.
Ending balances:
Raw and In Process Inventory
Finished Goods Inventory
5.
[Key code here]
Answers are entered in the cells with gray backgrounds.
Problem 27(12)-3B
Name:
Section:
Score:
Key Code:
Instructions
Account
Cells with non-gray backgrounds are protected and cannot be edited.
0%
[Key essay answer here]
An asterisk (*) will appear to the right of an incorrect entry. The essay answer will not be graded.
1.
Budgeted cell conversion cost rate:
Total Conversion Cost / Planned Production Hours = Rate per Hour
$189,000 2,100 $90.00
2.
Conversion Costs
Finished Goods Inventory
Raw and In Process Inventory
Accounts Receivable
Finished Goods Inventory
Cost of Goods Sold
Budgeted cell conversion cost per unit:
3. Debit Credit
a. 1,979,500
1,979,500
b. 189,000
4.
Ending balances:
Raw and In Process Inventory $97,900
5.
Accounts Payable
Score:
Instructions
Answers are entered in the cells with gray backgrounds.
ON
Account
Cells with non-gray backgrounds are protected and cannot be edited.
Problem 27(12)-3B
Name:
Solution
Section:
Raw and In Process Inventory
Raw and In Process Inventory
Lean accounting is different from traditional accounting in a number of respects. Most importantly, lean
accounting is simplified and uses minimal control. As a result, the number of transactions is reduced,
result, these costs do not need to be allocated, since they are included directly in the cell’s conversion

“raw and in process inventory” account. Direct labor is frequently eliminated as a cost category and is
instead included as a conversion cost of the cell. The cell conversion cost is also applied to the raw
An asterisk (*) will appear to the right of an incorrect entry. The essay answer will not be graded.
Enter a zero in cells you would otherwise leave blank.
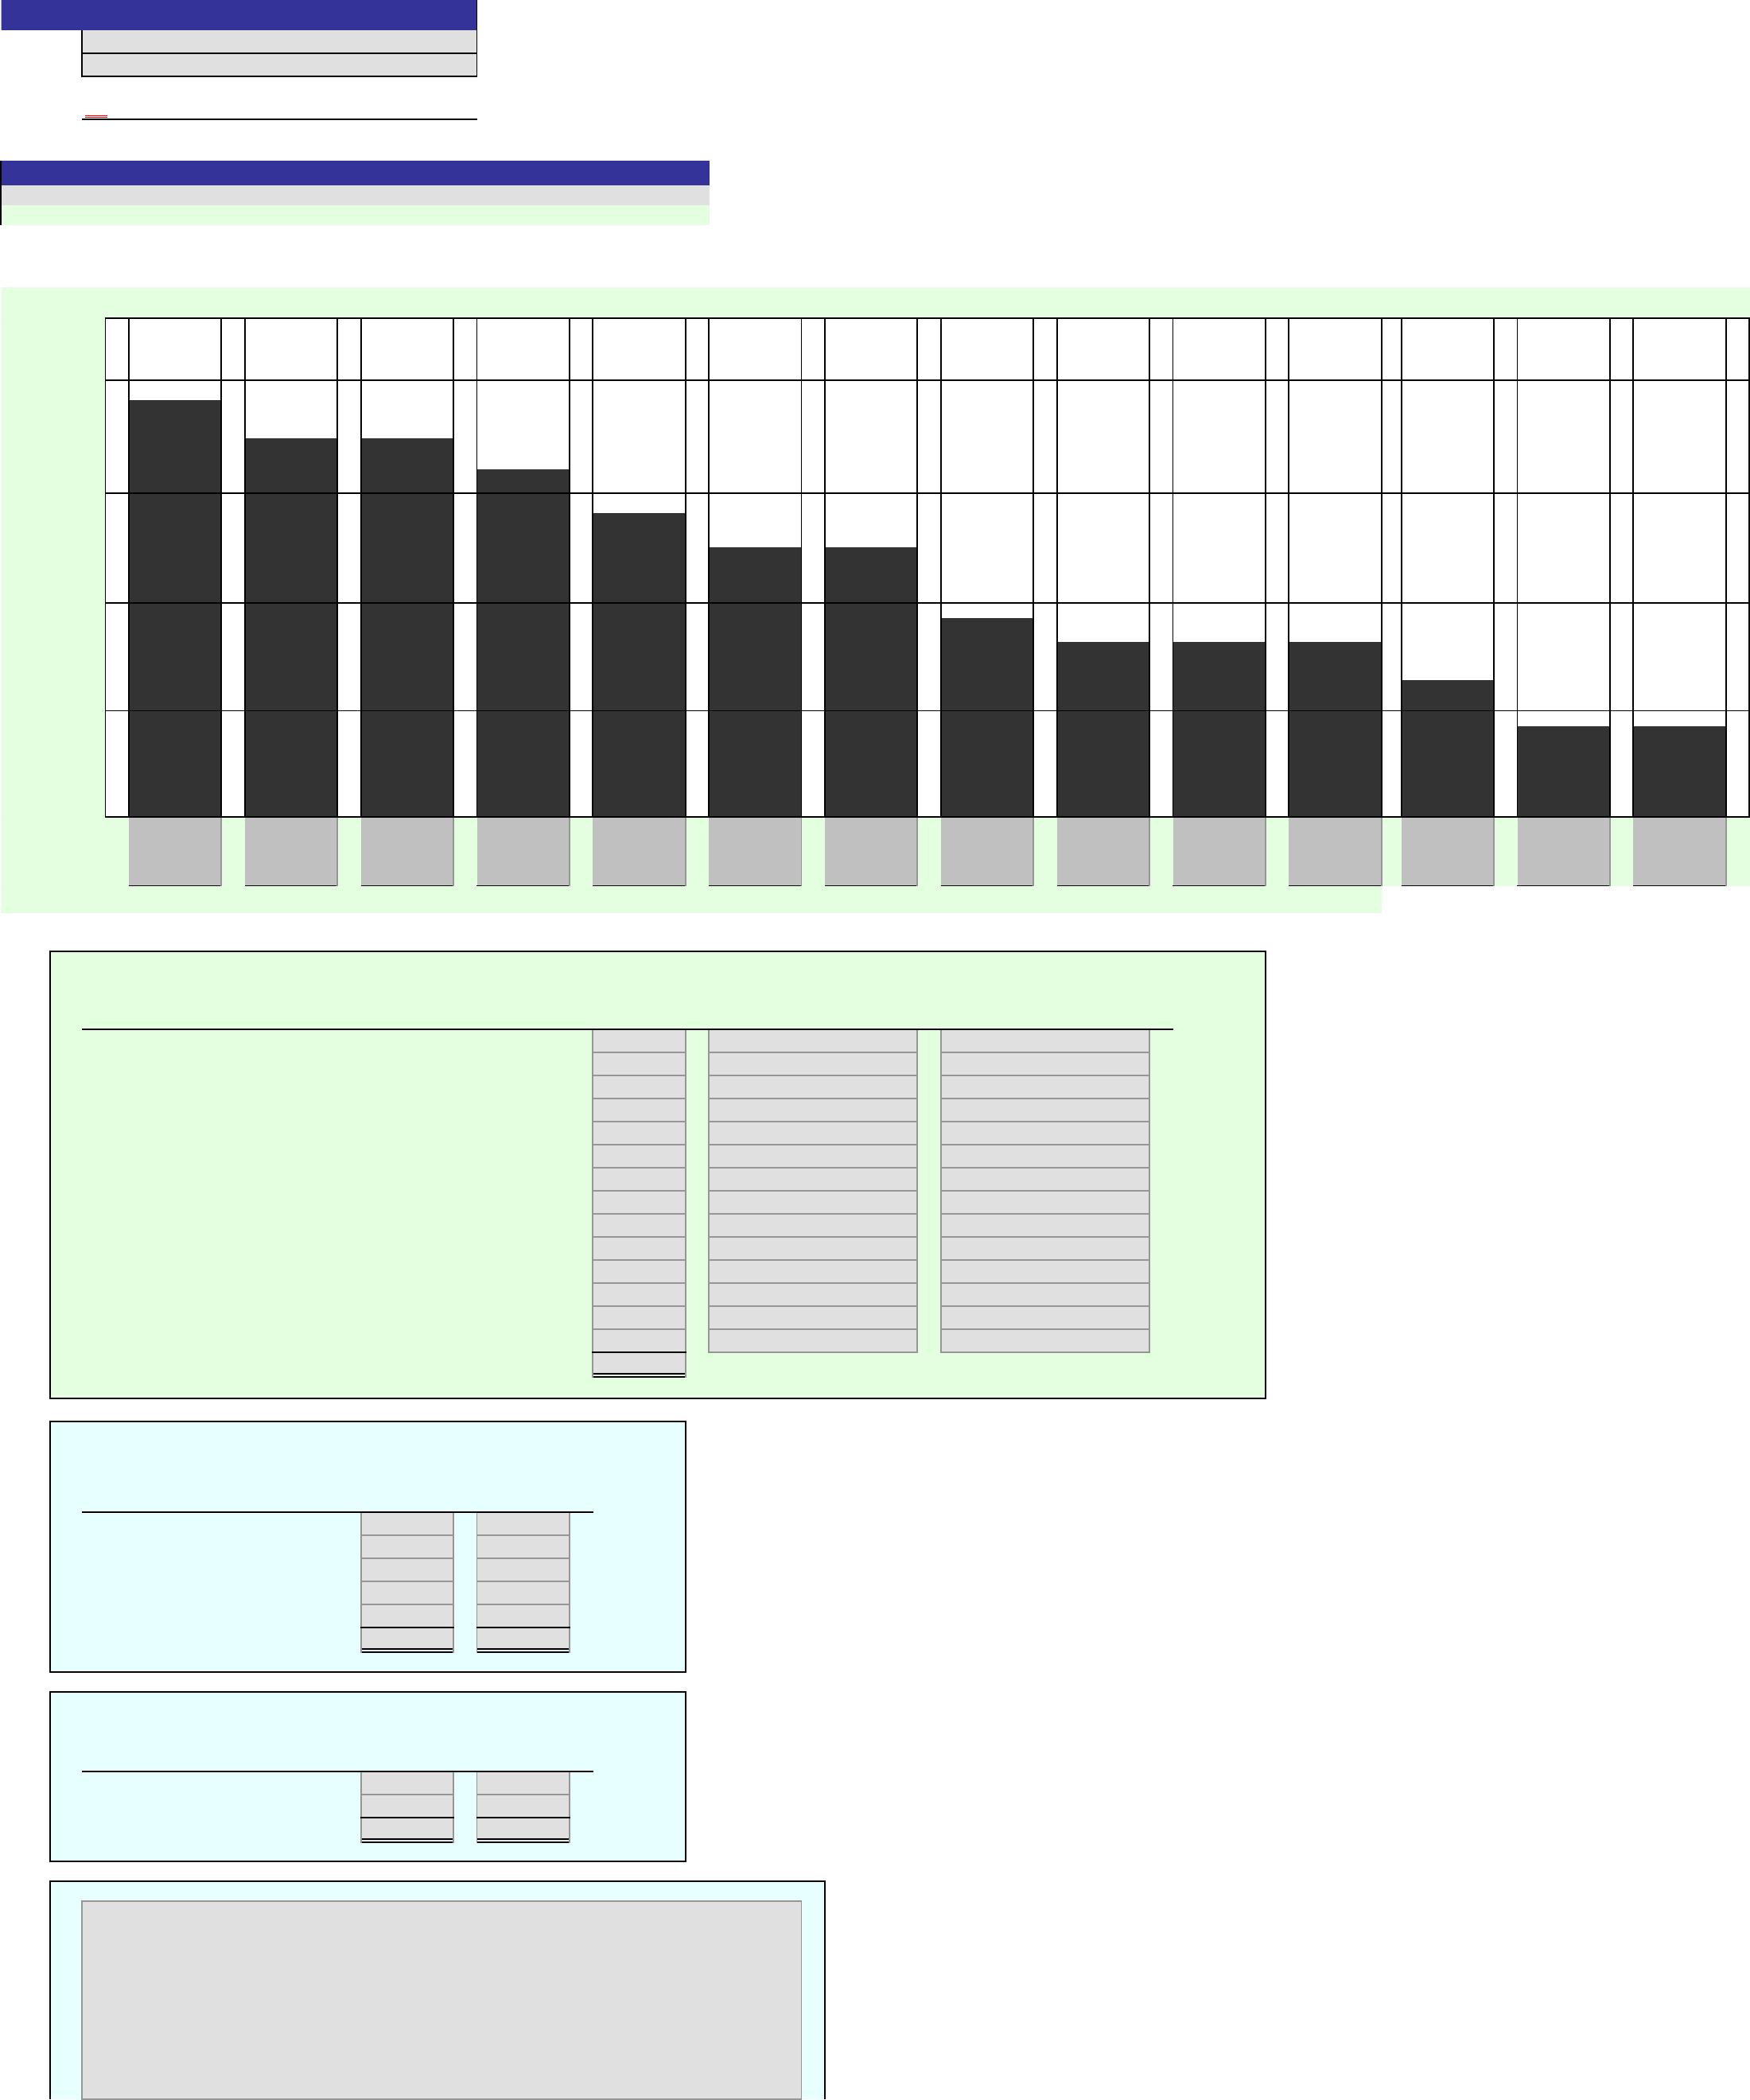
In the chart, choose the correct title for each bar.
1.
2.
Activity
Quality Activities Cost
Patient registration
Verifying patient information
Assigning patients
Searching/waiting for doctore
Doctor exam
Waiting for transport
Transporting patients
Verifying lab orders
Searching for equipment
Incorrect labs
Lab tests
Counting supplies
Looking for supplies
Staff training
Total
3.
Percent of
Quality Cost Activity Total
Classification Cost Department Cost
Prevention
Appraisal
Internal failure
External failure
Other patient care
Total
4.
Percent of
Activity Total
Cost Department Cost
Value-added
Non-value-added
Total
5.
$20,000
0%
[Key code here]
Answers are entered in the cells with gray backgrounds.
Score:
Key Code:
Instructions
$5,000
Problem 27(12)-4A
Name:
Section:
Cells with non-gray backgrounds are protected and cannot be edited.
Pareto Chart⎯Quality Activities
Value–Added/
Cost of Quality
Classification
Non-Value-Added
Classification
$10,000
[Key essay answer here]
$15,000
An asterisk (*) will appear to the right of an incorrect entry. The essay answer will not be graded.
Enter a zero in cells you would otherwise leave blank.
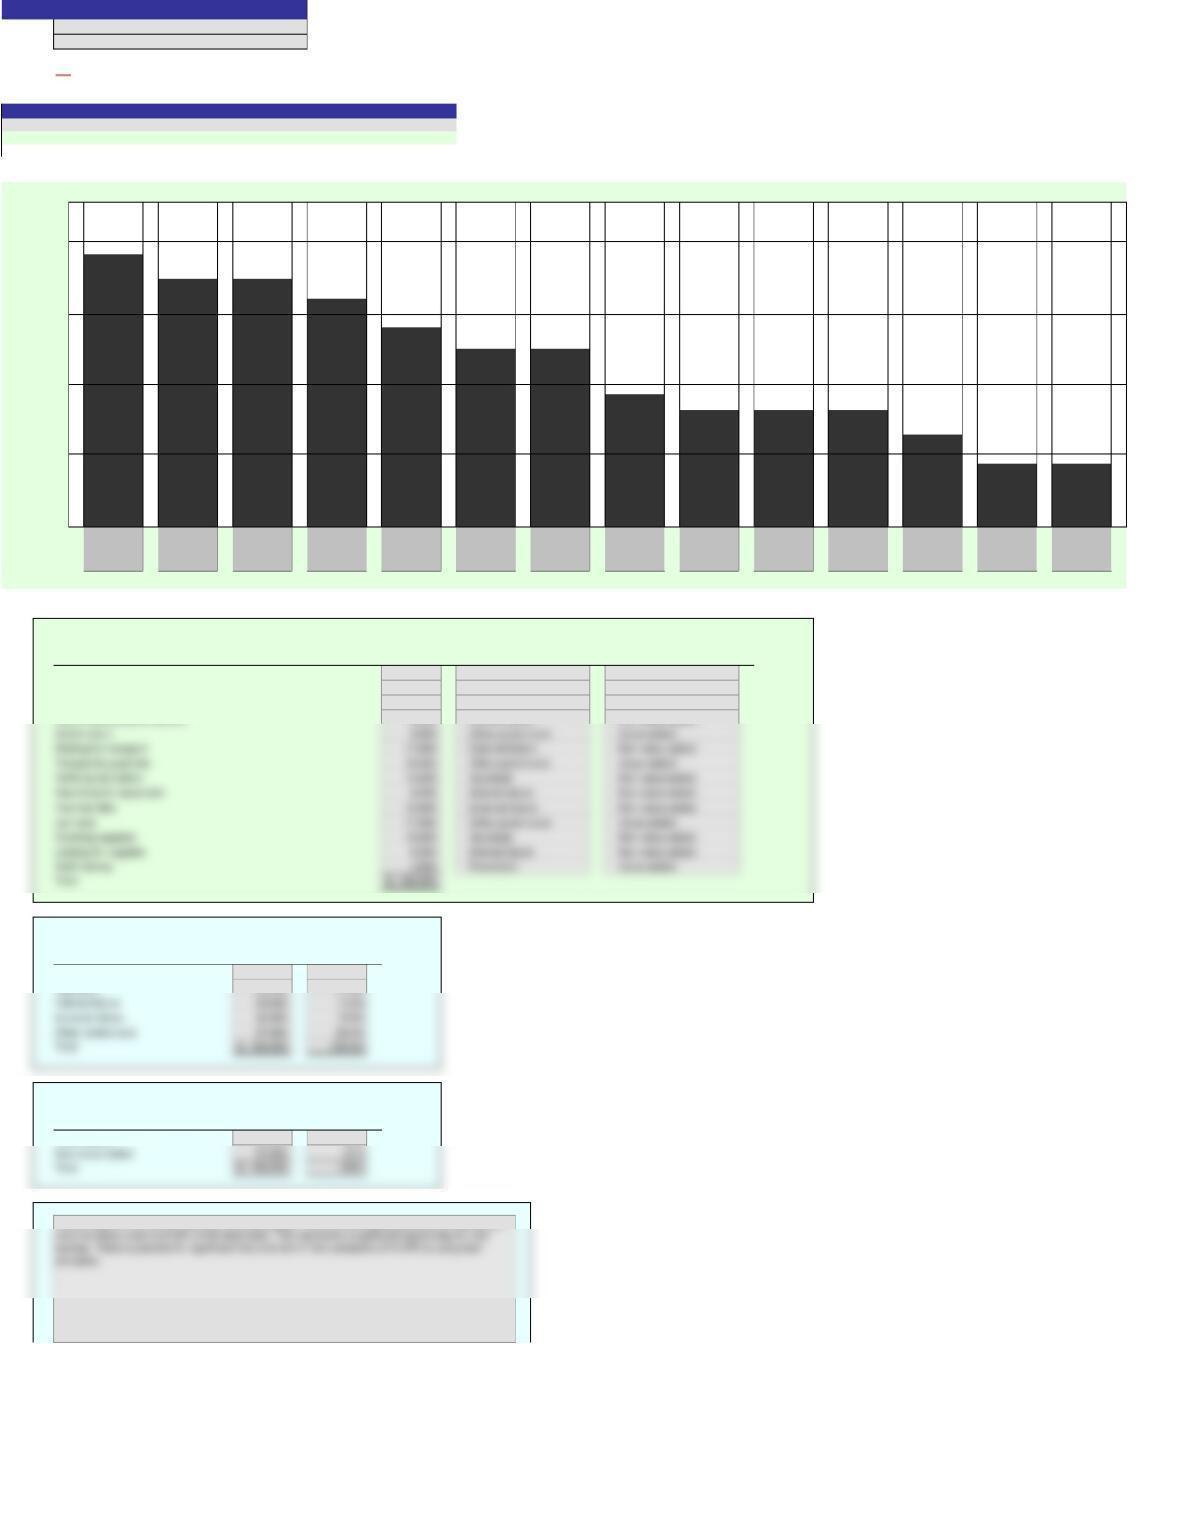
In the chart, choose the correct title for each bar.
1.
Counting
supplies
Lab tests
Waiting for
transports
Transport-ing
patients
Verifying lab
orders
Assigning
patients
Incorrect labs
Verifying
patient
information
Looking for
supplies
Searching for
equipment
Searching/
waiting for
doctor
Patient
registration
Doctor exam Staff training
2.
Activity
Quality Activities Cost
Patient registration 6,400$
Verifying patient information 9,600
Assigning patients 12,800
Searching/waiting for doctore 8,000
3.
Percent of
Quality Cost Activity Total
Classification Cost Department Cost
Prevention 4,800$ 3.0%
Appraisal 43,200 27.0%
4.
Percent of
Activity Total
Cost Department Cost
Value-added 62,400$ 39%
5.
Key Code:
Score:
Instructions
Answers are entered in the cells with gray backgrounds.
Pareto Chart⎯Quality Activities
Cells with non-gray backgrounds are protected and cannot be edited.
Problem 27(12)-4A
Name:
Solution
Section:
ON
$5,000
Value–Added/
Non-Value-Added
Classification
Value-added
Cost of Quality
Classification
Other patient care
Appraisal
Other patient care
Non-value-added
Value-added
Non-value-added
$20,000
$15,000
$10,000
Internal failure
The ER has 61% of its total costs as non-value-added. This is a very significant amount. Internal and
Other patient care
External failure
Other patient care
Value-added
Non-value-added
Non-value-added
Value-added
Non-value-added
Value-added
Appraisal
Non-value-added
Value-added
Non-value-added
Non-value-added
Internal failure
Prevention
External failure
Other patient care
Appraisal
Internal failure
An asterisk (*) will appear to the right of an incorrect entry. The essay answer will not be graded.
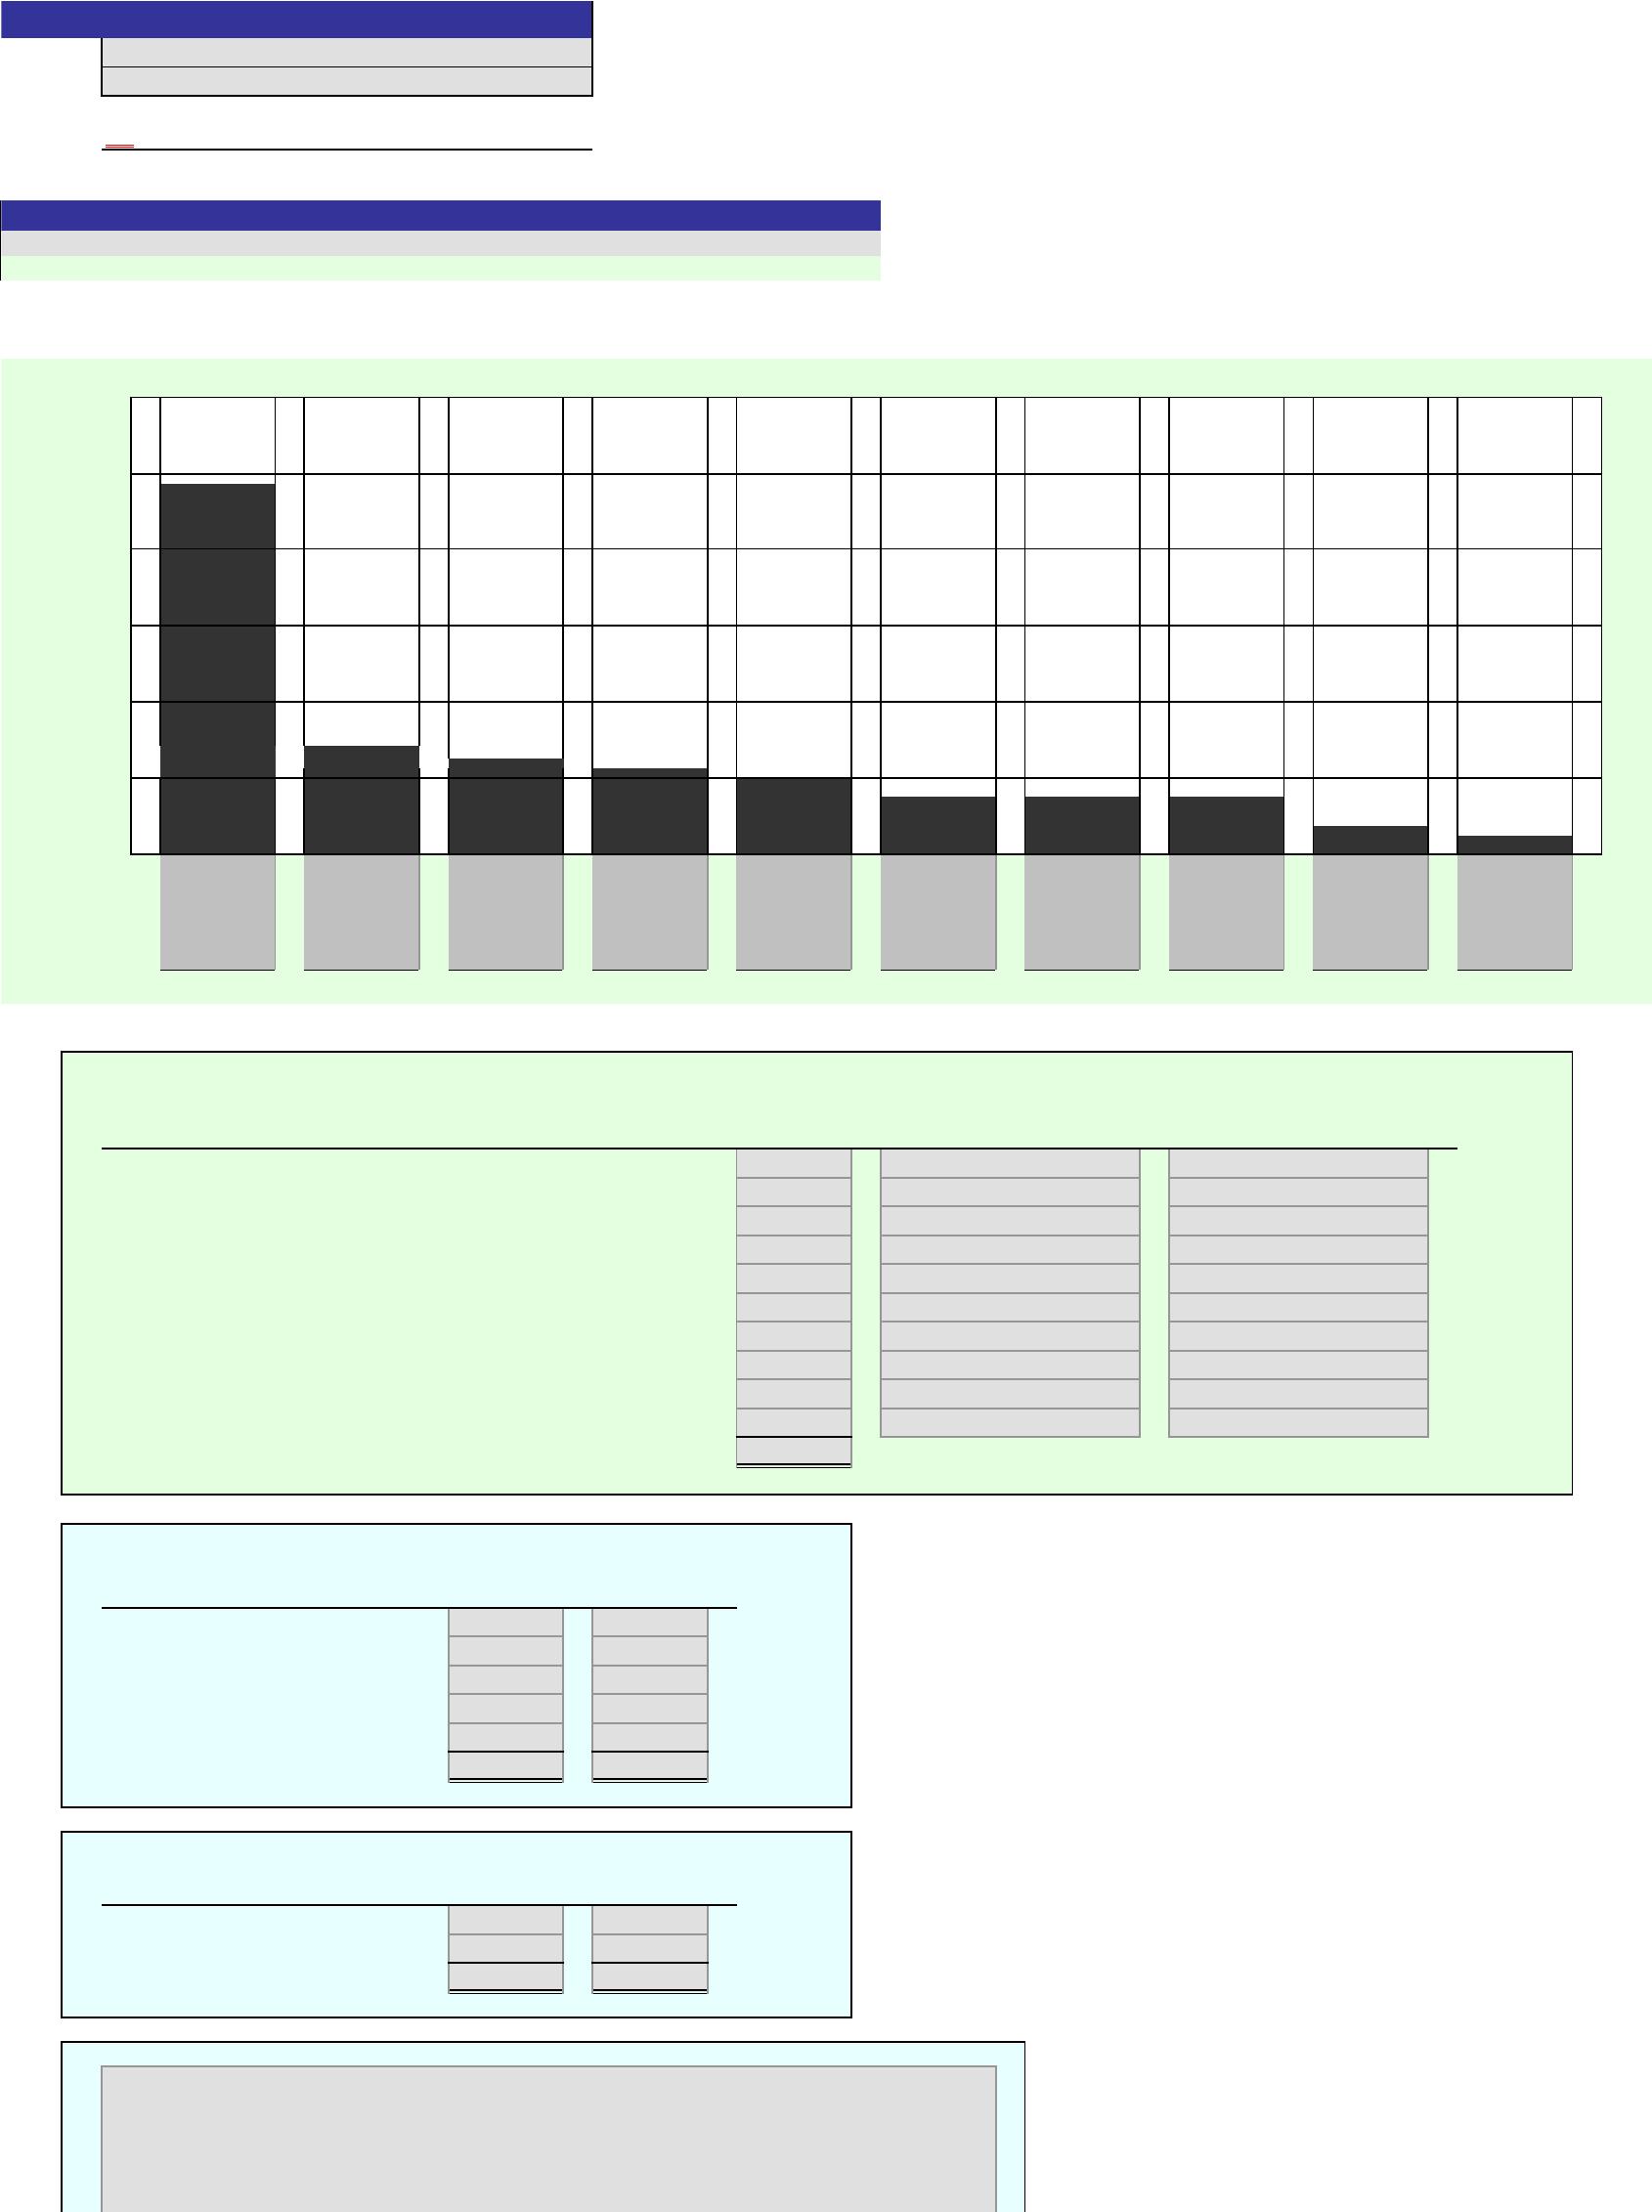
Enter a zero in cells you would otherwise leave blank.
1.
2.
Activity
Quality Activities Cost
Correcting invoice errors
Disposing of incoming materials with poor quality
Disposing of scrap
Expediting late production
Final inspecting
Inspecting incoming materials
Inspecting work in process
Preventive machine maintenance
Producing product
Responding to customer quality complaints
Total
3. Percent of
Quality Cost Activity Total
Classification Cost Department Cost
Prevention
Appraisal
Internal failure
External failure
Not a cost of quality
Total
4. Percent of
Activity Total
Cost Department Cost
Value-added
Non-value-added
Total
5.
$100,000
$40,000
$20,000
$80,000
$60,000
[Key essay answer here]
$0
Value-Added/
Cost of Quality
Classification
Non-Value-Added
Classification
Problem 27(12)-4B
Name:
Section:
Pareto Chart⎯Department Activities
$120,000
Cells with non-gray backgrounds are protected and cannot be edited.
0%
[Key code here]
Answers are entered in the cells with gray backgrounds.
Score:
Key Code:
Instructions
An asterisk (*) will appear to the right of an incorrect entry. The essay answer will not be graded.
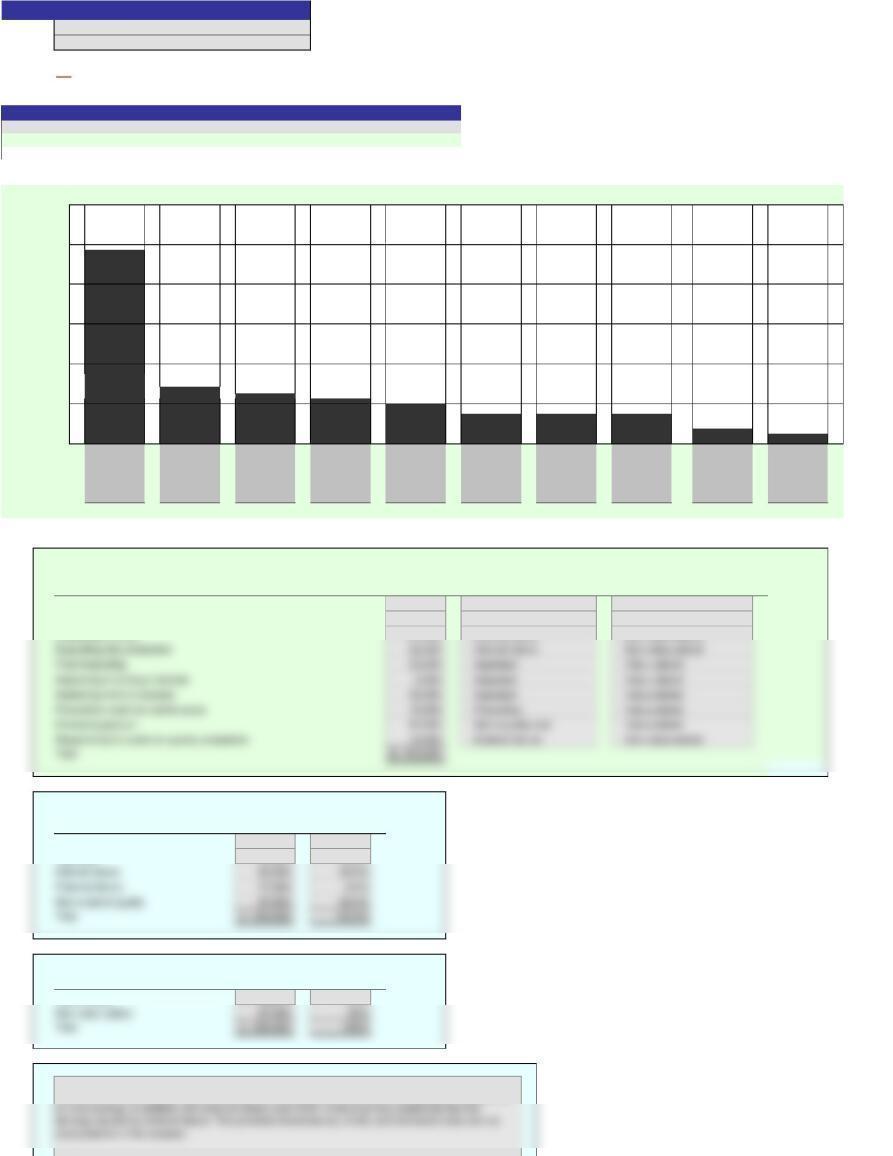
Enter a zero in cells you would otherwise leave blank.
1.
Producing
product
Disposing
scrap
Inspecting
work in
process
Expediting
late
production
Final
inspecting
Disposing
incoming
materials with
poor quality
Preventive
machine
mainten-ance
Responding
to customer
complaints
Correcting
invoice errors
Inspecting
incoming
materials
2.
Activity
Quality Activities Cost
Correcting invoice errors 7,500$
Disposing of incoming materials with poor quality 15,000
Disposing of scrap 27,500
3. Percent of
Quality Cost Activity Total
Classification Cost Department Cost
Prevention 15,000$ 6.0%
Appraisal 50,000 20.0%
4. Percent of
Activity Total
Cost Department Cost
Value-added 162,500$ 65%
5.
Non-value-added
Non-value-added
Cost of Quality
Classification
External failure
Internal failure
Internal failure
The company has 65% of its total costs as value-added. However, there is still room for significant
improvement. Internal failure represents 26% of the total costs. This represents significant opportunity
Non-Value-Added
Classification
Non-value-added
Pareto Chart⎯Department Activities
$0
$20,000
$40,000
$80,000
Problem 27(12)-4B
Name:
Solution
Section:
Value-Added/
$60,000
ON
Score:
$100,000
$120,000
Instructions
Answers are entered in the cells with gray backgrounds.
Cells with non-gray backgrounds are protected and cannot be edited.
Value-added
Non-value-added
Value-added
Non-value-added
Value-added
Value-added
Value-added
Internal failure
Appraisal
Appraisal
Appraisal
Prevention
Not a quality cost
External failure