1. The lean philosophy focuses on reducing time, cost, and poor quality within manufacturing
and nonmanufacturing processes.
2. Move time and wait time in inventory are examples of non-value-added lead time.
3. A product-oriented layout can be designed to minimize materials movements and reduce (or
4. Long setup times lead to large production runs (batch sizes) in order to amortize the cost of
5. Pull or “make to order” manufacturing requires the manufacturer to build product only as it is
6. Product defects can cause additional costs and unpredictability in the process in the form of
scrap, rework, record keeping, and inspection. In addition, product defects can cause a
7. With supply chain management, long-term relationships are established with suppliers and
customers to improve quality, cost, and delivery. Traditional relationships are usually
8. A lean environment will result in fewer (or no) work in process control points. As a result,
9. The raw and in process inventory account combines the materials and work in process
10. Direct labor and indirect labor activities become combined in a lean environment.
CHAPTER 27 (FIN MAN); CHAPTER 12 (MAN)
LEAN PRINCIPLES, LEAN ACCOUNTING,
DISCUSSION QUESTIONS
AND ACTIVITY ANALYSIS
CHAPTER 27 Lean Principles, Lean Accounting, and Activity Analysis
DISCUSSION QUESTIONS (Concluded)
11. A Pareto chart shows the totals of a particular attribute for a number of categories. The
12. Non-value-added activities are activities that are viewed as unnecessary from the customer’s
p
erspective. These activities are generally considered wasteful and are candidates for
elimination through process improvements.
p
CHAPTER 27 Lean Principles, Lean Accounting, and Activity Analysis
PE 27–1A (FIN MAN); PE 12–1A (MAN)
a.
V
alue-added lead time………………………
…
24 min. (14 min. + 10 min.)
Non-value-added lead time:
24 min.
728 min.
PE 27–1B (FIN MAN); PE 12–1B (MAN)
a.
V
alue-added lead time………………………
…
19 min. (11 min. + 8 min.)
Non-value-added lead time:
19 min.
1,915 min.
PE 27–2A (FIN MAN); PE 12–2A (MAN)
PE 27–2B (FIN MAN); PE 12–2B (MAN)
b. Smaller batch sizes
b. Value-added ratio: = 1.0%
PRACTICE EXERCISES
Value-added ratio:b. = 3.3%
CHAPTER 27 Lean Principles, Lean Accounting, and Activity Analysis
PE 27–3A (FIN MAN); PE 12–3A (MAN)
a. Raw and In Process Inventory* 112,000
Accounts Payable 112,000
*$160 per unit × 700 units
b. Raw and In Process Inventory* 56,525
PE 27–3B (FIN MAN); PE 12–3B (MAN)
a. Raw and In Process Inventory* 68,250
Accounts Payable 68,250
*$65 per unit × 1,050 units
b. Raw and In Process Inventory* 12,000
CHAPTER 27 Lean Principles, Lean Accounting, and Activity Analysis
PE 27–4A (FIN MAN); PE 12–4A (MAN)
Quality
Cost
Prevention……………………………………
…
$183,000 61% 18.3%
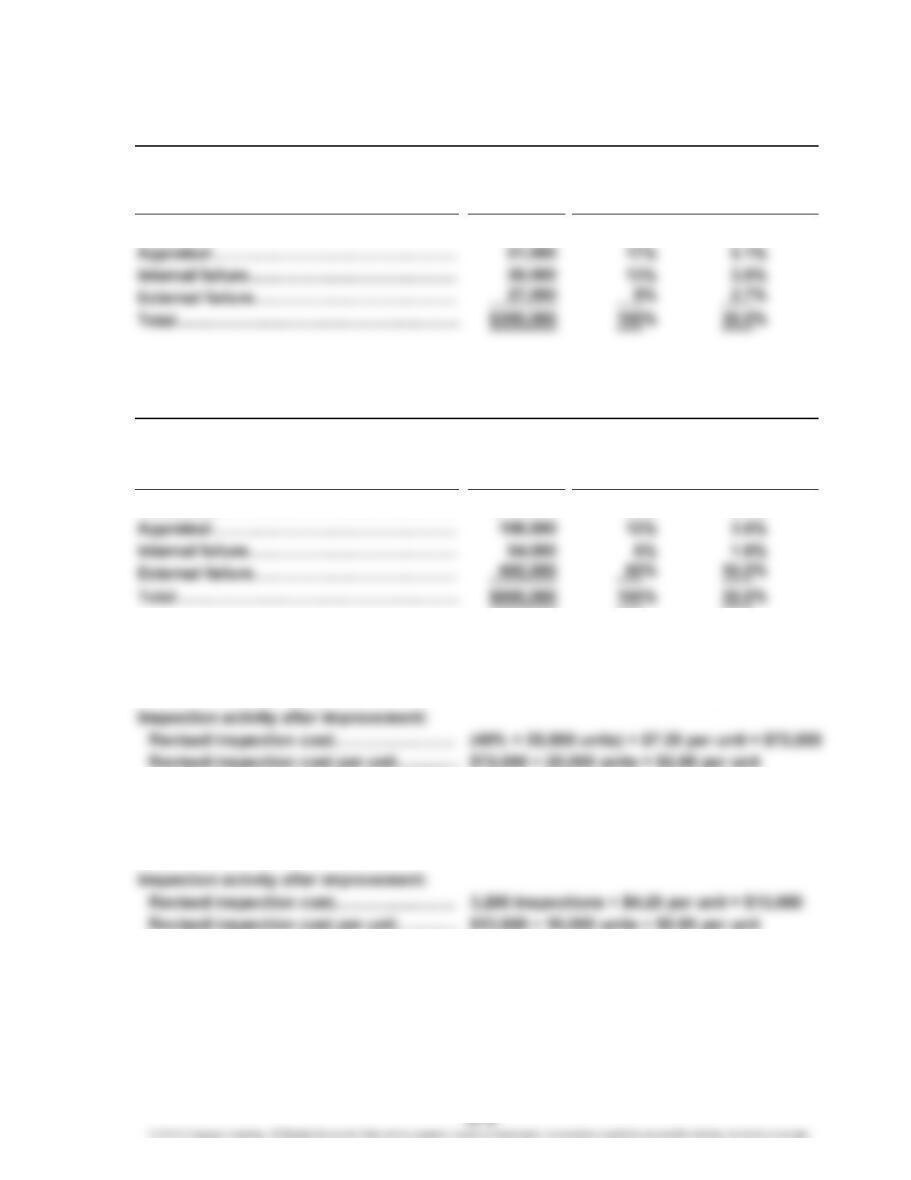
PE 27–4B (FIN MAN); PE 12–4B (MAN)
Quality
Cost
Prevention……………………………………
…
$288,000 32% 9.6%
…
PE 27–5A (FIN MAN); PE 12–5A (MAN)
Inspection activity before improvement: $180,000 ÷ 25,000 units = $7.20 per unit
PE 27–5B (FIN MAN); PE 12–5B (MAN)
Inspection activity before improvement: $68,000 ÷ 16,000 units = $4.25 per unit
Quality Cost Classification Cost Sales
Sales
Total Quality Total
Cost of Quality Report
Cost of Quality Report
Percent of Percent of
Percent of
Total
Quality Cost Classification
Percent of
Total Quality
Cost
…
CHAPTER 27 Lean Principles, Lean Accounting, and Activity Analysis
Ex. 27–1 (FIN MAN); Ex. 12–1 (MAN)
The CEO must not have been listening very closely at the conference. Lean
manufacturing is not primarily an inventory reduction method. Lean manufacturing
is a process improvement philosophy that focuses on reducing time, cost, poor quality,
and uncertainty from a process. Large inventories are merely a symptom of poorly
designed processes. Thus, the CEO’s statement is naive. The company must first
In addition, the CEO has not provided the training or action plan for moving to lean.
The CEO has only commanded that it be done. This will create anxiety in the
workforce, and it is not consistent with employee involvement.
Ex. 27–2 (FIN MAN); Ex. 12–2 (MAN)
This is an actual situation facing the U.S. apparel industry. Warren Featherbone and
other U.S.-based apparel manufacturers are discovering the strategic power of lean
manufactures in batch sizes that are too large and too far away to respond quickly.
In addition, the retailer does not have to commit significant inventory to unknown
fashion trends when purchasing from the local company. As a result, the retailer is
able to avoid markdowns on slow-moving goods. Markdowns represent the second
largest cost to retailing operations (next to cost of merchandise sold). The retailer
must make large order commitments to the offshore manufacturer. If the product
eventually proves to be disappointing in the market, the retailer has no choice but
to incur severe markdowns to move the excess inventory. Because of significant
EXERCISES
CHAPTER 27 Lean Principles, Lean Accounting, and Activity Analysis
Ex. 27–3 (FIN MAN); Ex. 12–3 (MAN)
Piecework compensation is a characteristic of a traditional manufacturing philosophy
that is inconsistent with lean manufacturing. Under lean manufacturing, workers are
other cells or work on improving themselves or the process. Piecework compensation
is very inconsistent with this philosophy. Employees should not be penalized just
because the cell is operating at a slower pace (or is shut down) due to decreases in
demand. The employee has no control over the demand placed on the cell.
Management does not need to be concerned about proper motivation to work. Under
pull manufacturing, the garment will be pulled through the cell. A slow employee will
slow the whole output of the cell. The other employees will either help the slow
employee or encourage the employee to catch up with the pace of the cell.
Ex. 27–4 (FIN MAN); Ex. 12–4 (MAN)
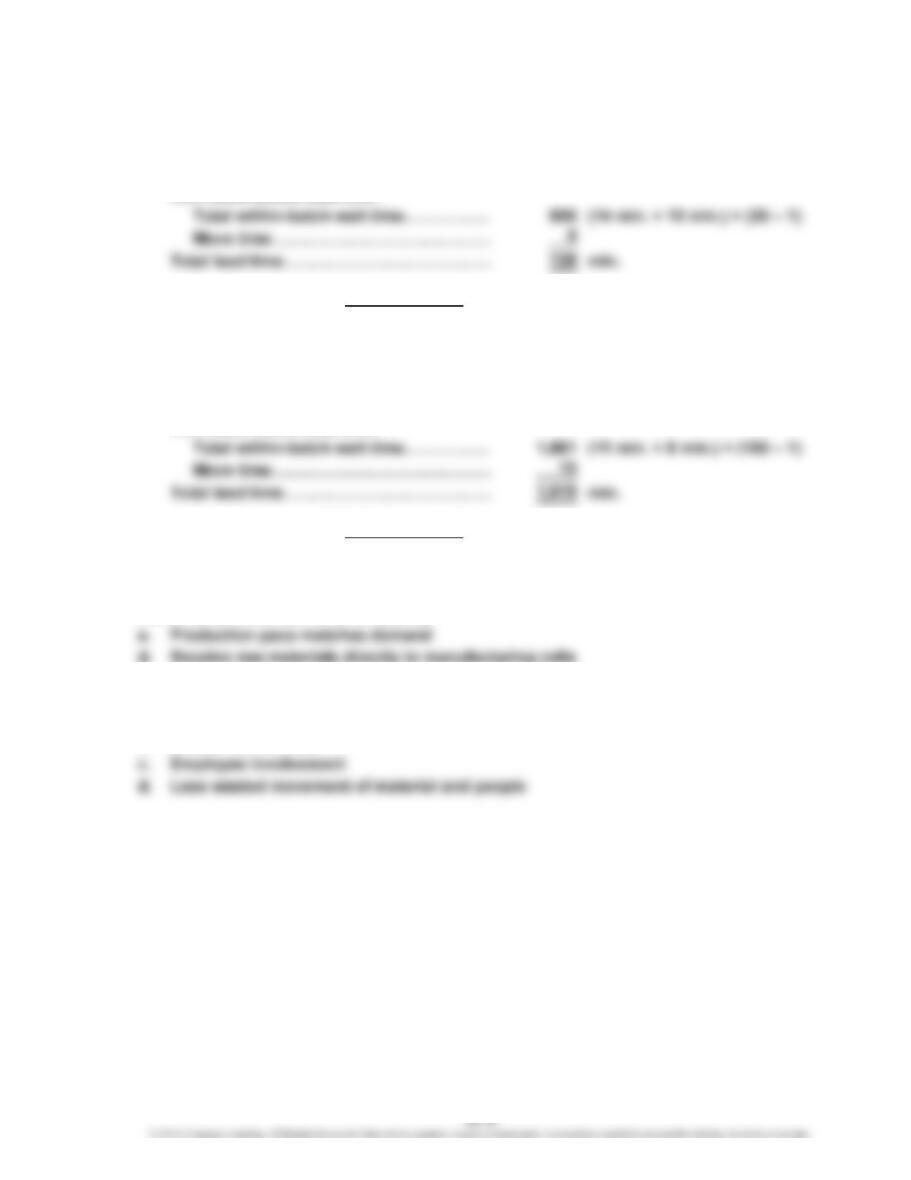
Management is incorrect in stating that the direct labor time is equal to the lead time.
The lead time also includes the wait time and other non-value-added time required to
make the product. The different batch sizes create within-batch wait time for each unit.
Thus, the lion, which is made in batch sizes of 40 units, has assembly lead time of 480
CHAPTER 27 Lean Principles, Lean Accounting, and Activity Analysis
Ex. 27–5 (FIN MAN); Ex. 12–5 (MAN)
a. Long setup times have two negative consequences. First, a long setup time
consumes valuable machine capacity that could be used for productive
purposes. Second, a long setup time results in large production batch sizes
b. One obvious improvement would be to limit the trips to the tool room to one
round trip, rather than two. However, even this could be improved upon by
changing the location of the fixtures. Changing the location of the fixtures
could significantly reduce the lathe setup time. Instead of using a tool room
to control the fixtures, the appropriate fixtures for the lathe could be located
at the lathe operation. In this case, the operator would not need to walk to a
c. Turn off machine and remove fixture from lathe………
…
10 minutes
CHAPTER 27 Lean Principles, Lean Accounting, and Activity Analysis
Ex. 27–6 (FIN MAN); Ex. 12–6 (MAN)
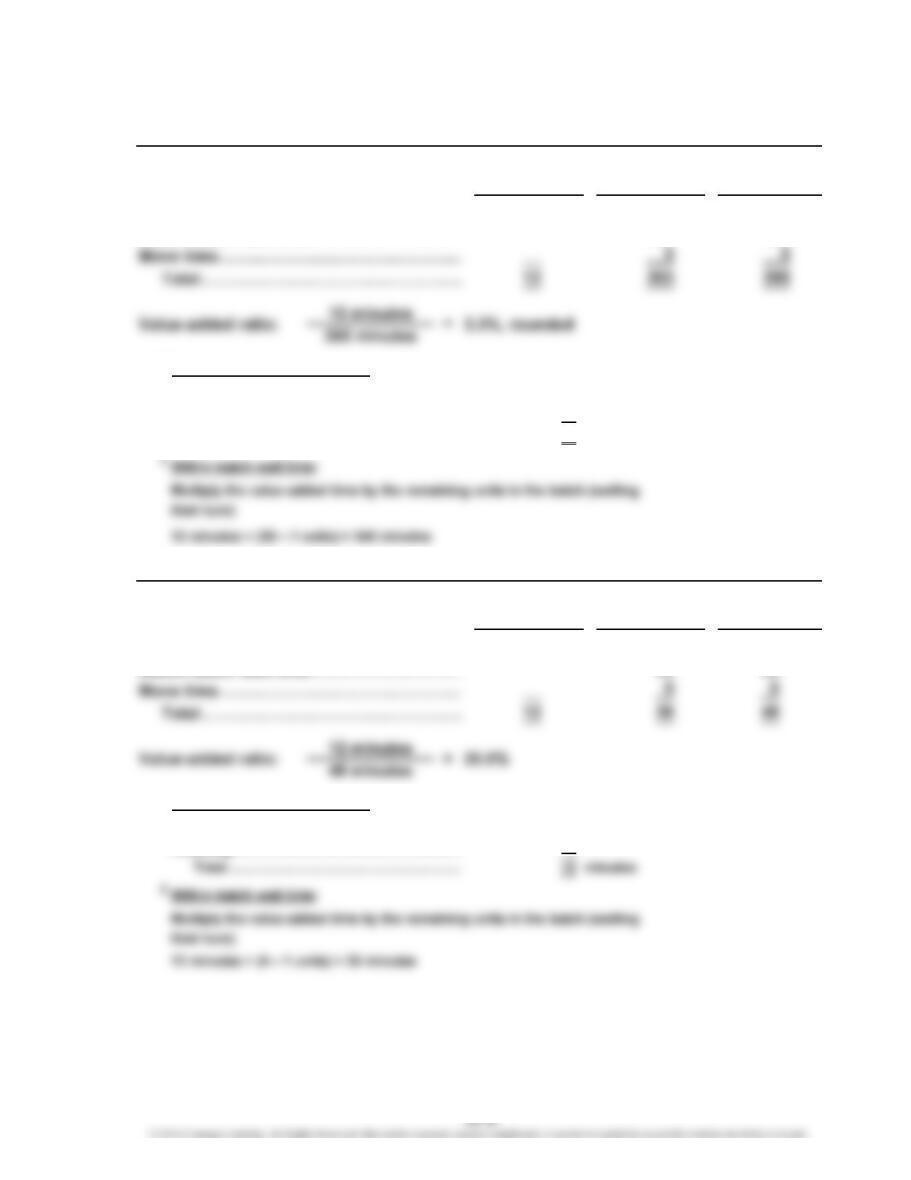
Value-Added Non-Value- Total
Time Added Time Time
V
alue-added time……………………………
…
12 12
Within-batch wait time………………………
…
348 348
1
Total value-added time per unit:
Milling………………………………………………
…
5minutes
Finishing……………………………………………
…
7
Total……………………………………………
…
12 minutes
Value-Added Non-Value- Total
Time Added Time Time
V
alue-added time……………………………
…
12 12
Within-batch wait time………………………
…
36 36
1
Total value-added time per unit:
Milling………………………………………………
…
5minutes
Finishing……………………………………………
…
7
…
Lean Manufacturing Philosophy
Traditional Philosophy
1
2
1
2
CHAPTER 27 Lean Principles, Lean Accounting, and Activity Analysis
Ex. 27–7 (FIN MAN); Ex. 12–7 (MAN)
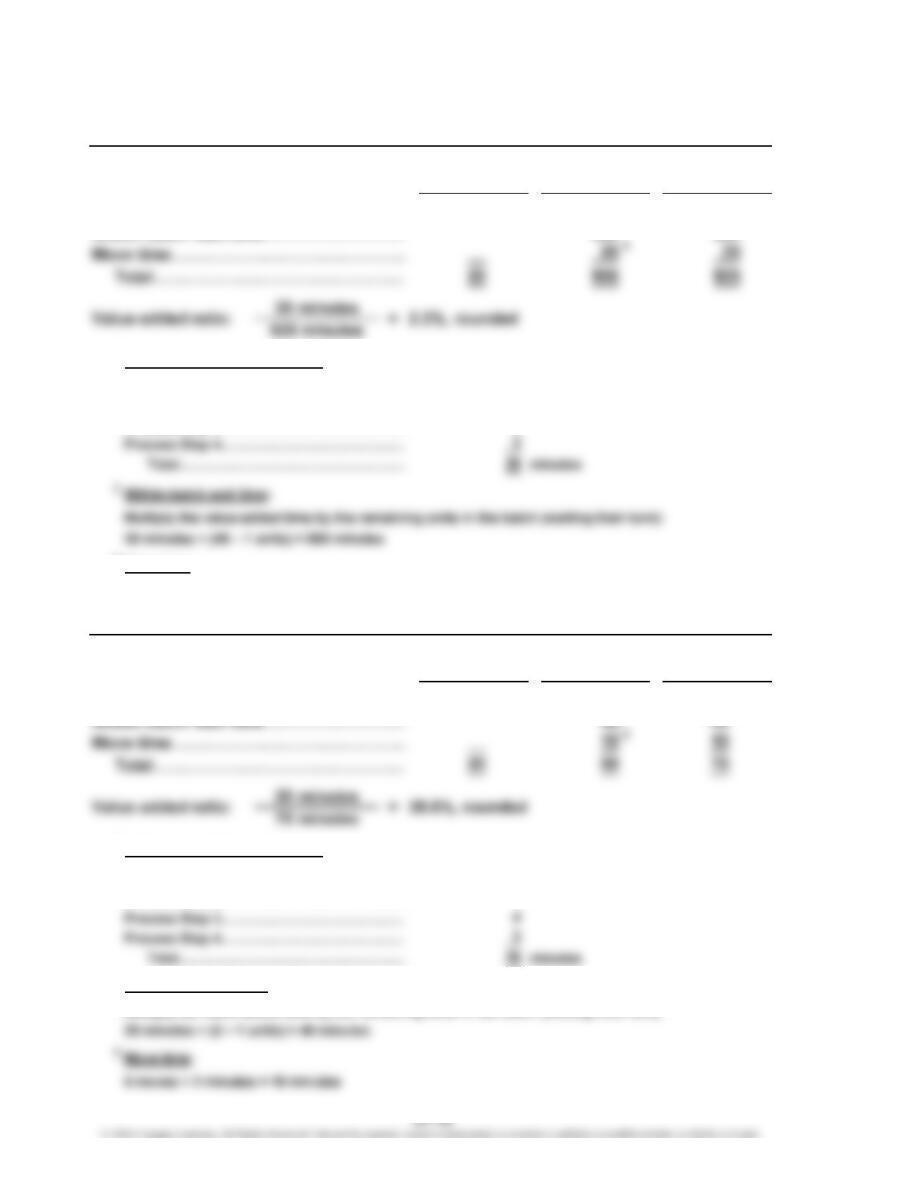
Value-Added Non-Value- Total
Time Added Time Time
V
alue-added time……………………………
…
20 20
Within-batch wait time……………………
…
880 880
1
Total value-added time per unit:
Process Step 1…………………………………
…
5 minutes
Process Step 2…………………………………
…
8
Process Step 3…………………………………
…
4
…
3
Move time:
5 moves (from raw materials to finished goods) × 5 minutes = 25 minutes
Value-Added Non-Value- Total
Time Added Time Time
V
alue-added time……………………………
…
20 20
…
1
Total value-added time per unit:
Process Step 1…………………………………
…
5 minutes
Process Step 2…………………………………
…
8
…
…
2
Within-batch wait time:
Multiply the value-added time by the remaining units in the batch (waiting their turn)
a. Present Approach
b. Proposed Lean Approach
1
2
1
2
CHAPTER 27 Lean Principles, Lean Accounting, and Activity Analysis
Ex. 27–8 (FIN MAN); Ex. 12–8 (MAN)
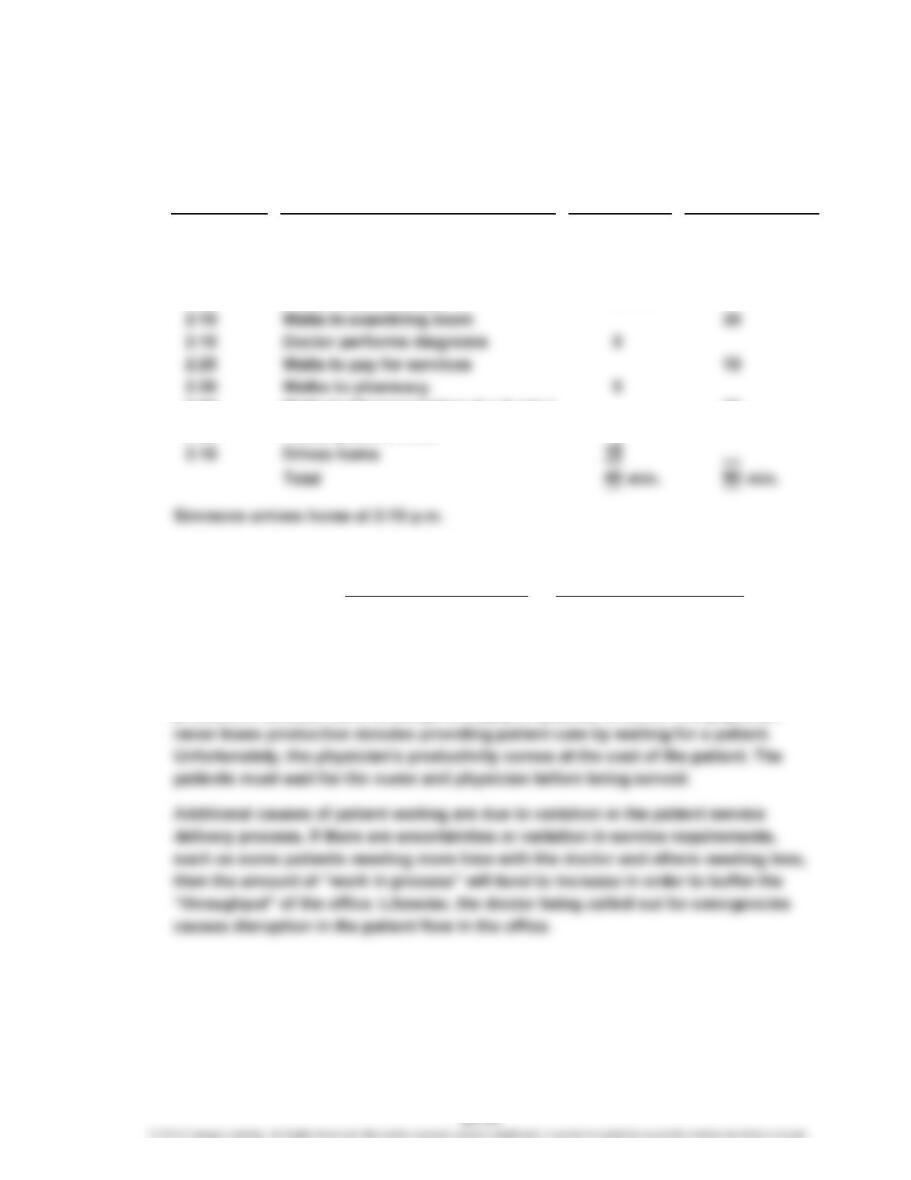
a. and b.
Elapsed
Time (a)
1:00 PM Arrives at doctor office
1:25 Waits in waiting room (5 × 5 min.) 25 min.
1:30 Waits in examining room 5
1:40 Nurse takes readings 10 min.
2:50 Waits to fill prescription (4 × 5 min.) 20
2:55 Prescription is filled 5
b. Of the total elapsed time of 130 minutes, 90 minutes is non-value-added time.
Value-Added Lead Time
Total Lead Time
d. The doctor requires patients to wait in order to increase the productivity of the office.
The patients represent the “work in process inventory” of the office, while the
physician and nurses are the critical productive resources. The clinical staff remains
productive because there is always a supply of patients to serve. The physician
Value-Added Ratio =
c.
=
Activity
(40 min. + 90 min.)
40 min. = 30.8%
Non-
Value-Added
Time
Value-Added
Time (b)
CHAPTER 27 Lean Principles, Lean Accounting, and Activity Analysis
Ex. 27–9 (FIN MAN); Ex. 12–9 (MAN)
a. The Japanese supply chain model is one based on long-term arrangements
and partnership. The Japanese automobile manufacturers want their
suppliers to be financially healthy because they rely on them for innovation.
b. These suppliers support the Japanese system because it provides for win-
win opportunities, whereby the customer and the supplier can both be
successful. The suppliers are concerned about their margins being
c. Supply chain management is often beneficial to the customer. However, the
customer may have to trade off between short-term and longer-term benefits.
For example, supply chain management provides the supplier the financial
incentives to invest in process and product innovation, invest in supply chain
CHAPTER 27 Lean Principles, Lean Accounting, and Activity Analysis
Ex. 27–10 (FIN MAN); Ex. 12–10 (MAN)
Quickie’s team approaches are very different from using a manager to hire and
evaluate employees. First, the input of many individuals goes into the hiring
decision. In this way, the viewpoints of a variety of people are brought into the
decision. Moreover, the new hire needs to “fit” with the culture of the team.
Team-based hiring can produce a higher probability of having an effective team
Team-based evaluation practices increase employee involvement. Employees
have input into decisions that affect the team, rather than having these decisions
handed down to them. This should increase the amount of empowerment and job
satisfaction enjoyed by the team members.
Ex. 27–11 (FIN MAN); Ex. 12–11 (MAN)
Shield Insurance Company should adopt lean principles in its claims
payment operations. Management should first consider changing the layout for
this process. Instead of processing the claims payments through three different
departments that are organized by process, the company could design claims
payment “cells” that are organized around different types of insurance
products or customers. For example, a cell could be created for all marine
insurance. The cell would have data input, claims audit, and claims adjustment
personnel all located together (co-located) to process marine insurance claims.
CHAPTER 27 Lean Principles, Lean Accounting, and Activity Analysis
Ex. 27–12 (FIN MAN); Ex. 12–12 (MAN)
a. The present Grill Rite service delivery system is an example of a push system.
Special orders are “pushed” through the system. The order is placed at the
beginning of the process and the hamburger is cooked, dressed, and then
b. A new system could be designed so that a custom order is introduced after cooking
the burger, rather than prior to cooking. In this way, hamburgers are made to order
without the use of finished goods inventory. Under this process, assume a customer
ordered a hamburger with ketchup and pickles only. The order would be received
at the dressing station. Here, a food preparer would take a hamburger off the grill
and place ketchup and pickles on the burger using materials at the dressing station
(termed point-of-use materials). The hamburger that is pulled from the grill would
create a signal (the space on the grill) for a new hamburger to be placed on the grill.
In this way, hamburgers that are cooking do not have orders assigned to them.
Note to Instructors: You may recognize that the first system described in this exercise is
similar to the method invented by McDonald’s, while Wendy’s uses the second method.
McDonald’s recently indicated that it was switching its method to work more like
Wendy’s because of its superior service characteristics. You might also note that Dell’s
CHAPTER 27 Lean Principles, Lean Accounting, and Activity Analysis
Ex. 27–13 (FIN MAN); Ex. 12–13 (MAN)
The production manager probably has some good points. If the accounting system does
not change when an organization embraces a lean strategy, then there will likely be
complaints. A conventional accounting system needs to have a strong accounting
control orientation. Under lean manufacturing, the accounting system can be designed
with much wider transaction control intervals. The company could have a very wide
transaction interval—such as between purchased parts transacted in and finished goods
transacted out. Thus, many transactions into and out of intermediate work in process
inventory locations would not be needed. In addition, a raw and in process inventory
CHAPTER 27 Lean Principles, Lean Accounting, and Activity Analysis
Ex. 27–14 (FIN MAN); Ex. 12–14 (MAN)
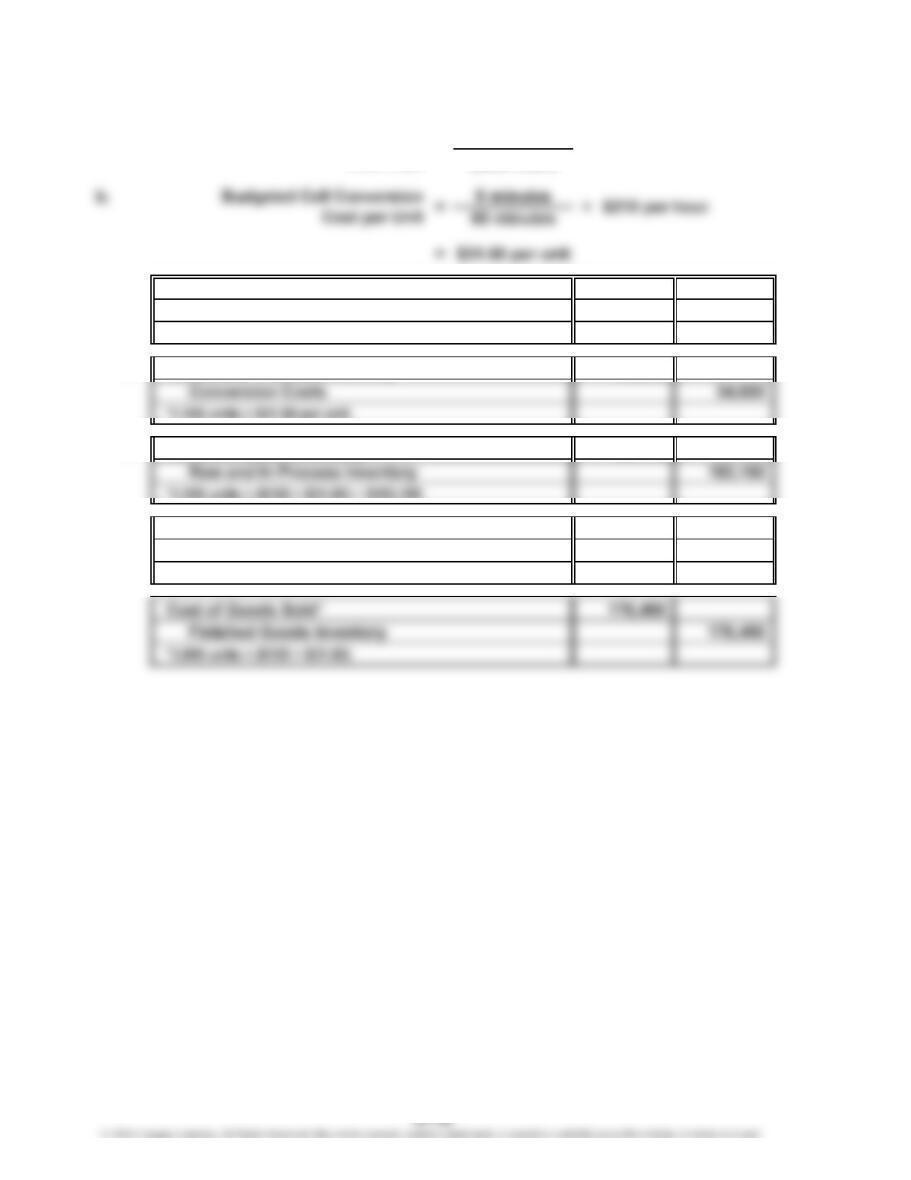
$420,000
2,000 hours
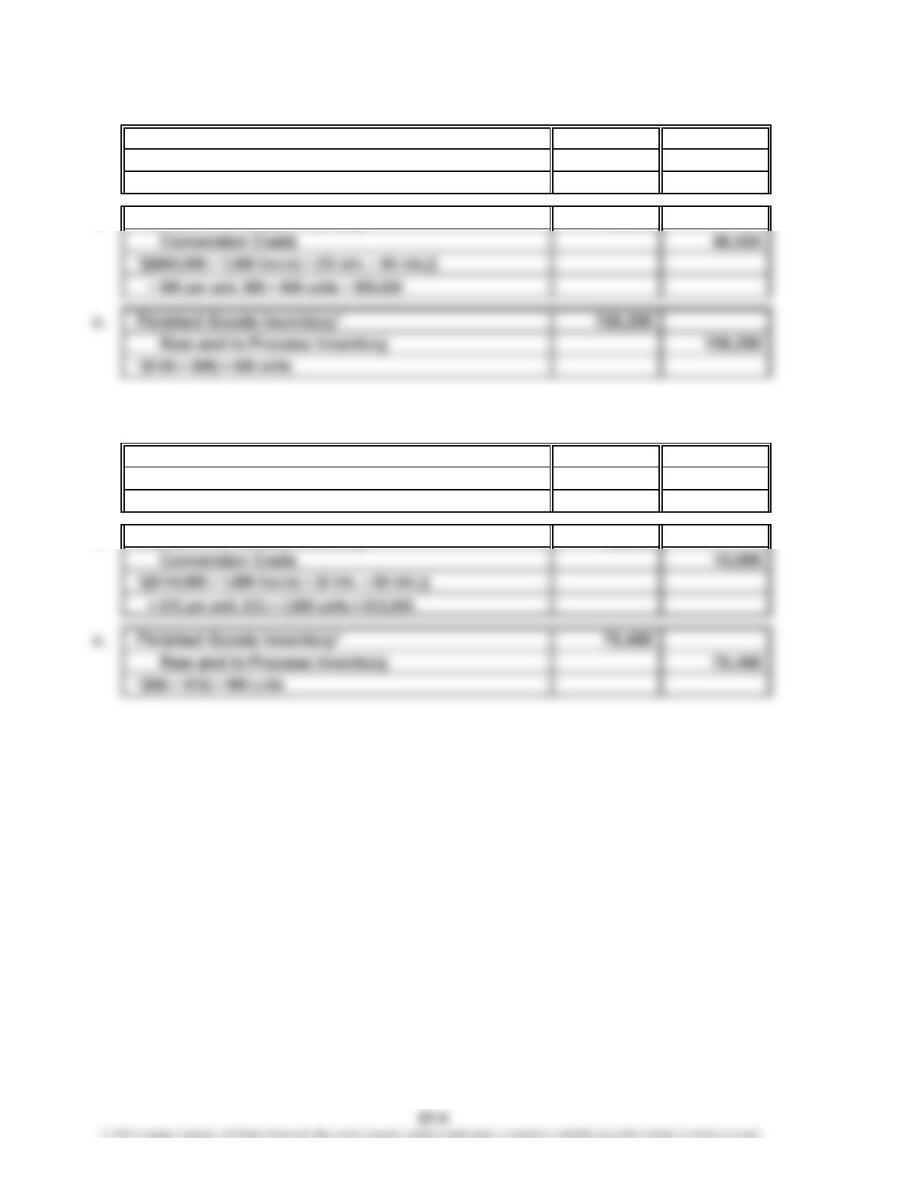
c. 1. Raw and In Process Inventory*
Accounts Payable 148,500
*1,100 units × $135 per unit
2. Raw and In Process Inventory*
3. Finished Goods Inventory*
4. Accounts Receivable*
Sales 355,100
*$1,060 units × $335 per unit
355,100
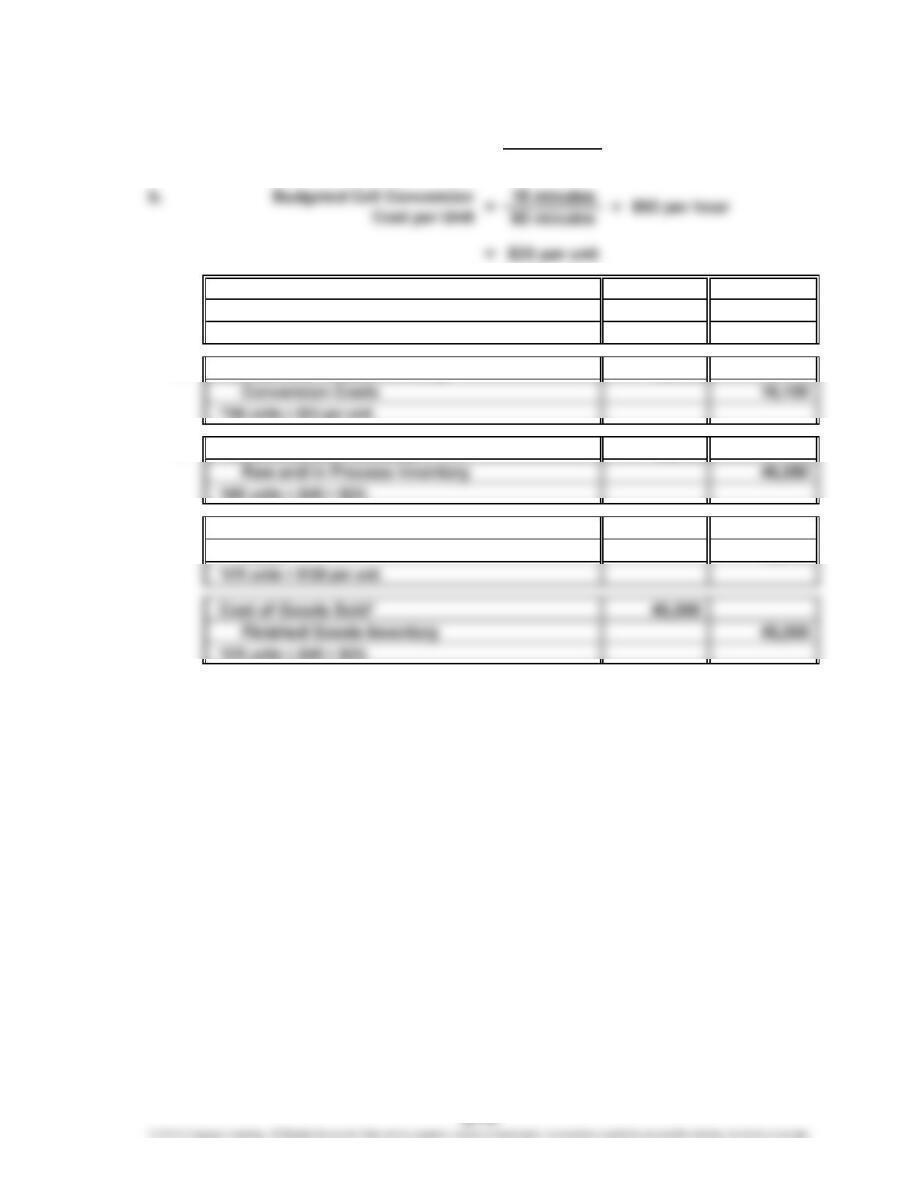
$210 per hour
a. Budgeted Cell Conversion
Cost Rate ==
183,150
148,500
34,650
CHAPTER 27 Lean Principles, Lean Accounting, and Activity Analysis
Ex. 27–15 (FIN MAN); Ex. 12–15 (MAN)
$193,200
2,100 hours
c. 1. Raw and In Process Inventory*
Accounts Payable 31,500
*700 units × $45 per unit
2. Raw and In Process Inventory*
3. Finished Goods Inventory*
4. Accounts Receivable*
Sales 85,760
46,580
31,500
16,100
$92 per hour
a. Budgeted Cell Conversion
Cost Rate ==
85,760
CHAPTER 27 Lean Principles, Lean Accounting, and Activity Analysis
Ex. 27–16 (FIN MAN); Ex. 12–16 (MAN)
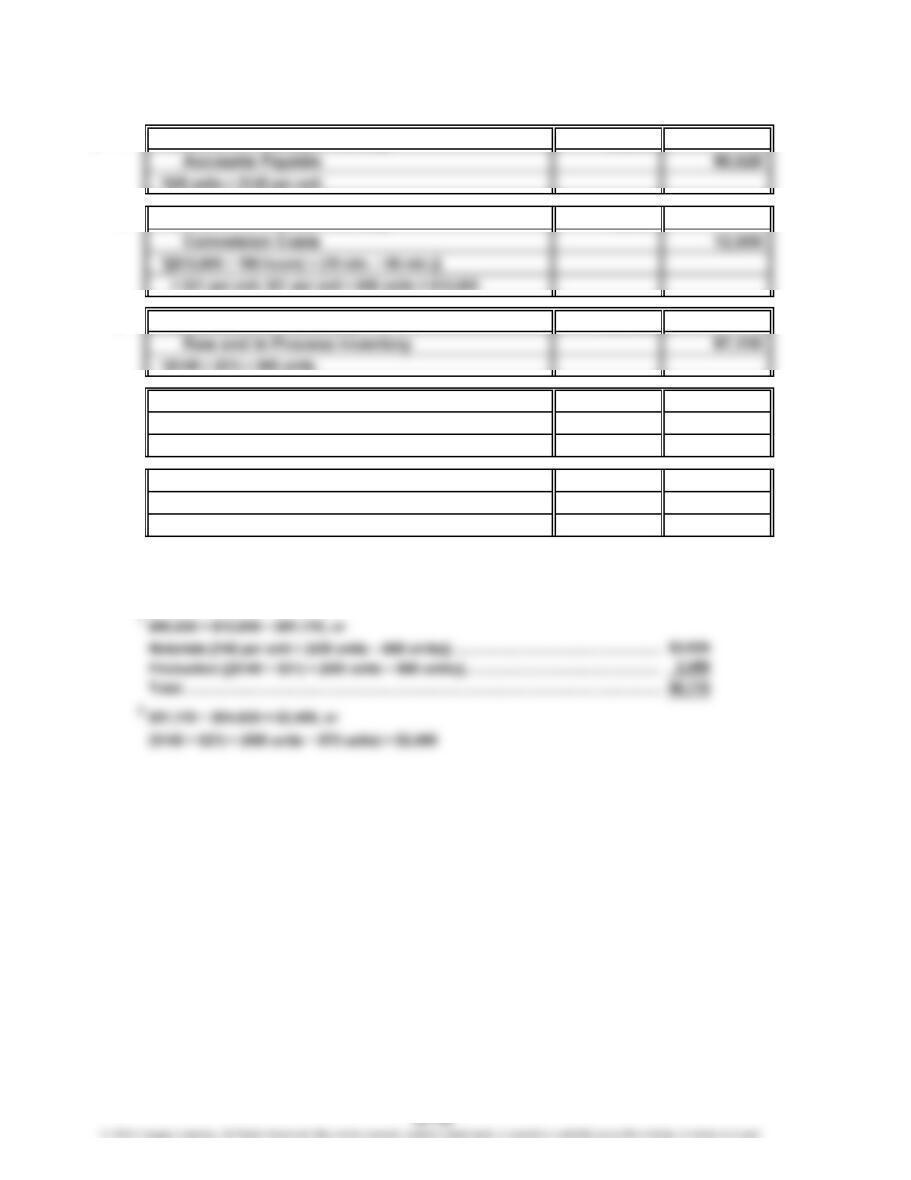
a. 1. Raw and In Process Inventory* 90,625
2. Raw and In Process Inventory* 12,600
3. Finished Goods Inventory* 97,110
4. Sales* 205,200
Accounts Receivable 205,200
*$360 per unit × 570 units
Cost of Goods Sold* 94,620
Finished Goods Inventory 94,620
*($145 + $21) × 570 units
b. Raw and In Process Inventory, ending balance1……………………………
…
$6,115
Finished Goods Inventory, ending balance2…………………………………
…
$2,490

CHAPTER 27 Lean Principles, Lean Accounting, and Activity Analysis
Ex. 27–17 (FIN MAN); Ex. 12–17 (MAN)
50000
100000
150000
200000
250000
Dollars
Pareto Chart of Quality Activities
CHAPTER 27 Lean Principles, Lean Accounting, and Activity Analysis
Ex. 27–18 (FIN MAN); Ex. 12–18 (MAN)
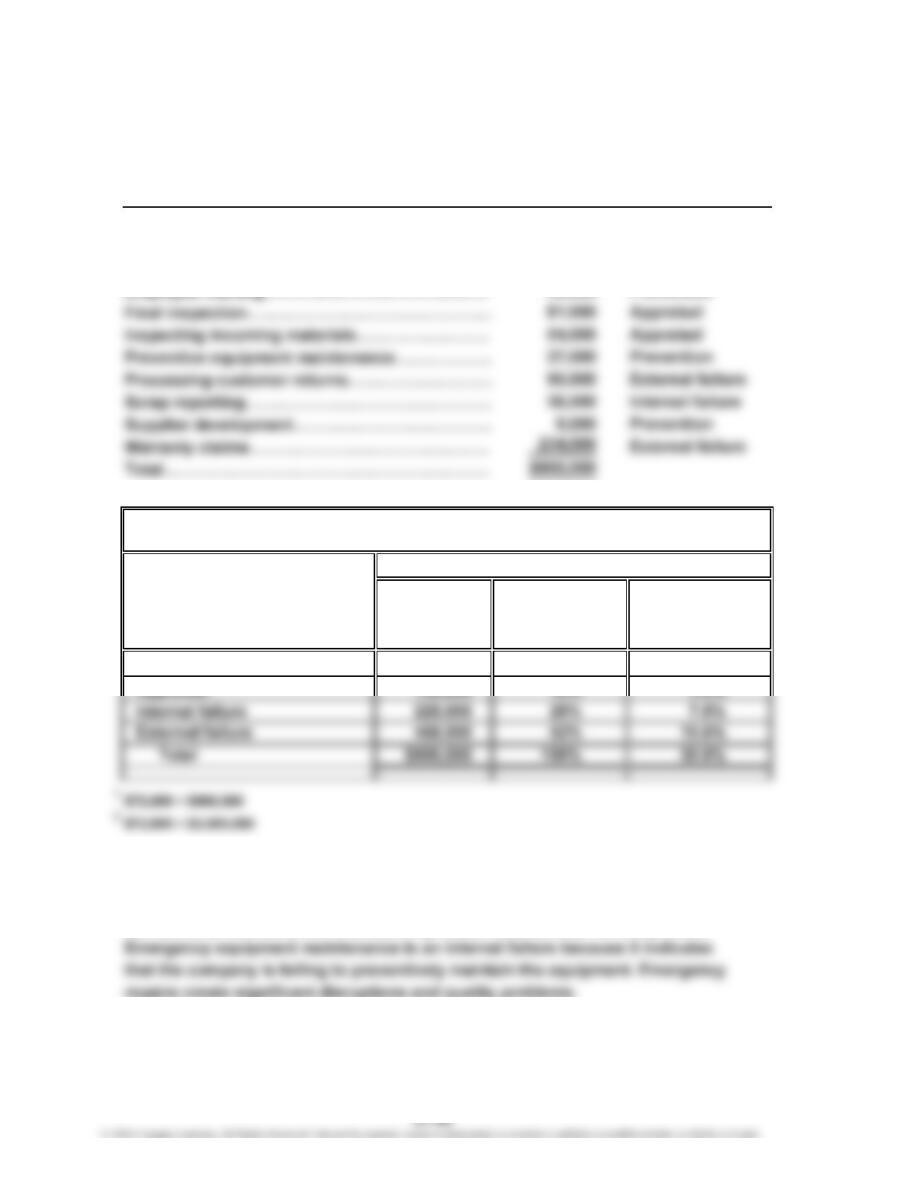
a. Activities classified by cost of quality:
Quality Activities
Correct shipment errors……………………………
…
Disposing of scrap…………………………………
…
Emergency equipment maintenance……………
…
Employee training……………………………………
…
b.
Quality
Cost
Prevention $ 72,000 8% 2.4%
Appraisal 135,000 15% 4.5%
c. The majority of the company’s quality efforts are in correcting quality problems.
This is evident by the high percentage of quality costs associated with internal and
external failure (25% + 52% = 77% of total quality costs). The highest cost activities
are warranty claims, which indicates significant field failures for the product.
Quality Cost Classification
SILICON SOLUTIONS
Cost of Quality Report
Cost Summary
Percent
of Total
Sales
Percent of
Total
Quality Cost
Quality Cost
Activity Cost Classification
$144,000 External failure
90,000 Internal failure
99,000 Internal failure
36,000 Prevention
21
…
…
…
…
…