An asterisk (*) will appear to the right of an incorrect entry. The essay answer will not be graded.
Enter a zero in cells you would otherwise leave blank.
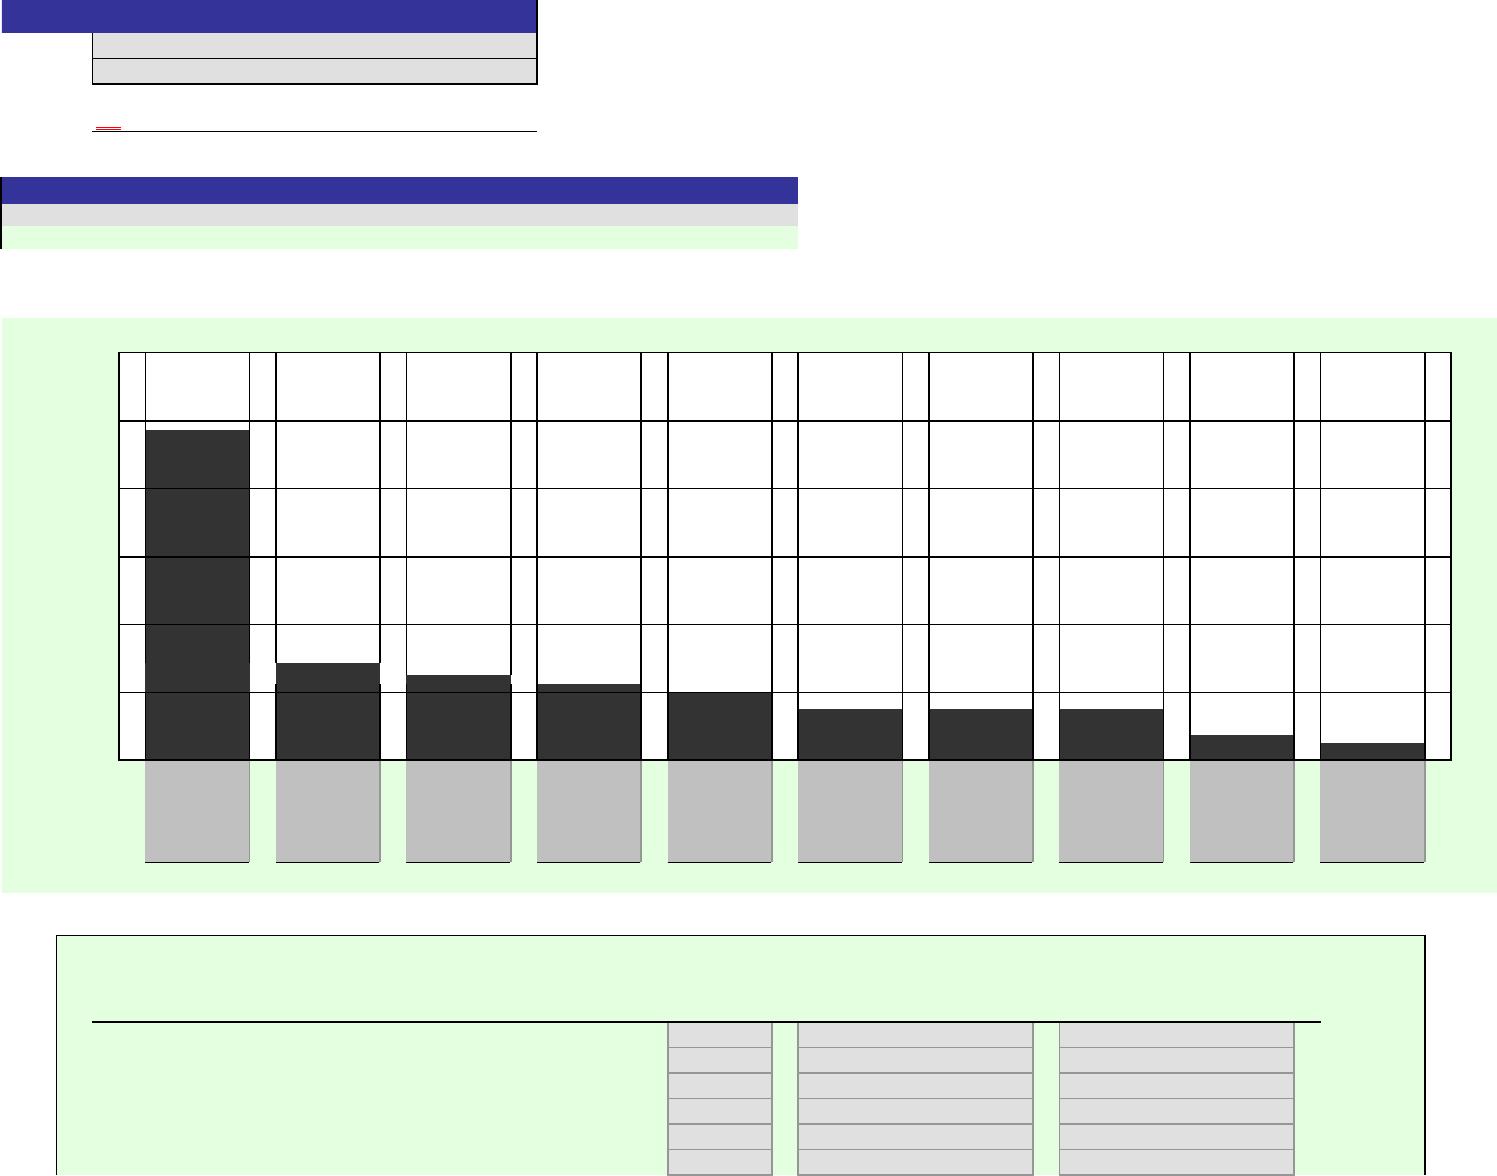
In the chart, choose the correct title for each bar.
1.
2.
Activity
Quality Activities Cost
Correcting invoice errors
Disposing of incoming materials with poor quality
Disposing of scrap
Expediting late production
Final inspecting
Inspecting incoming materials
Cells with non-gray backgrounds are protected and cannot be edited.
0%
[Key code here]
Answers are entered in the cells with gray backgrounds.
Score:
Key Code:
Instructions
Problem 27(13)-4B
Name:
Section:
Pareto Chart⎯Department Activities
$120,000
Value-Added/
Cost of Quality
Classification
Non-Value-Added
Classification
$80,000
$60,000
$0
$100,000
$40,000
$20,000
Inspecting work in process
Preventive machine maintenance
Producing product
Responding to customer quality complaints
Total
3. Percent of
Quality Cost Activity Total
Classification Cost Department Cost
Prevention
Appraisal
Internal failure
External failure
Not a cost of quality
Total
4. Percent of
Activity Total
Cost Department Cost
Value-added
5.
[Key essay answer here]
An asterisk (*) will appear to the right of an incorrect entry. The essay answer will not be graded.
Enter a zero in cells you would otherwise leave blank.
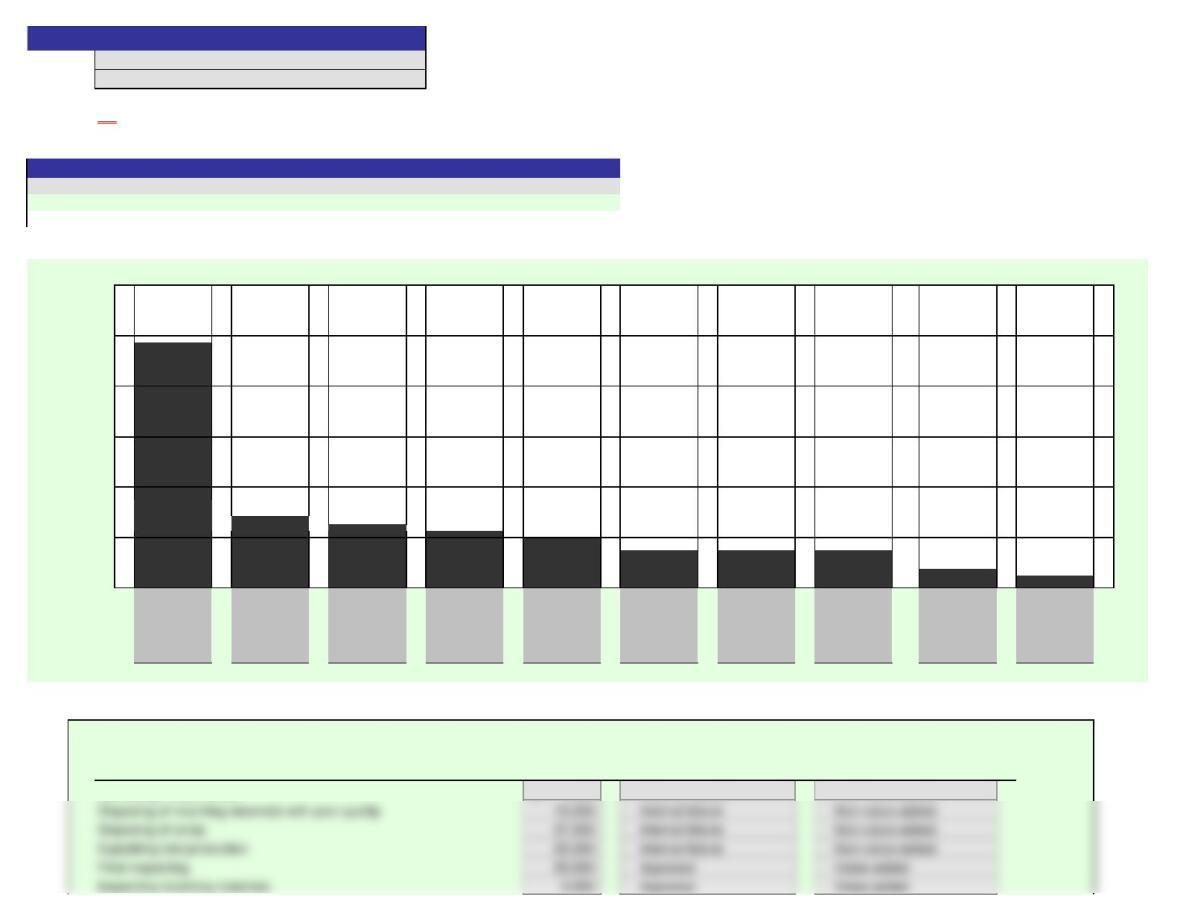
In the chart, choose the correct title for each bar.
1.
Producing
product
Disposing
scrap
Inspecting
work in
process
Expediting
late
production
Final
inspecting
Disposing
incoming
materials with
poor quality
Preventive
machine
mainten-ance
Responding
to customer
complaints
Correcting
invoice errors
Inspecting
incoming
materials
2.
Activity
Quality Activities Cost
ON
Score:
$100,000
$120,000
Instructions
Answers are entered in the cells with gray backgrounds.
Cells with non-gray backgrounds are protected and cannot be edited.
Problem 27(13)-4B
Name:
Solution
Section:
Value-Added/
Non-Value-Added
Classification
Pareto Chart⎯Department Activities
$0
$20,000
$40,000
$80,000
$60,000
Cost of Quality
Classification
3. Percent of
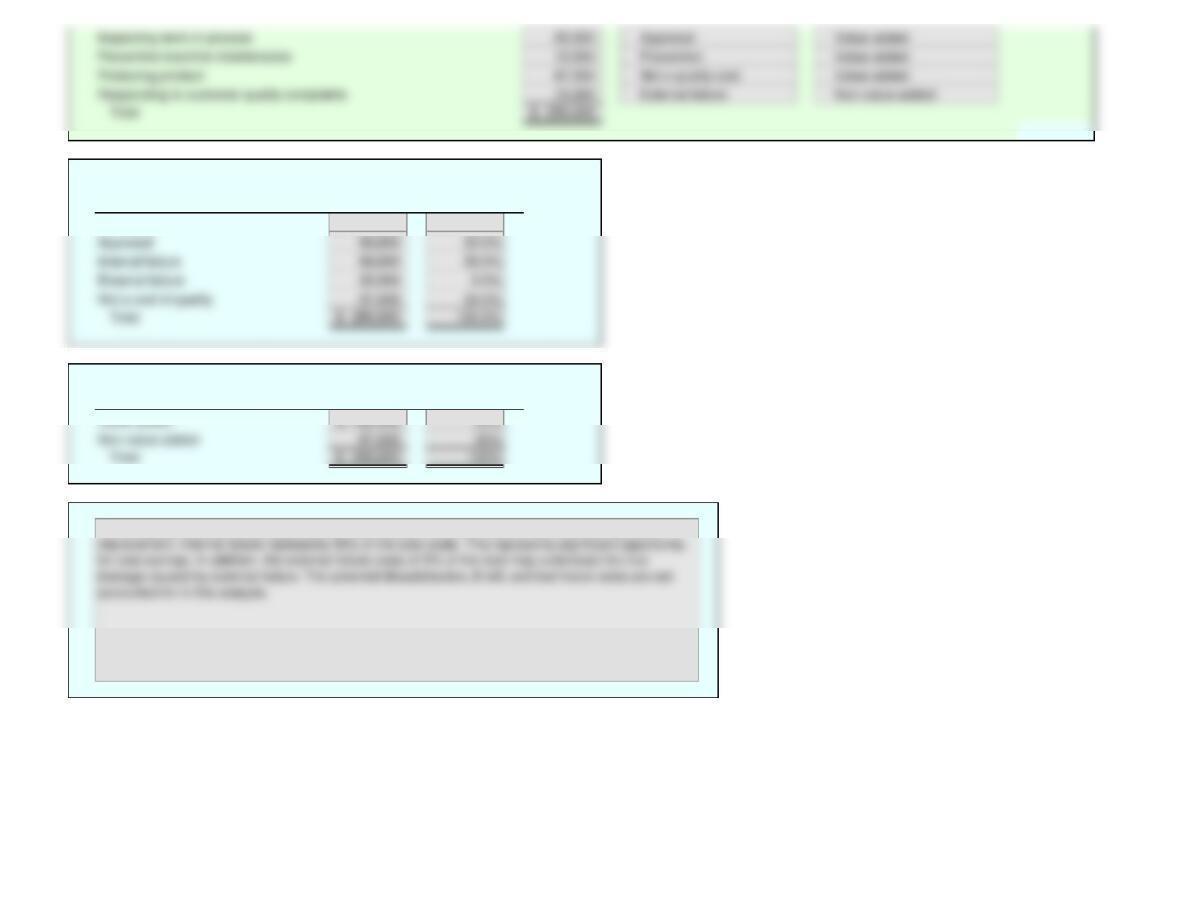
Quality Cost Activity Total
Classification Cost Department Cost
Prevention 15,000$ 6.0%
4. Percent of
Activity Total
Cost Department Cost
5.
The company has 65% of its total costs as value-added. However, there is still room for significant