CHAPTER 26 Capital Investment Analysis
Prob. 26–3A (Concluded)
$7,208,500
$8,000,000
*Rounded
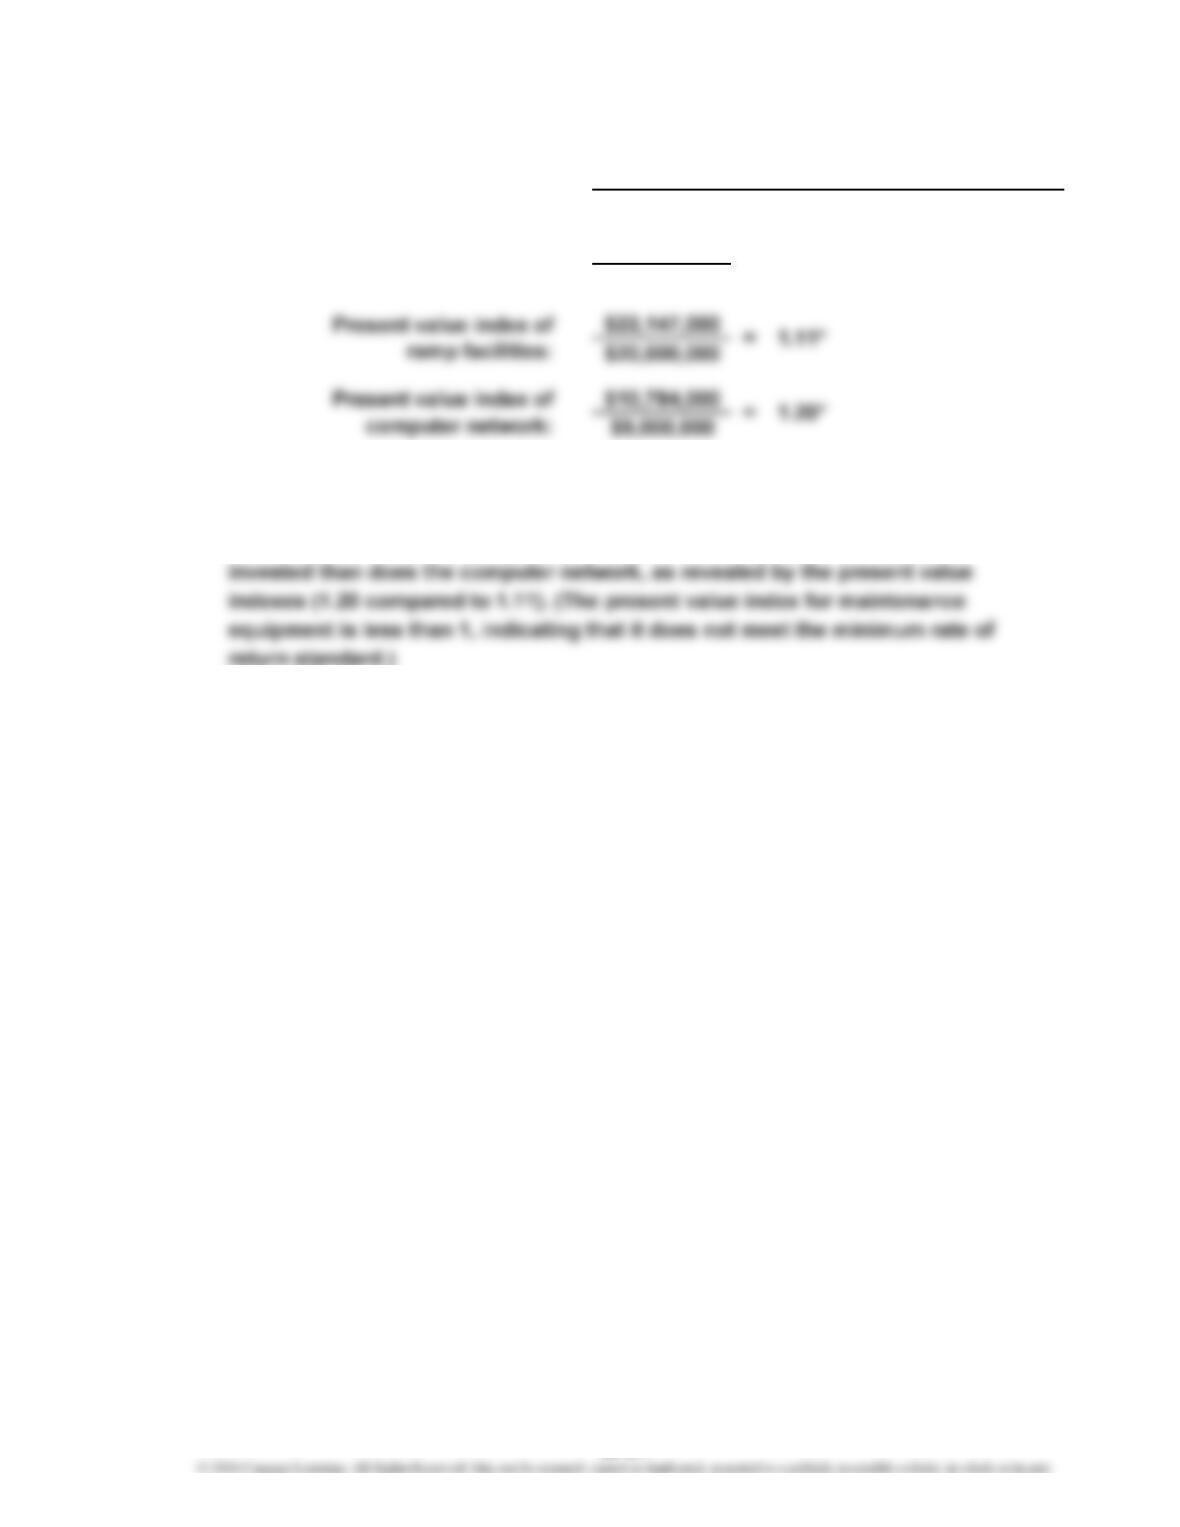
3. The computer network has the largest present value index. Although ramp
facilities has the largest net present value, it returns less present value per dollar
Present Value Index = Total Present Value of Net Cash Flow
Amount to Be Invested
2.
Present value index of
maintenance equipment: = 0.90*
26-21
CHAPTER 26 Capital Investment Analysis
Prob. 26–4A
1. a. Wind Turbines:
Annual net cash flow (at the end of each of 4 years)…………………… $280,000
× Present value of an annuity of $1 at 6% for 4 years (Exhibit 5)……
…
3.465
Biofuel Equipment:
Annual net cash flow (at the end of each of 4 years)…………………… $ 300,000
…
3.465
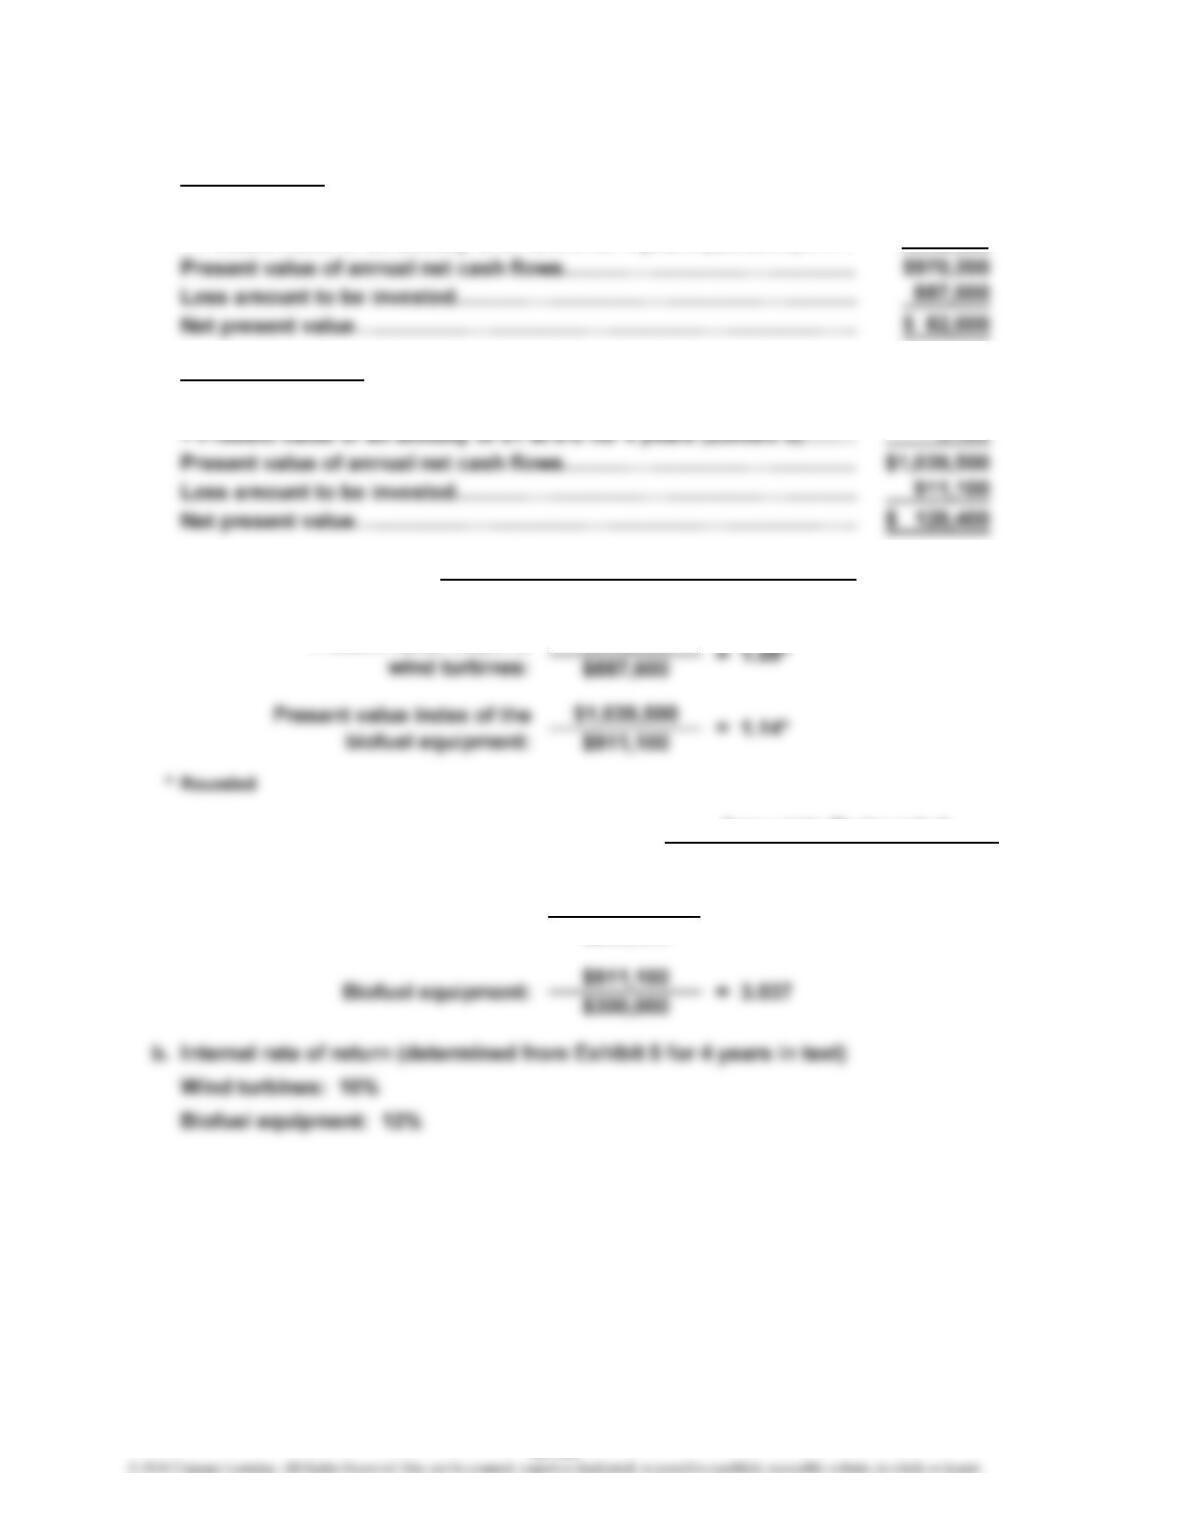
2. Present Value Factor for an Annuity of $1 Amount to Be Invested
Annual Net Cash Flow
a. =
Wind turbines: $887,600 = 3.170
$280,000
b.
Present Value Index =
Present value index of
Total Present Value of Net Cash Flow
Amount to Be Invested
$970,200
26-22
CHAPTER 26 Capital Investment Analysis
Prob. 26–4A (Concluded)
3. The net present value, present value index, and internal rate of return all indicate
that the wind turbines are a better financial opportunity compared to the biofuel
equipment, although both investments meet the minimum return criterion of 6%.
26-23
CHAPTER 26 Capital Investment Analysis
Prob. 26–5A
1. Net present value analysis:
Office Expansion:
Annual net cash flow (at the end of each of 6 years)………………………
…
$125,000
Server Upgrade:
Annual net cash flow (at the end of each of 4 years)………………………
…
$165,000
× Present value of an annuity of $1 at 12% for 4 years (Exhibit 5)………
…
3.037
…
…
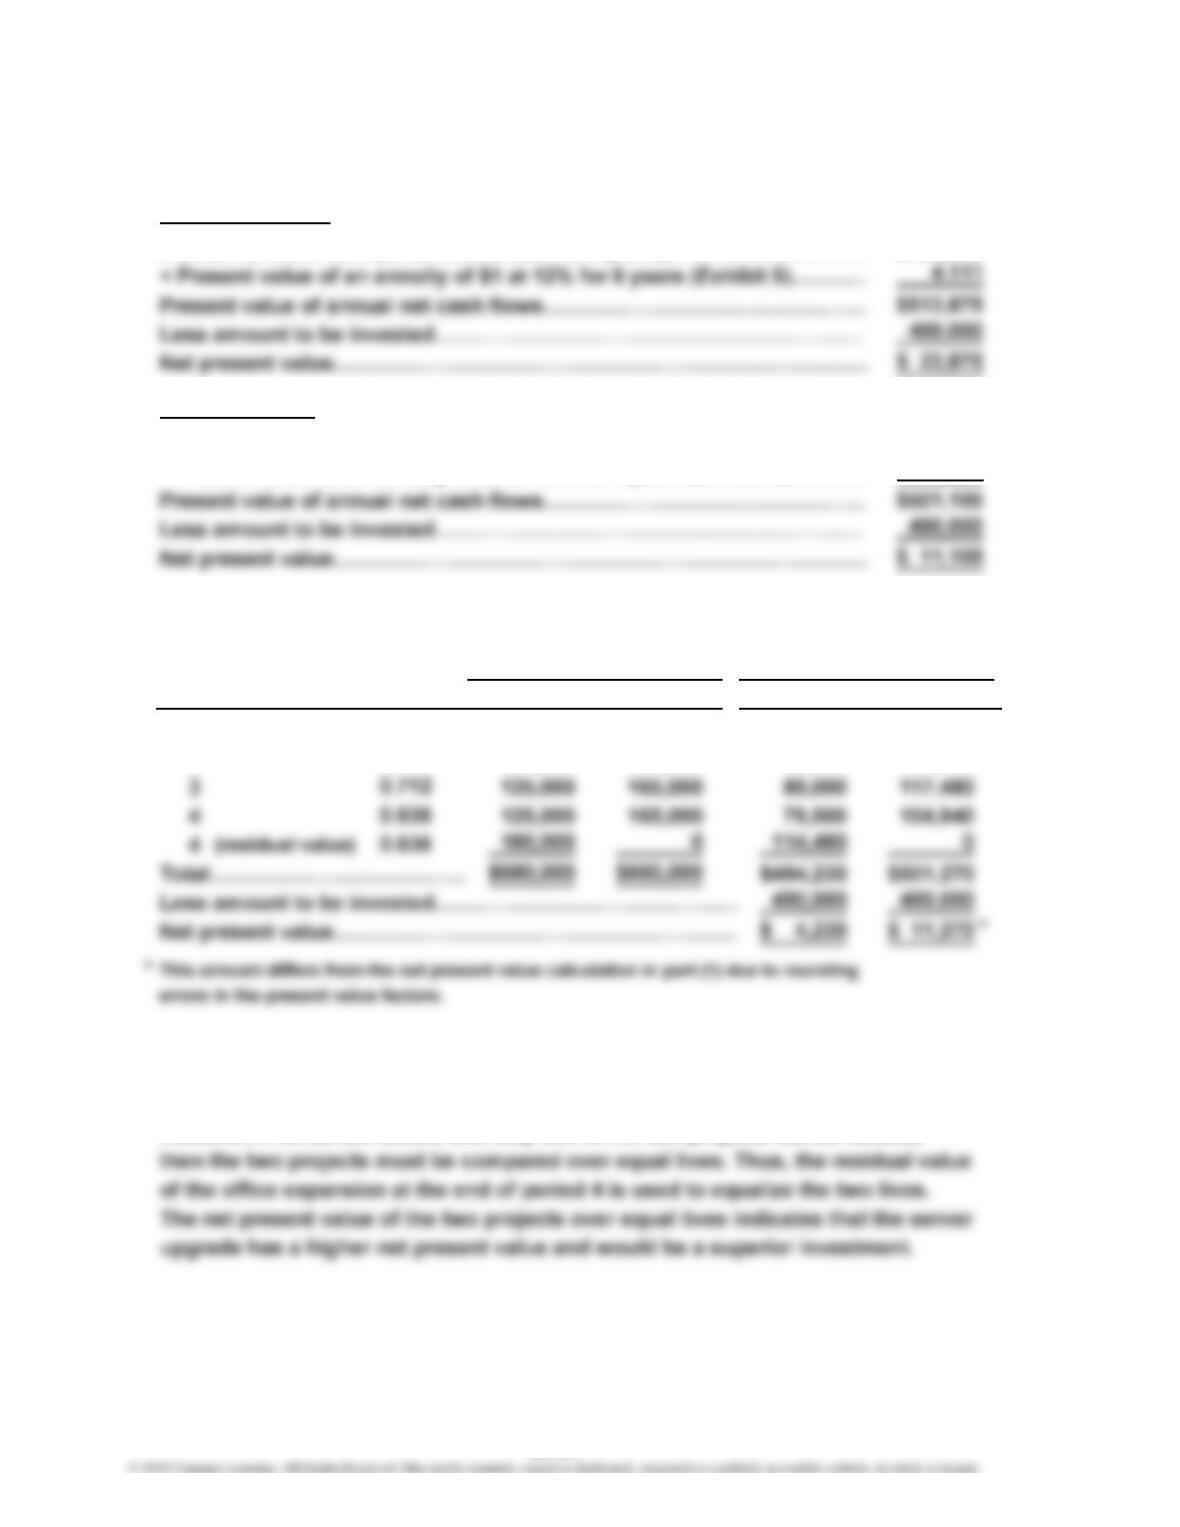
2. Net present value analysis:
Expansion Servers Expansion
1 $125,000 $165,000 $111,625 $147,345
2 125,000 165,000 99,625 131,505
3. To: Investment Committee
Both projects have a positive net present value. This means that both projects
meet our minimum expected return of 12% and would be acceptable investments.
However, if funds are limited and only one of the two projects can be funded,
Net Cash FlowNet Cash Flow
Present Value of
$1 at 12%
Value of
Present
Servers
Year
0.893
0.797
26-24
…
…
…
CHAPTER 26 Capital Investment Analysis
Prob. 26–6A
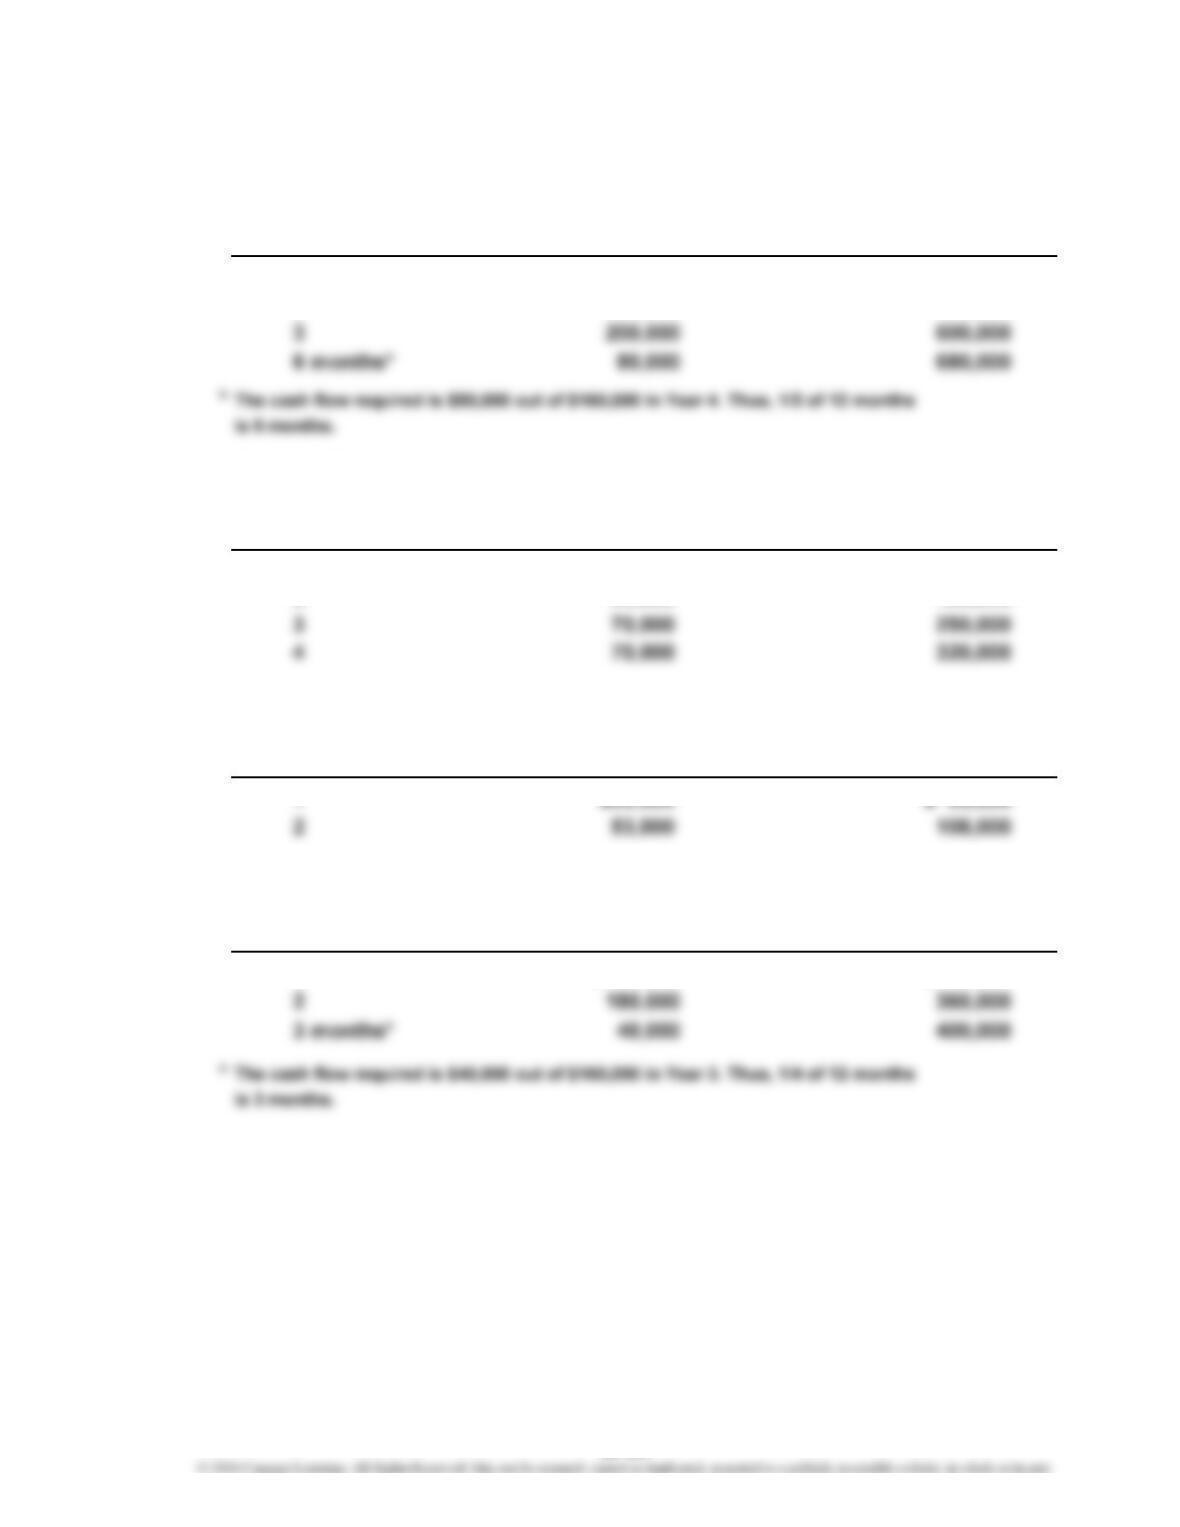
1. Proposal A: 3-year, 6-month cash payback period, as follows:
Net Cash Cumulative
Year Flow Net Cash Flows
1 $200,000 $200,000
2 200,000 400,000
Proposal B: 4-year cash payback period, as follows:
Net Cash Cumulative
Year Flow Net Cash Flows
1 $90,000 $ 90,000
2 90,000 180,000
Proposal C: 2-year cash payback period, as follows:
Net Cash Cumulative
Year Flow Net Cash Flows
1 $55,000 $ 55,000
Proposal D: 2-year, 3-month cash payback period, as follows:
Net Cash Cumulative
Year Flow Net Cash Flows
1 $180,000 $180,000
26-25
CHAPTER 26 Capital Investment Analysis
Prob. 26–6A (Continued)
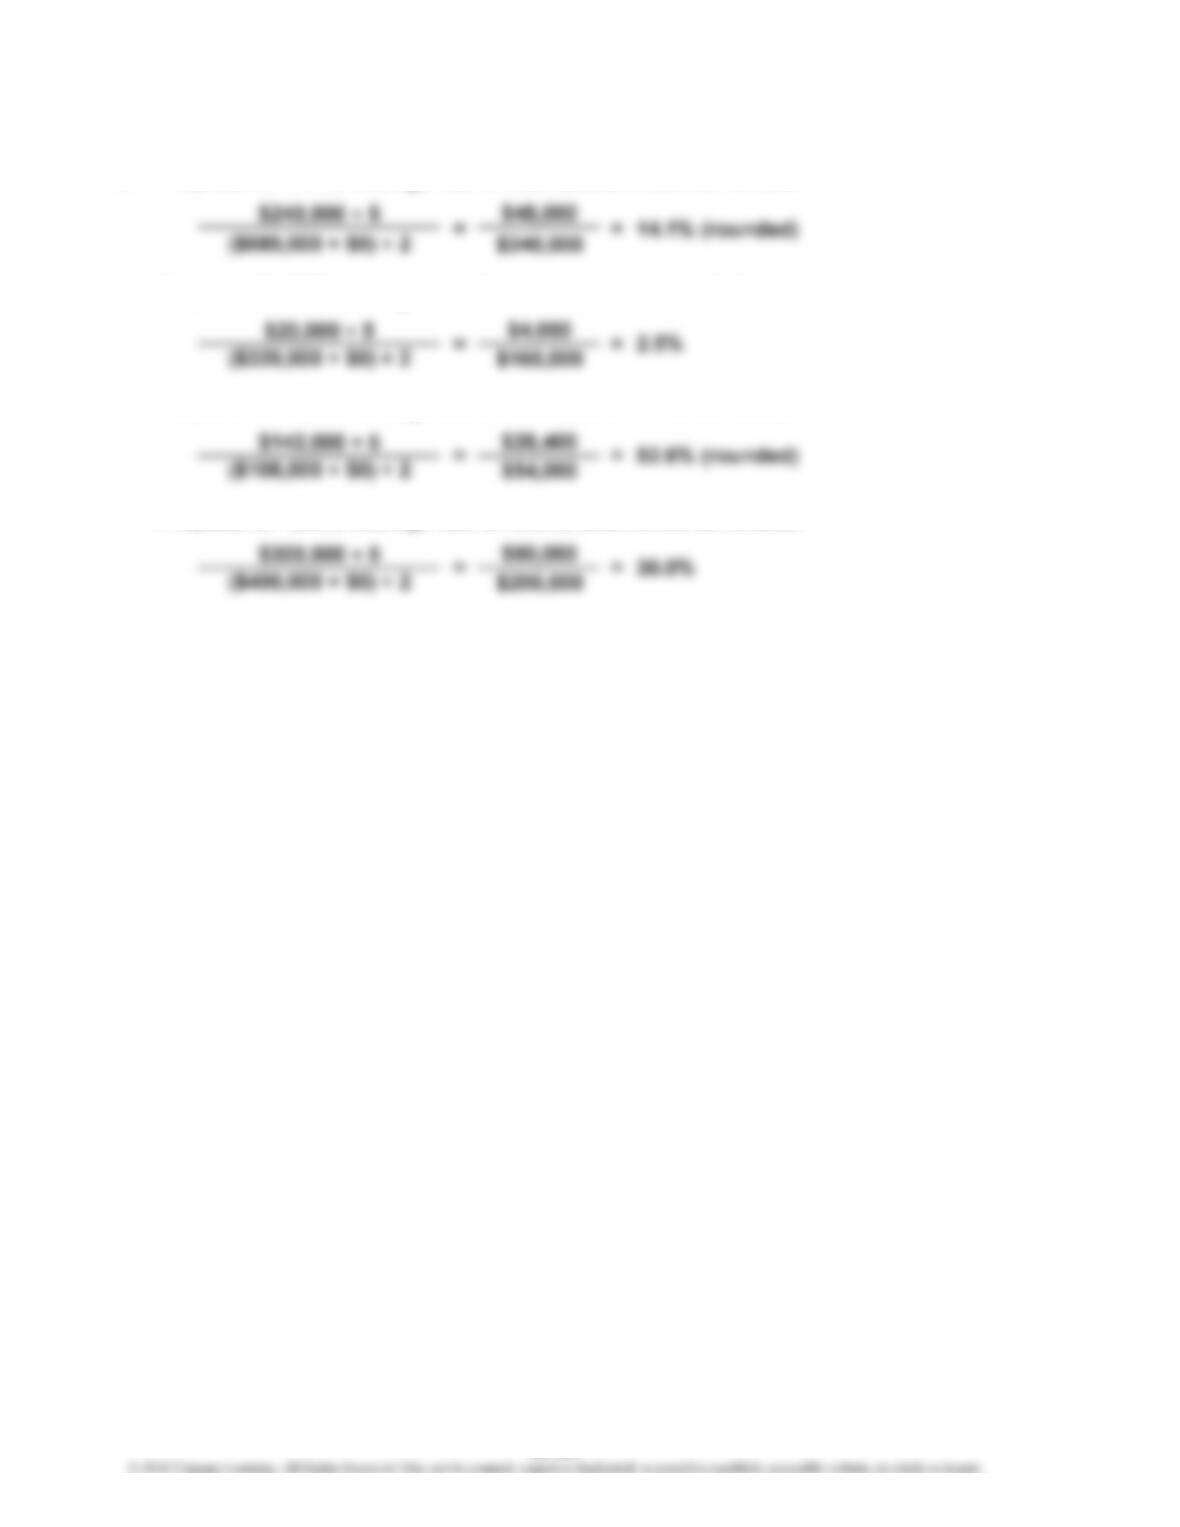
2. Proposal A: 14.1% average rate of return, determined as follows:
Proposal B: 2.5% average rate of return, determined as follows:
Proposal C: 52.6% average rate of return, determined as follows:
Proposal D: 30.0% average rate of return, determined as follows:
26-26
CHAPTER 26 Capital Investment Analysis
Prob. 26–6A (Continued)
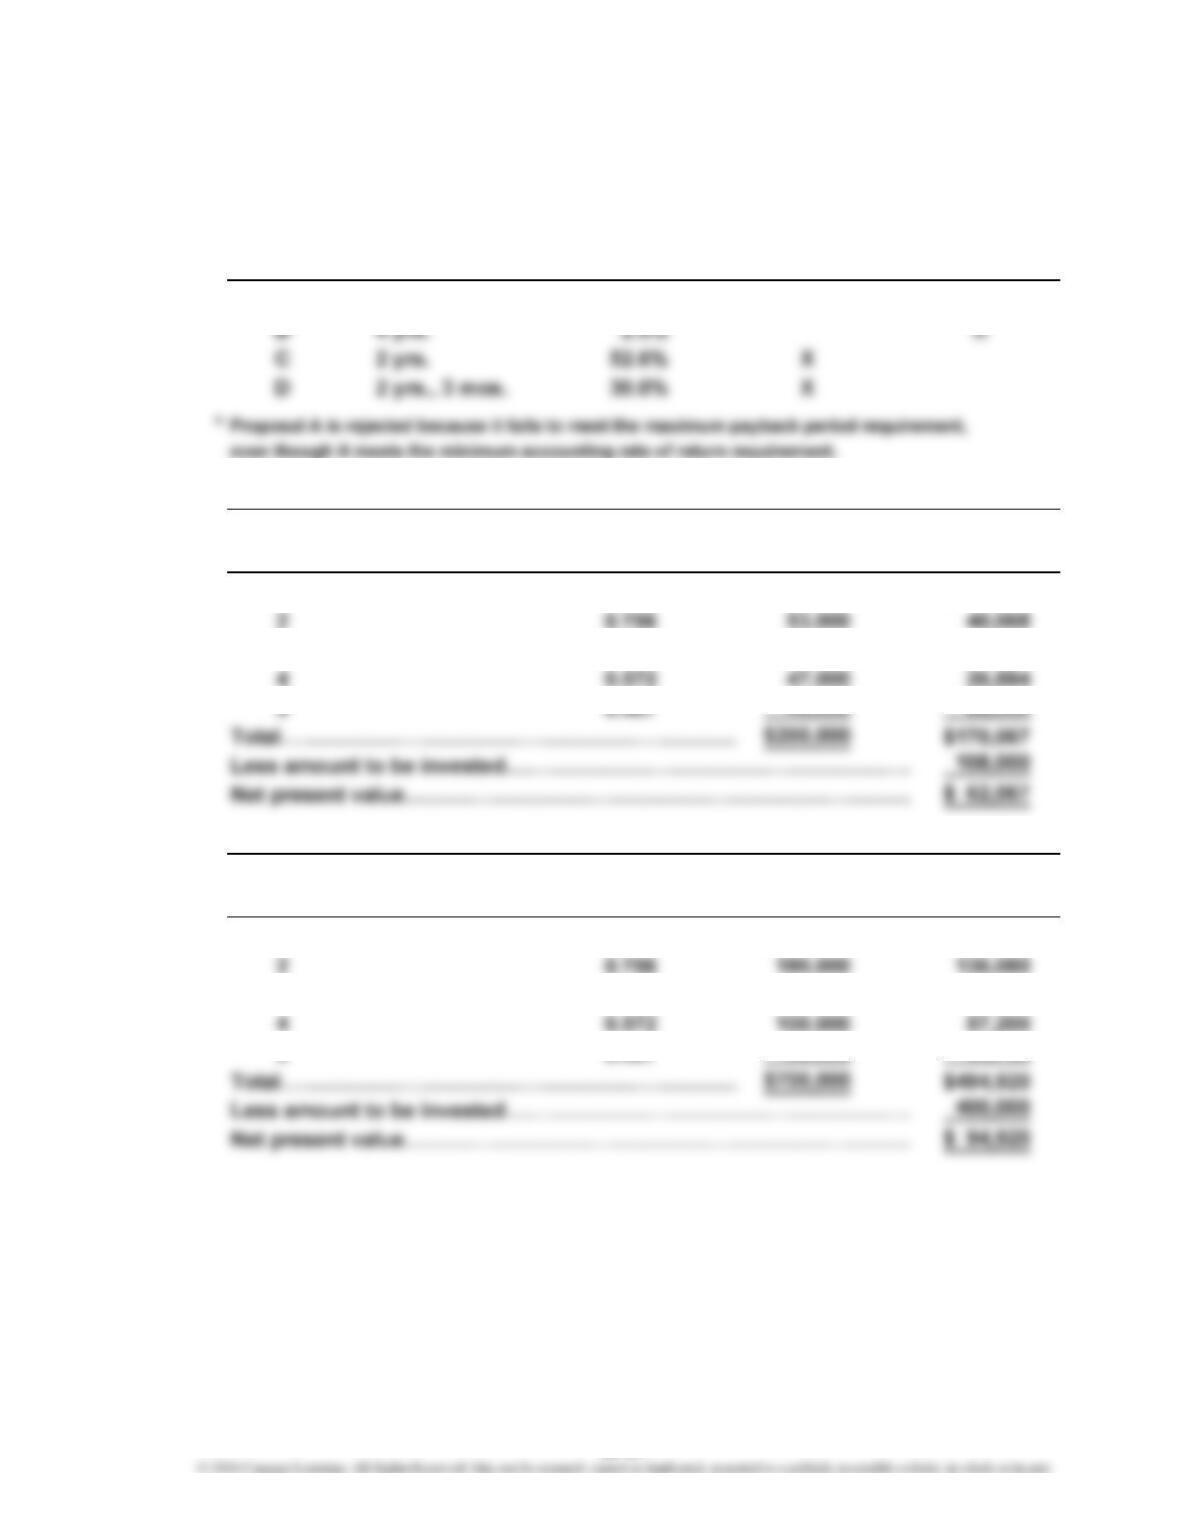
3. Of the four proposed investments, only Proposals C and D meet the company’s
requirements, as the following table indicates:
Cash Payback Average Rate Accept for
Proposal Period of Return Further Analysis Reject
A 3 yrs., 6 mos. 14.1% X*
4.
Present Value Net Cash Present Value of
Year of $1 at 15% Flow Net Cash Flow
1 0.870 $ 55,000 $ 47,850
3 0.658 50,000 32,900
Present Value Net Cash Present Value of
Year of $1 at 15% Flow Net Cash Flow
1 0.870 $180,000 $156,600
3 0.658 160,000 105,280
5 0.497 80,000 39,760
Proposal C
Proposal D
26-27
CHAPTER 26 Capital Investment Analysis
Prob. 26–6A (Concluded)
*Rounded
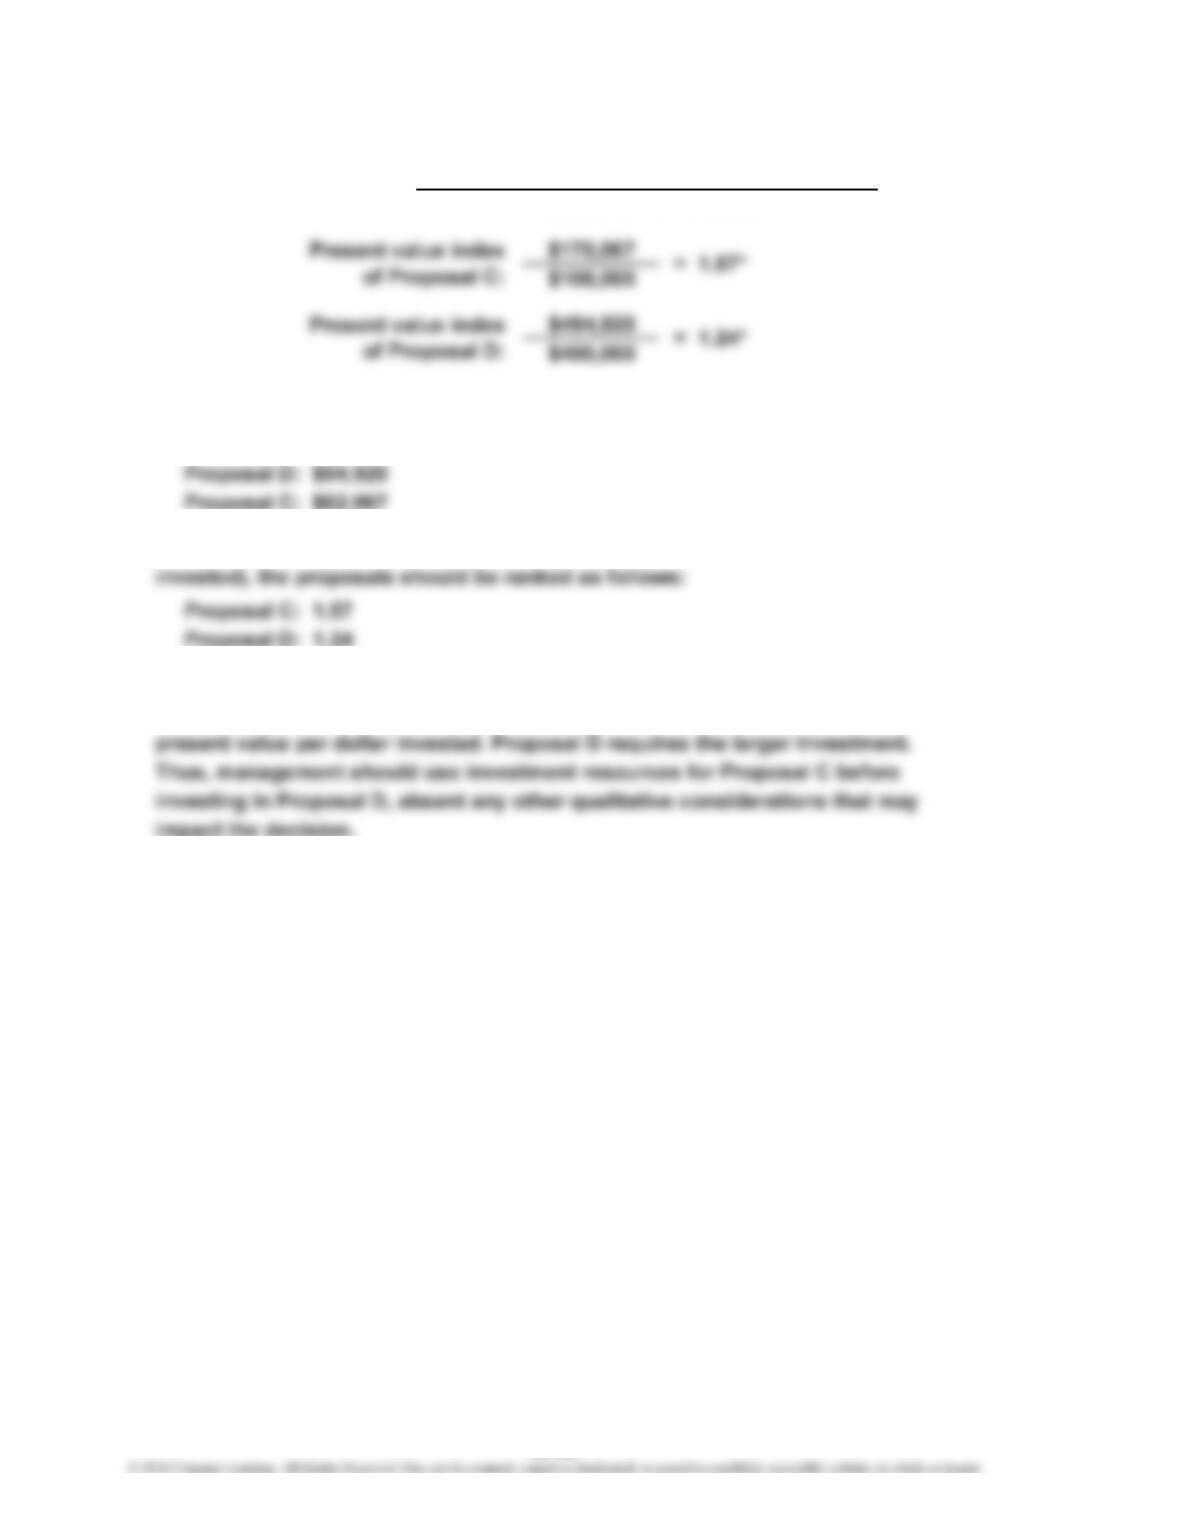
6. Based on the net present value, the proposals should be ranked as follows:
7. Based on the present value index (the amount of present value per dollar
8. The present value indexes indicate that although Proposal D has the larger net
present value, it is not as attractive as Proposal C in terms of the amount of
5.
Present Value Index =
Total Present Value of Net Cash Flow
Amount to Be Invested
26-28
CHAPTER 26 Capital Investment Analysis
Prob. 26–1B
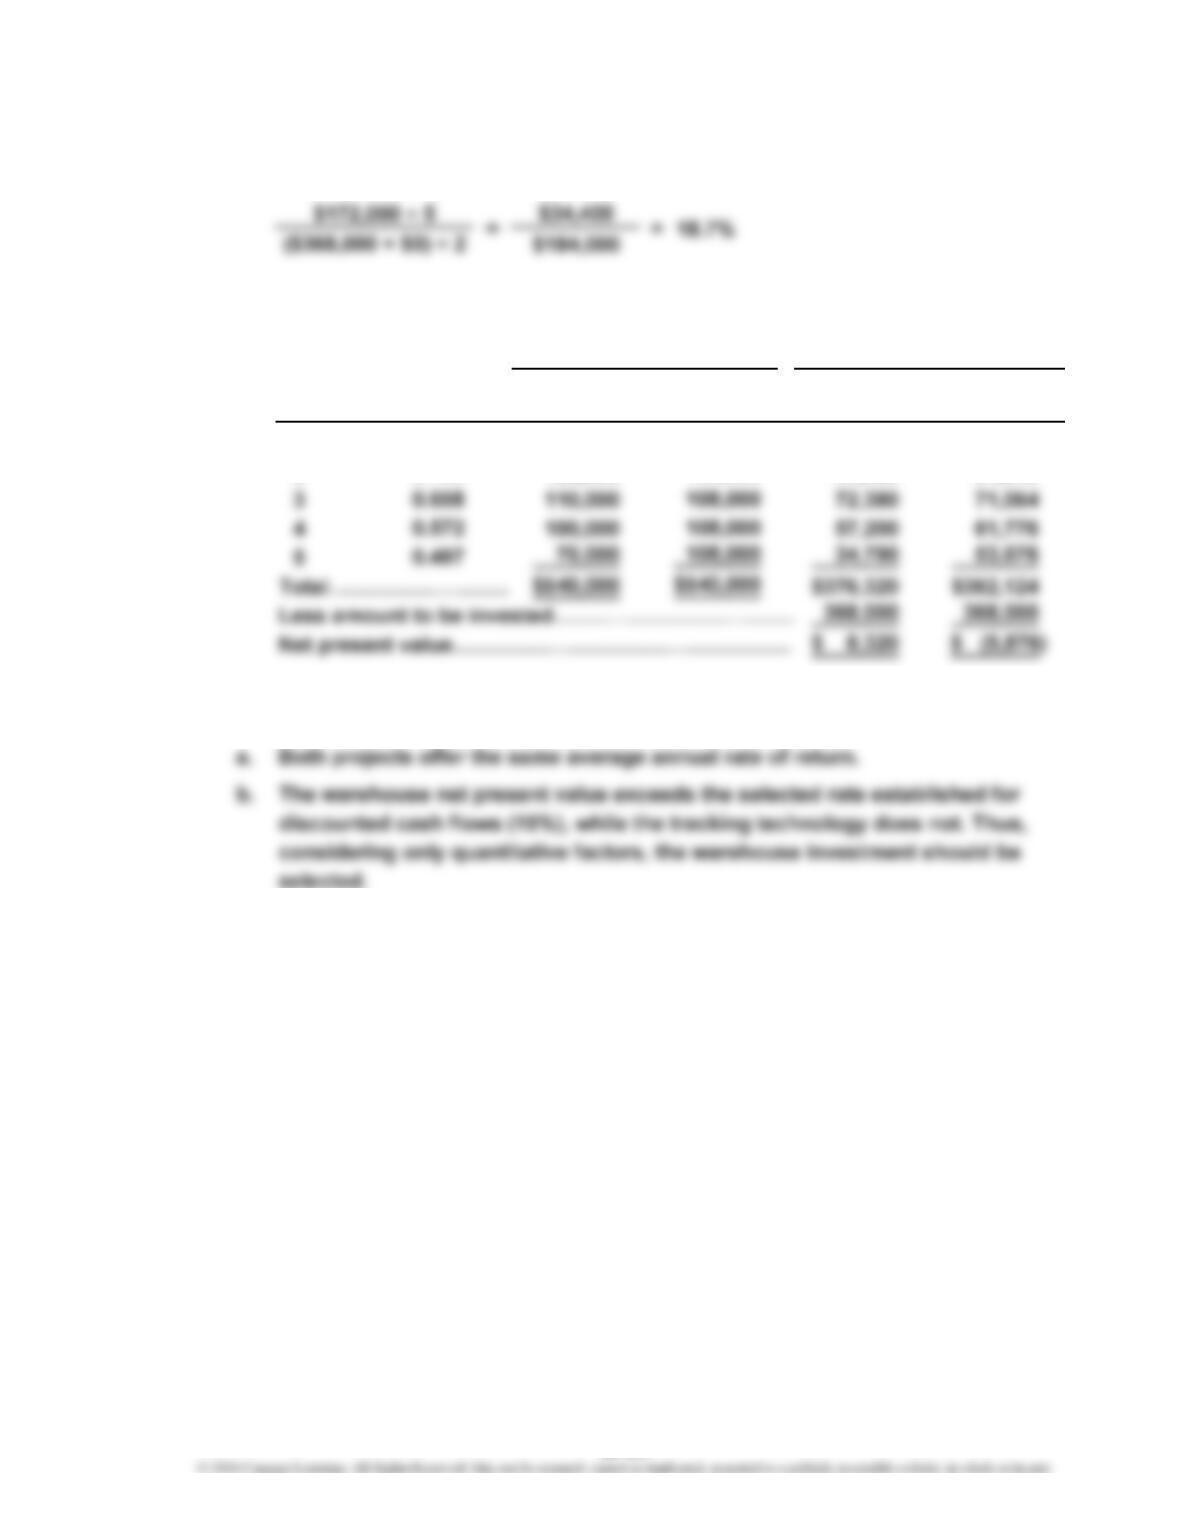
1. a. Average annual rate of return for both projects:
b. Net present value analysis:
Year Warehouse Warehouse
1 $135,000 $117,450 $ 93,960
2 125,000 94,500 81,648
2. The report to the capital investment committee can take many forms. The
report should, as a minimum, present the following points:
$108,000
0.756
108,000
$1 at 15%
Value of
Present
0.870
Present Value of
Tracking
Technology
Net Cash FlowNet Cash Flow
Technology
Tracking
26-29
CHAPTER 26 Capital Investment Analysis
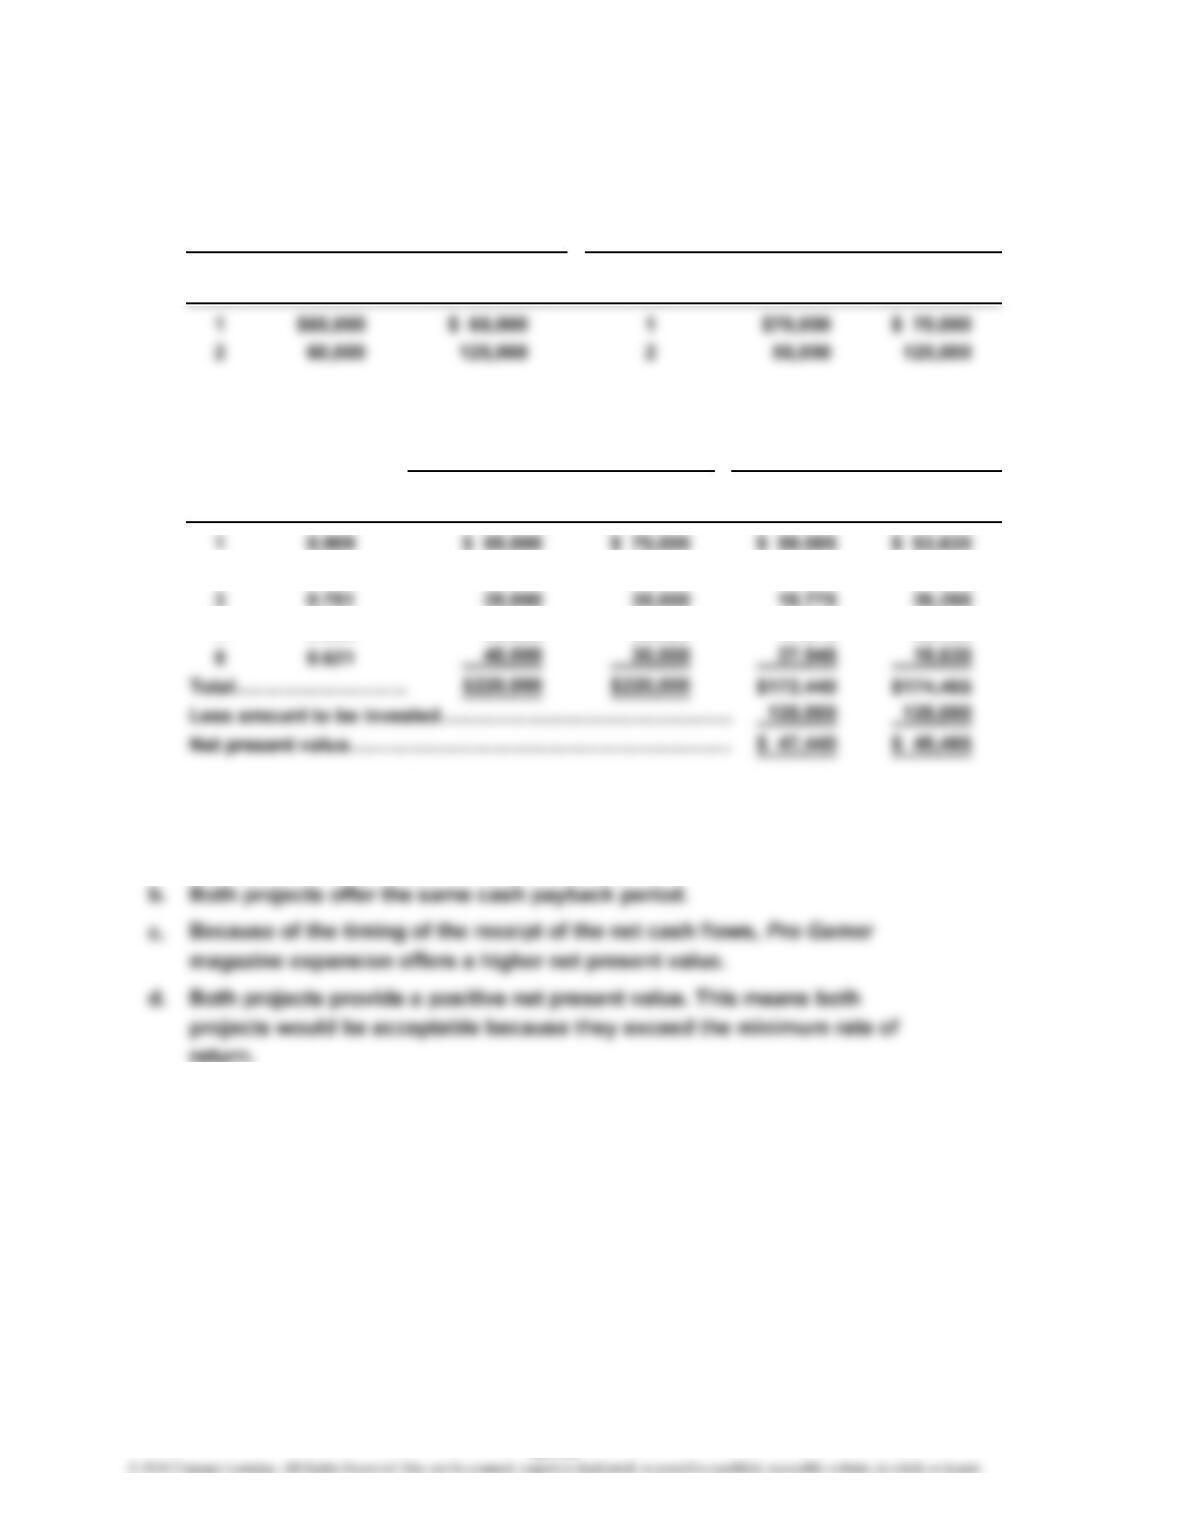
Prob. 26–2B
1. a. Cash payback period for both projects: 2 years (the year in which
accumulated net cash flows equal $125,000), shown as follows:
Net Cash Cumulative Net Cash Cumulative
Year Flow Net Cash Flow Year Flow Net Cash Flow
b. Net present value analysis:
Present
Value of Sound Pro Sound Pro
Year $1 at 10% Cellar Gamer Cellar Gamer
2 0.826 60,000 55,000 49,560 45,430
4 0.683 25,000 30,000 17,075 20,490
2. The report can take many forms and should include, as a minimum, the
following points:
a. Both projects offer the same total net cash flow.
Sound Cellar
Net Cash FlowNet Cash Flow
Present Value of
Pro Gamer
26-30
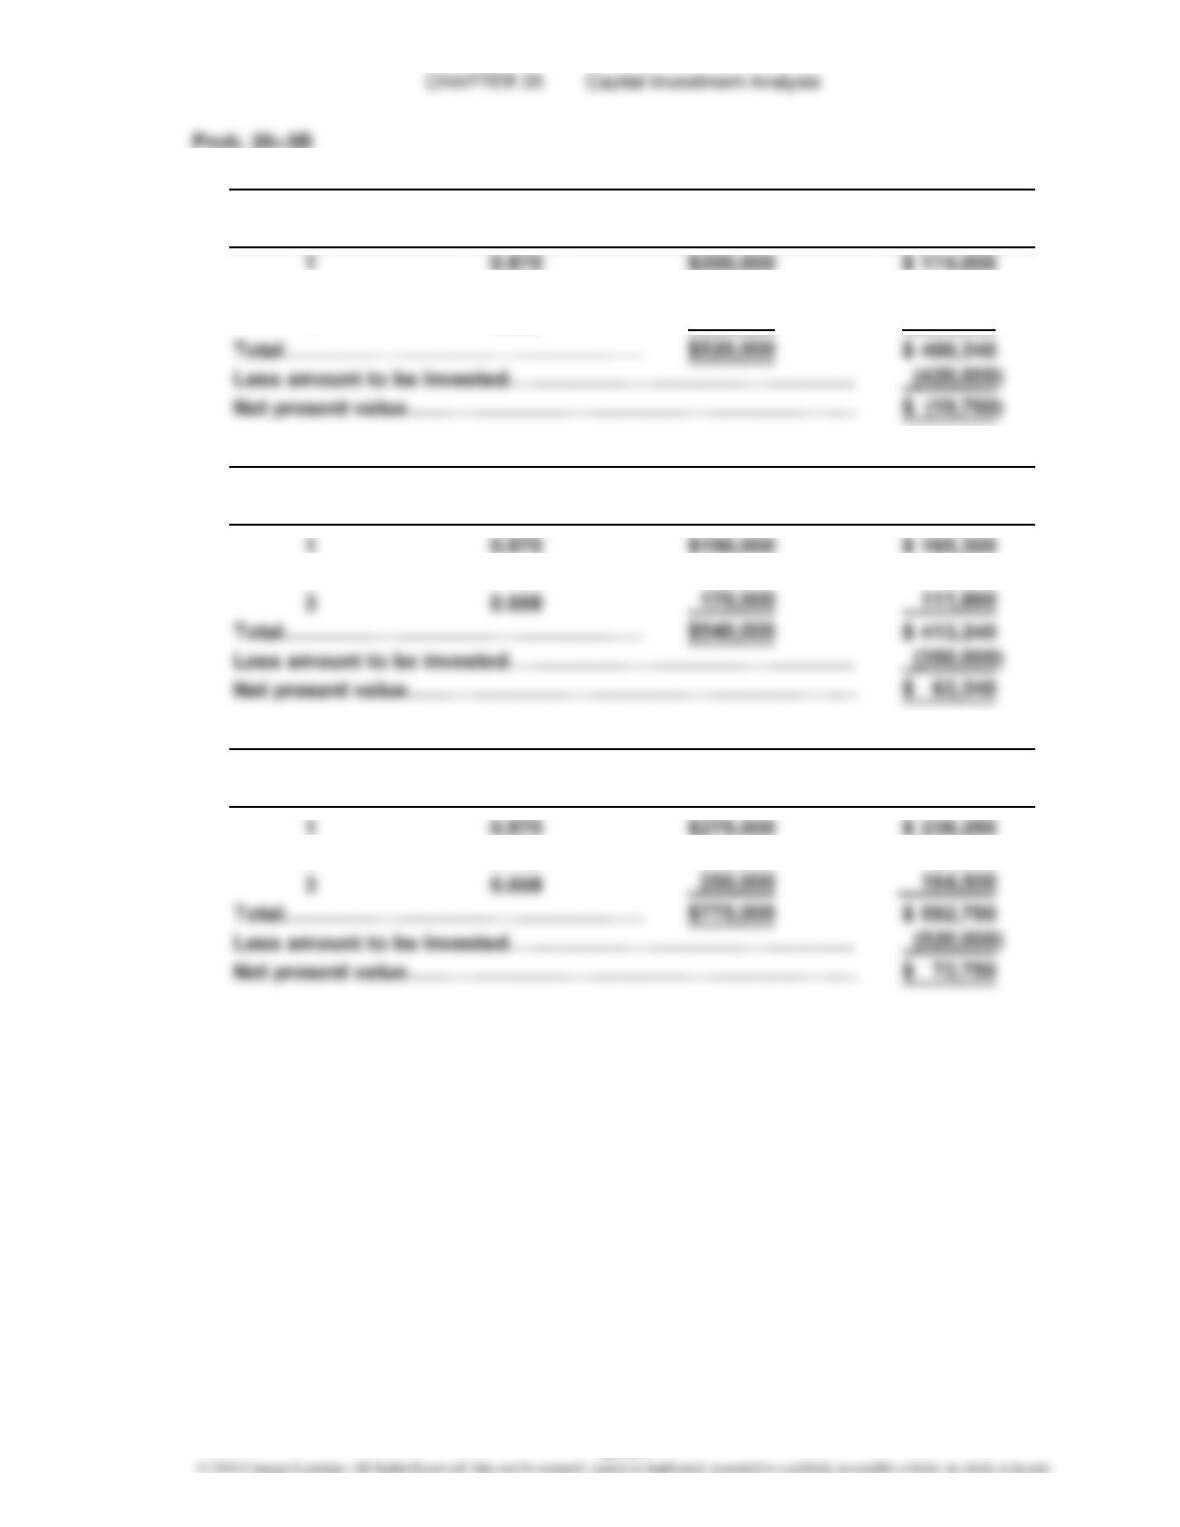
1.
Present Value Net Cash Present Value of
Year of $1 at 15% Flow Net Cash Flow
2 0.756 160,000 120,960
3 0.658 160,000 105,280
Present Value Net Cash Present Value of
Year of $1 at 15% Flow Net Cash Flow
2 0.756 180,000 136,080
Present Value Net Cash Present Value of
Year of $1 at 15% Flow Net Cash Flow
2 0.756 250,000 189,000
Computer System Upgrade
ATM Kiosk Expansion
Branch Office Expansion
26-31
CHAPTER 26 Capital Investment Analysis
Prob. 26–3B (Concluded)
$400,240
$420,000
*Rounded
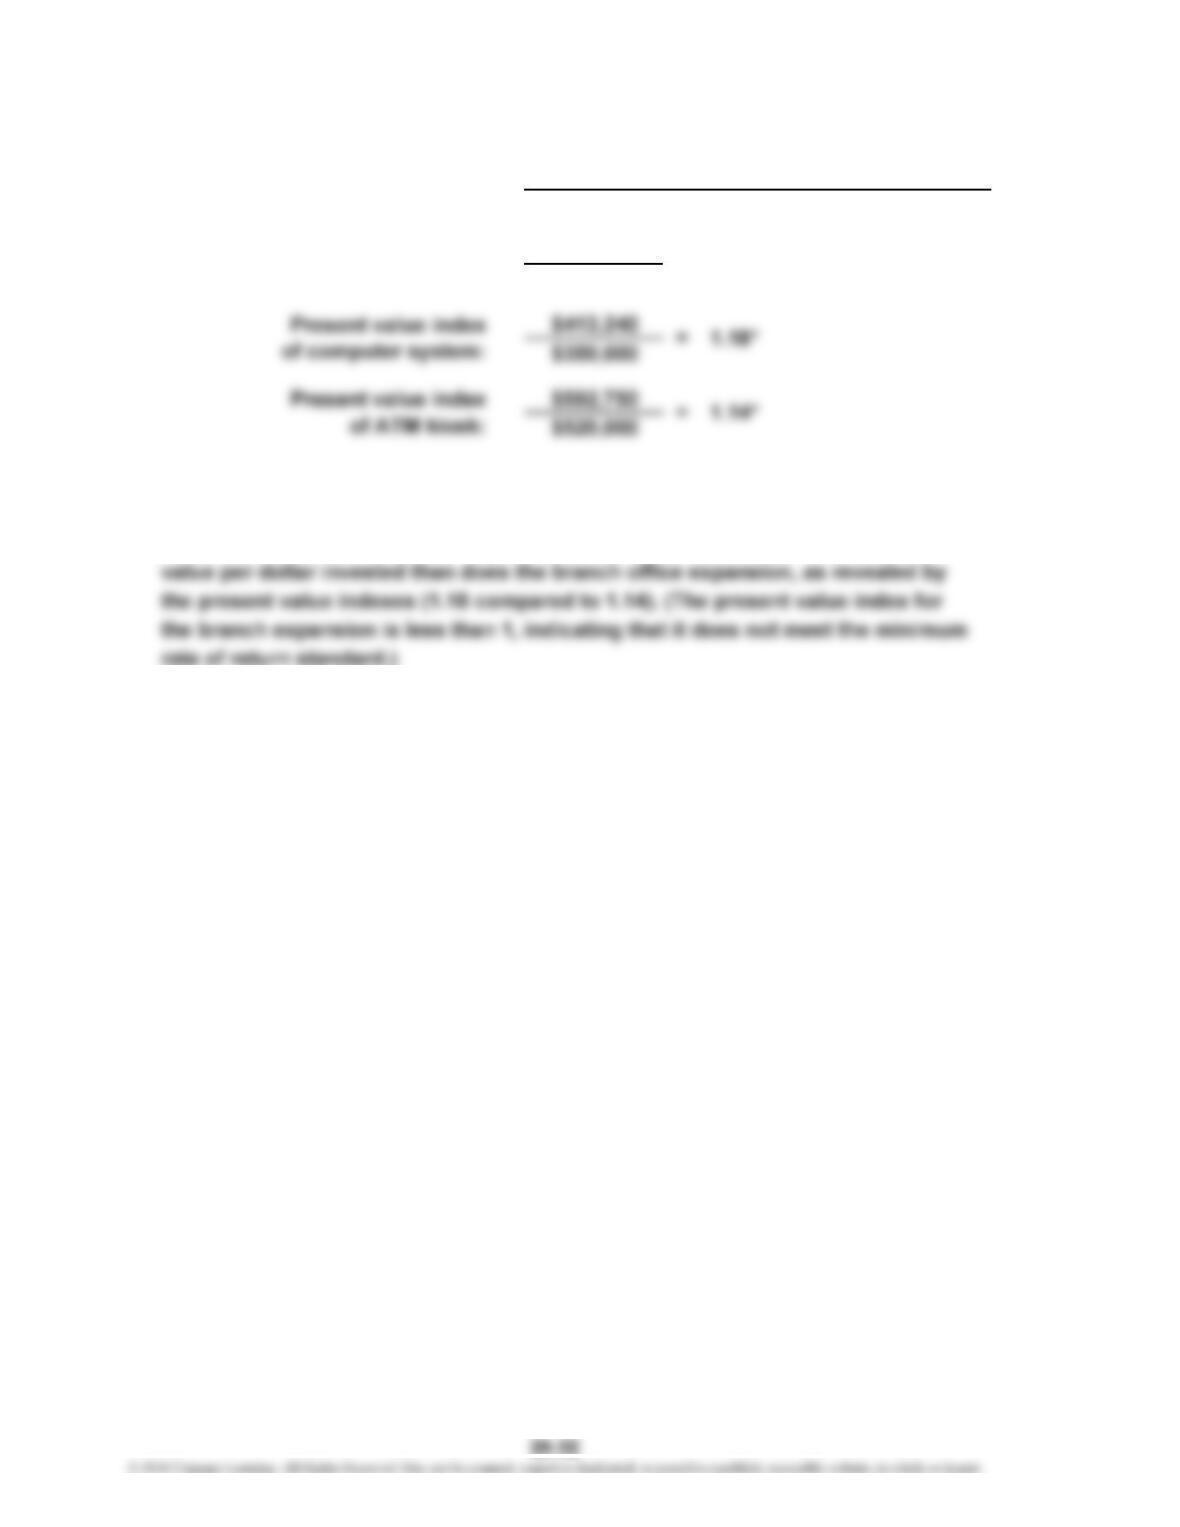
3. The computer system upgrade has the largest present value index. Although the
ATM kiosk expansion has the largest net present value, it returns less present
Present Value Index = Total Present Value of Net Cash Flow
Amount to Be Invested
2.
Present value index
of branch office: = 0.95*