CHAPTER 26 Cost Allocation and Activity-Based Costing
Ex. 26–15 (FIN MAN); Ex. 11–15 (MAN) (Concluded)
Note to Instructors: If you assigned both Ex. 26–14 and Ex. 26–15, then you can make
the following observations:
The activity-based costing approach provides unit factory overhead cost information
that is opposite to that of the multiple production department factory overhead rate
method. The reason is that the multiple production department factory overhead rate
CHAPTER 26 Cost Allocation and Activity-Based Costing
Ex. 26–16 (FIN MAN); Ex. 11–16 (MAN)
a.
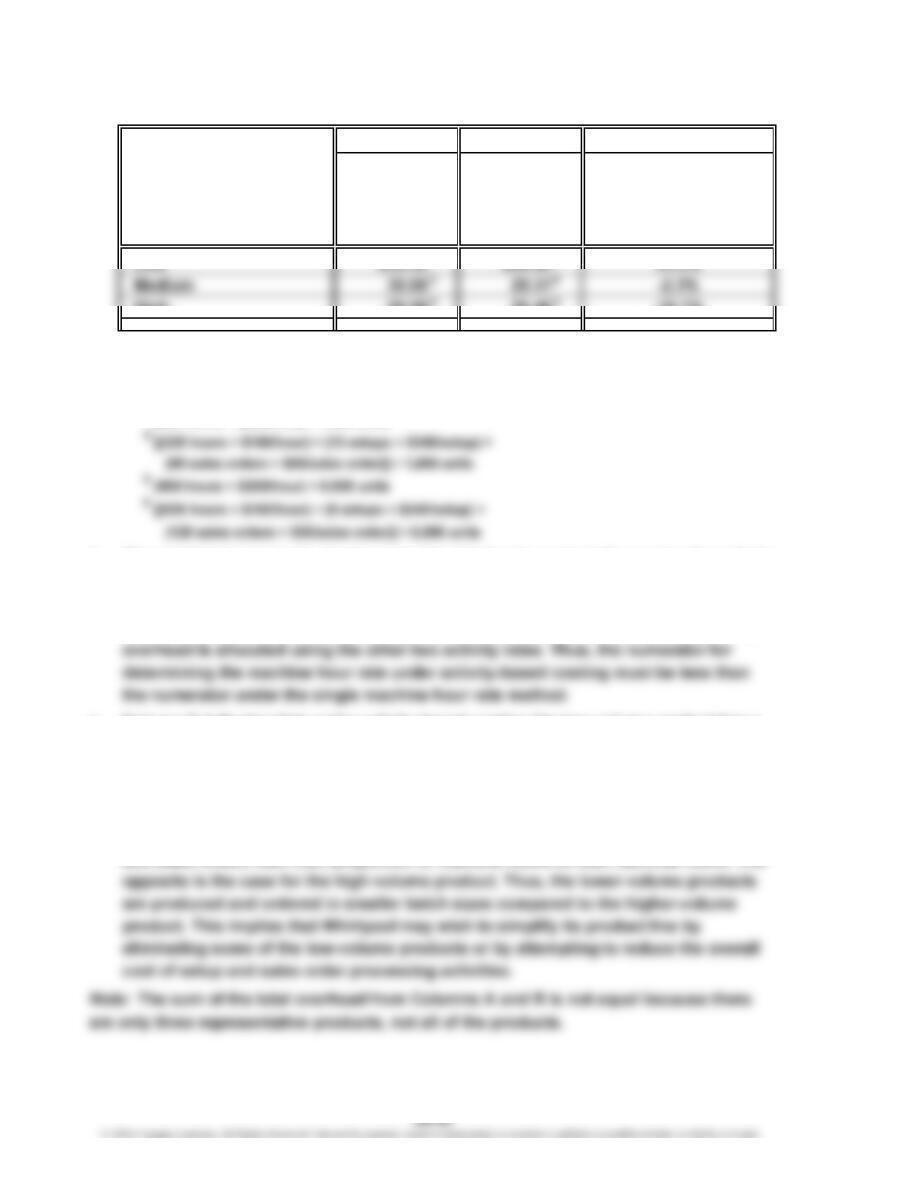
Column A Column B Column C
Single Rate
Overhead ABC Overhead Percent Change
Allocation Allocation in Allocation
Product Volume Class per Unit per Unit (Col. B – Col. A) ÷ Col. A
High 30.00 25.46 -15.1%
1
(24 hours × $200/hour) ÷ 160 units
2
[(24 hours × $160/hour) + (14 setups × $240/setup) +
(38 sales orders × $55/sales order)] ÷ 160 units
3
(225 hours × $200/hour) ÷ 1,500 units
5
b. The machine hour rate is greater under the single rate method than under the activity-
based method because all the factory overhead is allocated by machine hours under
the single rate method. However, only a portion of the factory overhead is allocated
under the machine rate method using activity-based costing. The remaining factory
c. Column C indicates that under activity-based costing the low-volume product has a
higher per-unit cost than calculated under the single rate method. In contrast, under
activity-based costing the high-volume product has a lower per-unit cost than
calculated under the single rate method. This result will occur when there are activitie
s
that occur in proportions different from their volumes. In this case, lower-volume
products have setups and sales orders occurring in higher proportions of total setups
and sales orders than their proportion of machine hours to total machine hours. The
12
CHAPTER 26 Cost Allocation and Activity-Based Costing
Ex. 26–17 (FIN MAN); Ex. 11–17 (MAN)
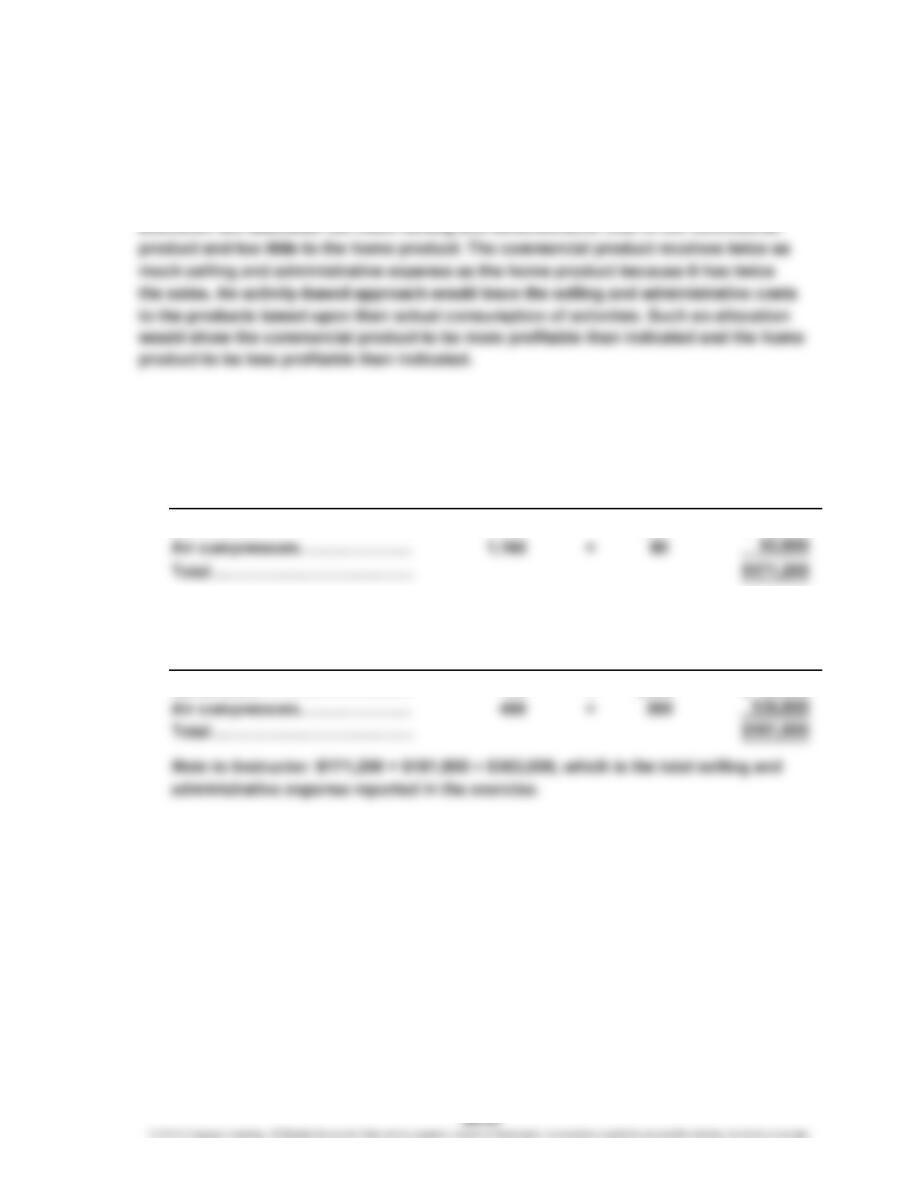
The selling and administrative expenses should not be allocated on the basis of relative
sales dollars. The two product lines have very different attributes. The commercial
product is relatively inexpensive to sell, while the home product has a number of
additional costs associated with it. As a result, the relative sales dollar method of
Ex. 26–18 (FIN MAN); Ex. 11–18 (MAN)
a. Sales order processing activities:
Number of Activity Activity
Sales Orders × Rate =Cost
Generators………………………
…
980 × $80 $ 78,400
…
Post-sale customer service activities:
Number of Activity Activity
Service Requests × Rate =Cost
Generators………………………
…
150 × $300 $ 45,000
…
CHAPTER 26 Cost Allocation and Activity-Based Costing
Ex. 26–18 (FIN MAN); Ex. 11–18 (MAN) (Concluded)
b.
Air
Generators Compressors Total
Revenues $2,000,000 $1,400,000 $3,400,000
Cost of goods sold 1,400,000 980,000 2,380,000
Total selling and
administrative expense $ 123,400 $ 229,600 $ 353,000
Income from operations $ 476,600 $ 190,400 $ 667,000
Gross profit as a percentage
of sales 30.00% 30.00%
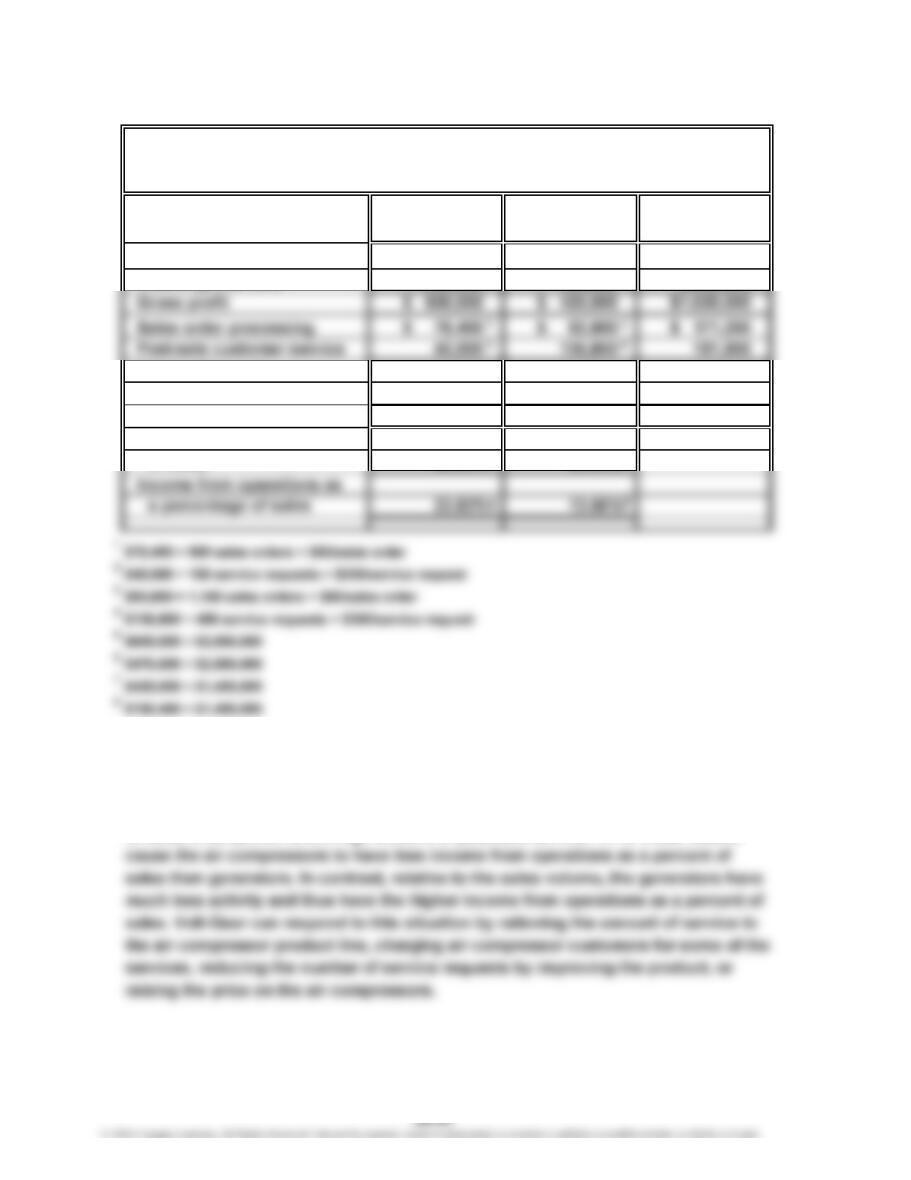
c. The complete product profitability report provides much greater insight than did the
original report. The air compressors have the lower income from operations to sales
percentage because the product is a heavy user of Volt-Gear’s sales and service
activities. The air compressors are ordered in small quantities (hence a high number
of sales orders) and have a high amount of post-sale service. All of these factors
VOLT-GEAR INC.
Product Profitability Report
For the Year Ended December 31
57
CHAPTER 26 Cost Allocation and Activity-Based Costing
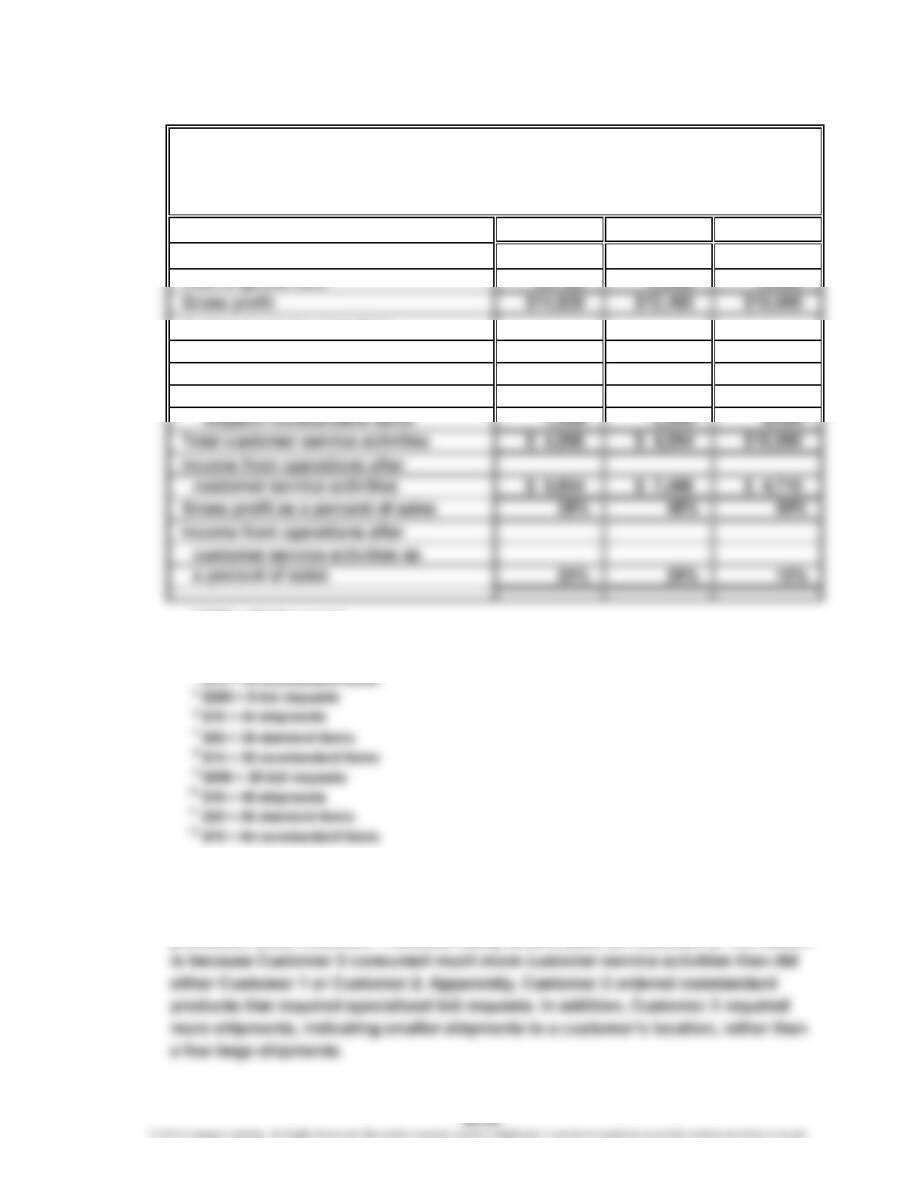
Ex. 26–19 (FIN MAN); Ex. 11–19 (MAN)
a.
Customer 1 Customer 2 Customer 3
Revenue $39,000 $26,000 $31,200
Cost of goods sold 24,180 13,520 15,600
Customer service activities:
Bid preparation $ 2,400 $ 1,600 $ 5,000
Shipment 256 384 720
Support standard items 960 760 1,120
1
$200 × 12 bid requests
2
$16 × 16 shipments
3
$20 × 48 standard items
4
b. The gross profit as a percent of sales indicated that Customer 1 was the least
profitable, while Customer 3 was the most profitable. After deducting the activity
costs associated with customer service activities, Customer 3 became the least
profitable, while Customer 1 became nearly as profitable as Customer 2. The reason
SCHNEIDER ELECTRIC
Customer Profitability Report
(assumed data)
For the Year Ended December 31, 2016
1
2
3
4
5
6
7
8
9
10
11
12
CHAPTER 26 Cost Allocation and Activity-Based Costing
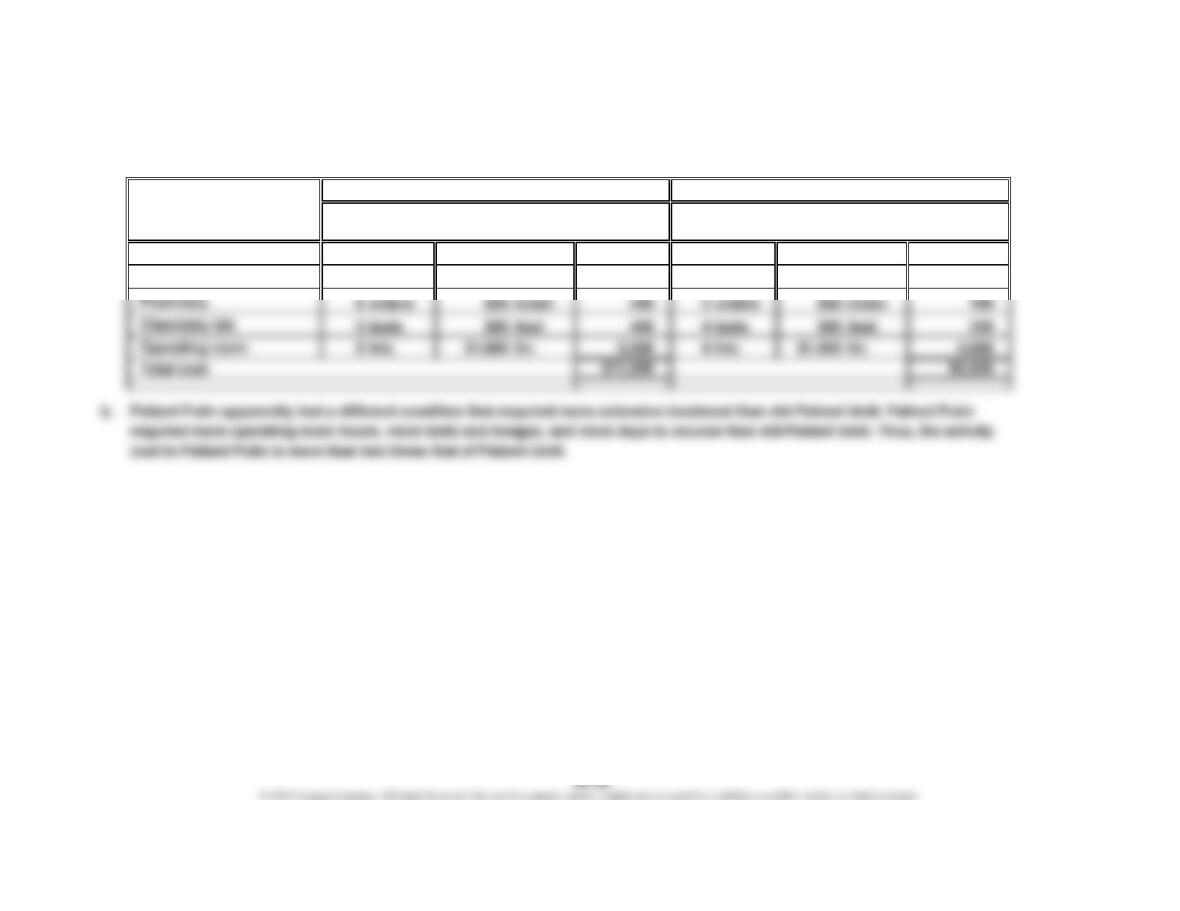
Ex. 26–20 (FIN MAN); Ex. 11–20 (MAN)
a.
Activity Activity
Activity Cost Cost
Room and meals 6 days /day 4 days /day
Radiology 4 images /image 3 images /image
×=
Rate
Activity
Rate
Activity
Usage
Patient Putin
$240
$1,440
Activity
Usage
Activity
Patient Umit
×=
$215
$240 $ 960
860 $215 645
CHAPTER 26 Cost Allocation and Activity-Based Costing
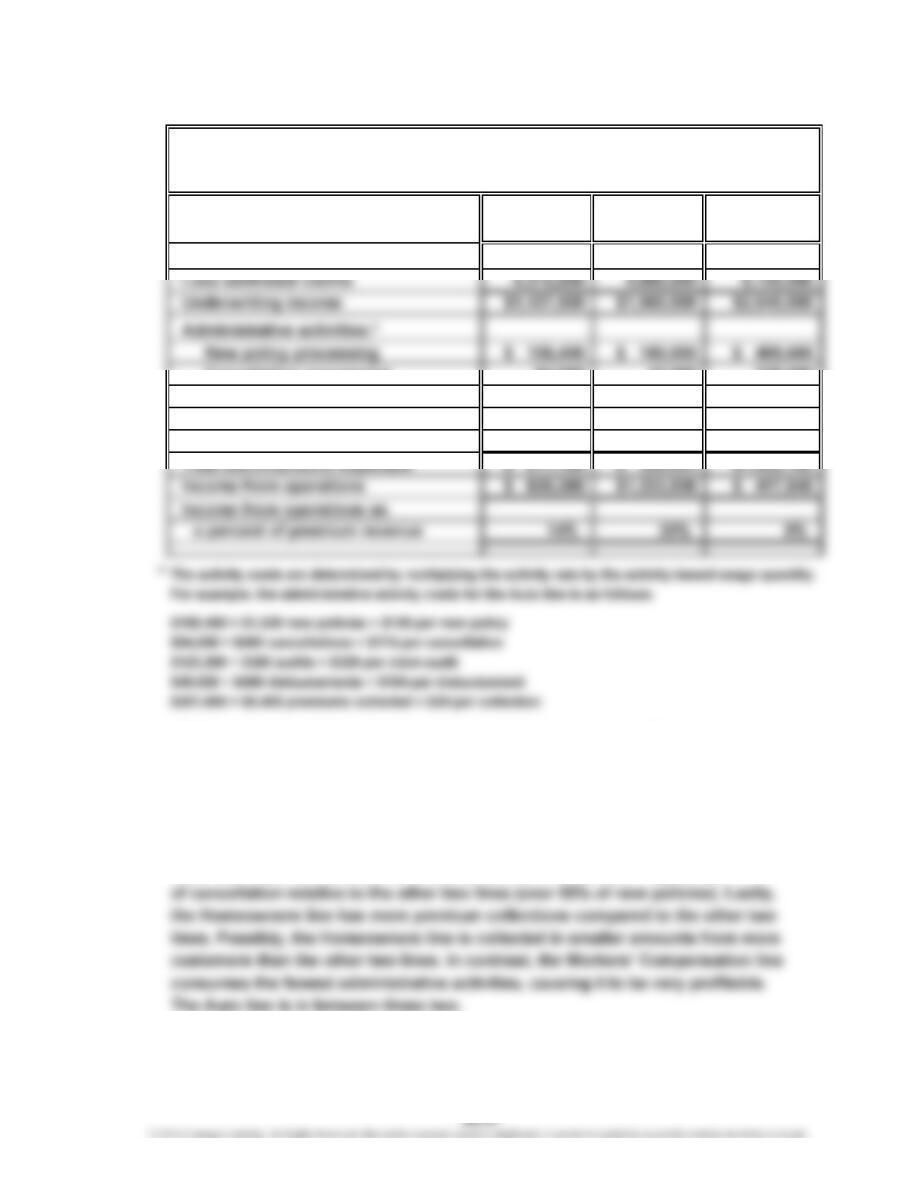
Ex. 26–21 (FIN MAN); Ex. 11–21 (MAN)
a.
Workers’
Auto Comp. Homeowners
Premium revenue $5,750,000 $6,240,000 $8,160,000
Cancellation processing 84,000 42,000 378,000
Claim audits 123,200 38,400 307,200
Claim disbursements processing 49,920 22,464 87,360
Premium collection processing 201,600 43,200 360,000
b. All three insurance lines have the same percentage of underwriting income to
premium revenue (25%). The differences among the insurance lines are in the
way they consume administrative activities. For example, the Homeowners
insurance line has the least profitability due to its high use of administrative
activities. Specifically, the Homeowners line has smaller and more frequent
claims that require more auditing and disbursement processing than do the
other two lines. In addition, the Homeowners line has a much higher rate
SAFETY FIRST INSURANCE COMPANY
Product Profitability Report
For the Year Ended December 31
CHAPTER 26 Cost Allocation and Activity-Based Costing
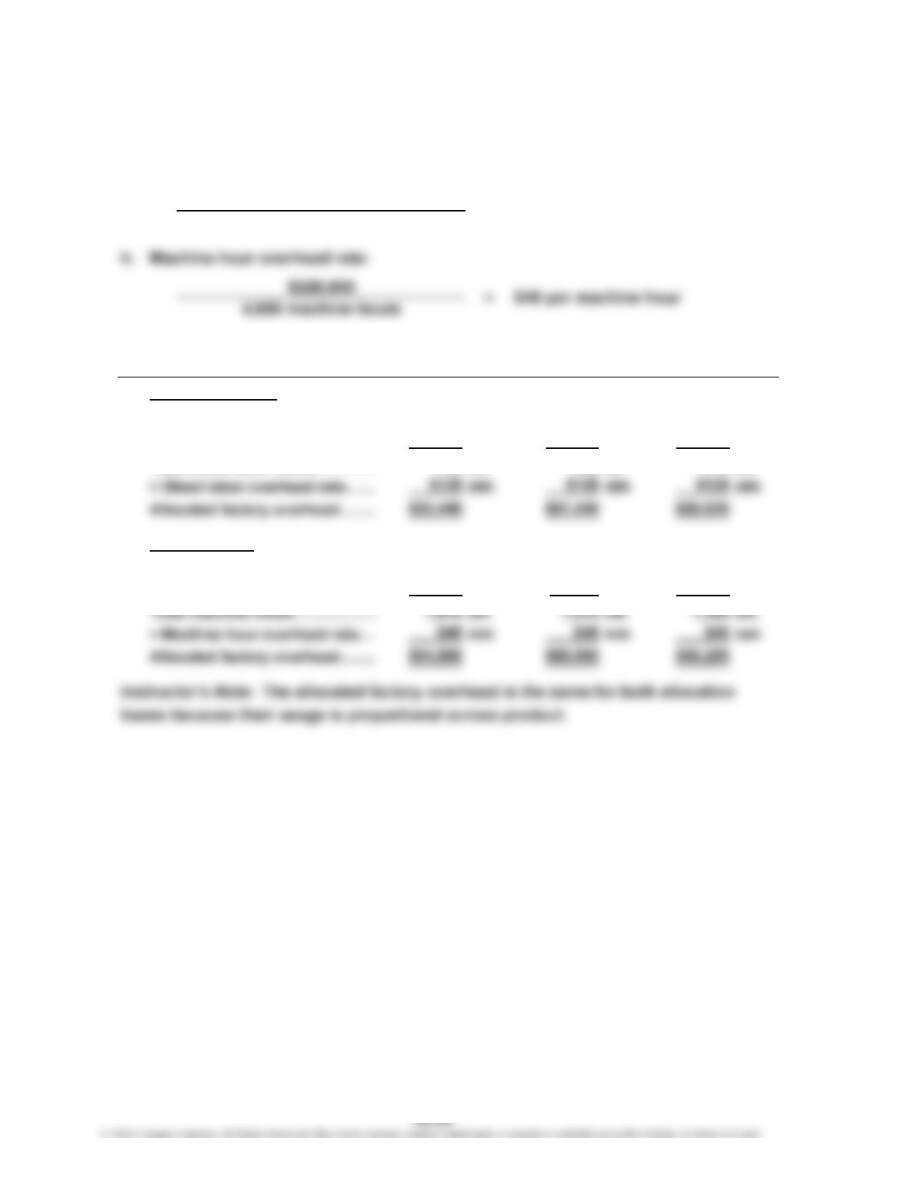
Prob. 26–1A (FIN MAN); Prob. 11–1A (MAN)
1. a. Direct labor overhead rate:
2.
a. Direct labor hours:
Stamping Department…………… 560 dlh 300 dlh 340 dlh
Plating Department………………
…
170 180 175
Total direct labor hours…………
…
730 dlh 480 dlh 515 dlh
b. Machine hours:
Stamping Department…………… 800 mh 560 mh 600 mh
Plating Department………………
…
1,170 710 760
…
1,725 direct labor hours
PROBLEMS
Bumpers
=
Covers Wheels
$128 per direct labor hour
Automobile Valve
$220,800
CHAPTER 26 Cost Allocation and Activity-Based Costing
Prob. 26–2A (FIN MAN); Prob. 11–2A (MAN)
1.
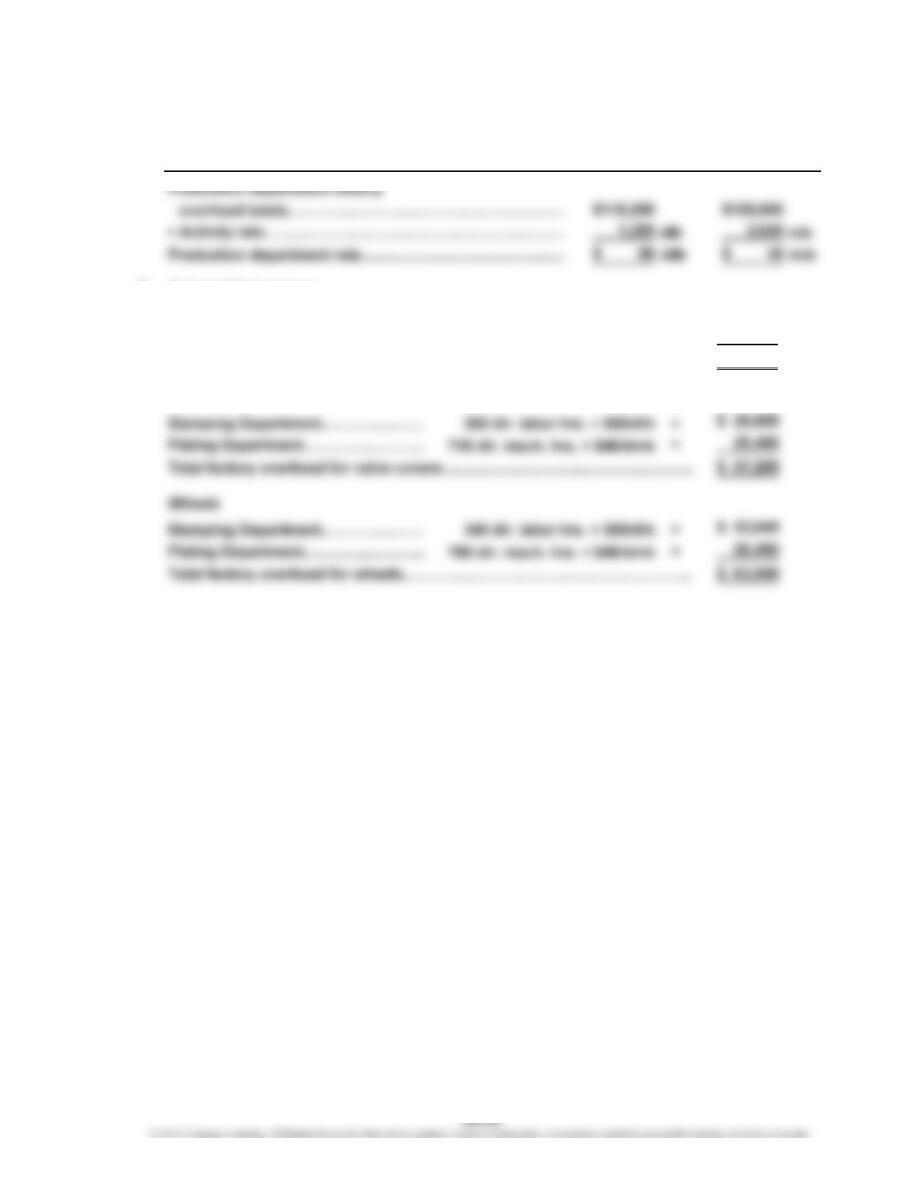
2. Automobile bumpers
Stamping Department…………………
…
=$ 53,760
Plating Department……………………
…
=46,800
Total factory overhead for bumpers………………………………………………
…
$100,560
Valve covers
…
…
…
…
1,170 dir. mach. hrs. × $40/dmh
560 dir. labor hrs. × $96/dlh
Dept. Dept.
Stamping Plating
CHAPTER 26 Cost Allocation and Activity-Based Costing
Prob. 26–3A (FIN MAN); Prob. 11–3A (MAN)
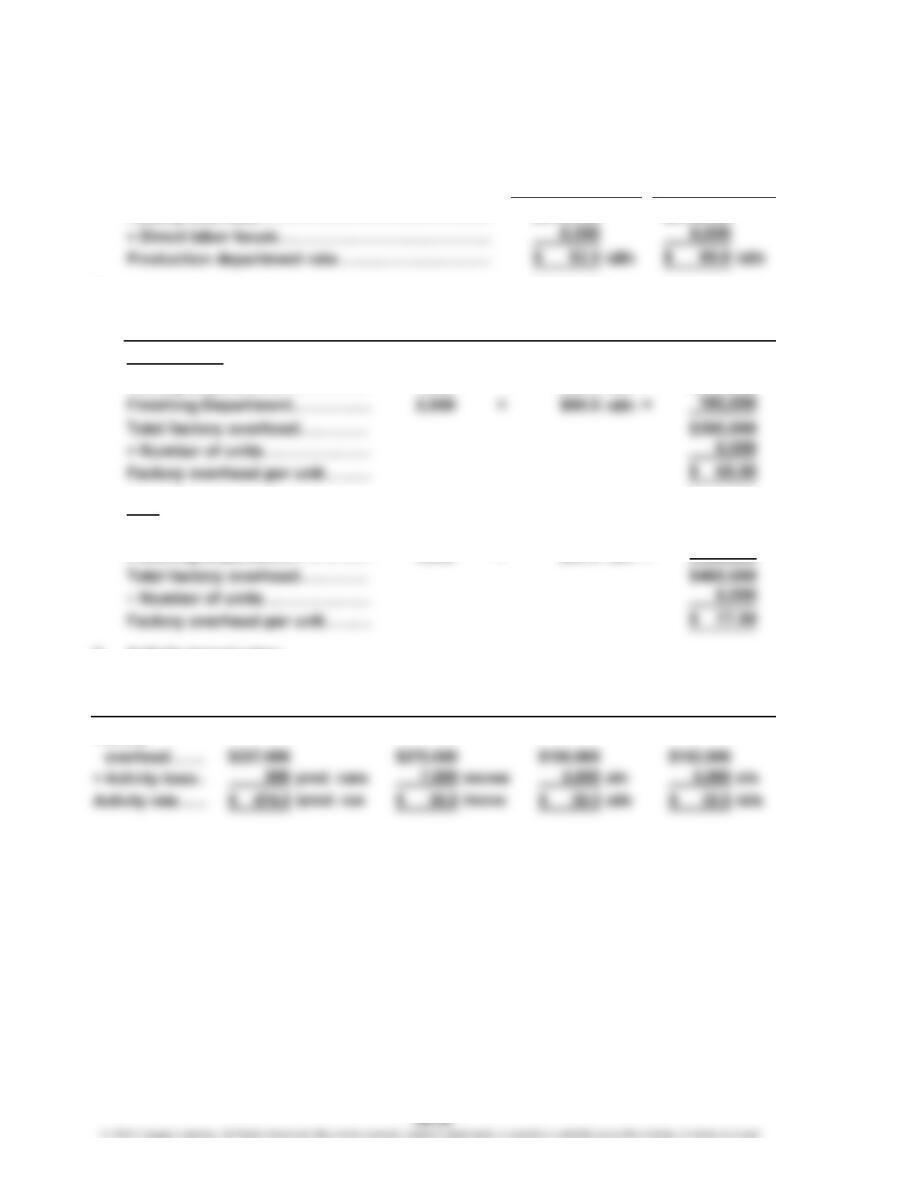
1. Production department rates:
Factory overhead……………………………………
…
2.
×
=
Snowboards:
Cutting Department……………
…
× $52.5 /dlh
=
…
=
…
Skis:
Cutting Department……………
…
× $52.5 /dlh
=
Finishing Department…………
…
× $90.0 /dlh
=
…
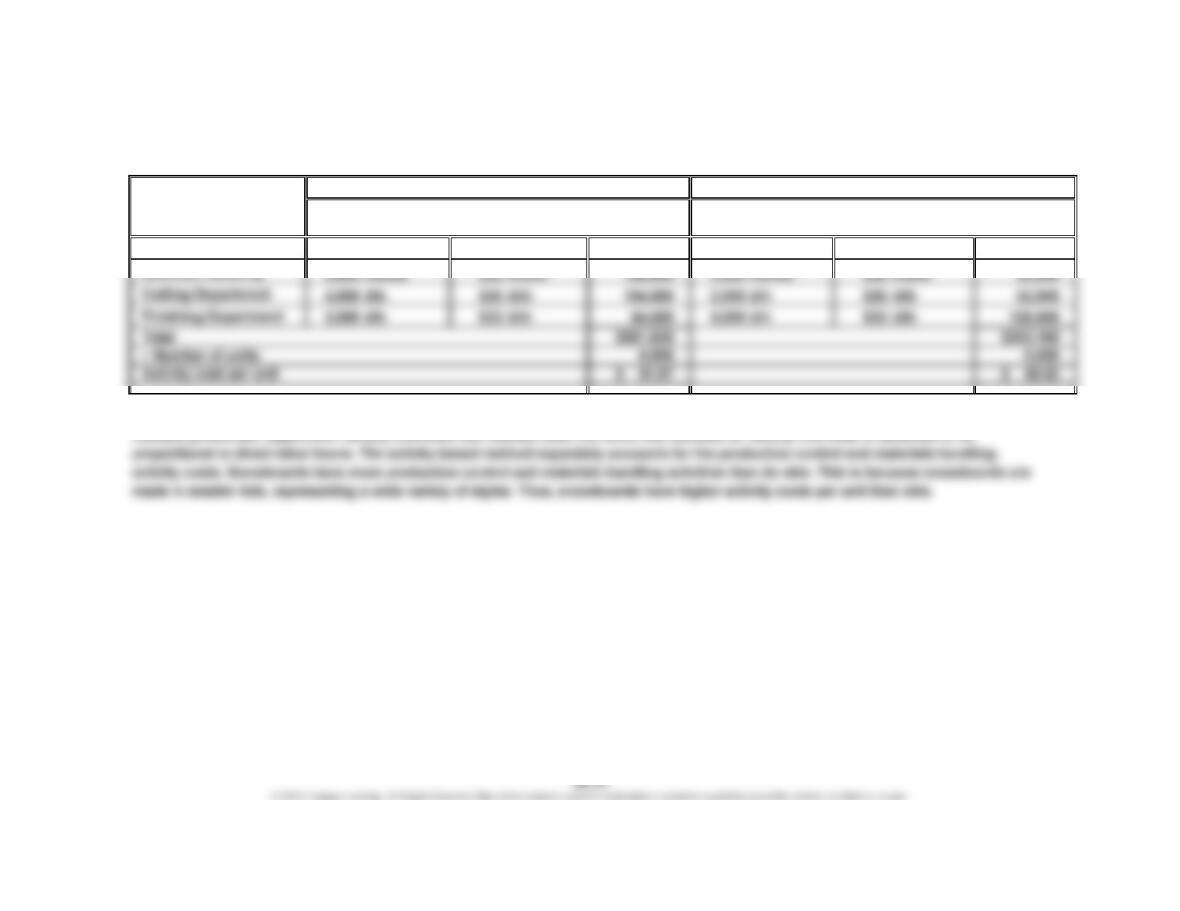
3. Activity-based rates:
Factory
Finishing
Production
Overhead
Factory
Rate
Department
Department
Cutting
$105,000
360,000
$210,000
Department
Department
Cutting Finishing
Department
$540,000$315,000
Direct
Labor Hours
4,000
2,000
4,000
Production
Control
Materials
Handling
CHAPTER 26 Cost Allocation and Activity-Based Costing
Prob. 26–3A (FIN MAN); Prob. 11–3A (MAN) (Concluded)
4.
Activity Activity
Activity Cost Cost
Production control 430 prod. runs /prod. run 70 prod. runs /prod. run
Materials handling 5,000 moves /move 2,500 moves /move
5. The activity-based overhead allocation reveals that snowboards consume more factory overhead on a per-unit basis than do skis. The
multiple production department factory overhead rate method does not show this because all factory overhead is assumed to be
Skis
×= × =Rate
Activity
Rate
Snowboards
Activity
Usage
Activity
Usage
Activity
$474 $203,820
$474 $ 33,180
CHAPTER 26 Cost Allocation and Activity-Based Costing
Prob. 26–4A (FIN MAN); Prob. 11–4A (MAN)
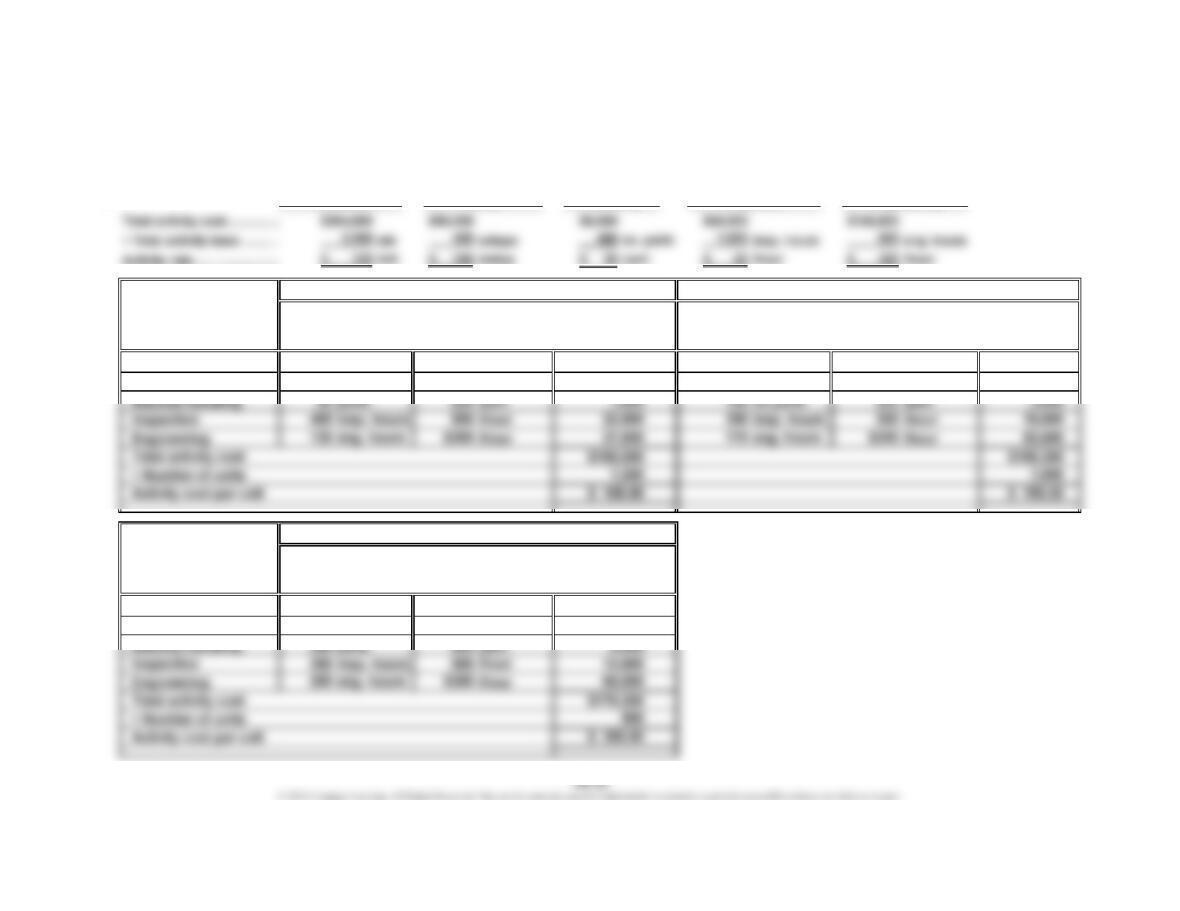
1.
2.
Activity
Production 1,000 mh /mh 800 mh /mh
Setup 60 setups /setup 120 setups /setups
Activity
Production 400 mh /mh
Setup 220 setups /setups
Material handling 250 parts /part
Materials
×
Activity-
Z4
Activity Activity
× Rate = Cost
Engineering
Base
Usage
Base
Usage
Production
Activity-
Setup InspectionHandling
$120
Usage Rate
I8
M5
$120
$ 48,000
52,800
Activity-
$240
$120,000$120
ActivityActivity
Cost
28,800
=
14,400
Cost
=
$240
Base
Rate
Activity Activity
$ 96,000
$240
×
CHAPTER 26 Cost Allocation and Activity-Based Costing
Prob. 26–4A (FIN MAN); Prob. 11–4A (MAN) (Concluded)
3. The unit costs are different even though each product requires 0.8 machine hour
because the products consume many activities in ratios different from the volume.
CHAPTER 26 Cost Allocation and Activity-Based Costing
Prob. 26–5A (FIN MAN); Prob. 11–5A (MAN)
1.
2.
Good Knowledge University
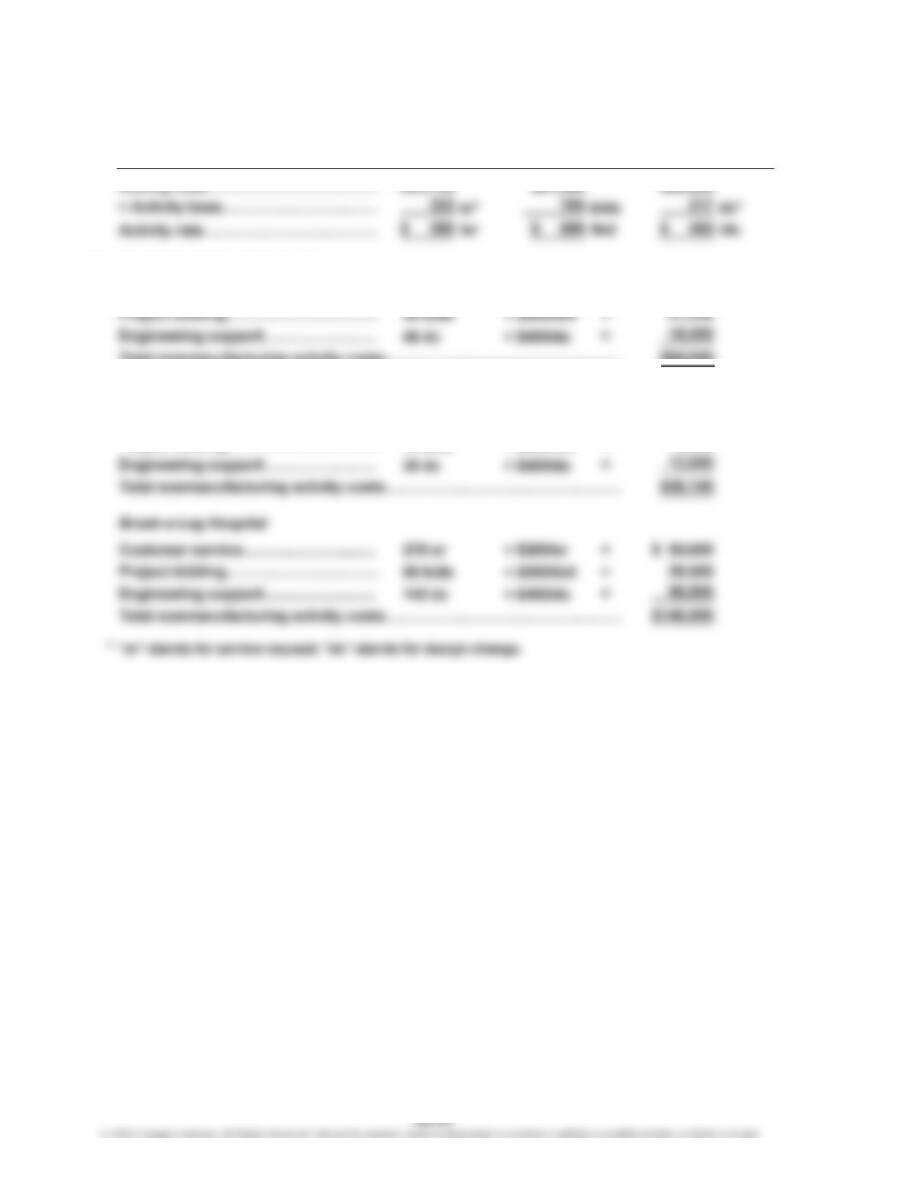
Customer service………………………
…
× $260/sr = $15,600
…
Total nonmanufacturing activity costs………………………………………… $54,840
Hot Shotz Arena
Customer service………………………
…
× $260/sr = $13,520
Project bidding…………………………
…
× $590/bid = 10,620
…
…
Bidding Support
Project Engineering
Customer
Service
52 sr
18 bids
60 sr
CHAPTER 26 Cost Allocation and Activity-Based Costing
Prob. 26–5A (FIN MAN); Prob. 11–5A (MAN) (Concluded)
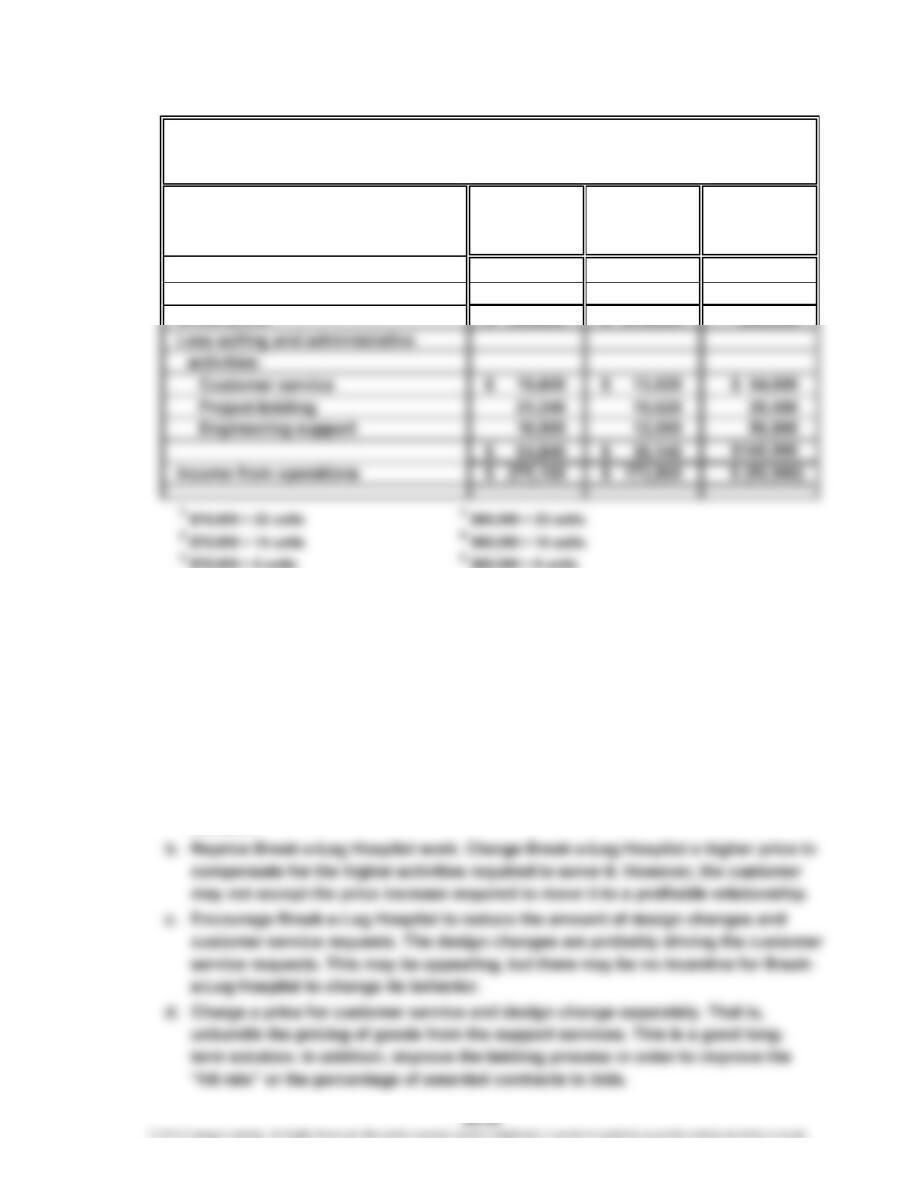
3.
Good
Knowledge Hot Shotz Break-a-Leg
University Arena Hospital
Revenues $1,650,000 $1,050,000 $450,000
Less cost of goods sold 1,320,000 840,000 360,000
Gross profit $ 330,000 $ 210,000 $90,000
$75,000 × 6 units
$60,000 × 6 units
4. Break-a-Leg Hospital is unprofitable, while the other two customers have acceptable
margins. This is because Break-a-Leg Hospital requires many customer service,
project bidding, and design change activities. For example, Break-a-Leg Hospital
awards contracts on only 12% of the bid efforts (6 contracts ÷
50 bids); it requests
a large amount of service; and it requires extensive design change effort. The
company’s options include:
a. Stop bidding Break-a-Leg Hospital projects. This does not necessarily mean that
all the costs can be avoided. The costs only will be eliminated if the reduced
activity translates into lower headcount (dismissals). Thus, the company should
evaluate the contribution margin of this customer relationship before making this
decision.
COLD ZONE MECHANICAL INC.
Customer Profitability Report
For the Year Ended December 31
123
45 6
CHAPTER 26 Cost Allocation and Activity-Based Costing
Prob. 26–6A (FIN MAN); Prob. 11–6A (MAN)
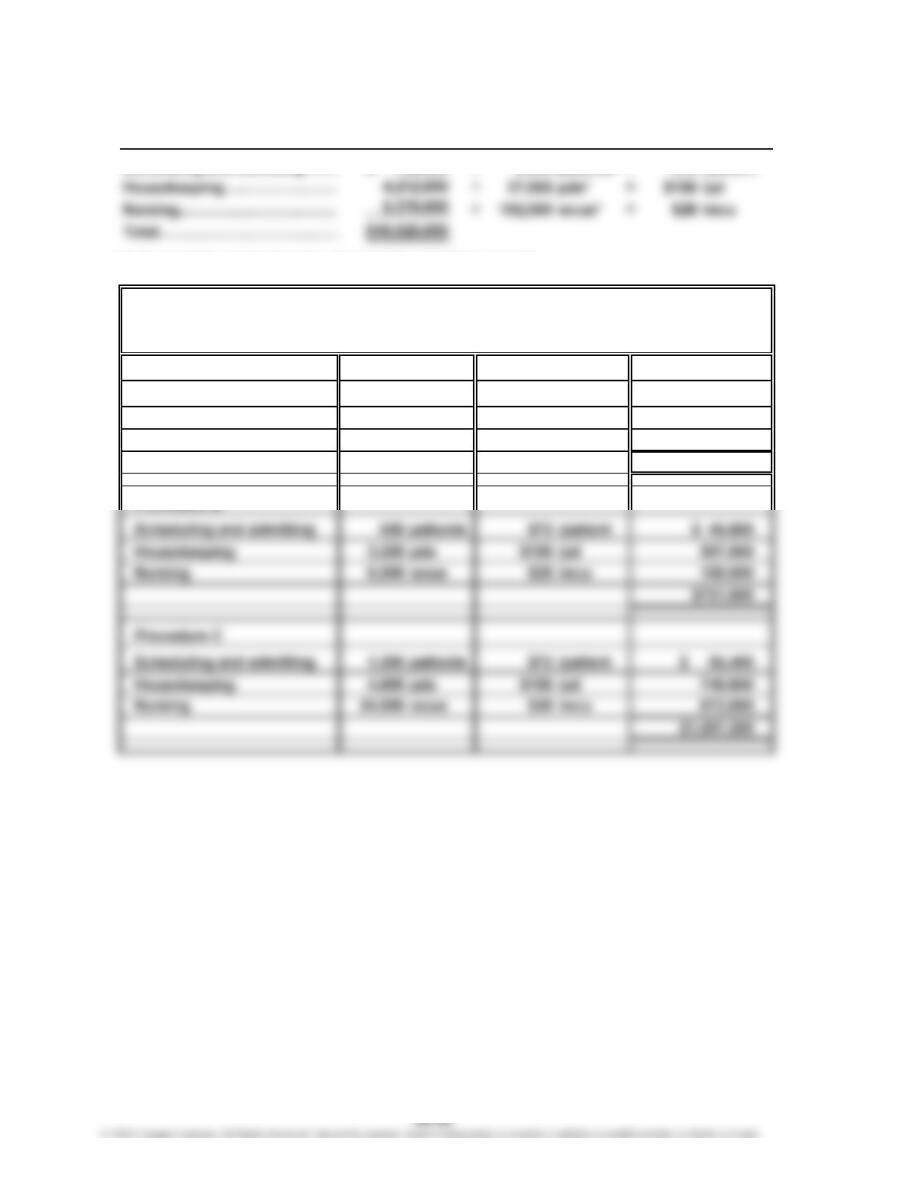
1.
Activity
Scheduling and admitting……
…
6,000 patients $72 /patient
*
“pd” stands for patient day; “wcu” stands for weighted care unit
2.
Activity
Procedure A
Scheduling and admitting 280
Housekeeping 1,680
Nursing 19,200
Procedure B
wcus
×
Rate
Activity Base
÷
/pd
/wcu
Usage
Activity Cost
$ 20,160
Total Activity
Cost by
Procedure
Activity Rate
=
=
÷$ 432,000
patients
Activity
262,080
537,600
Activity
pds $156
/patient
=
$28
$72
$819,840