CHAPTER 25 Capital Investment Analysis
Prob. 25–3A (FIN MAN); Prob. 10–3A (MAN) (Concluded)
$7,208,500
$8,000,000
*Rounded
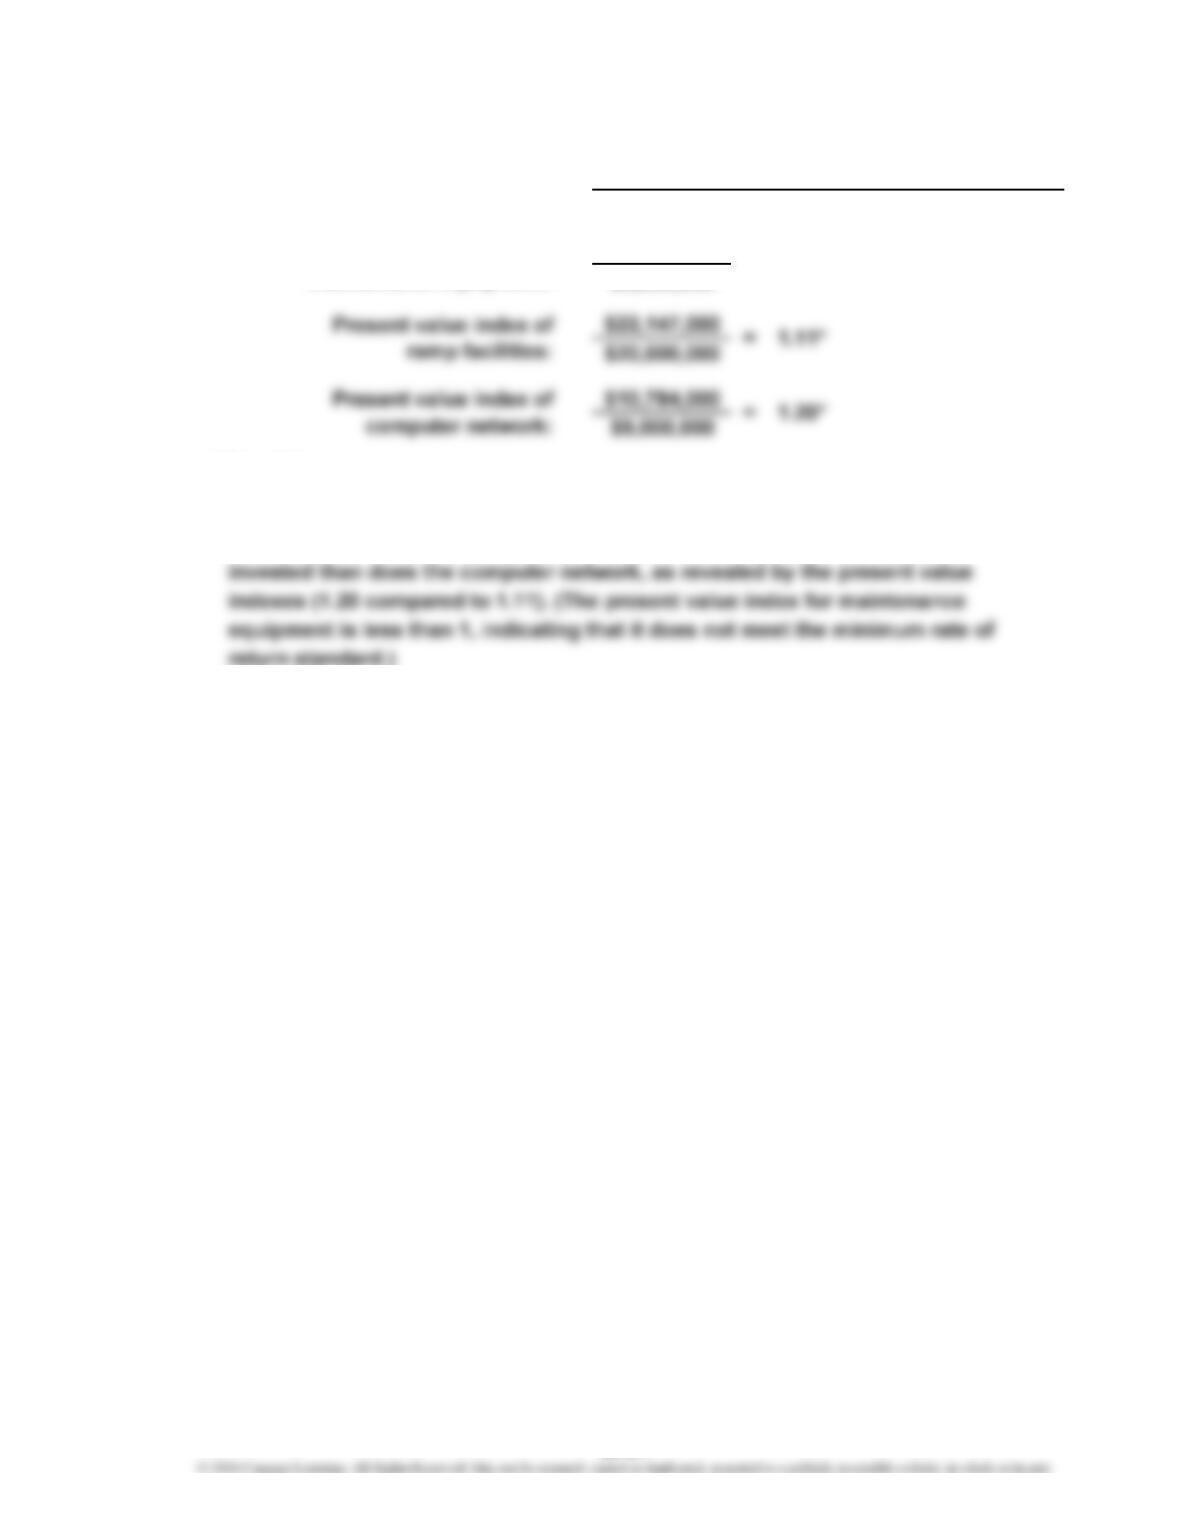
3. The computer network has the largest present value index. Although ramp
facilities has the largest net present value, it returns less present value per dollar
Present Value Index = Total Present Value of Net Cash Flow
Amount to Be Invested
2.
Present value index of
maintenance equipment: = 0.90*
25-21
CHAPTER 25 Capital Investment Analysis
Prob. 25–4A (FIN MAN); Prob. 10–4A (MAN)
1. a. Wind Turbines:
Annual net cash flow (at the end of each of 4 years)…………………… $280,000
× Present value of an annuity of $1 at 6% for 4 years (Exhibit 5)……
…
3.465
Biofuel Equipment:
Annual net cash flow (at the end of each of 4 years)…………………… $ 300,000
× Present value of an annuity of $1 at 6% for 4 years (Exhibit 5)……
…
3.465
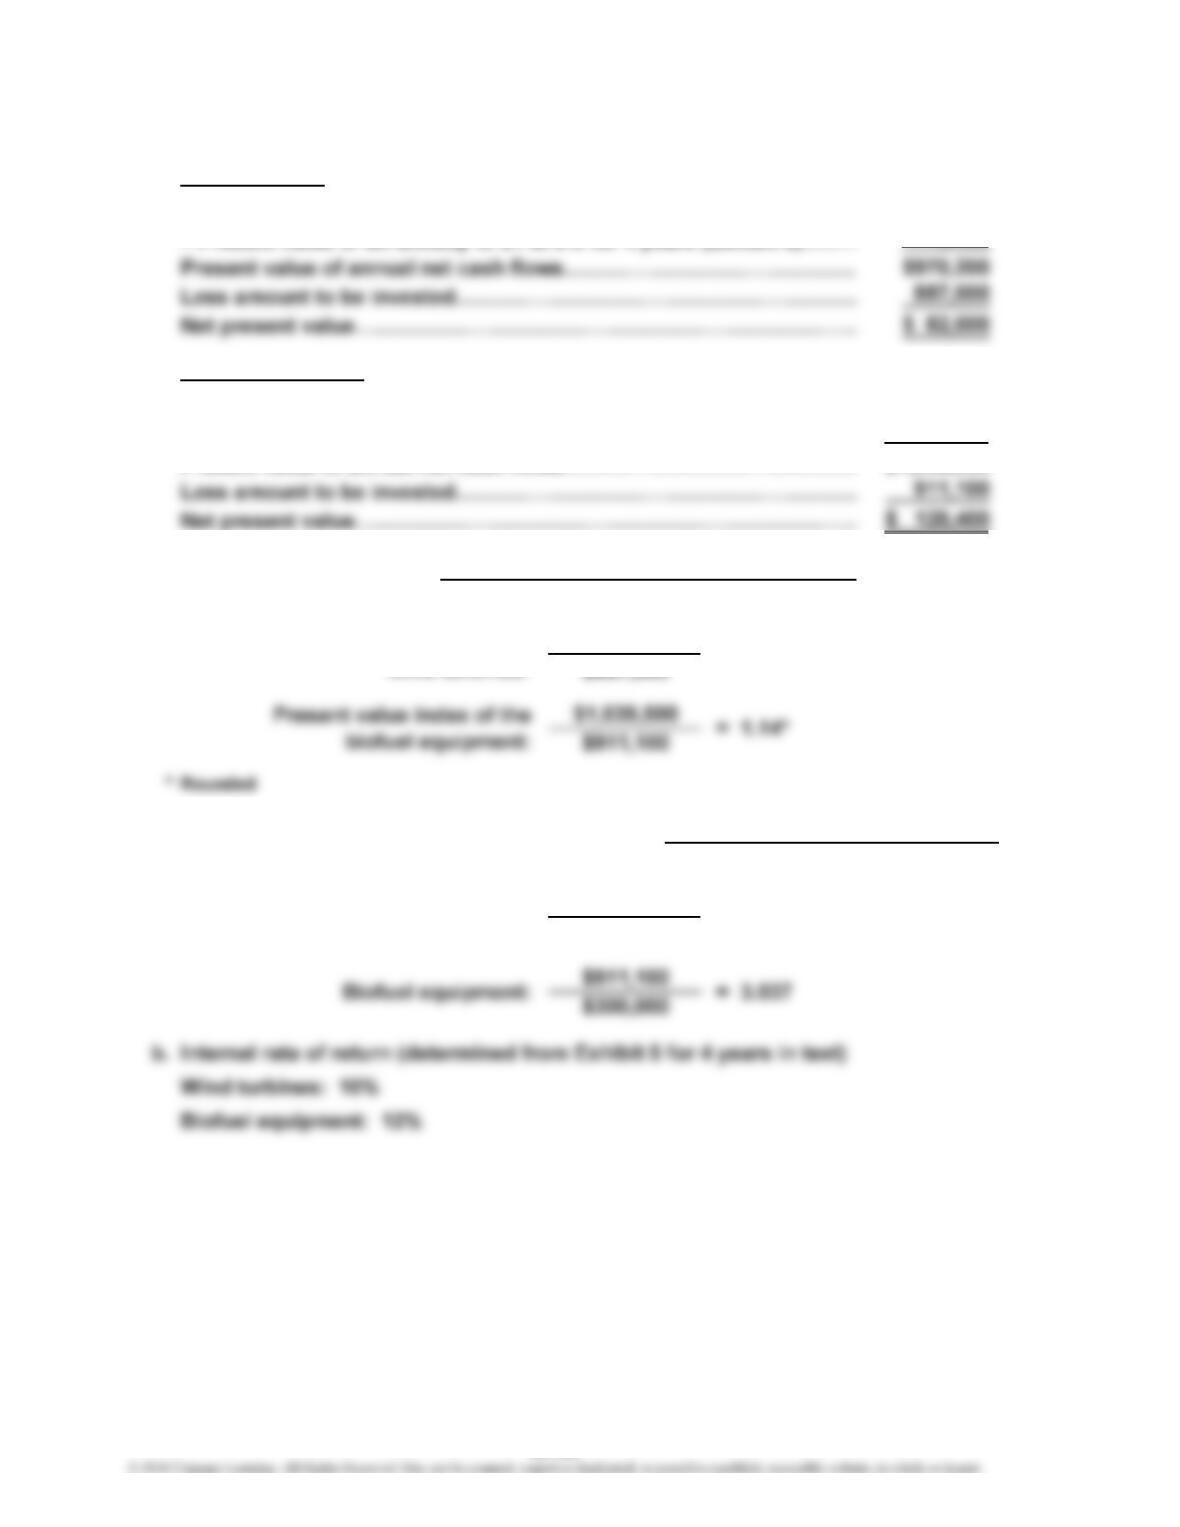
Present value of annual net cash flows…………………………………… $1,039,500
2. Present Value Factor for an Annuity of $1 Amount to Be Invested
Annual Net Cash Flow
a. =
Wind turbines: $887,600 = 3.170
$280,000
b.
Present Value Index =
Present value index of
wind turbines:
Total Present Value of Net Cash Flow
Amount to Be Invested
$970,200
$887,600 = 1.09*
25-22
CHAPTER 25 Capital Investment Analysis
Prob. 25–4A (FIN MAN); Prob. 10–4A (MAN) (Concluded)
3. The net present value, present value index, and internal rate of return all indicate
that the wind turbines are a better financial opportunity compared to the biofuel
equipment, although both investments meet the minimum return criterion of 6%.
The present value index indicates that the wind turbines had a greater present
25-23
CHAPTER 25 Capital Investment Analysis
Prob. 25–5A (FIN MAN); Prob. 10–5A (MAN)
1. Net present value analysis:
Office Expansion:
Annual net cash flow (at the end of each of 6 years)………………………
…
$125,000
× Present value of an annuity of $1 at 12% for 6 years (Exhibit 5)………
…
4.111
Server Upgrade:
Annual net cash flow (at the end of each of 4 years)………………………
…
$165,000
× Present value of an annuity of $1 at 12% for 4 years (Exhibit 5)………
…
3.037
…
…
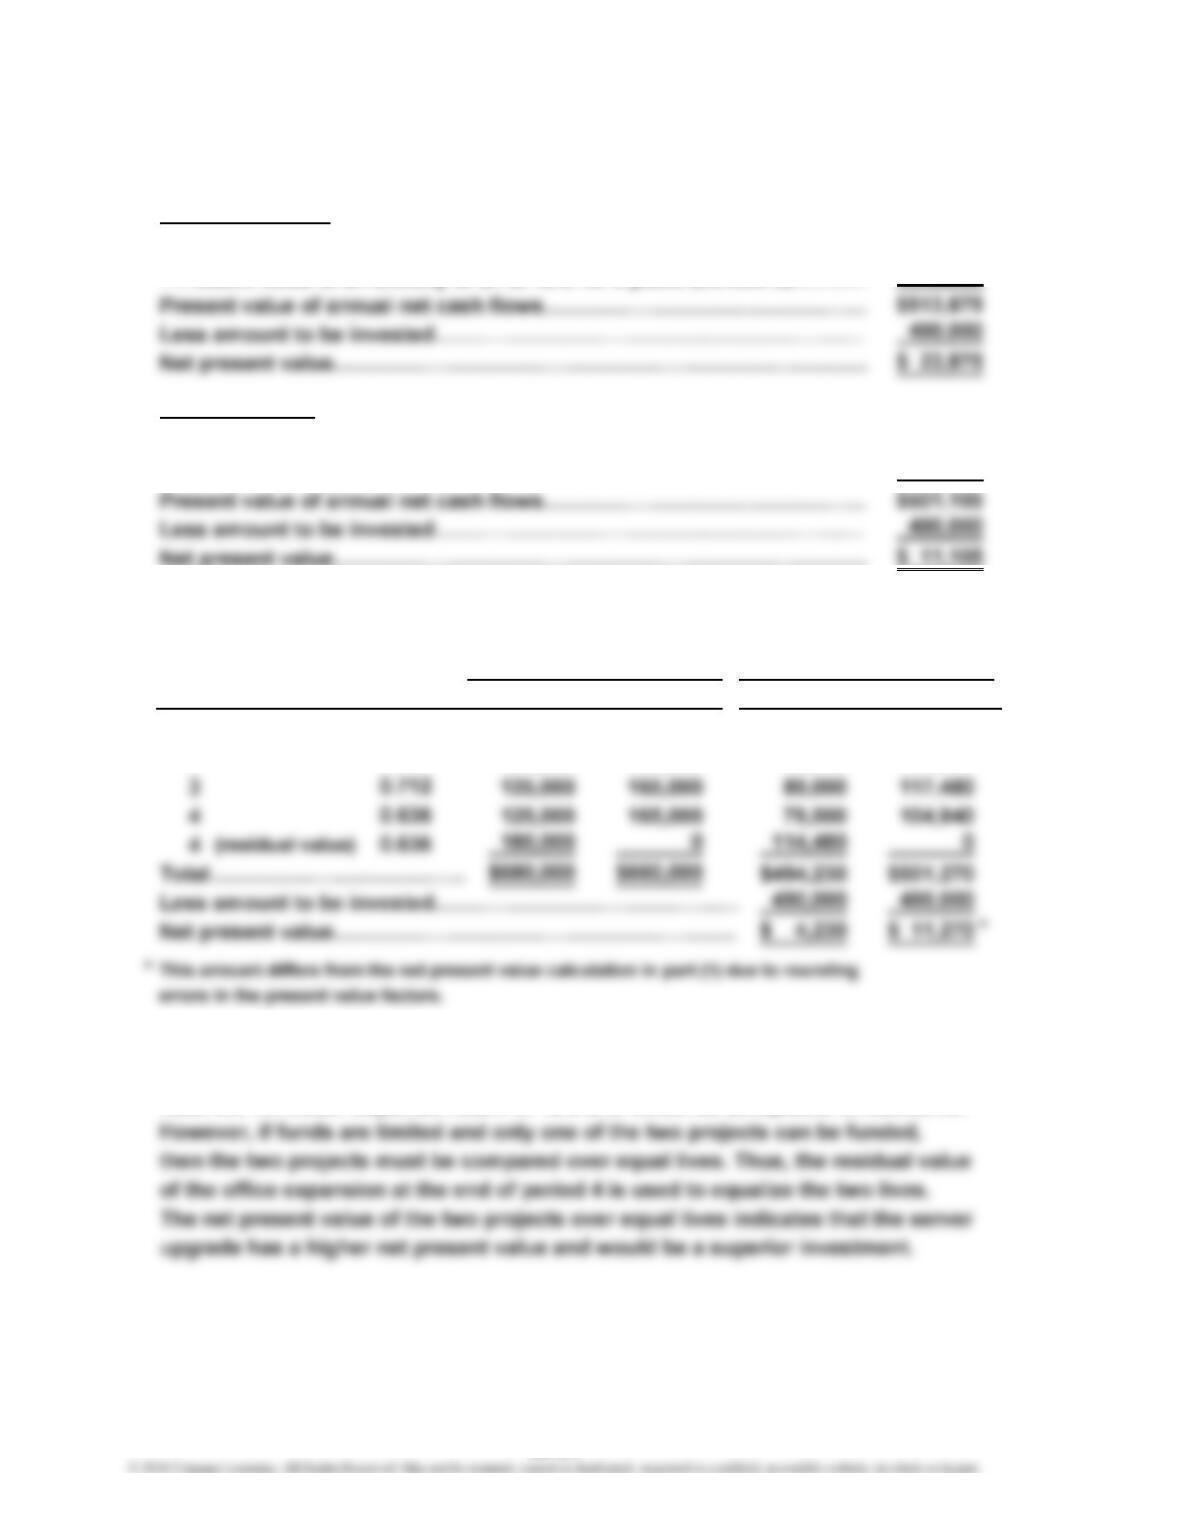
2. Net present value analysis:
Expansion Servers Expansion
1 $125,000 $165,000 $111,625 $147,345
2 125,000 165,000 99,625 131,505
3. To: Investment Committee
Both projects have a positive net present value. This means that both projects
meet our minimum expected return of 12% and would be acceptable investments.
Net Cash FlowNet Cash Flow
Present Value of
$1 at 12%
Value of
Present
Servers
Year
0.893
0.797
25-24
…
…
CHAPTER 25 Capital Investment Analysis
Prob. 25–6A (FIN MAN); Prob. 10–6A (MAN)
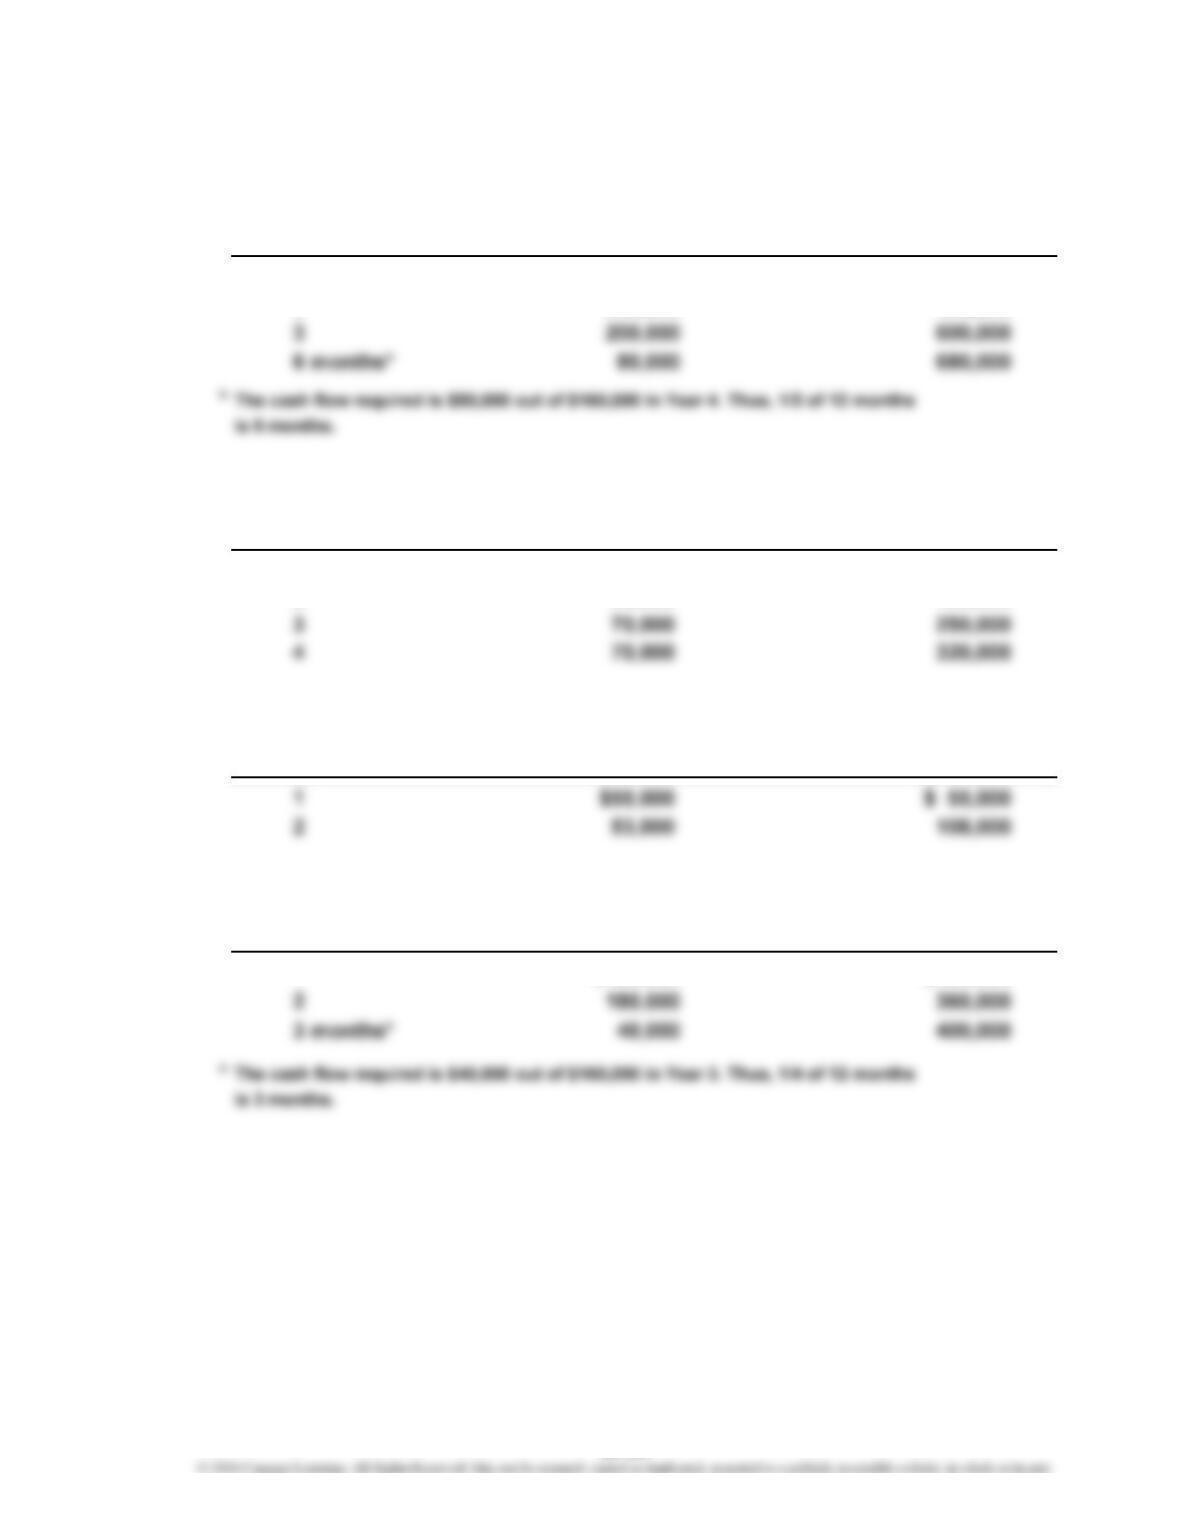
1. Proposal A: 3-year, 6-month cash payback period, as follows:
Net Cash Cumulative
Year Flow Net Cash Flows
1 $200,000 $200,000
2 200,000 400,000
Proposal B: 4-year cash payback period, as follows:
Net Cash Cumulative
Year Flow Net Cash Flows
1 $90,000 $ 90,000
2 90,000 180,000
Proposal C: 2-year cash payback period, as follows:
Net Cash Cumulative
Year Flow Net Cash Flows
Proposal D: 2-year, 3-month cash payback period, as follows:
Net Cash Cumulative
Year Flow Net Cash Flows
1 $180,000 $180,000
25-25
CHAPTER 25 Capital Investment Analysis
Prob. 25–6A (FIN MAN); Prob. 10–6A (MAN) (Continued)
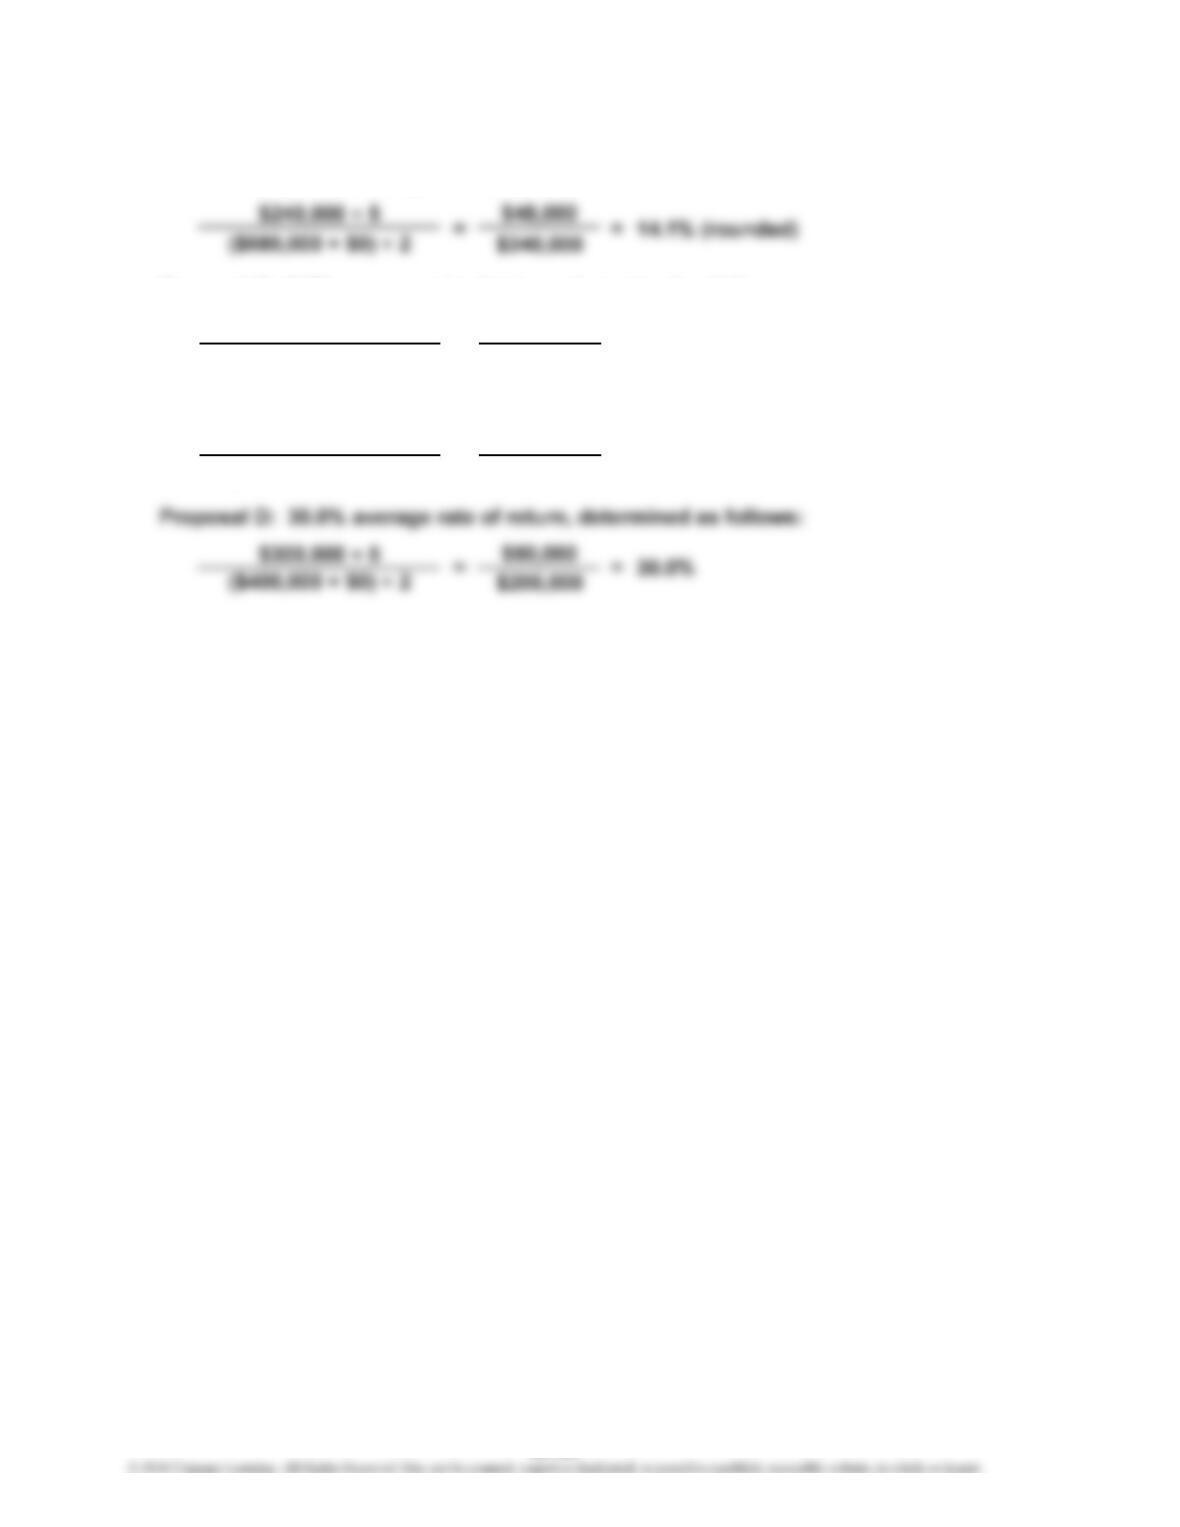
2. Proposal A: 14.1% average rate of return, determined as follows:
Proposal B: 2.5% average rate of return, determined as follows:
$4,000
$160,000
Proposal C: 52.6% average rate of return, determined as follows:
$28,400
$54,000
2.5%
52.6% (rounded)
($108,000 + $0) ÷ 2
$142,000 ÷ 5
=
($320,000 + $0) ÷ 2
$20,000 ÷ 5
=
=
=
25-26
CHAPTER 25 Capital Investment Analysis
Prob. 25–6A (FIN MAN); Prob. 10–6A (MAN) (Continued)
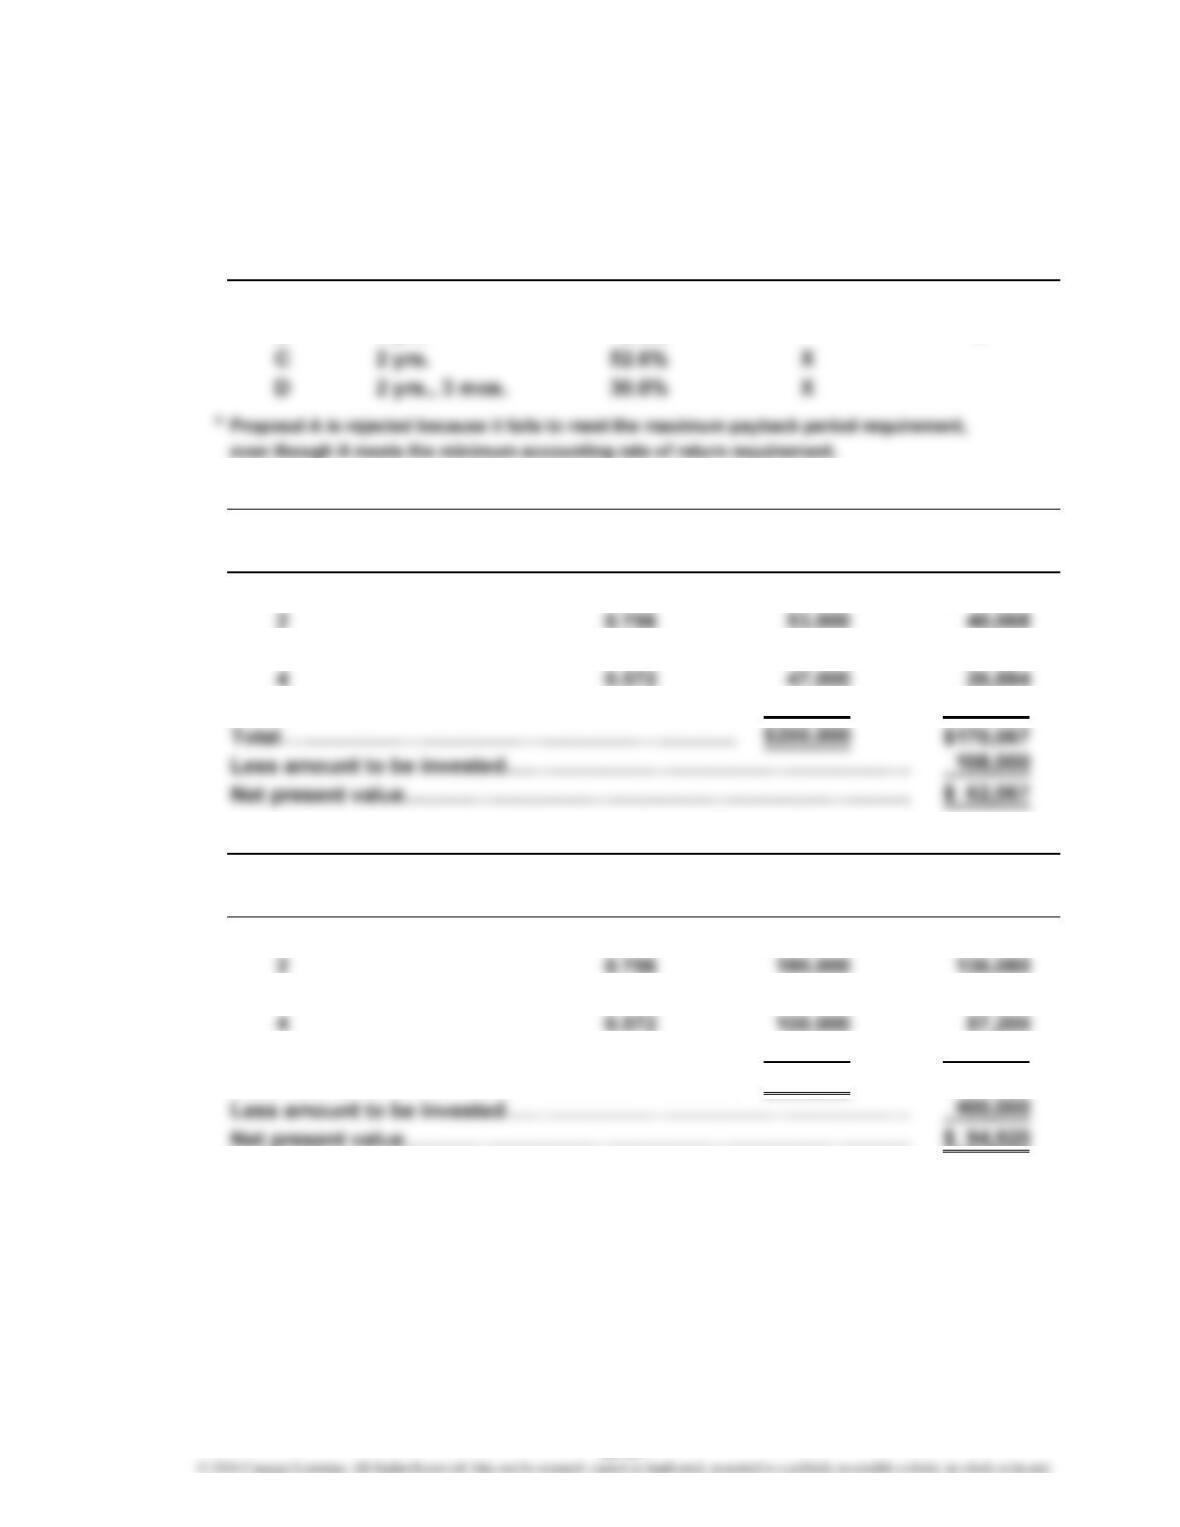
3. Of the four proposed investments, only Proposals C and D meet the company’s
requirements, as the following table indicates:
Cash Payback Average Rate Accept for
Proposal Period of Return Further Analysis Reject
A 3 yrs., 6 mos. 14.1% X*
B 4 yrs. 2.5% X
4.
Present Value Net Cash Present Value of
Year of $1 at 15% Flow Net Cash Flow
1 0.870 $ 55,000 $ 47,850
3 0.658 50,000 32,900
5 0.497 45,000 22,365
…
Present Value Net Cash Present Value of
Year of $1 at 15% Flow Net Cash Flow
1 0.870 $180,000 $156,600
3 0.658 160,000 105,280
5 0.497 80,000 39,760
Total………………………………………………………
…
$700,000 $494,920
Proposal C
Proposal D
25-27
CHAPTER 25 Capital Investment Analysis
Prob. 25–6A (FIN MAN); Prob. 10–6A (MAN) (Concluded)
$170,067
$108,000
*Rounded
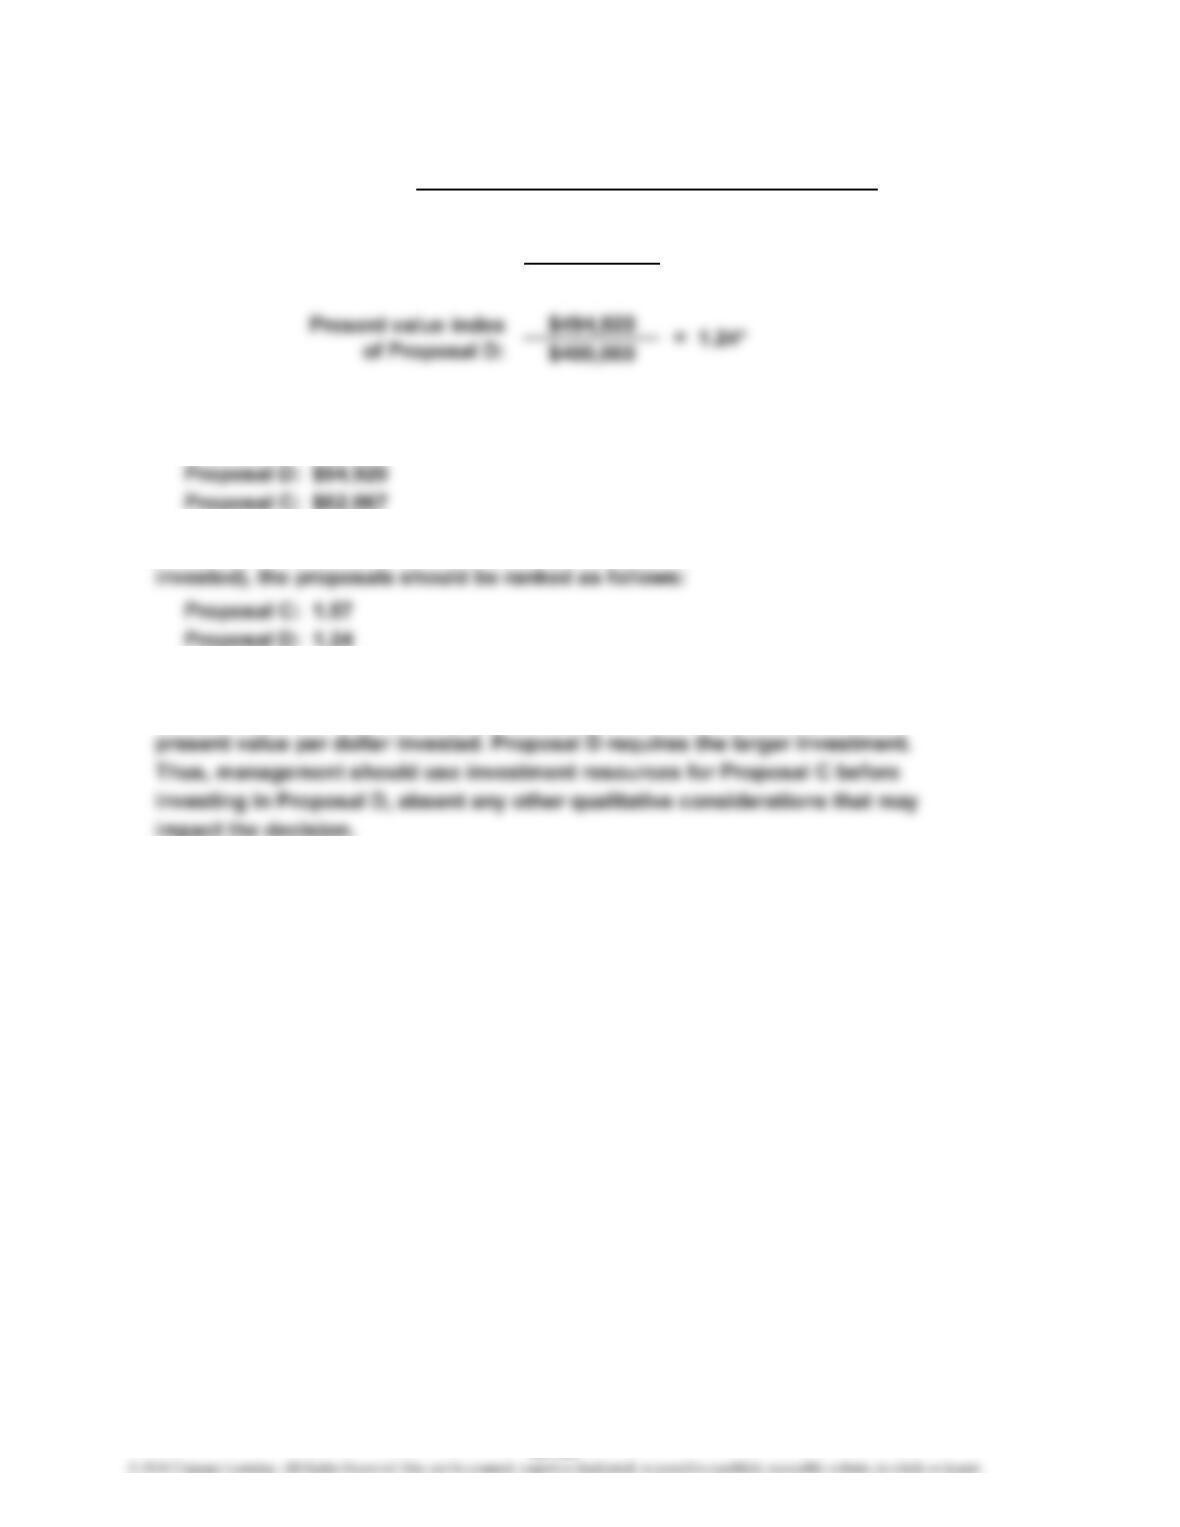
6. Based on the net present value, the proposals should be ranked as follows:
7. Based on the present value index (the amount of present value per dollar
8. The present value indexes indicate that although Proposal D has the larger net
present value, it is not as attractive as Proposal C in terms of the amount of
5.
Present Value Index =
Present value index
of Proposal C:
Total Present Value of Net Cash Flow
Amount to Be Invested
= 1.57*
25-28
CHAPTER 25 Capital Investment Analysis
Prob. 25–1B (FIN MAN); Prob. 10–1B (MAN)
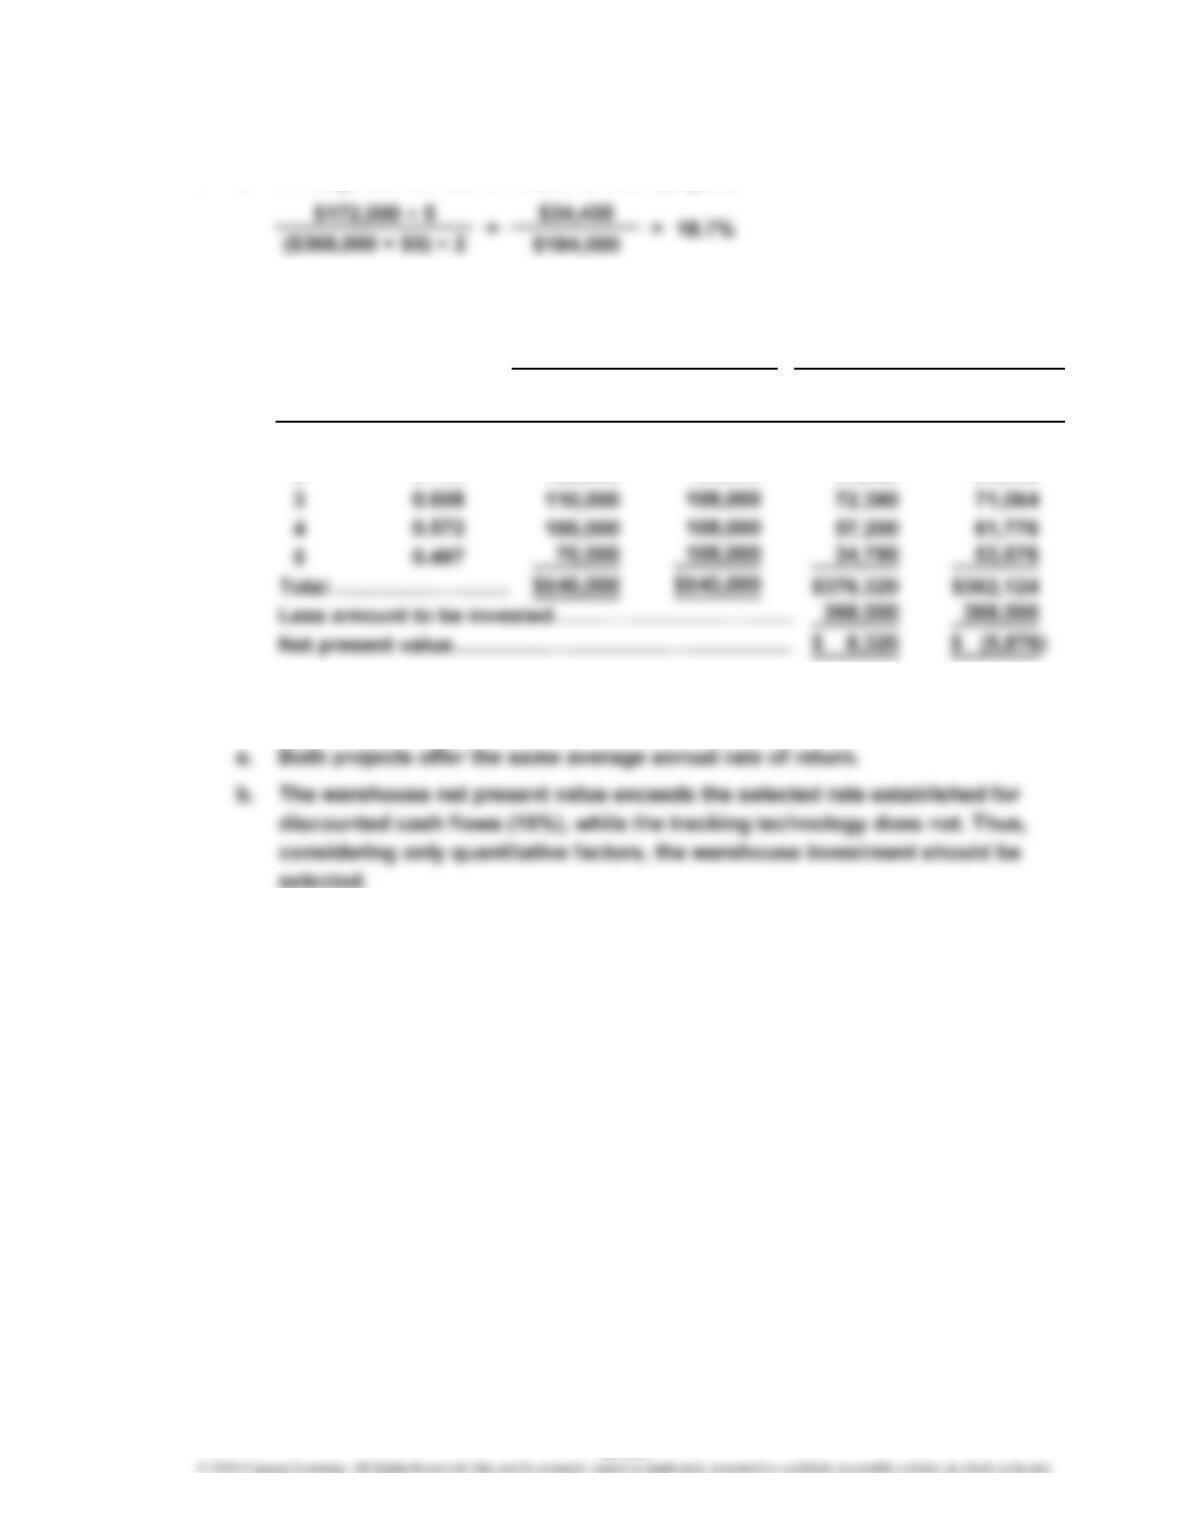
1. a. Average annual rate of return for both projects:
b. Net present value analysis:
Year Warehouse Warehouse
1 $135,000 $117,450 $ 93,960
2 125,000 94,500 81,648
2. The report to the capital investment committee can take many forms. The
report should, as a minimum, present the following points:
0.870 $108,000
0.756
108,000
$1 at 15%
Value of
Present
Technology
Net Cash FlowNet Cash Flow
Technology
Tracking
Present Value of
Tracking
25-29
CHAPTER 25 Capital Investment Analysis
Prob. 25–2B (FIN MAN); Prob. 10–2B (MAN)
1. a. Cash payback period for both projects: 2 years (the year in which
accumulated net cash flows equal $125,000), shown as follows:
Net Cash Cumulative Net Cash Cumulative
Year Flow Net Cash Flow Year Flow Net Cash Flow
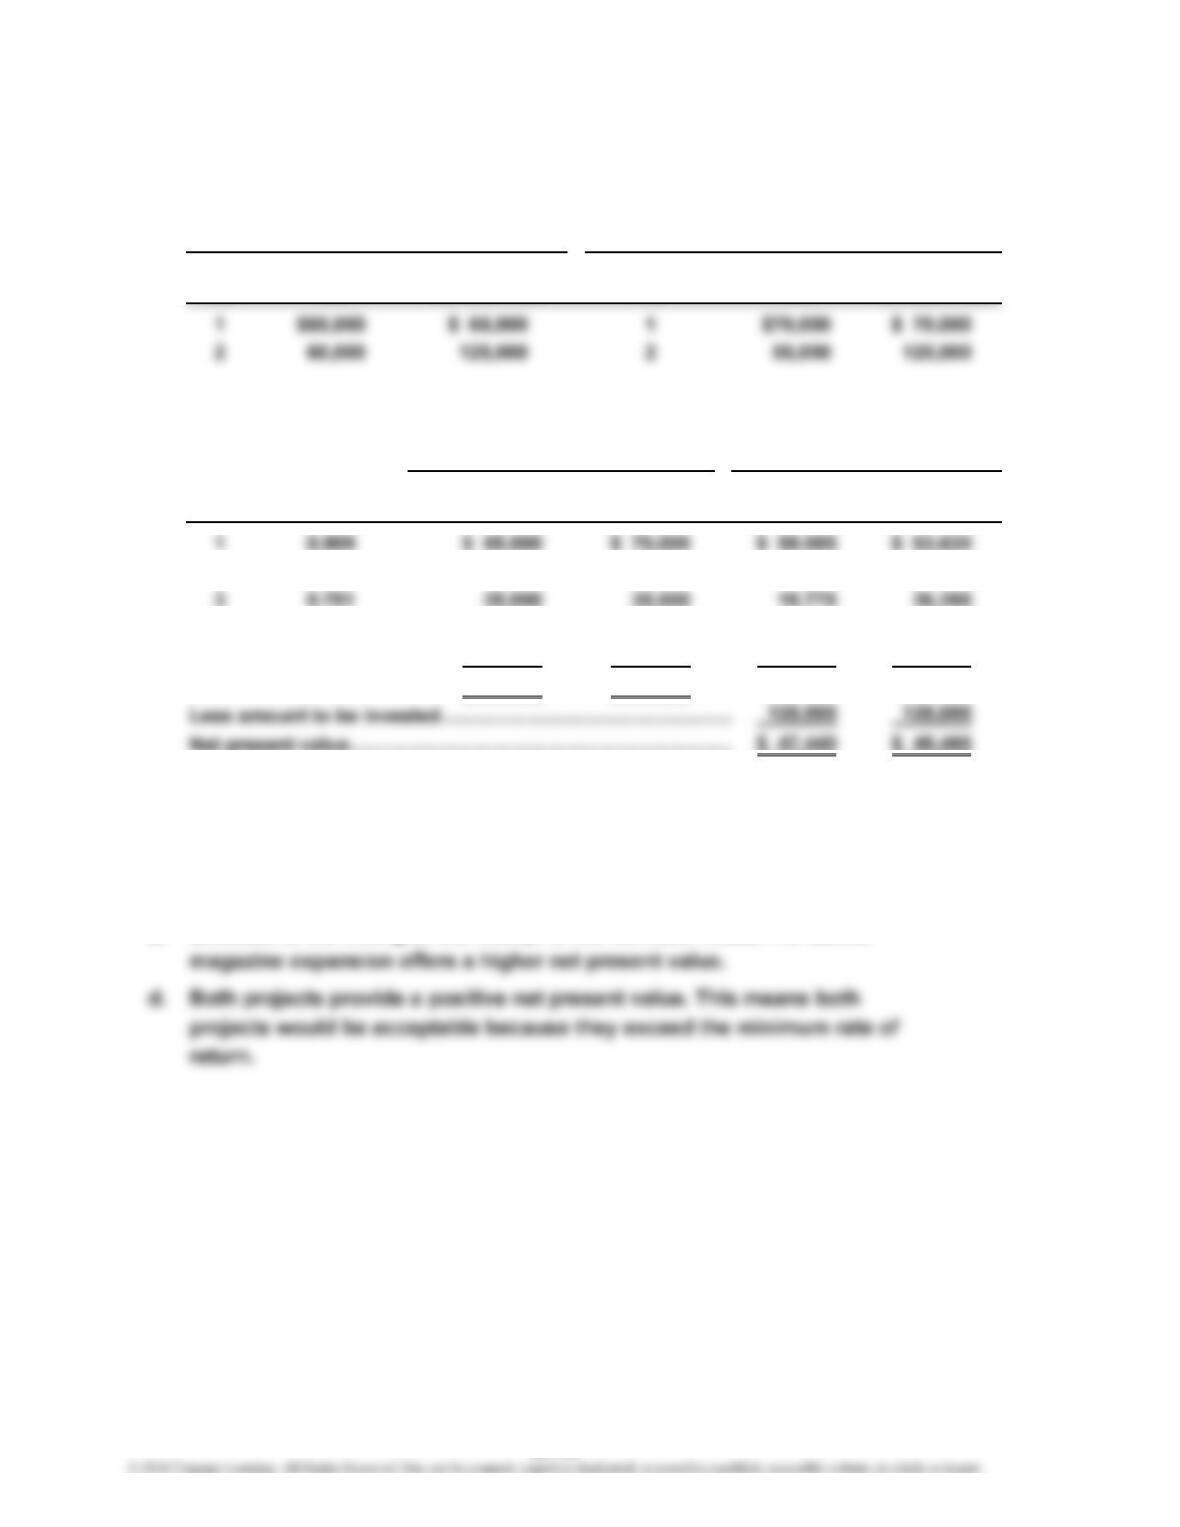
b. Net present value analysis:
Present
Value of Sound Pro Sound Pro
Year $1 at 10% Cellar Gamer Cellar Gamer
2 0.826 60,000 55,000 49,560 45,430
4 0.683 25,000 30,000 17,075 20,490
5 0.621 45,000 30,000 27,945 18,630
Total……………………… $220,000 $220,000 $172,440 $174,465
2. The report can take many forms and should include, as a minimum, the
following points:
a. Both projects offer the same total net cash flow.
b. Both projects offer the same cash payback period.
c. Because of the timing of the receipt of the net cash flows, Pro Gamer
Sound Cellar
Net Cash FlowNet Cash Flow
Present Value of
Pro Gamer
25-30
CHAPTER 25 Capital Investment Analysis
Prob. 25–3B (FIN MAN); Prob. 10–3B (MAN)
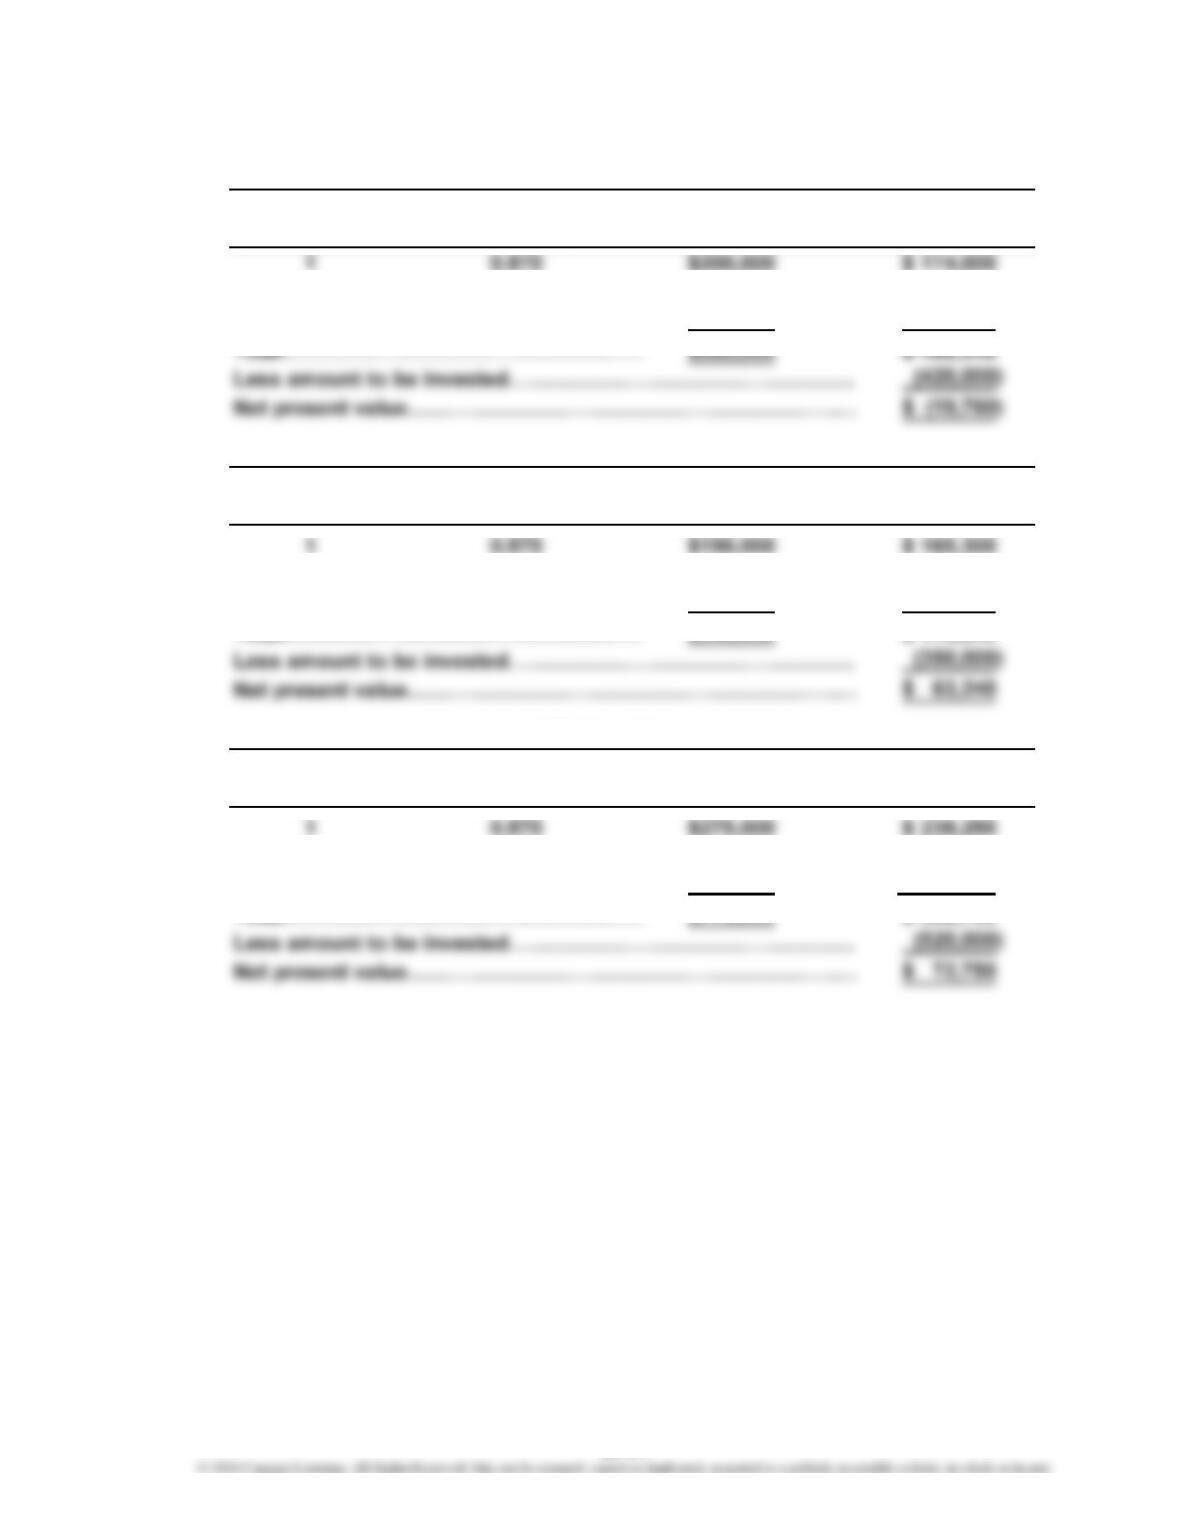
1.
Present Value Net Cash Present Value of
Year of $1 at 15% Flow Net Cash Flow
2 0.756 160,000 120,960
3 0.658 160,000 105,280
…
Present Value Net Cash Present Value of
Year of $1 at 15% Flow Net Cash Flow
2 0.756 180,000 136,080
3 0.658 170,000 111,860
Total……………………………………………
…
$540,000 $ 413,240
Present Value Net Cash Present Value of
Year of $1 at 15% Flow Net Cash Flow
2 0.756 250,000 189,000
3 0.658 250,000 164,500
Total……………………………………………
…
$775,000 $ 592,750
Computer System Upgrade
ATM Kiosk Expansion
Branch Office Expansion
25-31
CHAPTER 25 Capital Investment Analysis
Prob. 25–3B (FIN MAN); Prob. 10–3B (MAN) (Concluded)
$400,240
$420,000
*Rounded
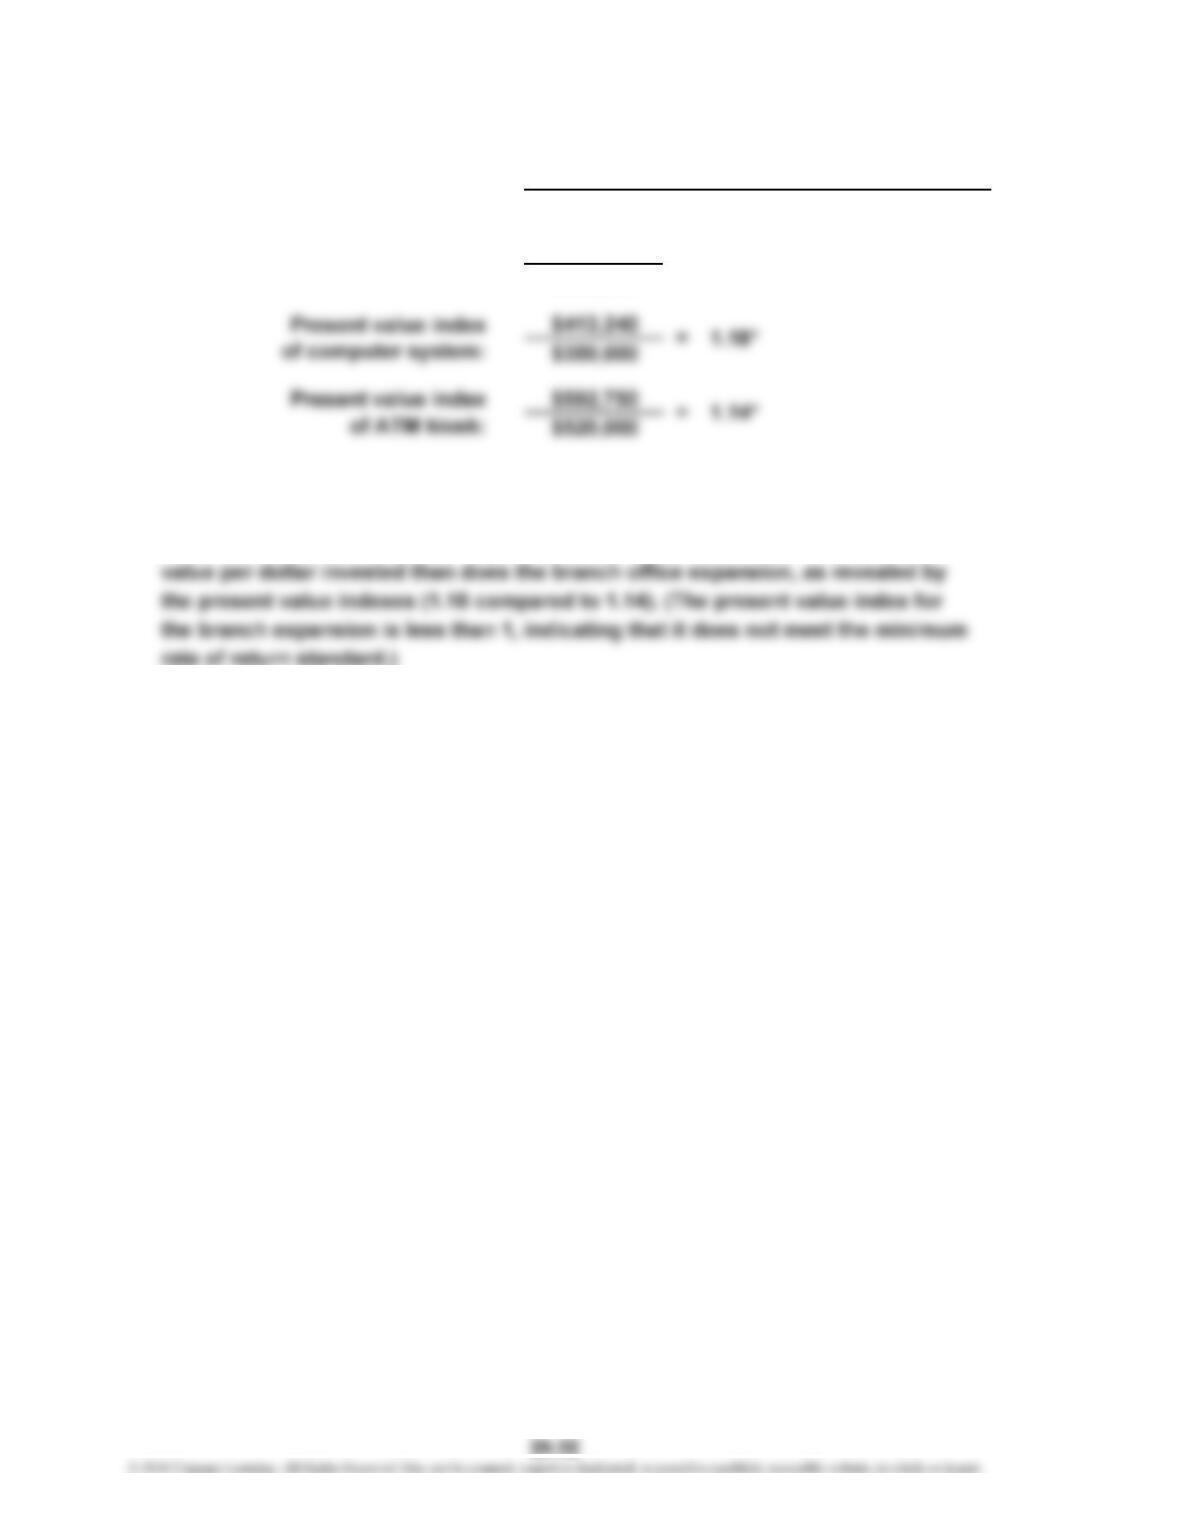
3. The computer system upgrade has the largest present value index. Although the
ATM kiosk expansion has the largest net present value, it returns less present
Present Value Index = Total Present Value of Net Cash Flow
Amount to Be Invested
2.
Present value index
of branch office: = 0.95*