CHAPTER 25 Capital Investment Analysis
Prob. 25–4B (FIN MAN); Prob. 10–4B (MAN)
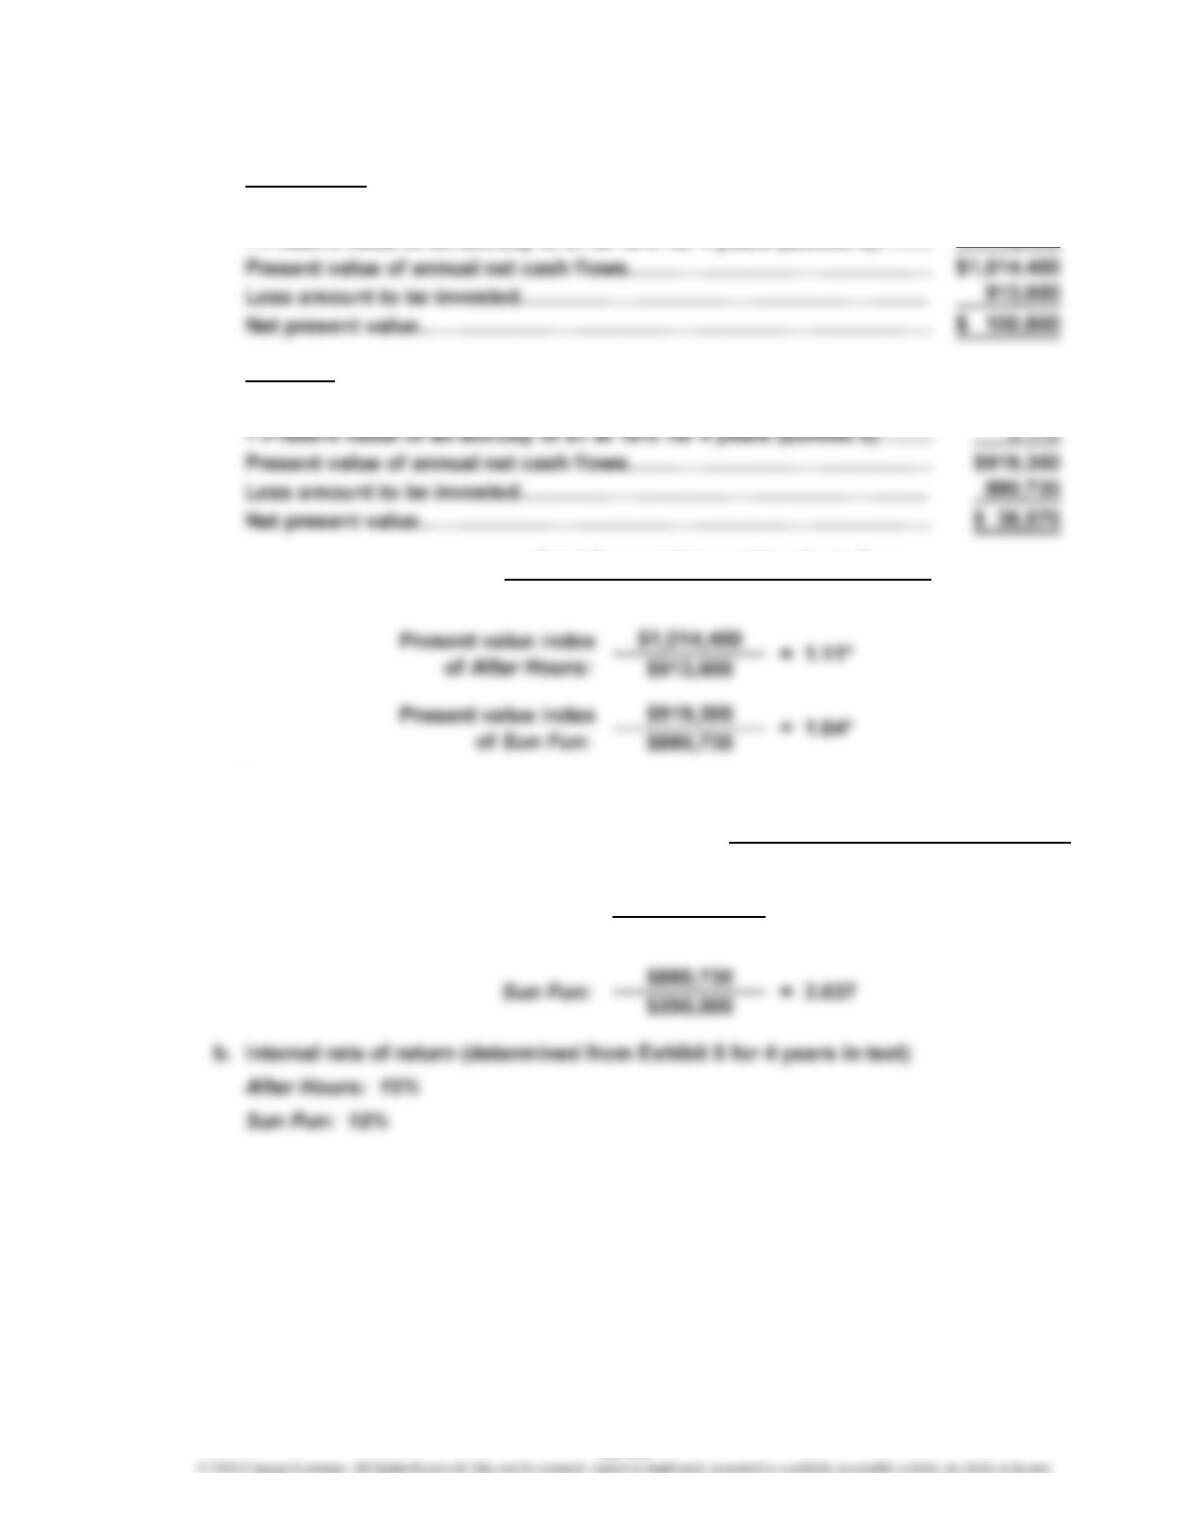
1. a. After Hours:
Annual net cash flow (at the end of each of 4 years)……………………
…
$ 320,000
× Present value of an annuity of $1 at 10% for 4 years (Exhibit 5)……
…
3.170
Sun Fun:
Annual net cash flow (at the end of each of 4 years)……………………
…
$290,000
…
*Rounded
2. Present Value Factor for an Annuity of $1 Amount to Be Invested
Annual Net Cash Flow
a. =
After Hours: $913,600 = 2.855
$320,000
b.
Present Value Index =
Total Present Value of Net Cash Flow
Amount to Be Invested
25-33
…
CHAPTER 25 Capital Investment Analysis
Prob. 25–4B (FIN MAN); Prob. 10–4B (MAN) (Concluded)
3. The net present value, present value index, and internal rate of return all
indicate that After Hours is a better financial opportunity compared to
Sun Fun, although both investments meet the minimum return criterion of
25-34
CHAPTER 25 Capital Investment Analysis
Prob. 25–5B (FIN MAN); Prob. 10–5B (MAN)
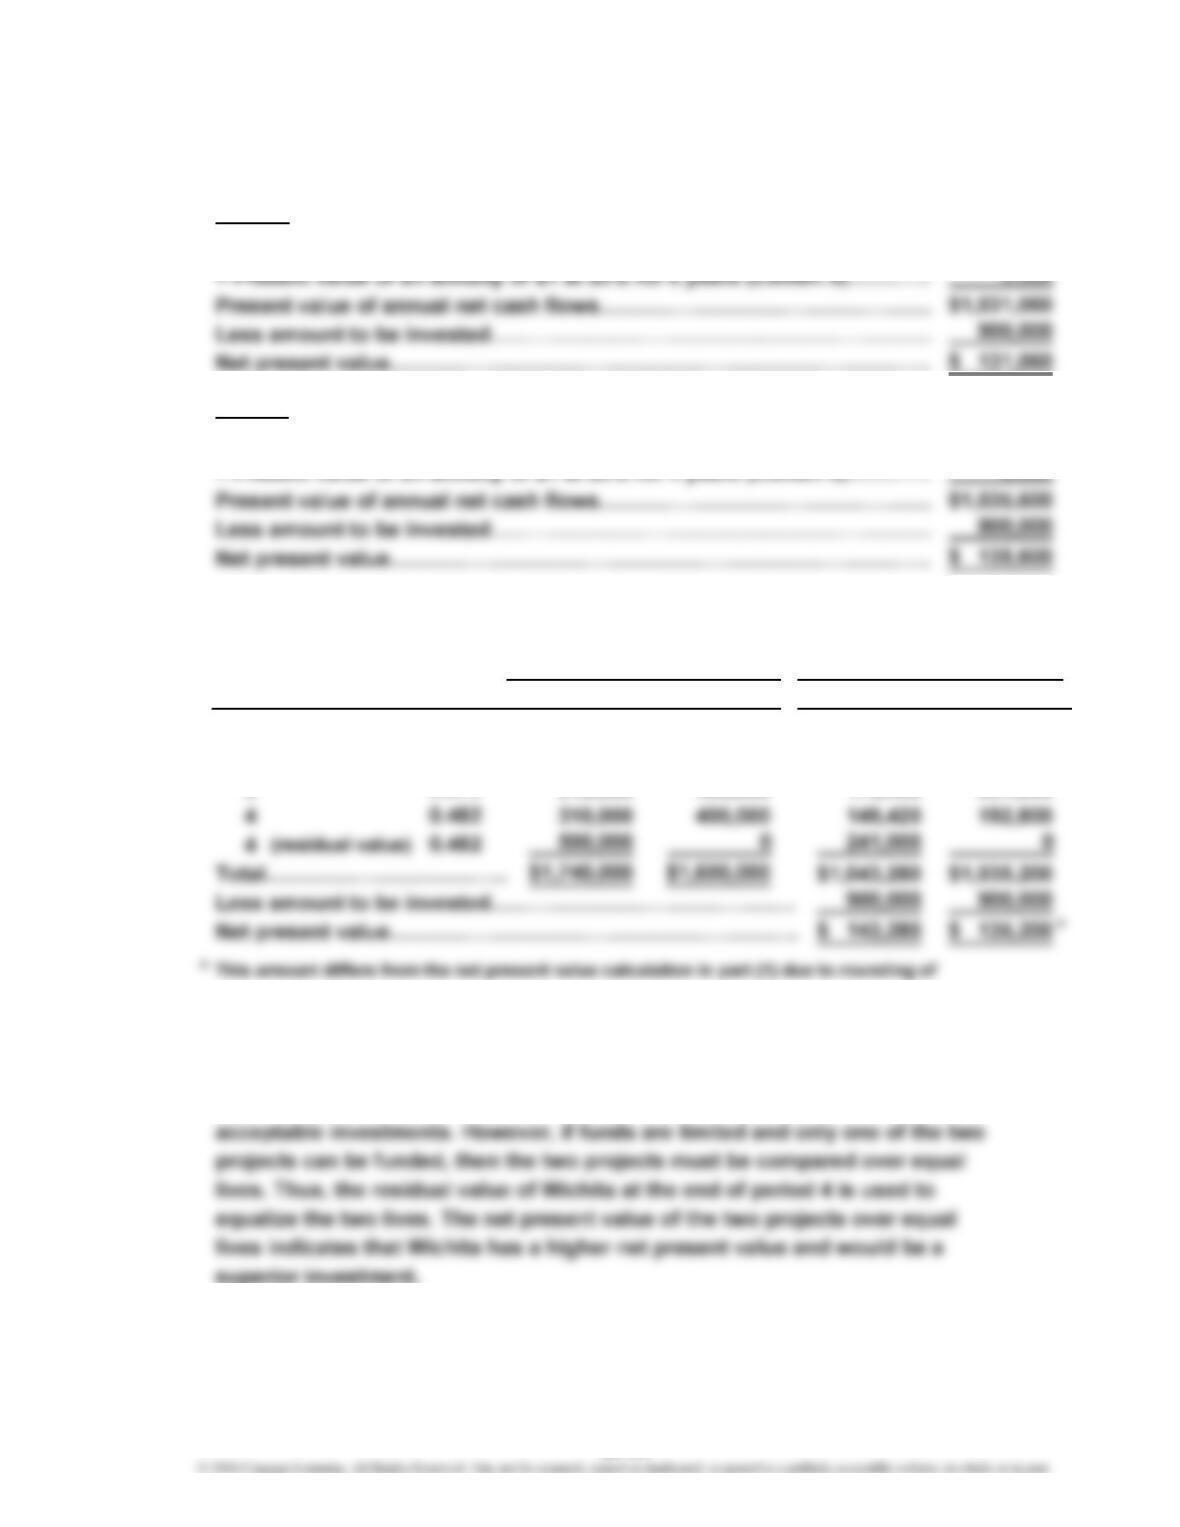
1. Net present value analysis:
Wichita:
Annual net cash flow (at the end of each of 6 years)………………………… $ 310,000
Topeka:
Annual net cash flow (at the end of each of 4 years)………………………… $ 400,000
× Present value of an annuity of $1 at 20% for 4 years (Exhibit 5)………… 2.589
2. Net present value analysis:
Wichita Topeka Wichita
1 $ 310,000 $ 400,000 $ 258,230 $ 333,200
2 310,000 400,000 215,140 277,600
3 310,000 400,000 179,490 231,600
present value factors.
3. To: Investment Committee
Both Wichita and Topeka have a positive net present value. This means
that both projects meet our minimum expected return of 20% and would be
Net Cash FlowNet Cash Flow
Present Value of
$1 at 20%
Value of
Present
Topeka
Year
0.833
0.694
0.579
25-35
CHAPTER 25 Capital Investment Analysis
Prob. 25–6B (FIN MAN); Prob. 10–6B (MAN)
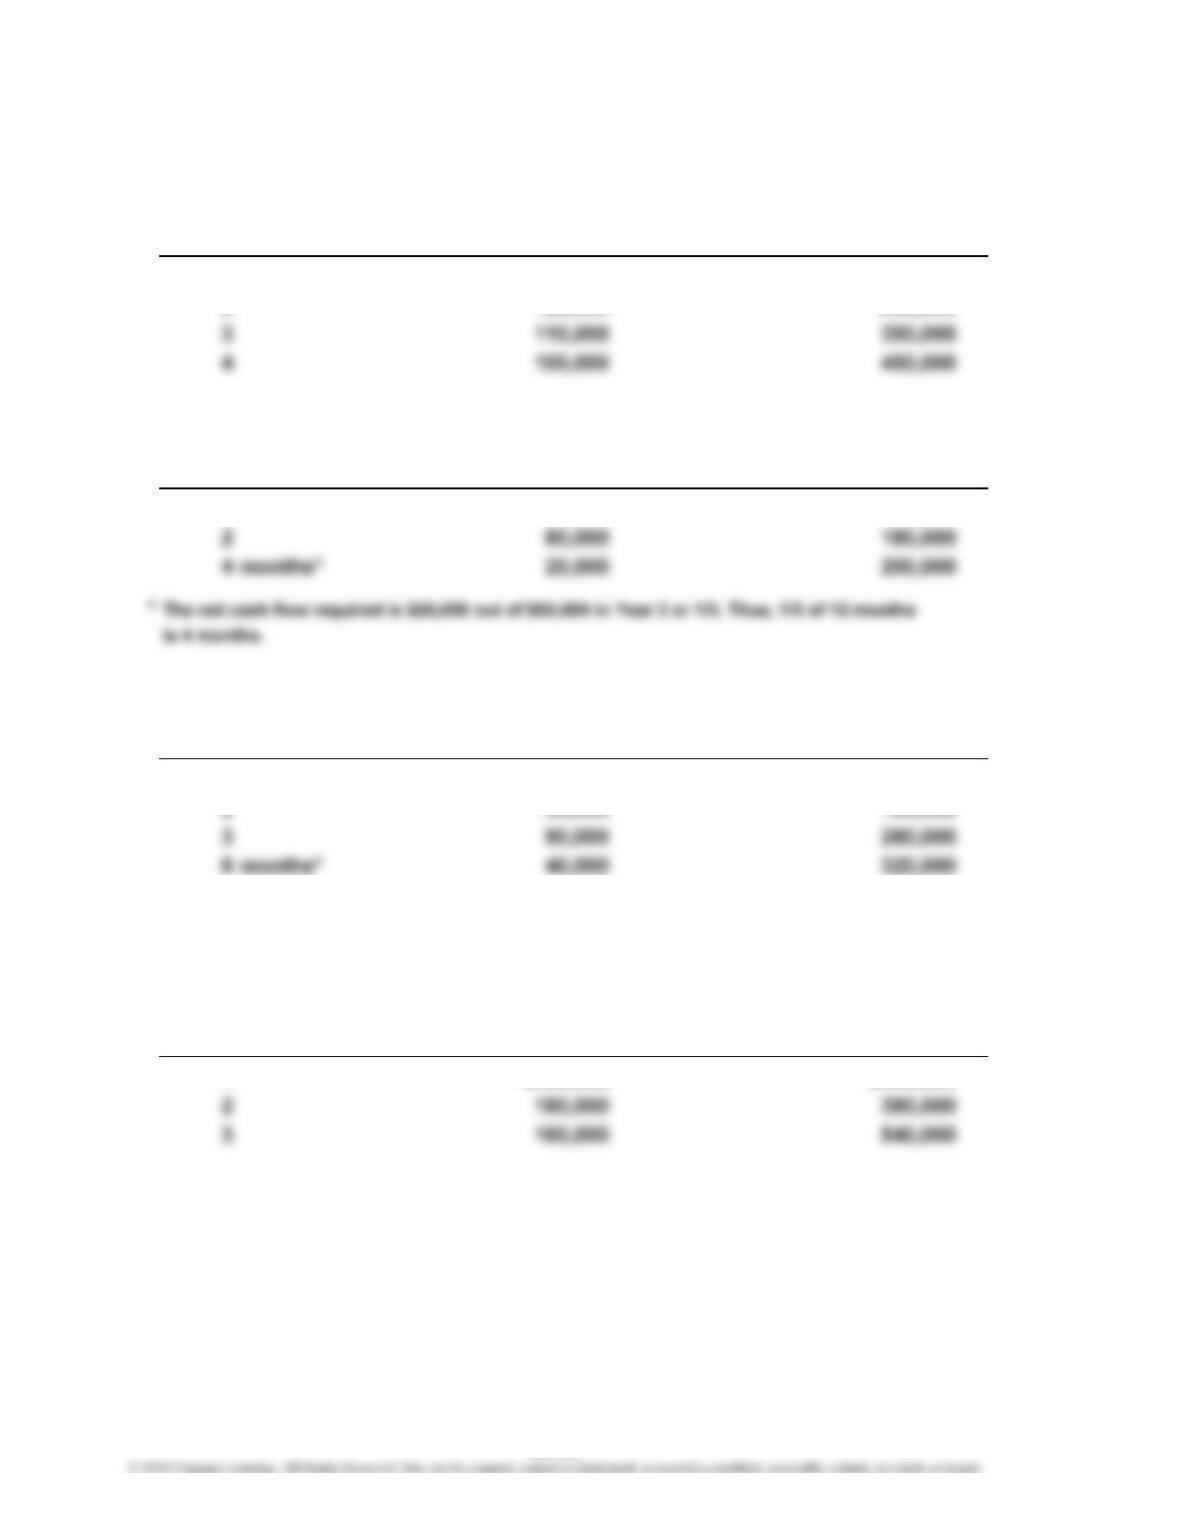
1. Proposal A: 4-year cash payback period, as follows:
Net Cash Cumulative
Year Flow Net Cash Flows
1 $120,000 $120,000
2 120,000 240,000
Proposal B: 2-year, 4-month cash payback period, as follows:
Net Cash Cumulative
Year Flow Net Cash Flows
1 $100,000 $100,000
Proposal C: 3-year, 6-month cash payback period, as follows:
Net Cash Cumulative
Year Flow Net Cash Flows
1 $100,000 $100,000
*The net cash flow required is $40,000 out of $80,000 in Year 4 or 1/2. Thus, 1/2 of 12 months
is 6 months.
Proposal D: 3-year payback period, as follows:
Net Cash Cumulative
Year Flow Net Cash Flows
1 $200,000 $200,000
25-36
CHAPTER 25 Capital Investment Analysis
Prob. 25–6B (FIN MAN); Prob. 10–6B (MAN) (Continued)
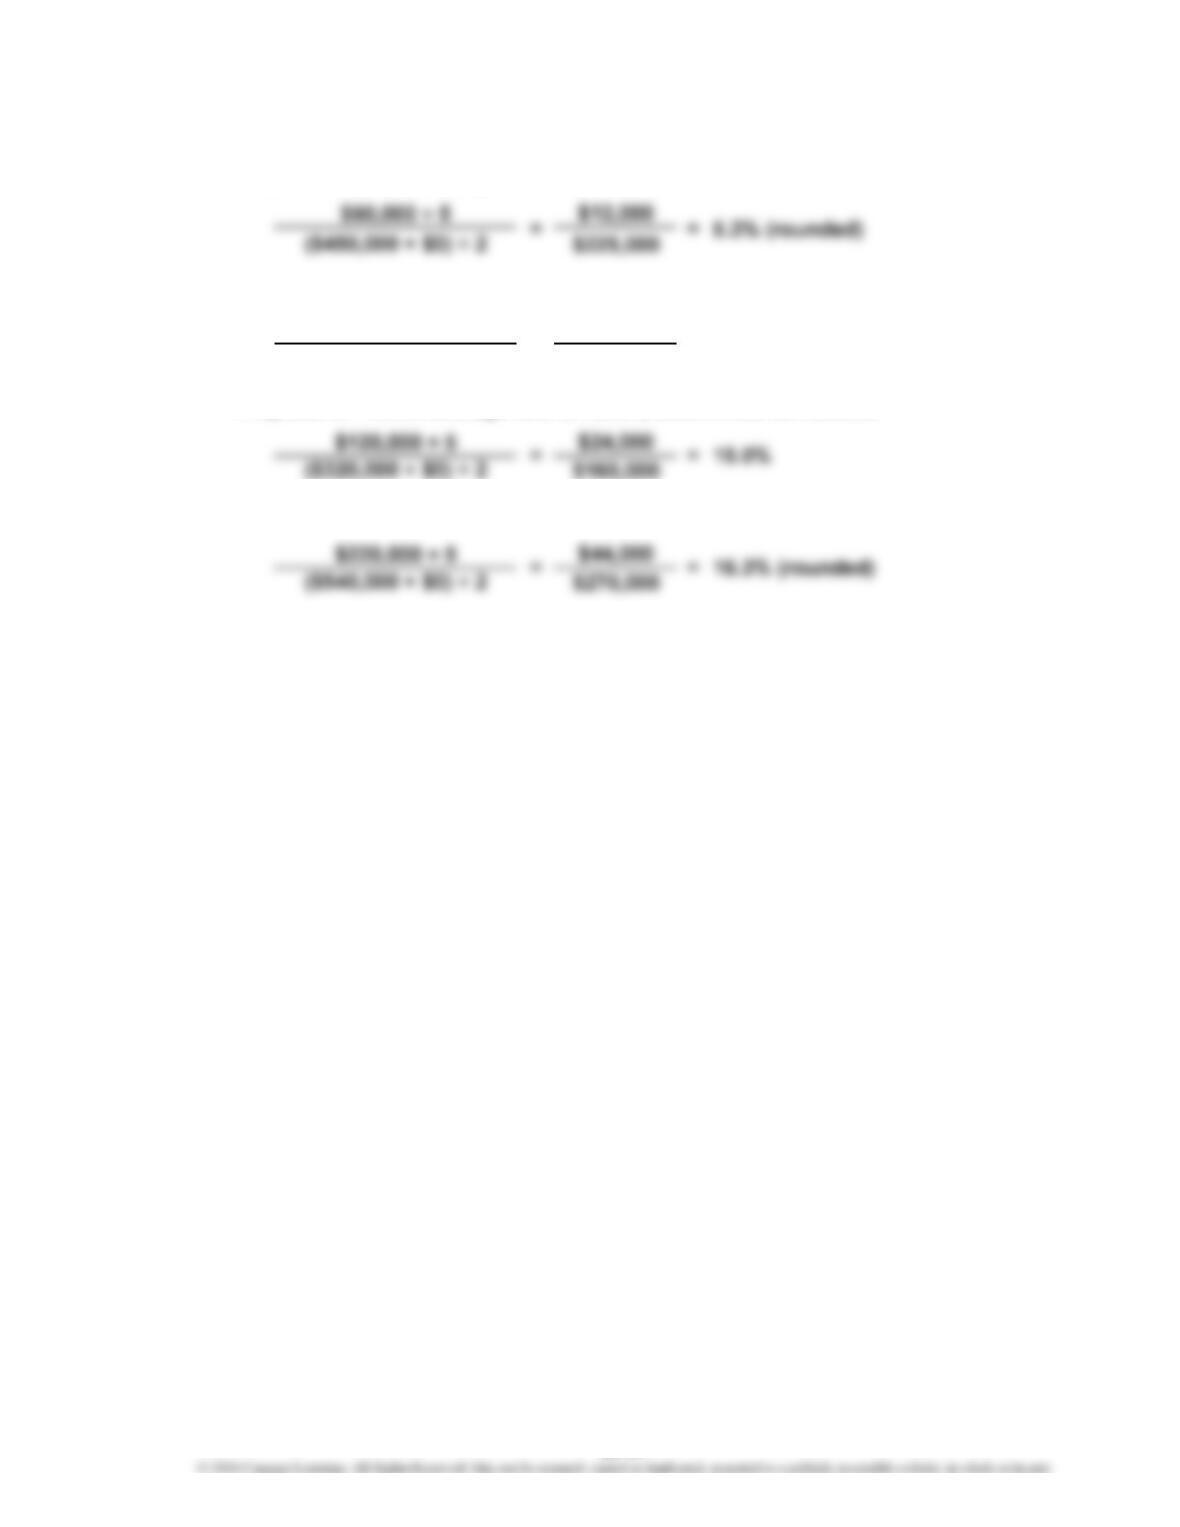
2. Proposal A: 5.3% average rate of return, determined as follows:
Proposal B: 18.0% average rate of return, determined as follows:
$18,000
$100,000
Proposal C: 15.0% average rate of return, determined as follows:
Proposal D: 16.3% average rate of return, determined as follows:
18.0%
=
($200,000 + $0) ÷ 2
$90,000 ÷ 5
=
25-37
CHAPTER 25 Capital Investment Analysis
Prob. 25–6B (FIN MAN); Prob. 10–6B (MAN) (Continued)
3. Of the four proposed investments, only Proposals B and D meet the company’s
requirements, as the following table indicates:
Cash Payback Average Rate Accept for
Proposal Period of Return Further Analysis Reject
A 4 yrs. 5.3% X
*Proposal C is rejected because it fails to meet the maximum payback period
requirement, even though it meets the minimum accounting rate of return
requirement.
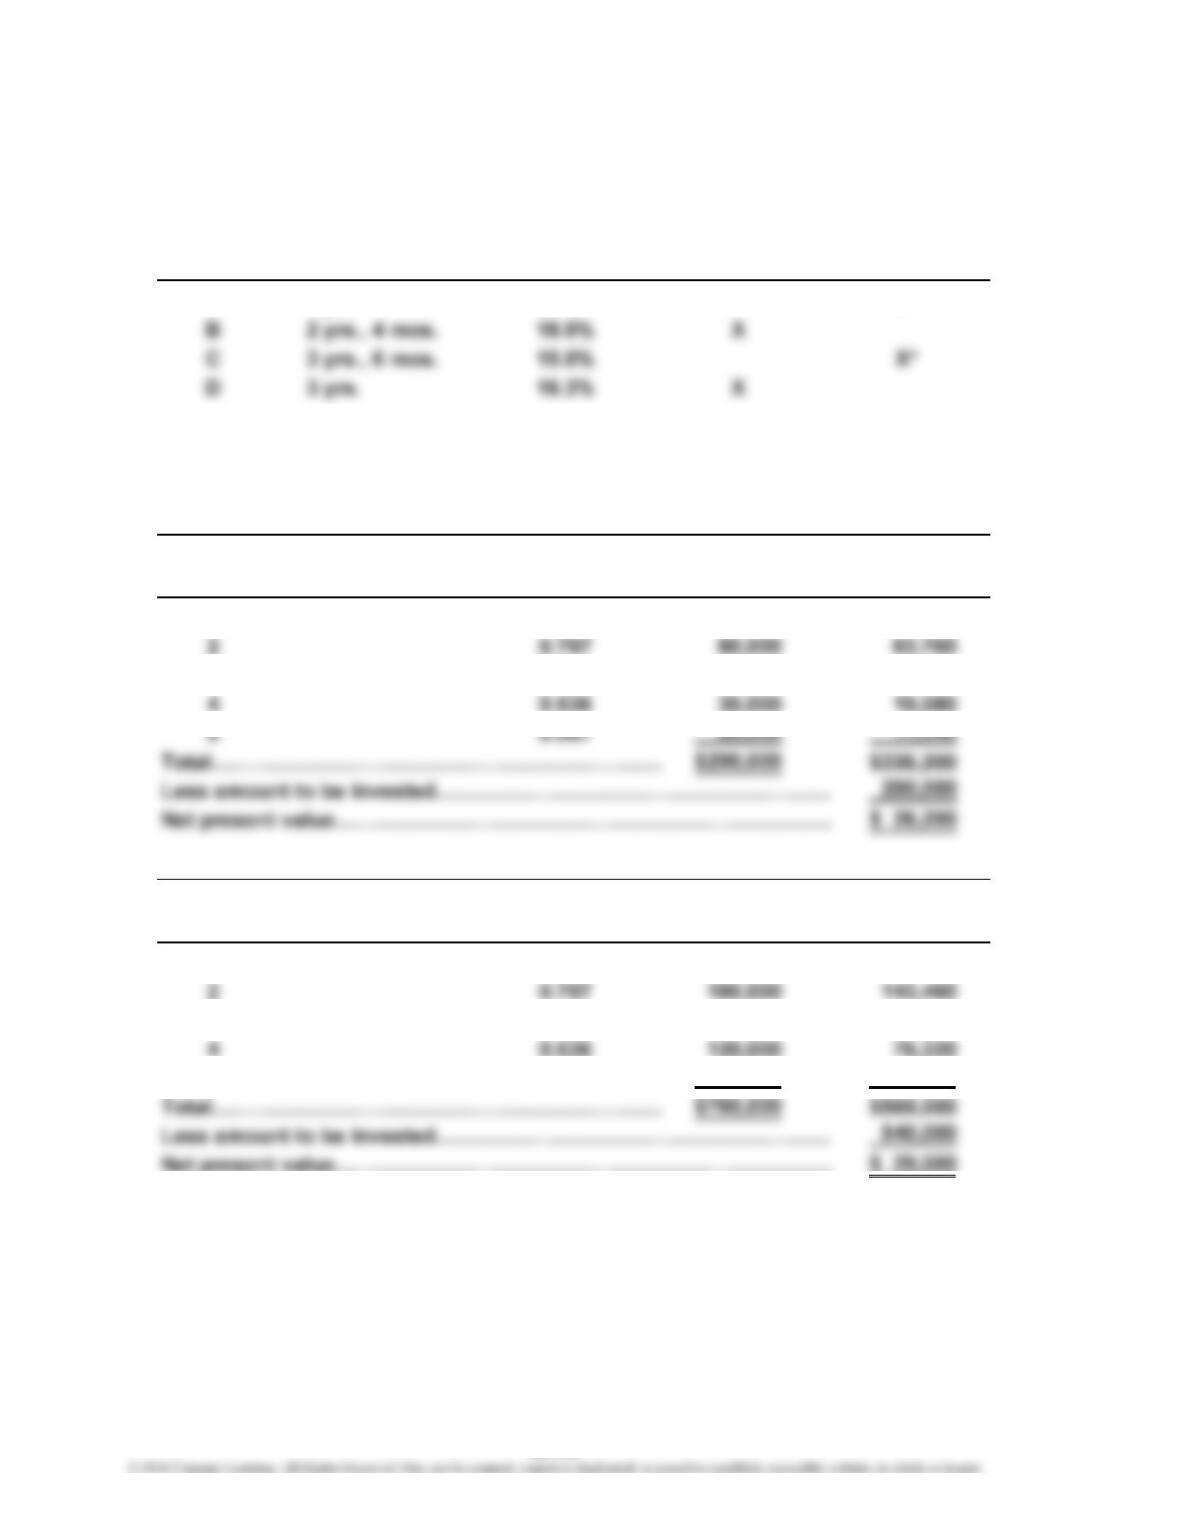
4.
Present Value Net Cash Present Value of
Year of $1 at 12% Flow Net Cash Flow
1 0.893 $100,000 $ 89,300
3 0.712 60,000 42,720
Present Value Net Cash Present Value of
Year of $1 at 12% Flow Net Cash Flow
1 0.893 $200,000 $178,600
3 0.712 160,000 113,920
5 0.567 100,000 56,700
Proposal B
Proposal D
25-38
CHAPTER 25 Capital Investment Analysis
Prob. 25–6B (FIN MAN); Prob. 10–6B (MAN) (Concluded)
*Rounded
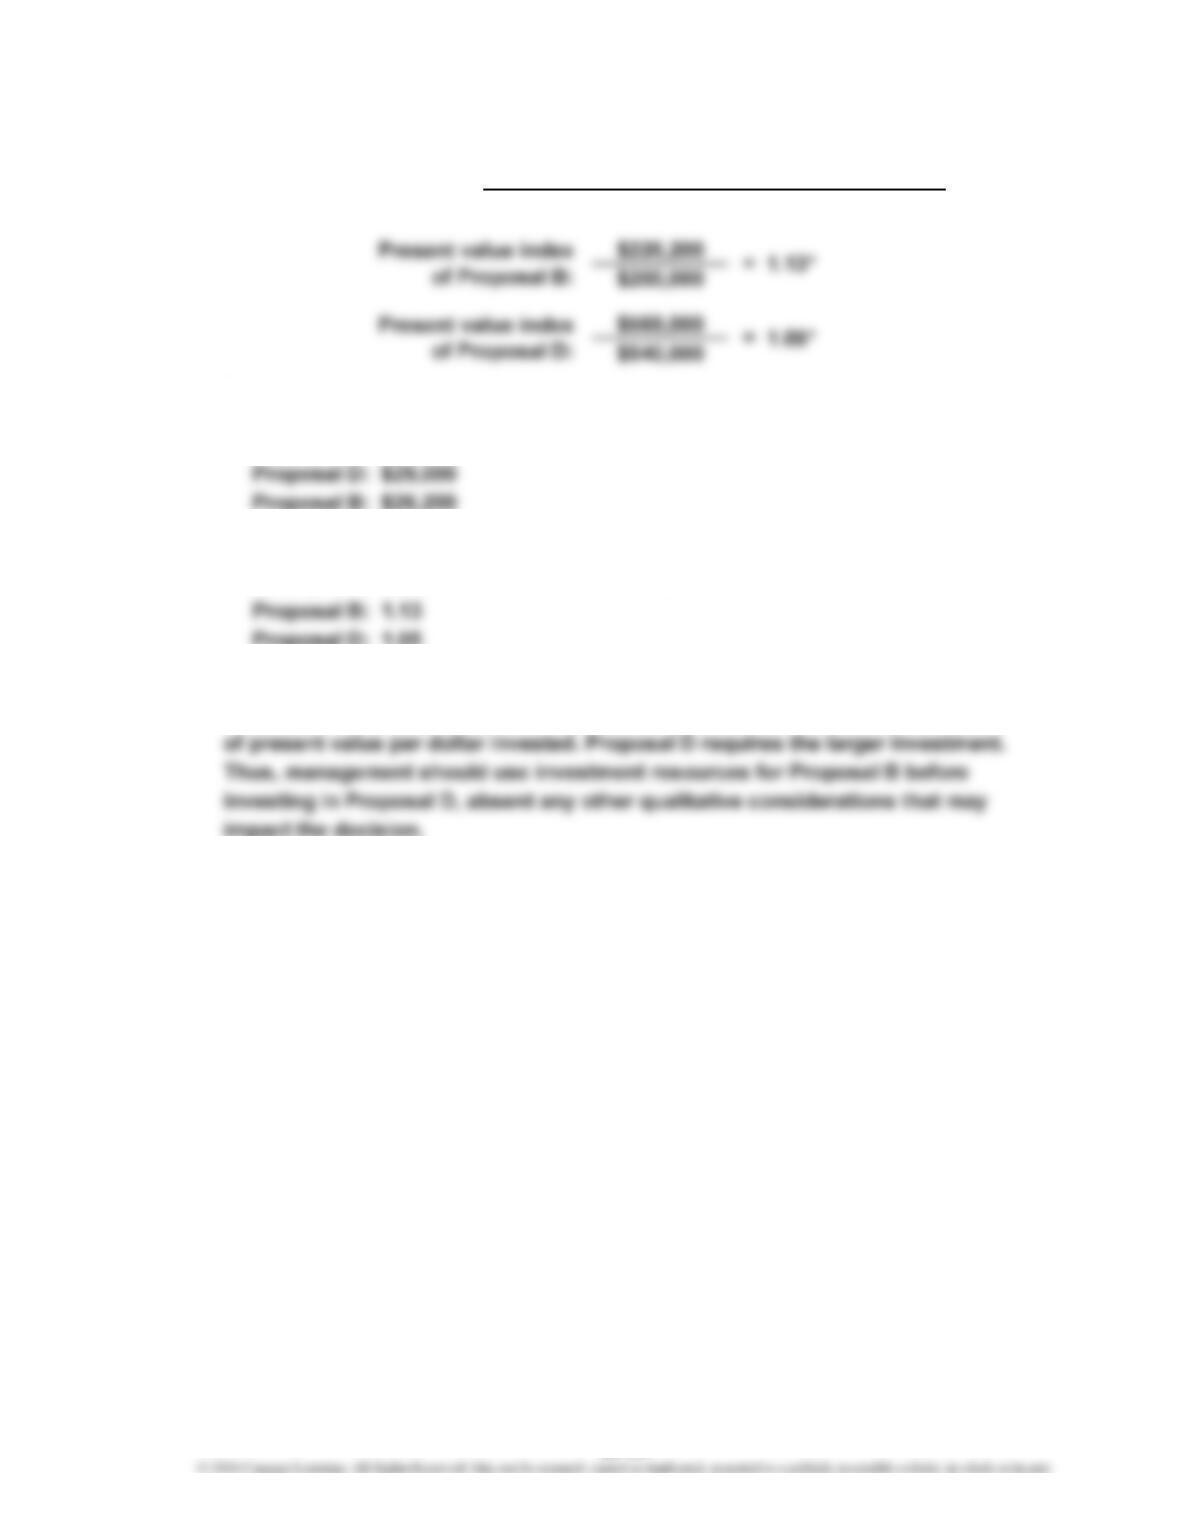
6. Based on the net present value, the proposals should be ranked as follows:
7. Based on the present value index (the amount of present value per dollar
invested), the proposals should be ranked as follows:
Proposal D: 1.05
8. The present value indexes indicate that although Proposal D has the larger
net present value, it is not as attractive as Proposal B in terms of the amount
5.
Present Value Index =
Total Present Value of Net Cash Flow
Amount to Be Invested
25-39
CHAPTER 25 Capital Investment Analysis
CP 25–1 (FIN MAN); CP 10–1 (MAN)
The plant manager wants a project to become accepted and places pressure on the
analyst to come up with the “right numbers.” Jerrod is right when he states that the net
present value analysis has many assumptions and room for interpretation. Many use
this room for interpretation to work the numbers until they satisfy the minimum return
(hurdle) rate. In fact, some analysts state that they start with the hurdle rate and work
back into the numbers. Clearly, this is not what should be expected of Danielle.
This very difficult issue revolves around the nature of ethical dilemmas. Danielle has
brief tenure with the organization. She has very little organizational clout and could
easily find her career short-circuited by crossing Jerrod. It might be tempting for Daniell
e
to slide on this one—after all, who would know? If the project is eventually a failure,
it’s unlikely that the decision would come back to haunt Danielle. Much time will have
passed, and Danielle will likely be in another job in the company. The decision to
confront Jerrod has immediate repercussions. This is the heart of real-world ethical
dilemmas. The dilemma occurs when the ethical decision has grave short-term
consequences (Jerrod short-circuits Danielle’s career) and few seemingly long-term
rewards (no one sees the ethical decision), while the unethical decision looks
appealing in the short term (Jerrod is my friend) and potentially safe in the long term
(who’s going to find out?). The ethical management accountant will recognize these
CASES & PROJECTS
25-40
CHAPTER 25 Capital Investment Analysis
CP 25–2 (FIN MAN); CP 10–2 (MAN)
1. Annual salary…………………………………………………………………………
…
$ 50,000
× Present value of $1 annuity for 10 years at 10%………………………………
…
6.145
2. Annual tuition at the beginning of the graduate year…………………………
…
$ (12,000)
Annual salary…………………………………………………………………………
…
$ 66,000
…
× Present value of $1 for 1 years at 10%…………………………………………
…
0.909
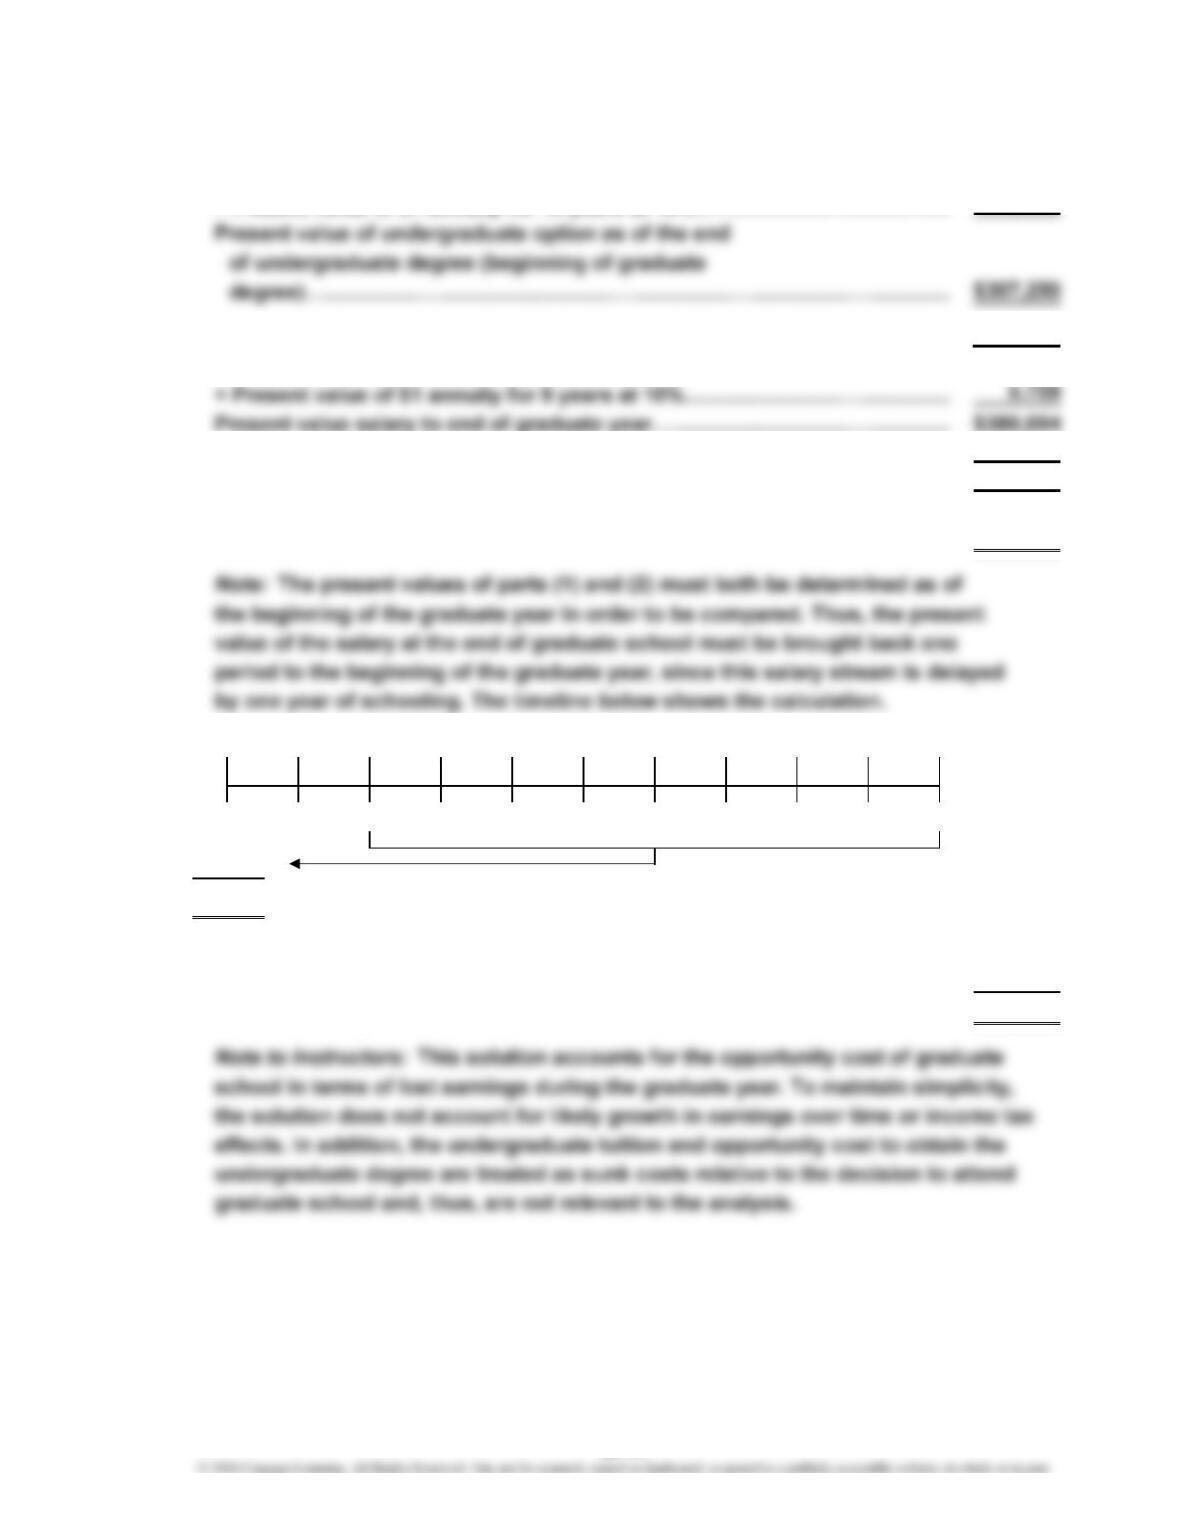
Present value of salary at the beginning of graduate year……………………
…
$345,505
Present value of graduate option at beginning of graduate
year (salary less tuition)……………………………………………………………
…
$333,505
(66,000 × 5.759 × 0.909)
Present value of graduate option…………………………………………………
…
$333,505
Present value of undergraduate option…………………………………………… 307,250
Net benefit of graduate option………………………………………………………
…
$ 26,255
66K
$ (12,000) 66K 66K 66K 66K66K 66K 66K 66K
691078345
$333,505
$345,505
210
25-41
CHAPTER 25 Capital Investment Analysis
CP 25–3 (FIN MAN); CP 10–3 (MAN)
a. Because all the net cash flows are incurred in the local economy under this
assumption, it is likely that the internal rate of return of the new plant will
decline. This is because the cash profits earned on the plant will be less in
U.S. dollars as a result of the devaluation. For example, if the product sold for a
b. If the plant produced for export only, then the expenses would be incurred in
local currency, while the revenues would be earned in U.S. dollars. This could
work in favor of the project because the expenses in U.S. dollar terms would
CP 25–4 (FIN MAN); CP 10–4 (MAN)
In all three companies, the executives indicate that financial investment analysis
plays a minor role in the selection of projects. The reason is that all three companies
CHAPTER 25 Capital Investment Analysis
CP 25–5 (FIN MAN); CP 10–5 (MAN)
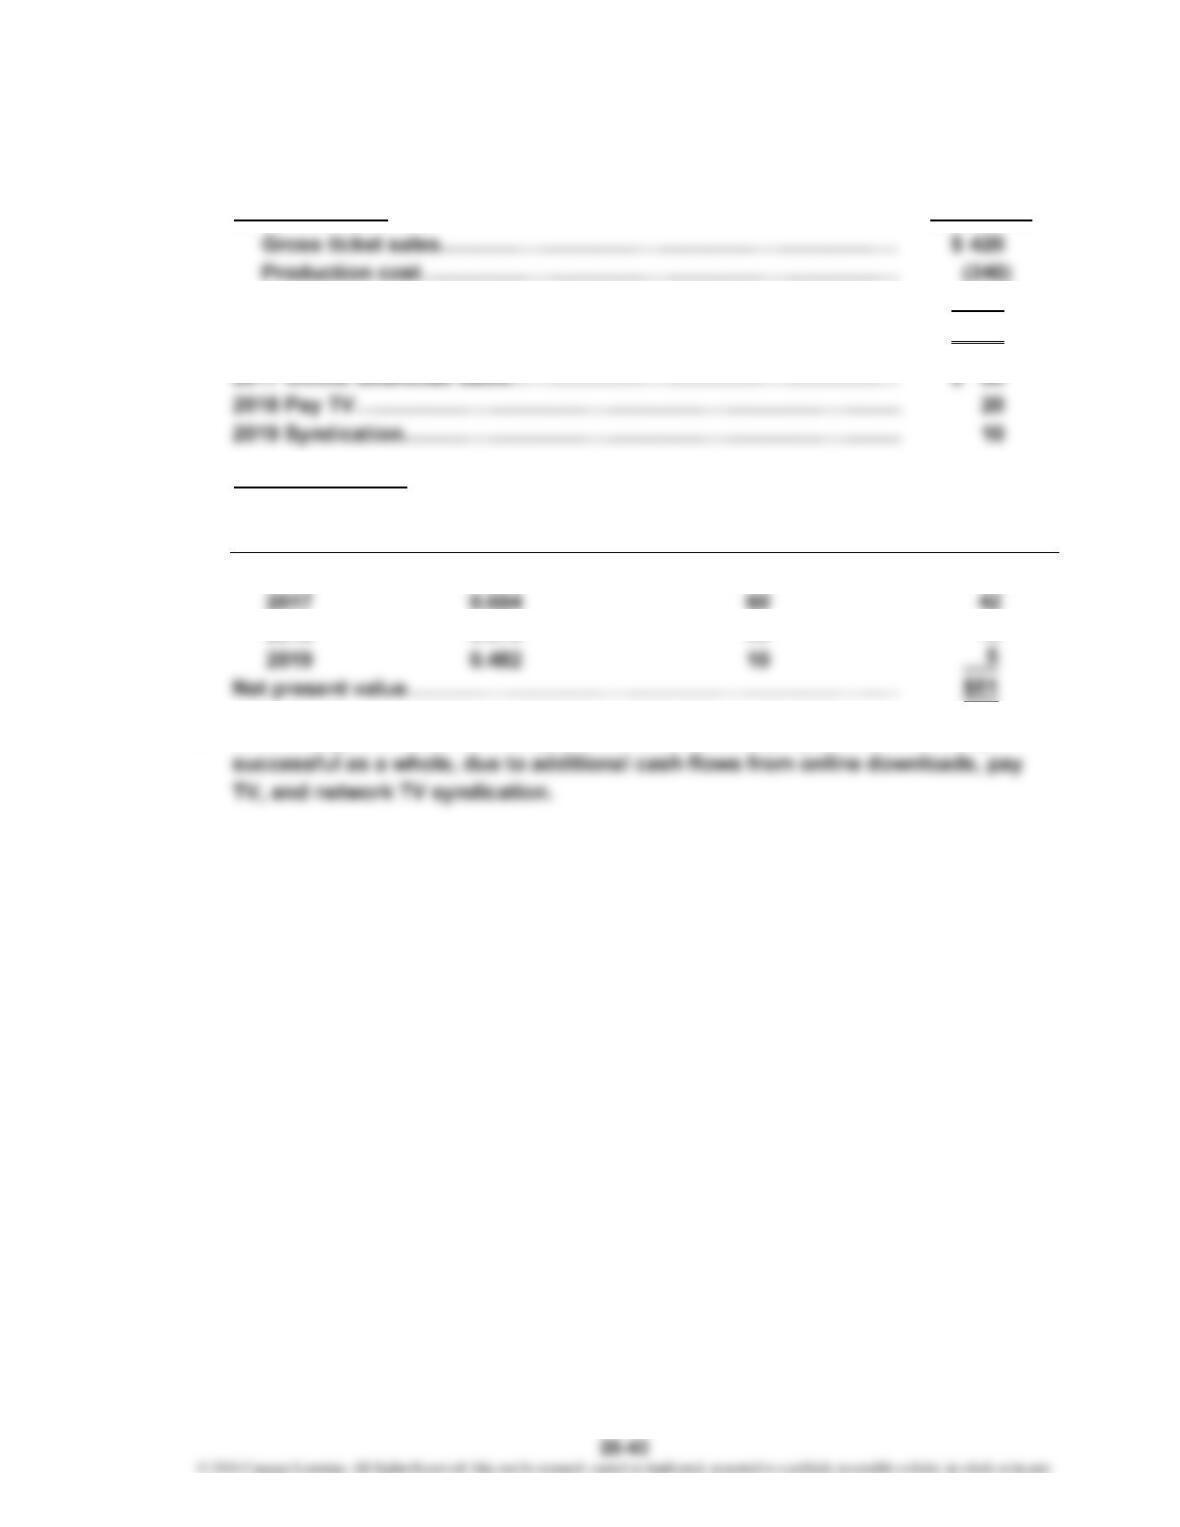
a. All cash flows assumed to occur at the end of the year. All amounts are
2016 cash flow: in millions
Marketing cost……………………………………………………………
…
(90)
Net cash flow from theatrical release……………………………………
…
$ (10)
Net
p
resent value:
Present Value Net Cash Present Value of
Year of $1 at 20% Flow Net Cash Flow
2016 0.833 $(10) $ (8)
2018 0.579 20 12
b. Even though the film lost money at the box office, the project was financially
CHAPTER 25 Capital Investment Analysis
CP 25–6 (FIN MAN); CP 10–6 (MAN)
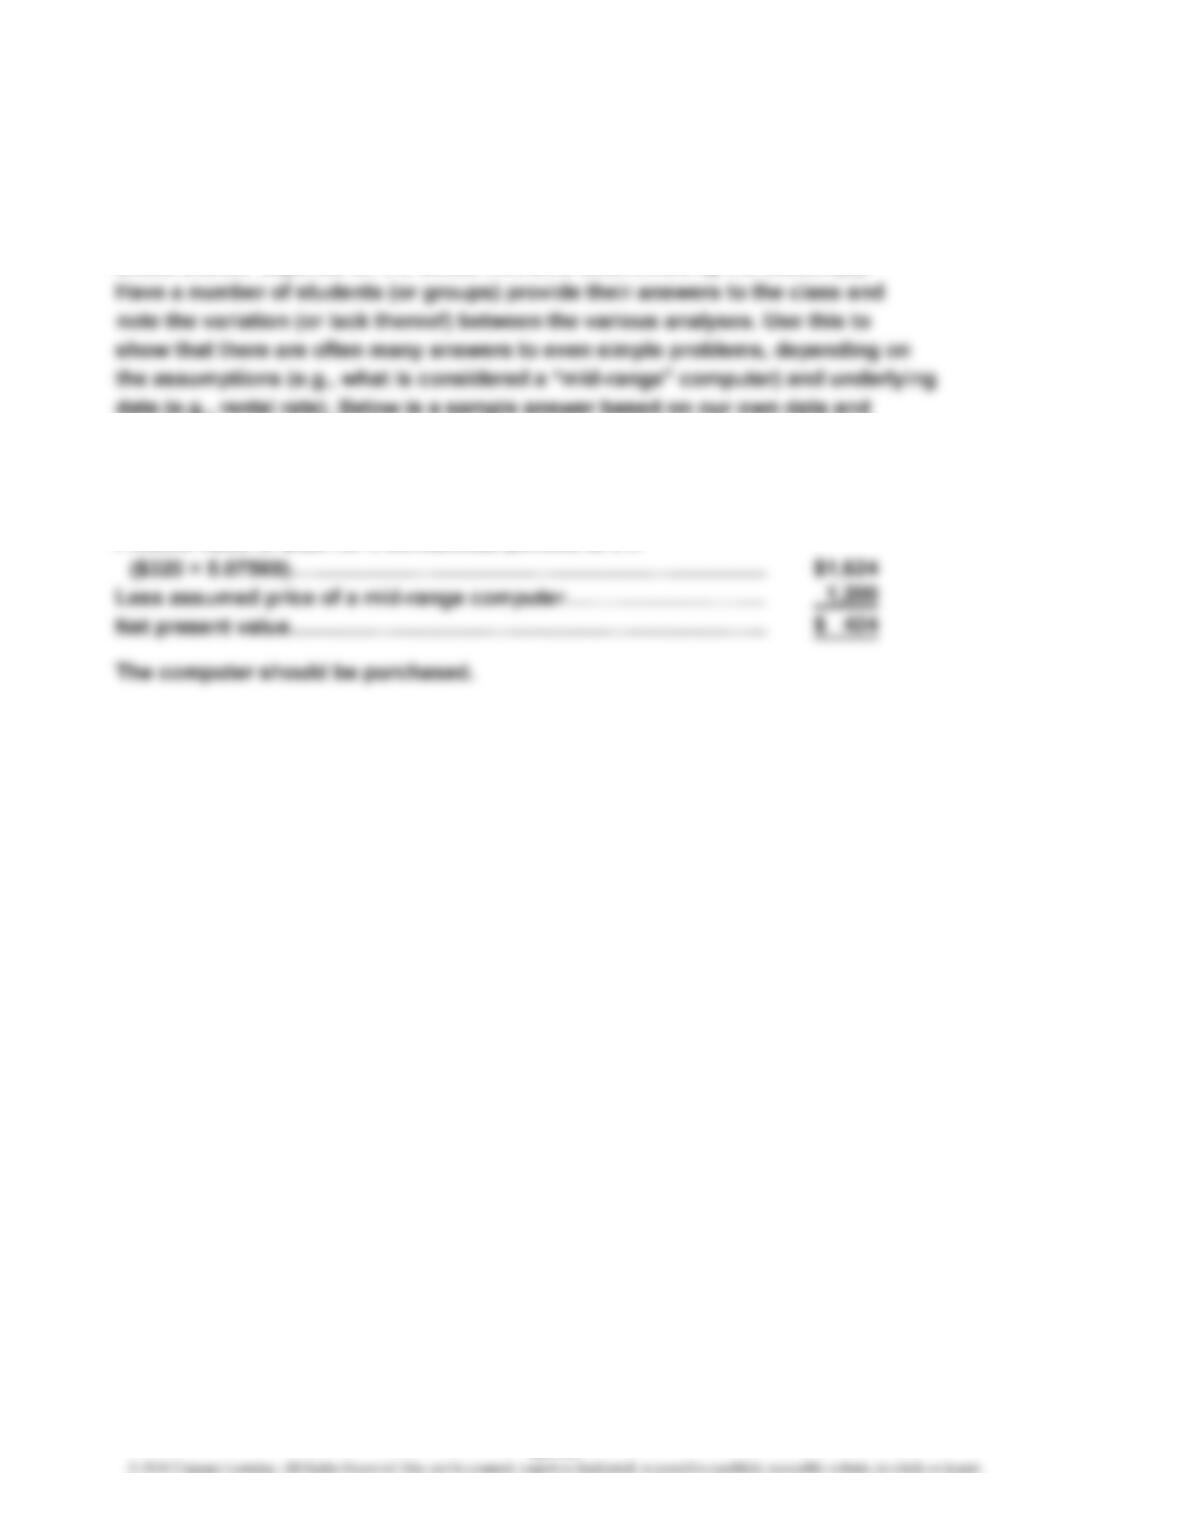
This activity could be assigned individually or in groups. This activity has the
student(s) perform a capital investment analysis for a desktop computer, using
information available to them on the Internet and from a local business. The
actual answer depends on the actual numbers determined by the student(s).
data (e.g., rental rate). Below is a sample answer based on our own data and
assumptions:
Assumed hourly rental rate………………………………………………
…
$8 per hour
Semester cost (40 hours × $8)…………………………………………… $320
Present value of $320 for 6 semiannual periods at 5%
25-44