1. In a centralized operation, all major planning and operating decisions are made by top management
.
In a decentralized operation, managers of separate divisions or units are delegated operating
responsibility. The division (unit) managers are responsible for planning and controlling the
operations of their divisions. Divisions are often structured around products, customers, or
regions.
4. The major shortcoming of using income from operations as a measure of investment center
p
erformance is that it ignores the amount of investment committed to each center. Because
investment center managers also control the amount of assets invested in their centers, they
should be held accountable for the use of invested assets.
5. A division of a decentralized company could be considered the least profitable even though
it earned the largest amount of income from operations, when its rate of return on investment
is the lowest. In this situation, the division would be considered the least profitable per dollar
invested in the division because it generated less profit out of each dollar of assets invested.
6. By dividing income from operations by the amount of invested assets, each division is placed
on a comparable basis of income from operations per dollar invested.
8. The objective of transfer pricing is to encourage each division manager to work in the best
interests of the company. Thus, transfer prices should encourage managers to transfer goods
b
etween divisions if the overall company income can be increased.
9. When unused capacity exists in the supplying division, the negotiated price approach is
p
referred over the market price approach.
CHAPTER 24
DISCUSSION QUESTIONS
DECENTRALIZED OPERATIONS
CHAPTER 24 Decentralized Operations
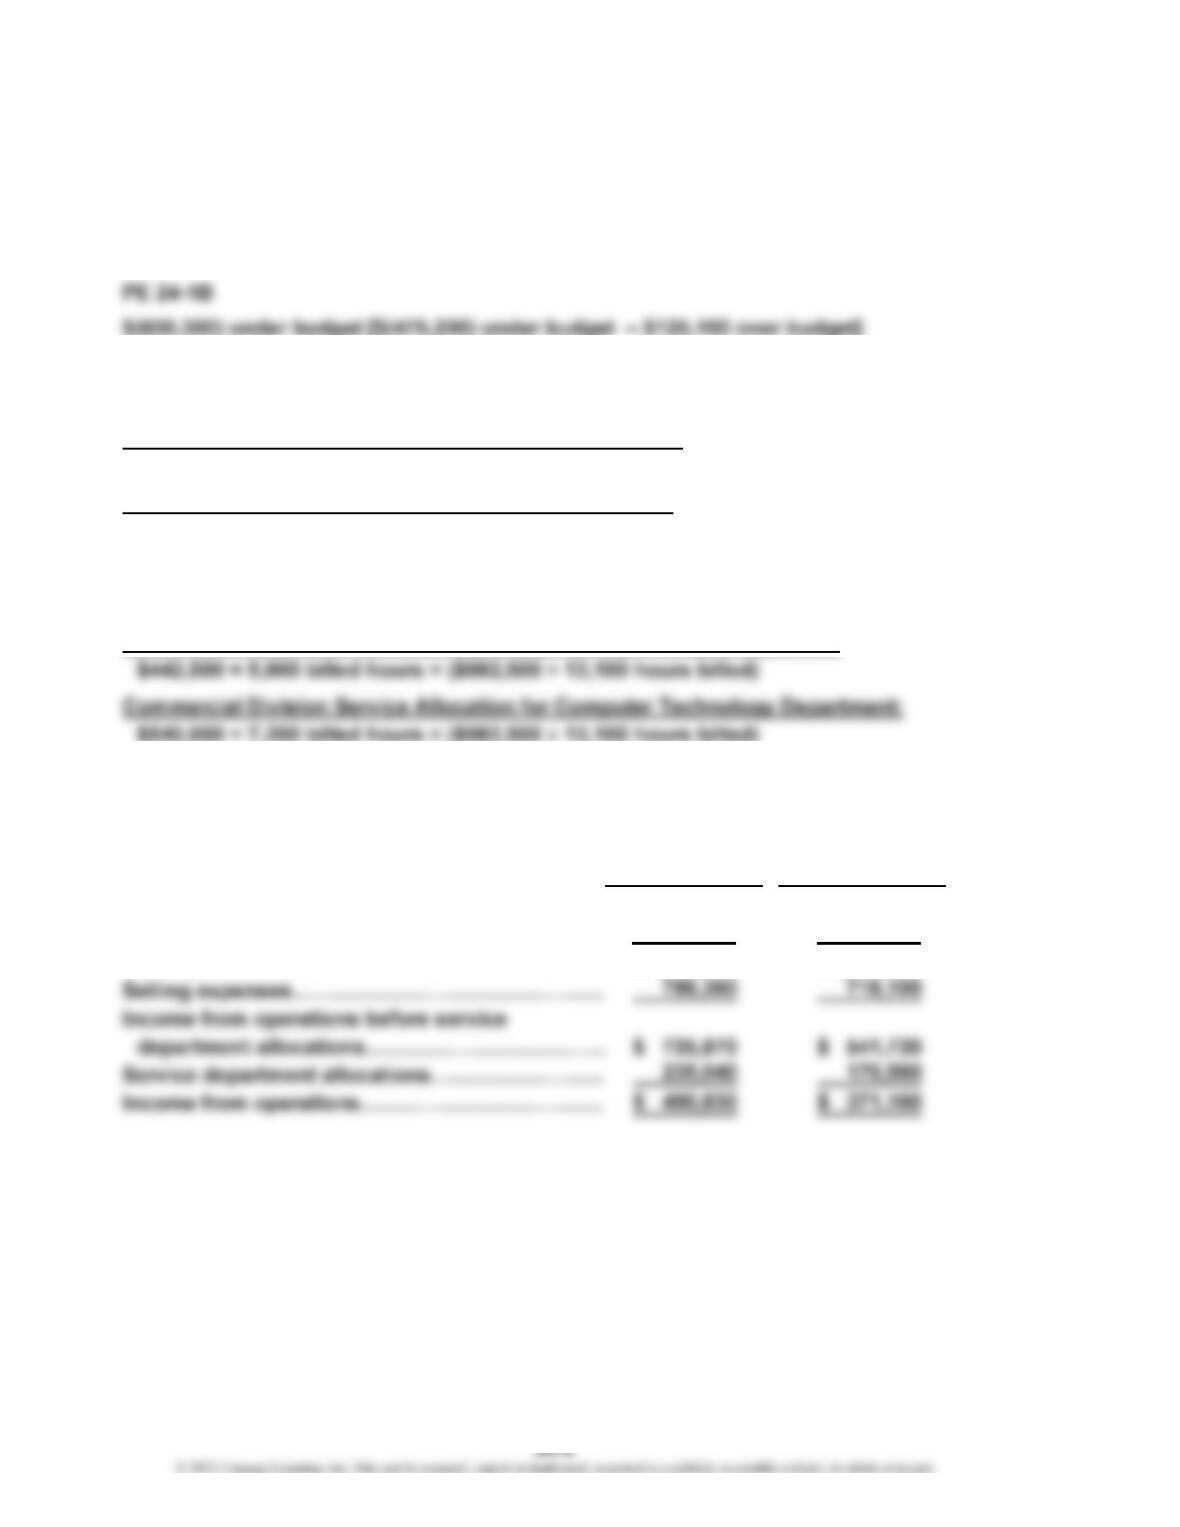
PE 24-1A
$285,700 over budget ($248,800 over budget + $(36,900) under budget)
PE 24-2A
South Division Service Allocation for Travel Department:
$235,040 = 2,260 billed reservations × ($405,600 ÷ 3,900 reservations)
West Division Service Allocation for Travel Department:
$170,560 = 1,640 billed reservations × ($405,600 ÷ 3,900 reservations)
PE 24-2B
Retail Division Service Allocation for Computer Technology Department:
PE 24-3A
South West
Division Division
Sales……………………………………………………
…
$3,150,470 $2,929,810
Cost of goods sold…………………………………… 1,638,240 1,669,990
Gross profit……………………………………………
…
$1,512,230 $1,259,820
PRACTICE EXERCISES
CHAPTER 24 Decentralized Operations
PE 24-3B
Retail Commercial
Division Division
Sales………………………………………………
…
$6,320,000 $4,950,000
Cost of goods sold………………………………
…
3,190,000 2,220,000
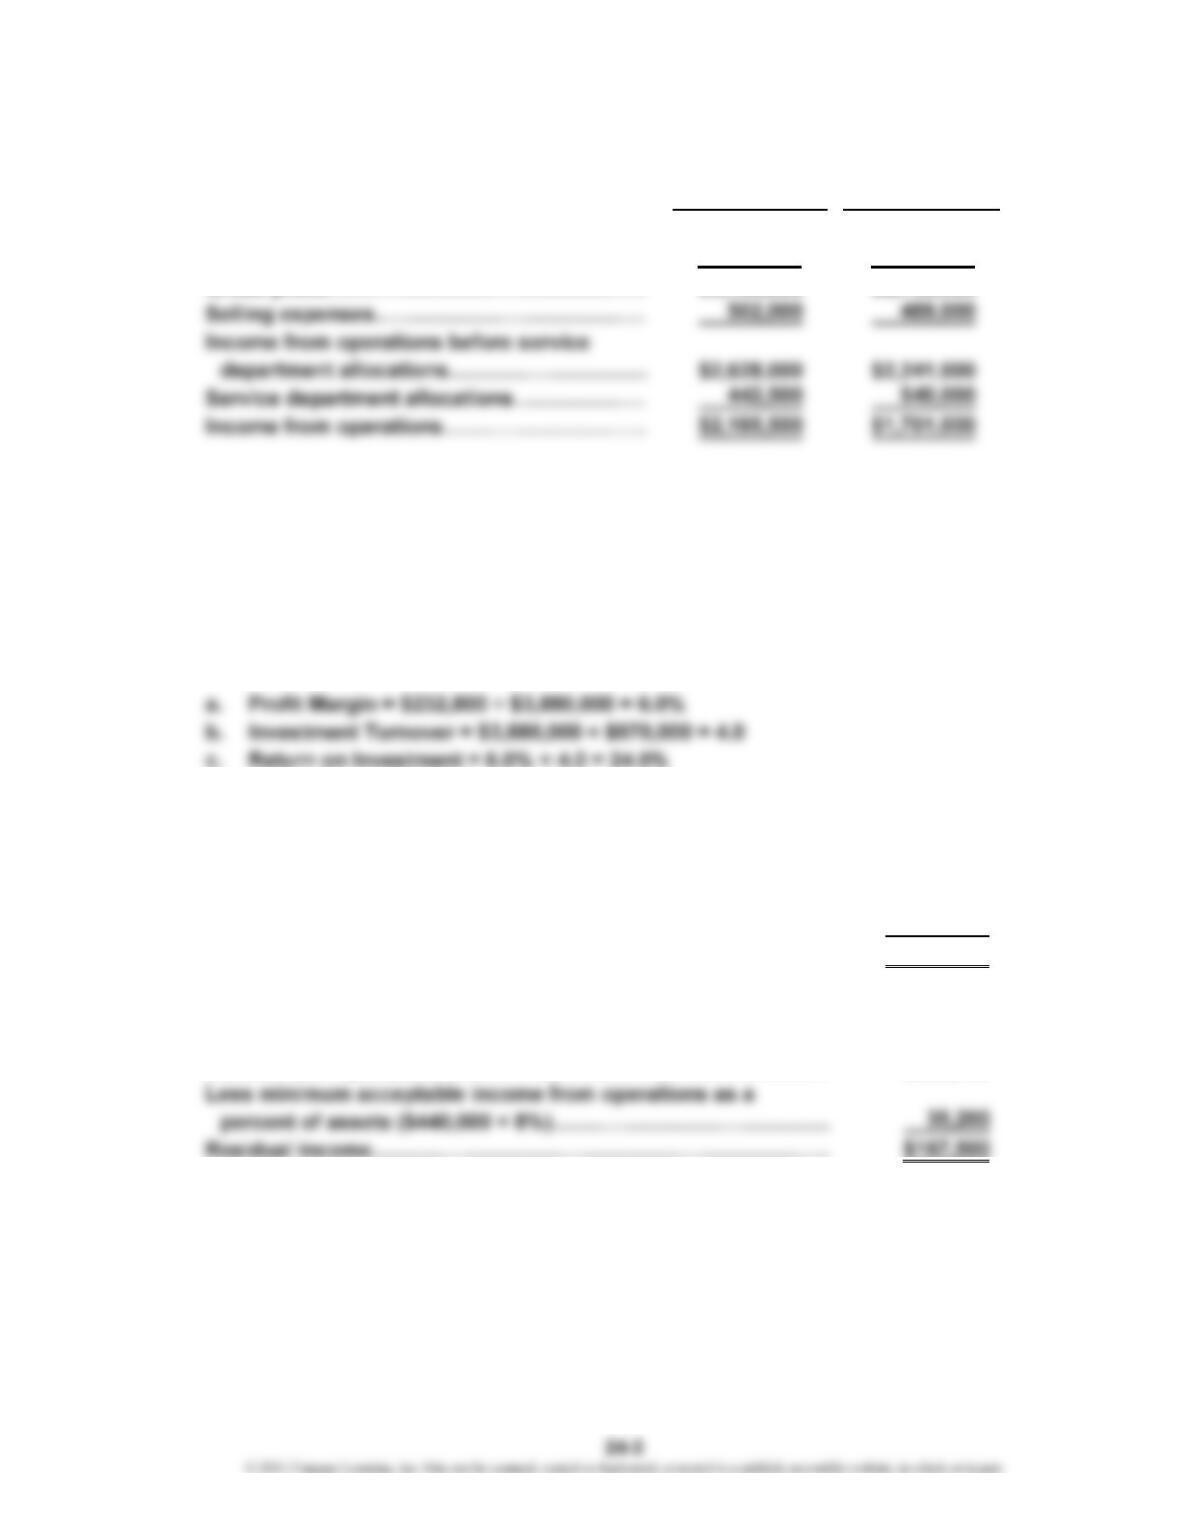
PE 24-4A
a. Profit Margin = $64,800 ÷ $810,000 = 8.0%
b. Investment Turnover = $810,000 ÷ $540,000 = 1.5
c. Return on Investment = 8.0% × 1.5 = 12.0%
PE 24-4B
PE 24-5A
Income from operations………………………………………………
…
$9,043,000
Less minimum acceptable income from operations as a
percent of assets ($57,900,000 × 11%)……………………………
…
6,369,000
Residual income………………………………………………………… $2,674,000
PE 24-5B
Income from operations………………………………………………
…
$202,700
CHAPTER 24 Decentralized Operations
PE 24-6A
PE 24-6B
Increase in Pembroke (Supplying)
Division’s Income from Operations =(Transfer Price – Variable Cost per Unit)
× Units Transferred
Increase in South (Supplying)
Division’s Income from Operations =(Transfer Price – Variable Cost per Unit)
× Units Transferred
CHAPTER 24 Decentralized Operations
Ex. 24-1
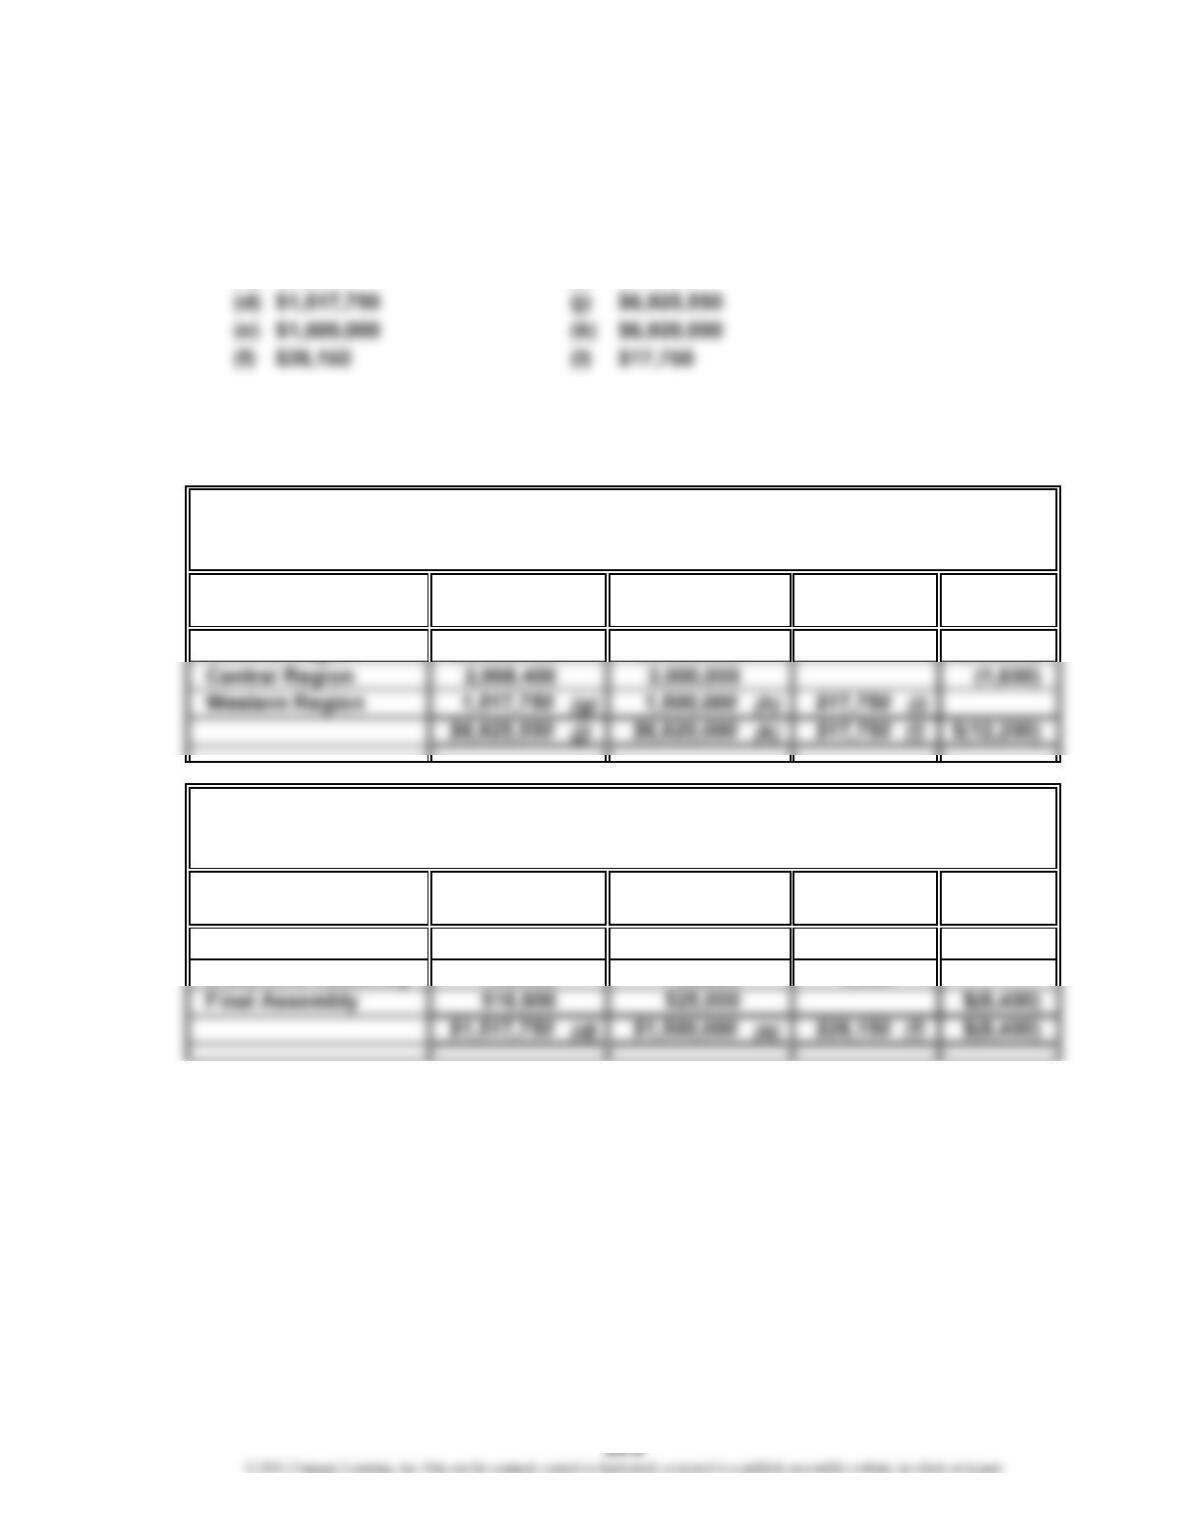
a. (a) $297,950 (g) $1,517,750
(b) $275,000 (h) $1,500,000
(c) $22,950 (i) $17,750
Schedules of supporting computations (answers in italics; the solution requires
working from the department level up to the plant level, then to the vice president
of production level):
(Under)
Budget
Eastern Region $2,420,000 $(10,600)
(Under)
Budget
Chip Fabrication (a) $ 275,000 (b) $22,950 (c)
Actual Budget
Budget
$ 297,950
Department
Over
Actual
$2,409,400
Budget
Garland Company
Budget Performance Report—Manager, Western Region Plant
For the Month Ended November 30
EXERCISES
Garland Company
Budget Performance Report—Vice President, Production
For the Month Ended November 30
BudgetPlant
Over
CHAPTER 24 Decentralized Operations
Ex. 24-1 (Concluded)
(Under)
Budget
Factory wages
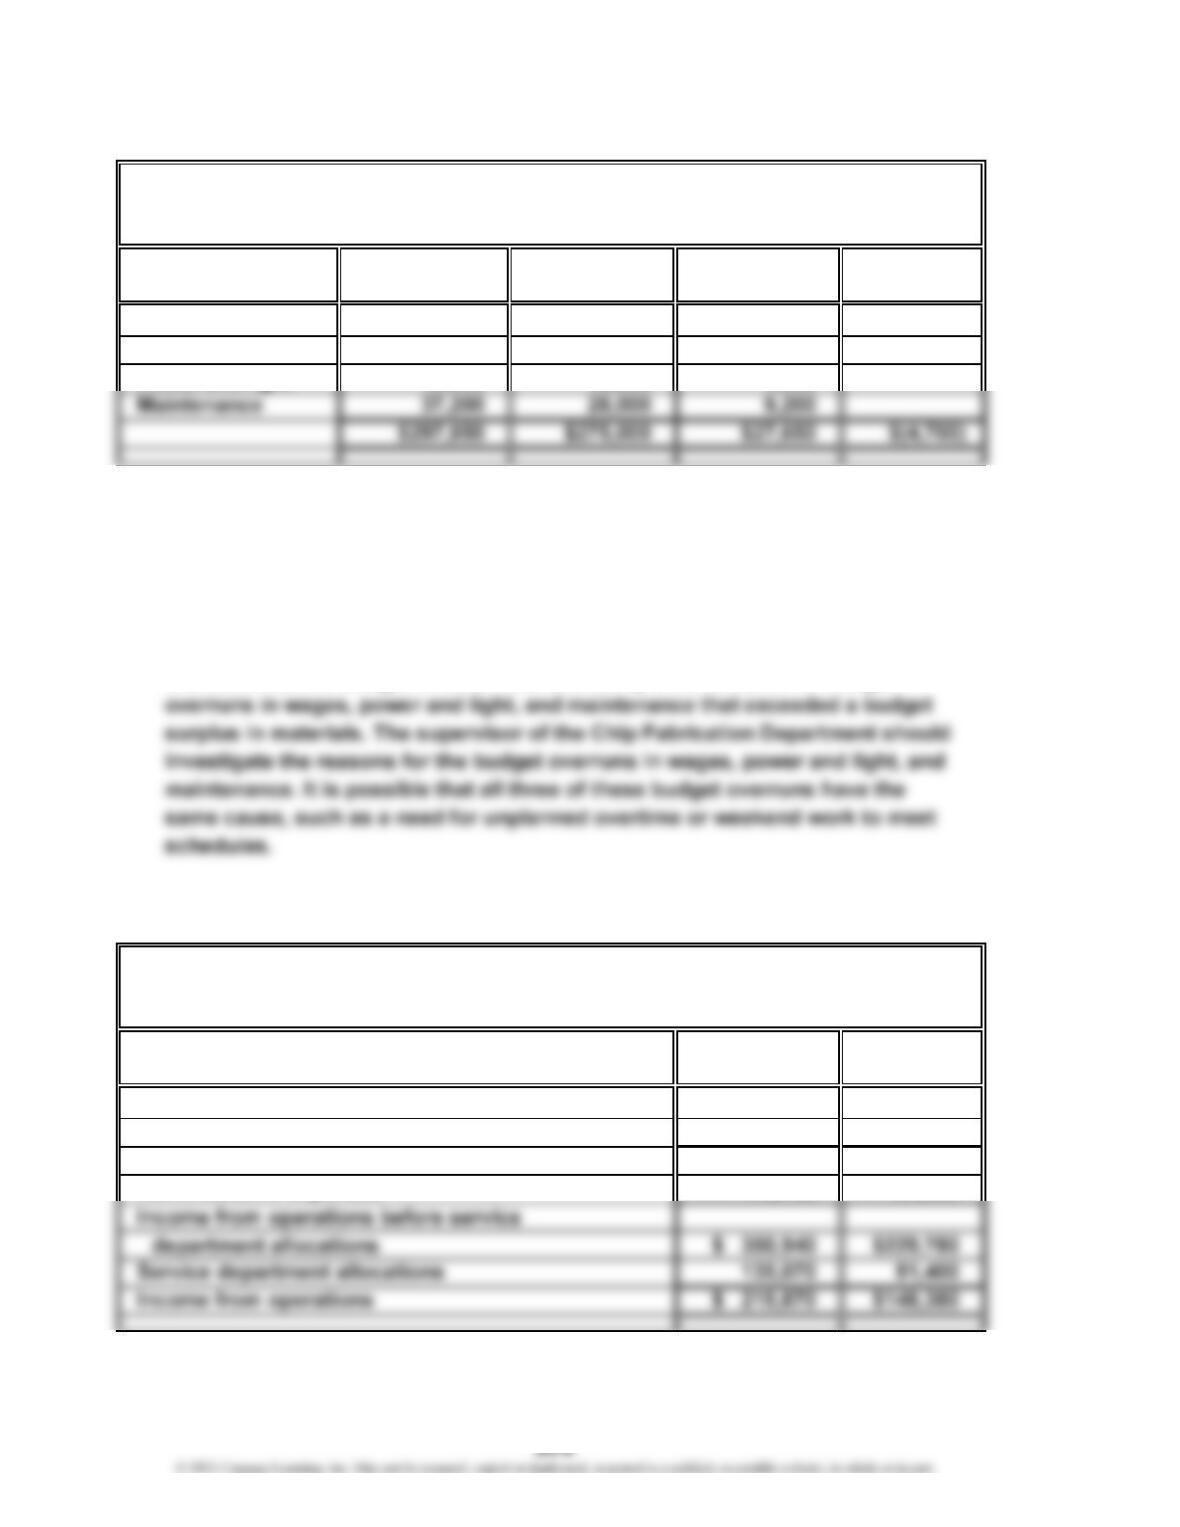
Materials $(4,700)
Power and light
b. MEMO
To: Cassandra Reid, Vice President of Production
The Western Region plant has experienced a budget overrun, while the Eastern
and Central Region plants have experienced a budget surplus. The budget of the
Western Region plant reveals that the Chip Fabrication Department causes the
majority of the budget overrun. The budget for the Chip Fabrication Department
indicates that the budget overrun was caused by a combination of budget
Ex. 24-2
Residential
Division
Sales $892,540
Cost of goods sold 508,410
Gross profit $384,130
Administrative expenses 154,350
$1,625,400
1,094,700
$ 530,700
179,760
Division
Commercial
Divisional Income Statements
For the Year Ended June 30, 20Y8
South Seas Coast Construction Company
120,000
$ 95,500 $13,500
49,950 45,000 4,950
115,300
Actual Budget
$ 82,000
Garland Company
Budget Performance Report—Supervisor, Chip Fabrication
For the Month Ended November 30
Over
Cost Budget
CHAPTER 24 Decentralized Operations
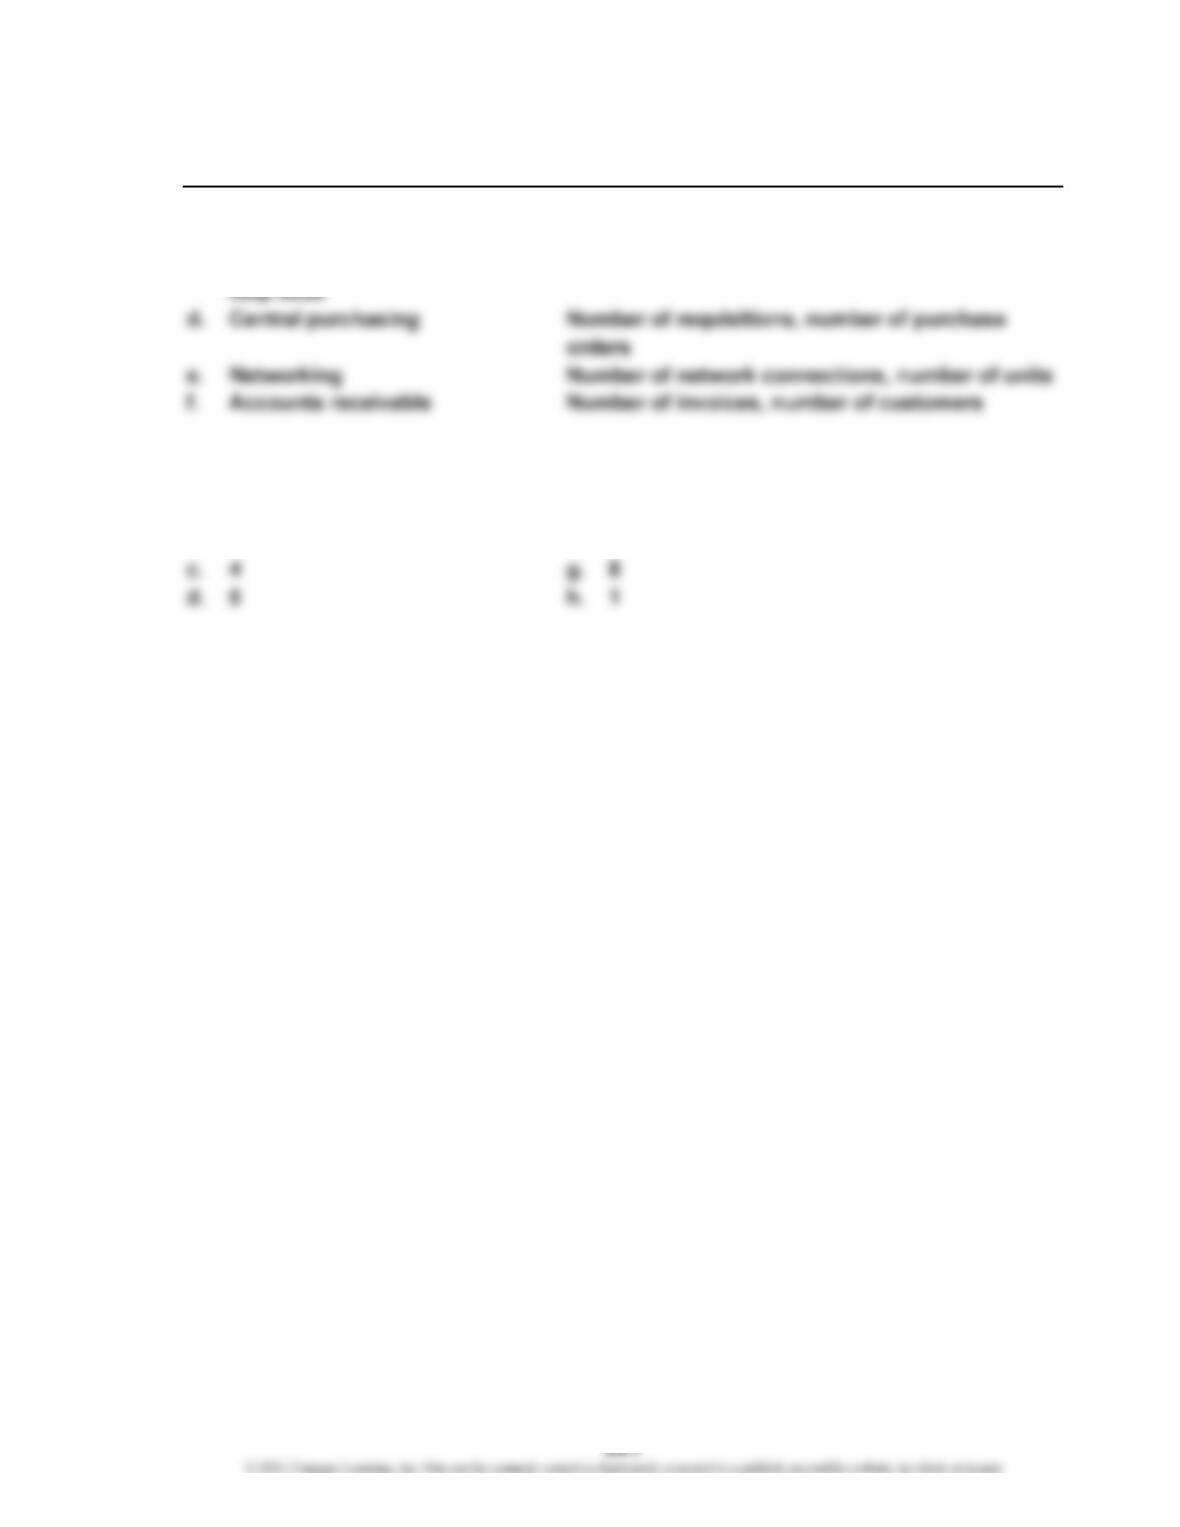
Ex. 24-3
Expense Cost Drivers
a. Legal Number of hours of legal service
b. Duplication services Number of pages copied
c. Information technology Number of help desk requests
Ex. 24-4
a. 3 e. 6
b. 7 f. 2
CHAPTER 24 Decentralized Operations
Ex. 24-5
Government
a. Residential Commercial Contract Total
Number of payroll checks:
Weekly payroll × 52……… 21,320 9,880 14,560
Monthly payroll × 12……
…
1,140 2,400 1,320
Total……………………
…
22,460 12,280 15,880 50,620
Service department allocation rates:
Payroll Department……………………
…
$126,550
÷
50,620 = $2.50/payroll
distribution
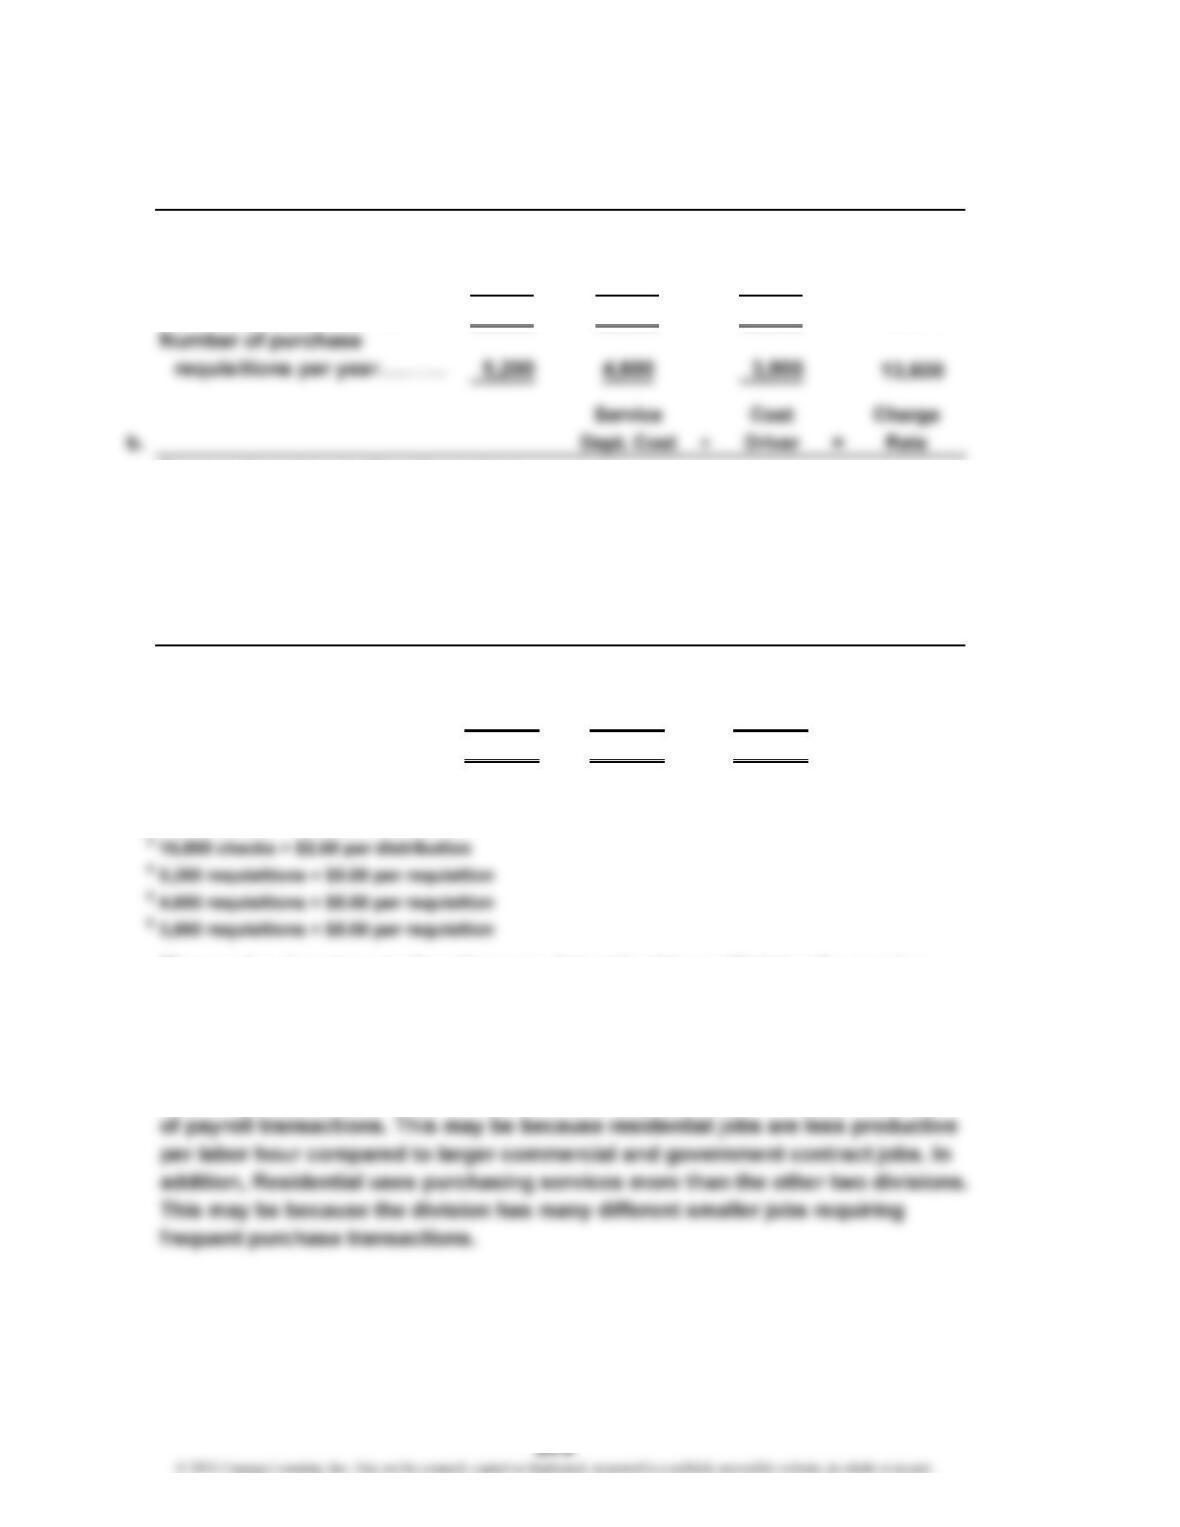
Purchasing Department………………
…
$68,000
÷
13,600 = $5.00/req.
Government
Residential Commercial Contract Total
Service department allocations:
Payroll Department………
…
$56,150 $30,700 $39,700 $126,550
Purchasing Department… 26,000 23,000 19,000 68,000
Total……………………
…
$82,150 $53,700 $58,700
1
22,460 checks × $2.50 per distribution
2
12,280 checks × $2.50 per distribution
The service department allocations are determined by multiplying the service
department allocation rate by the cost driver for each division.
c. Residential’s service department allocation is higher than the other two divisions
because Residential is a heavy user of service department services. Residential
has many employees on a weekly payroll, which translates into a larger number
3
5
21
46
CHAPTER 24 Decentralized Operations
Ex. 24-6
$160,000
3,200 calls
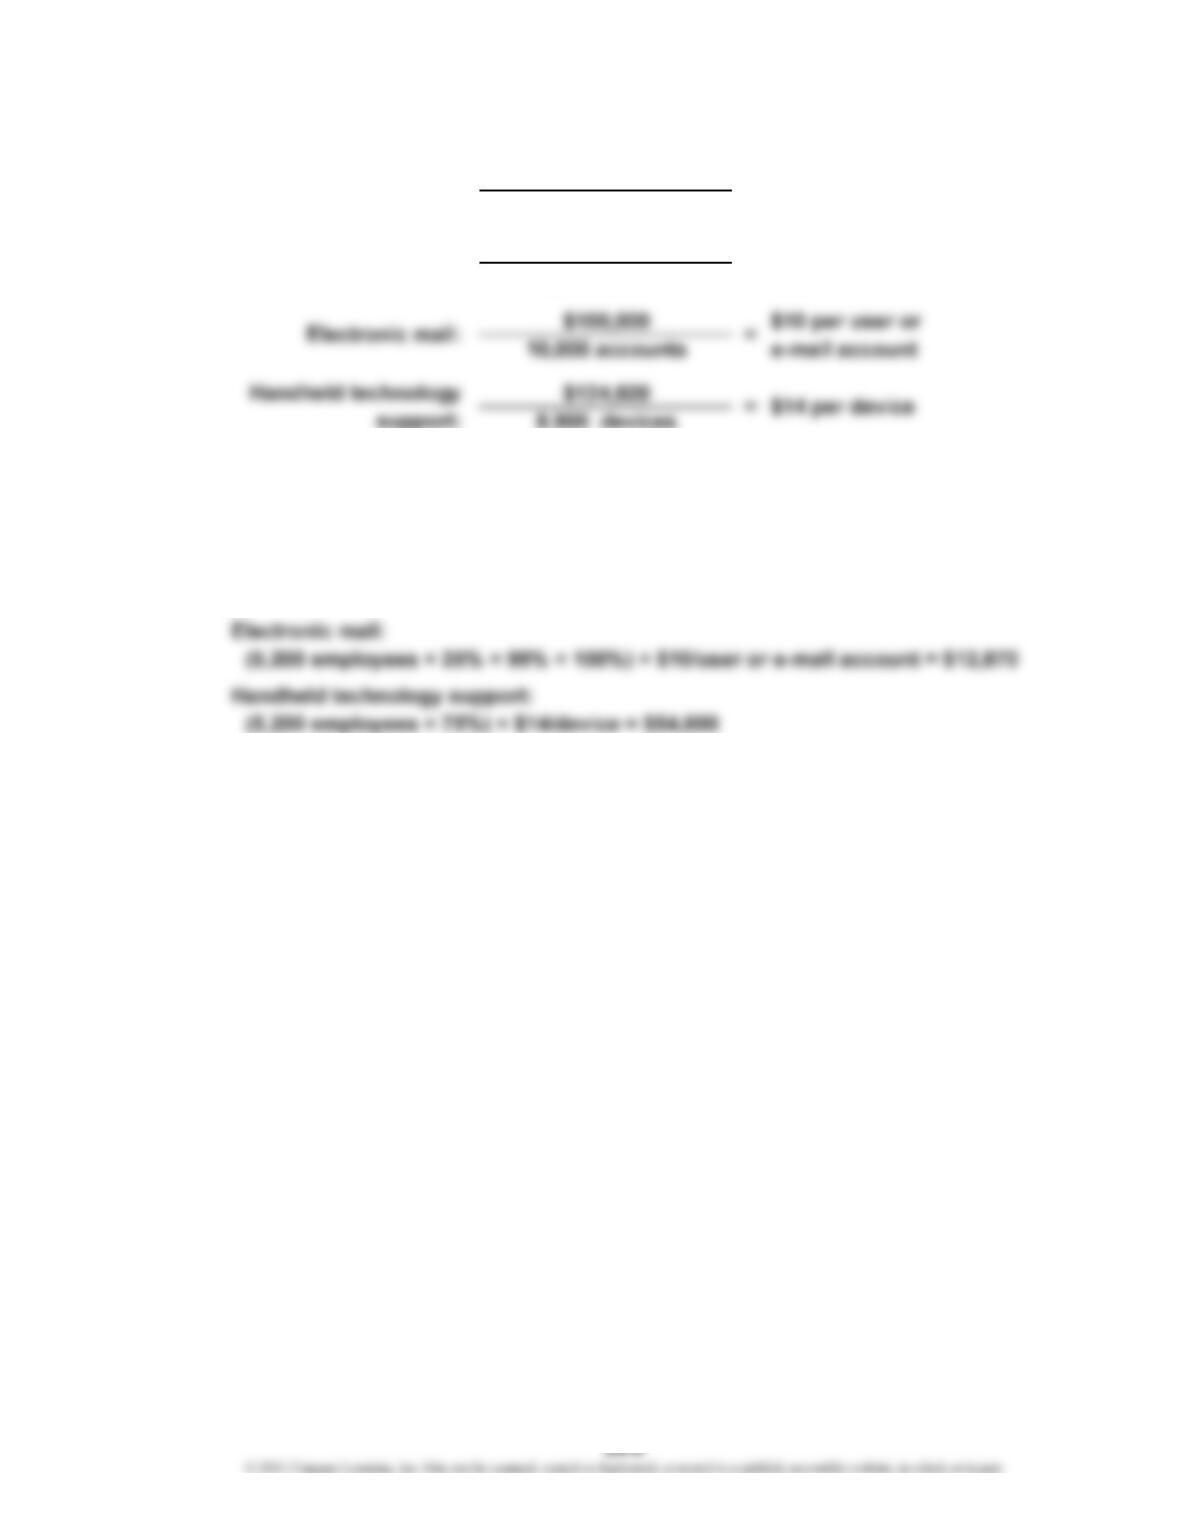
$735,000 $75 per device
9,800 devices monitored
8,900 devices
b. October allocations to the COMM sector:
Help desk allocation:
(5,200 employees × 25% × 99% × 1.2) × $50/call = $77,220
Network center allocation:
[(5,200 employees × 25% × 99%) + 600 additional printers] × $75/device = $141,525
a. Help desk:
Network center:
= $50 per call
=
CHAPTER 24 Decentralized Operations
Ex. 24-7
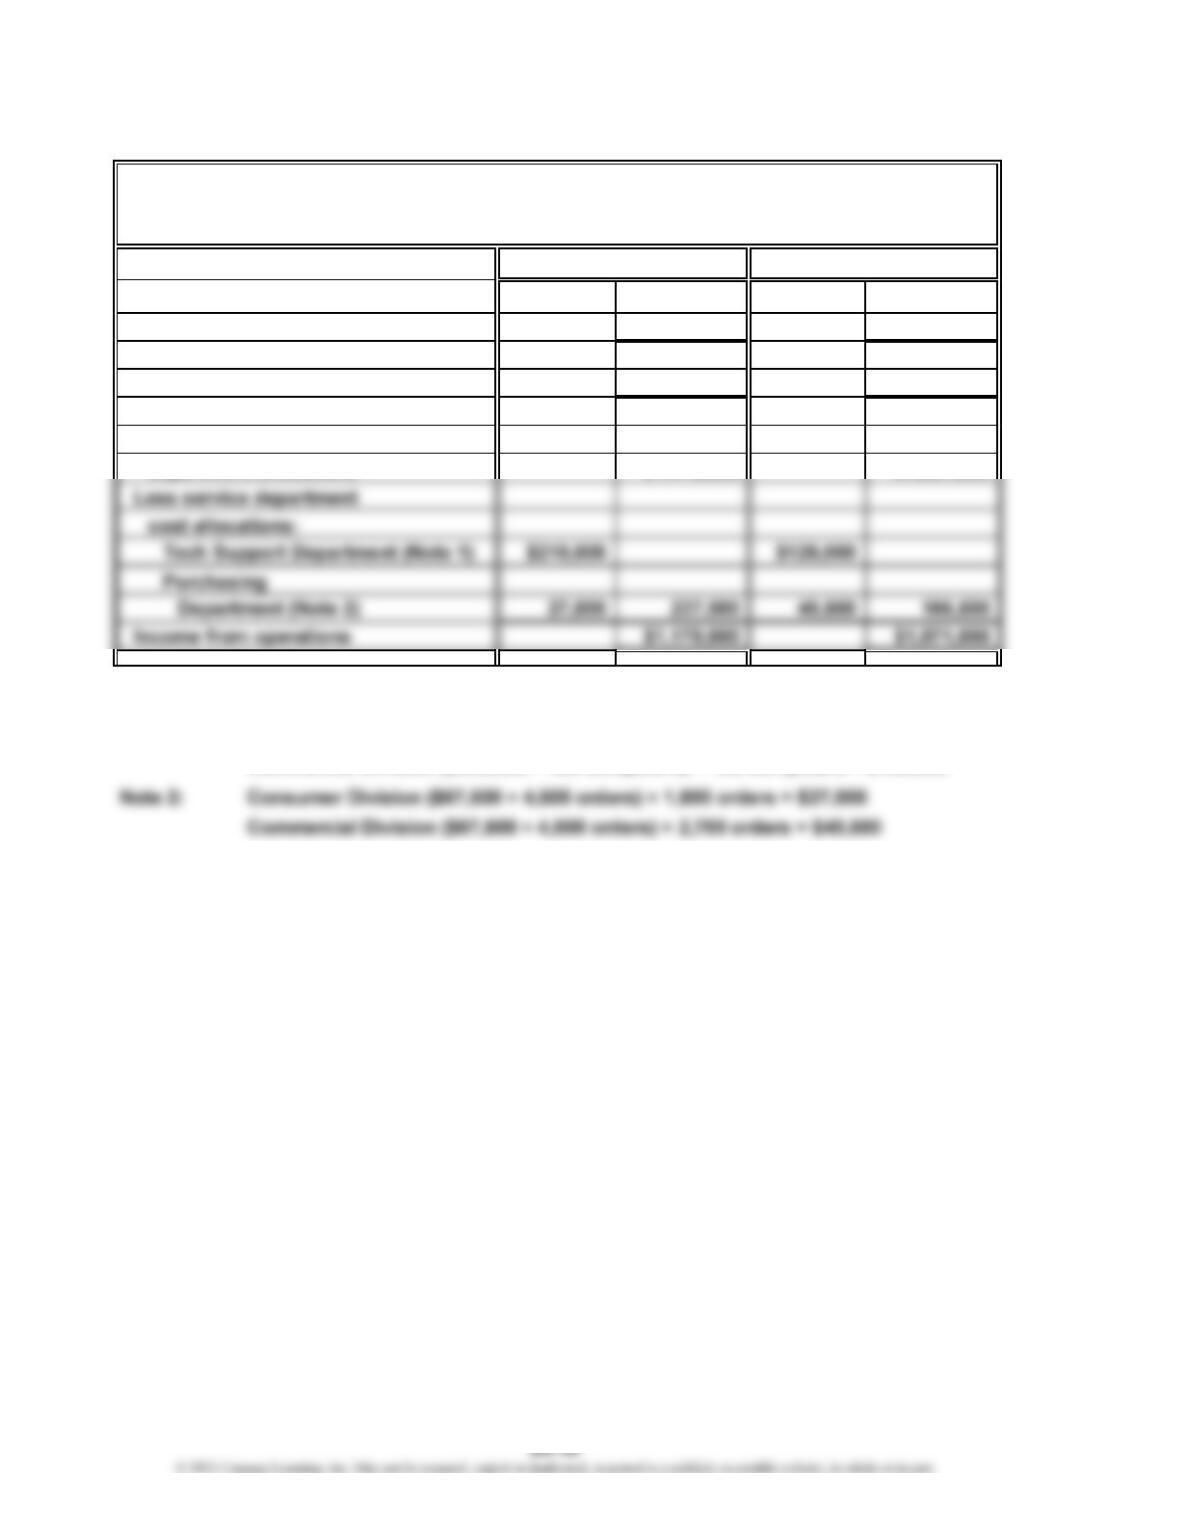
Revenues $5,900,000 $4,950,000
Cost of goods sold 3,304,000 2,475,000
Gross profit $2,596,000 $2,475,000
Operating expenses 1,180,000 1,237,500
Income from operations
before service
Supporting computations for controllable service department allocations:
Note 1: Consumer Division ($336,000 ÷ 480 computers) × 300 computers = $210,000
Grael Technology
Divisional Income Statements
For the Year Ended December 31, 20Y7
Consumer Division Commercial Division
CHAPTER 24 Decentralized Operations
Ex. 24-8
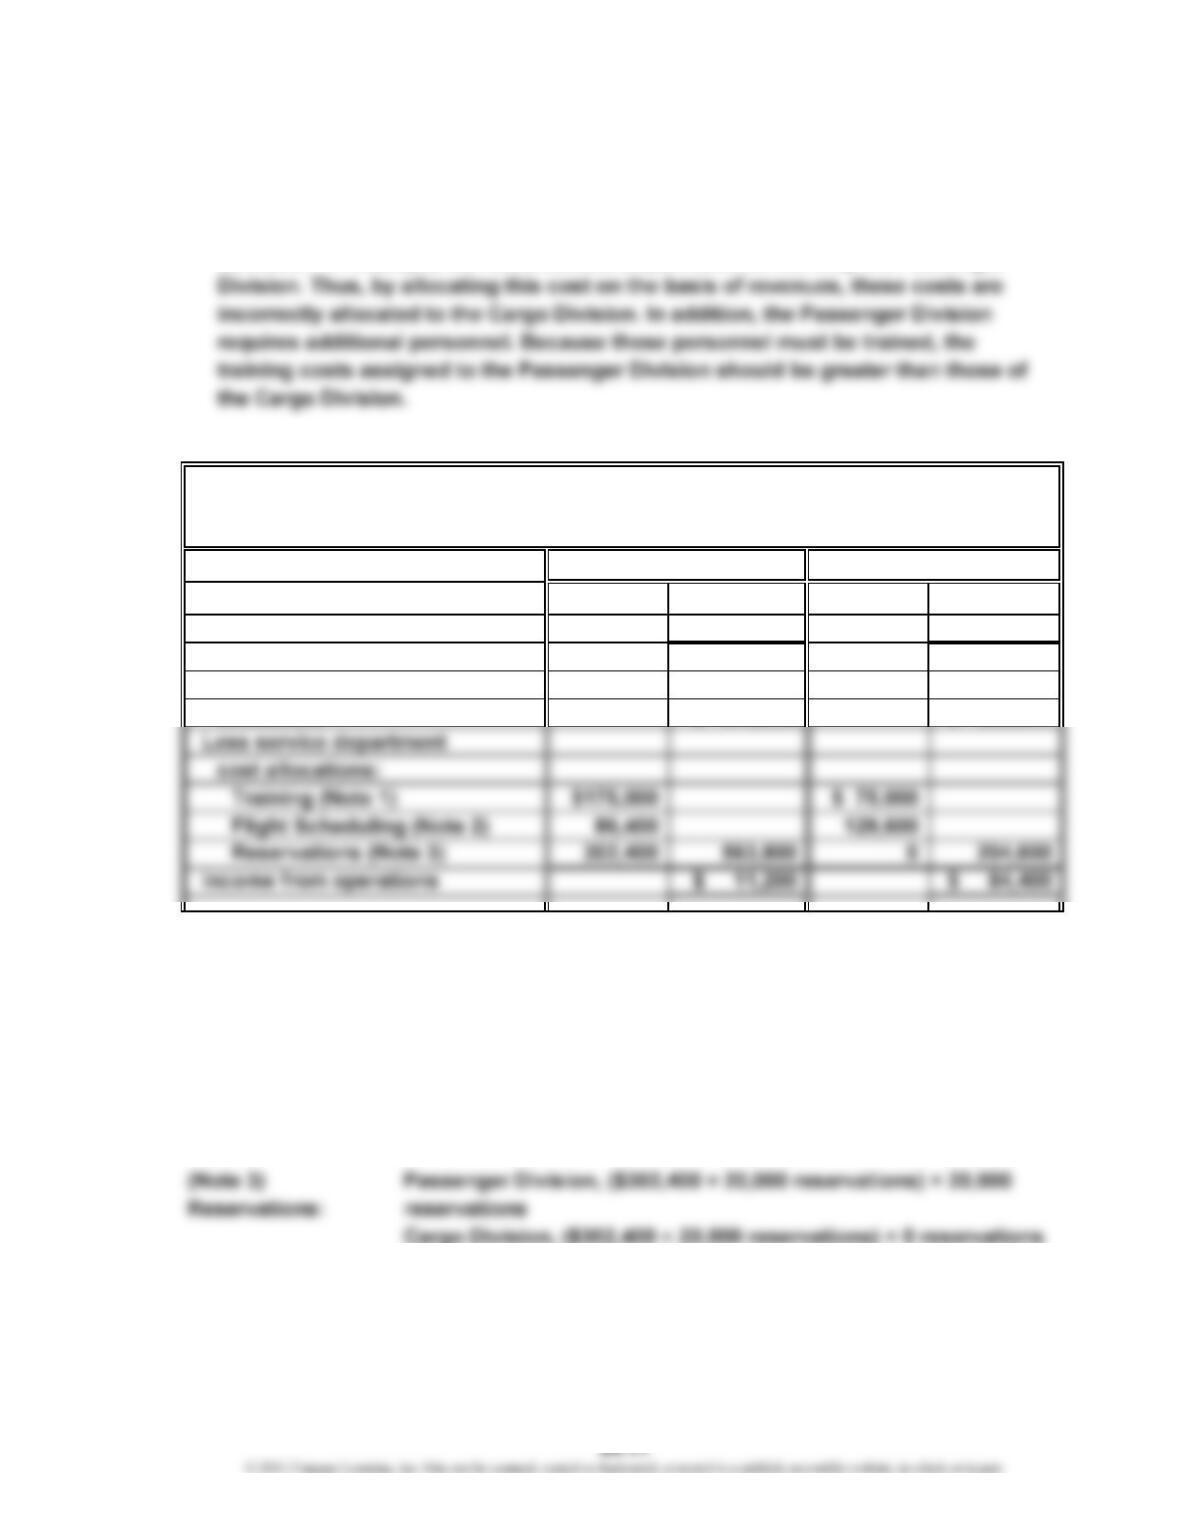
a. The reported income from operations does not accurately measure performance
because the service department allocations are based on revenues. Revenues are
not associated with the profit center manager’s use of the service department
services. For example, the Reservations Department serves only the Passenger
b.
Revenues $3,025,000 $3,025,000
Operating expenses 2,450,000 2,736,000
Income from operations
before service department
allocations $ 575,000 $ 289,000
Supporting computations for controllable service department allocations:
(Note 1) Training: Passenger Division, ($250,000 ÷ 500 personnel trained) × 350
personnel trained
Cargo Division, ($250,000 ÷ 500 personnel trained) × 150
personnel trained
Passenger Division, ($216,000 ÷ 2,000 flights) × 800 flights
Cargo Division, ($216,000 ÷ 2,000 flights) × 1,200 flights
(Note 2) Flight
Scheduling:
Wild Sun Airlines Inc.
Divisional Income Statements
For the Year Ended December 31, 20Y9
Passenger Division Cargo Division
CHAPTER 24 Decentralized Operations
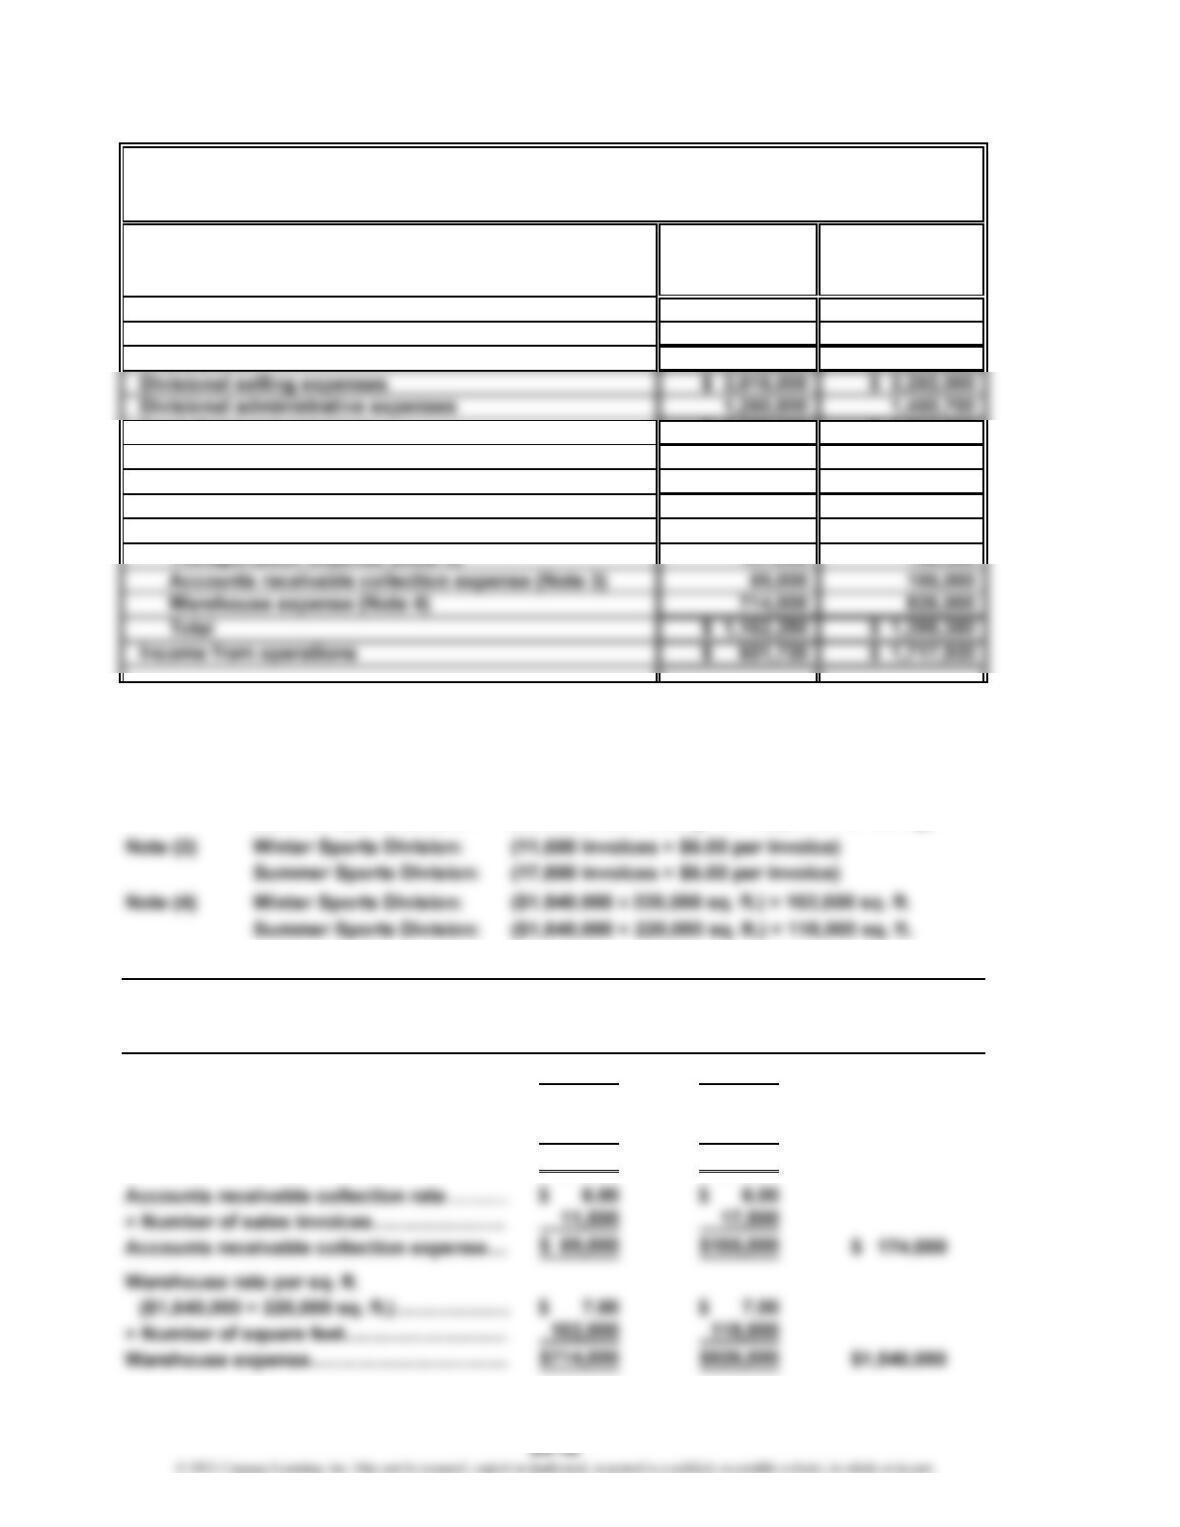
Ex. 24-9
Winter Summer
Sports Sports
Division Division
Sales $12,600,000 $16,300,000
Cost of goods sold 7,560,000 9,454,000
Gross profit $ 5,040,000 $ 6,846,000
Total divisional expenses $ 3,276,000 $ 3,732,700
Income from operations before service
department allocations $ 1,764,000 $ 3,113,300
Less service department cost allocations:
Advertising expense (Note 1) $ 252,000 $ 326,000
Supporting computations:
Note (1) Winter Sports Division: $252,000
Summer Sports Division: $326,000
Note (2) Winter Sports Division: (17,200 bills of lading × $7.40 per bill of lading)
Summer Sports Division: (18,700 bills of lading × $7.40 per bill of lading)
Winter Summer
Sports Sports
Division Division Total
Advertising expense…………………………
…
$252,000 $326,000 $ 578,000
Transportation rate per bill of lading……
…
$ 7.40 $ 7.40
× Number of bills of lading…………………
…
17,200 18,700
Transportation expense……………………
…
$127,280 $138,380 $ 265,660
…
Service Department Allocations
Glades Sporting Goods Co.
Divisional Income Statements
For the Year Ended December 31, 20Y8
CHAPTER 24 Decentralized Operations
Ex. 24-10
a. Retail Division: 17% ($9,350,000 ÷ $55,000,000)
Commercial Division: 28% ($10,640,000 ÷ $38,000,000)
Internet Division: 14% ($2,240,000 ÷ $16,000,000)
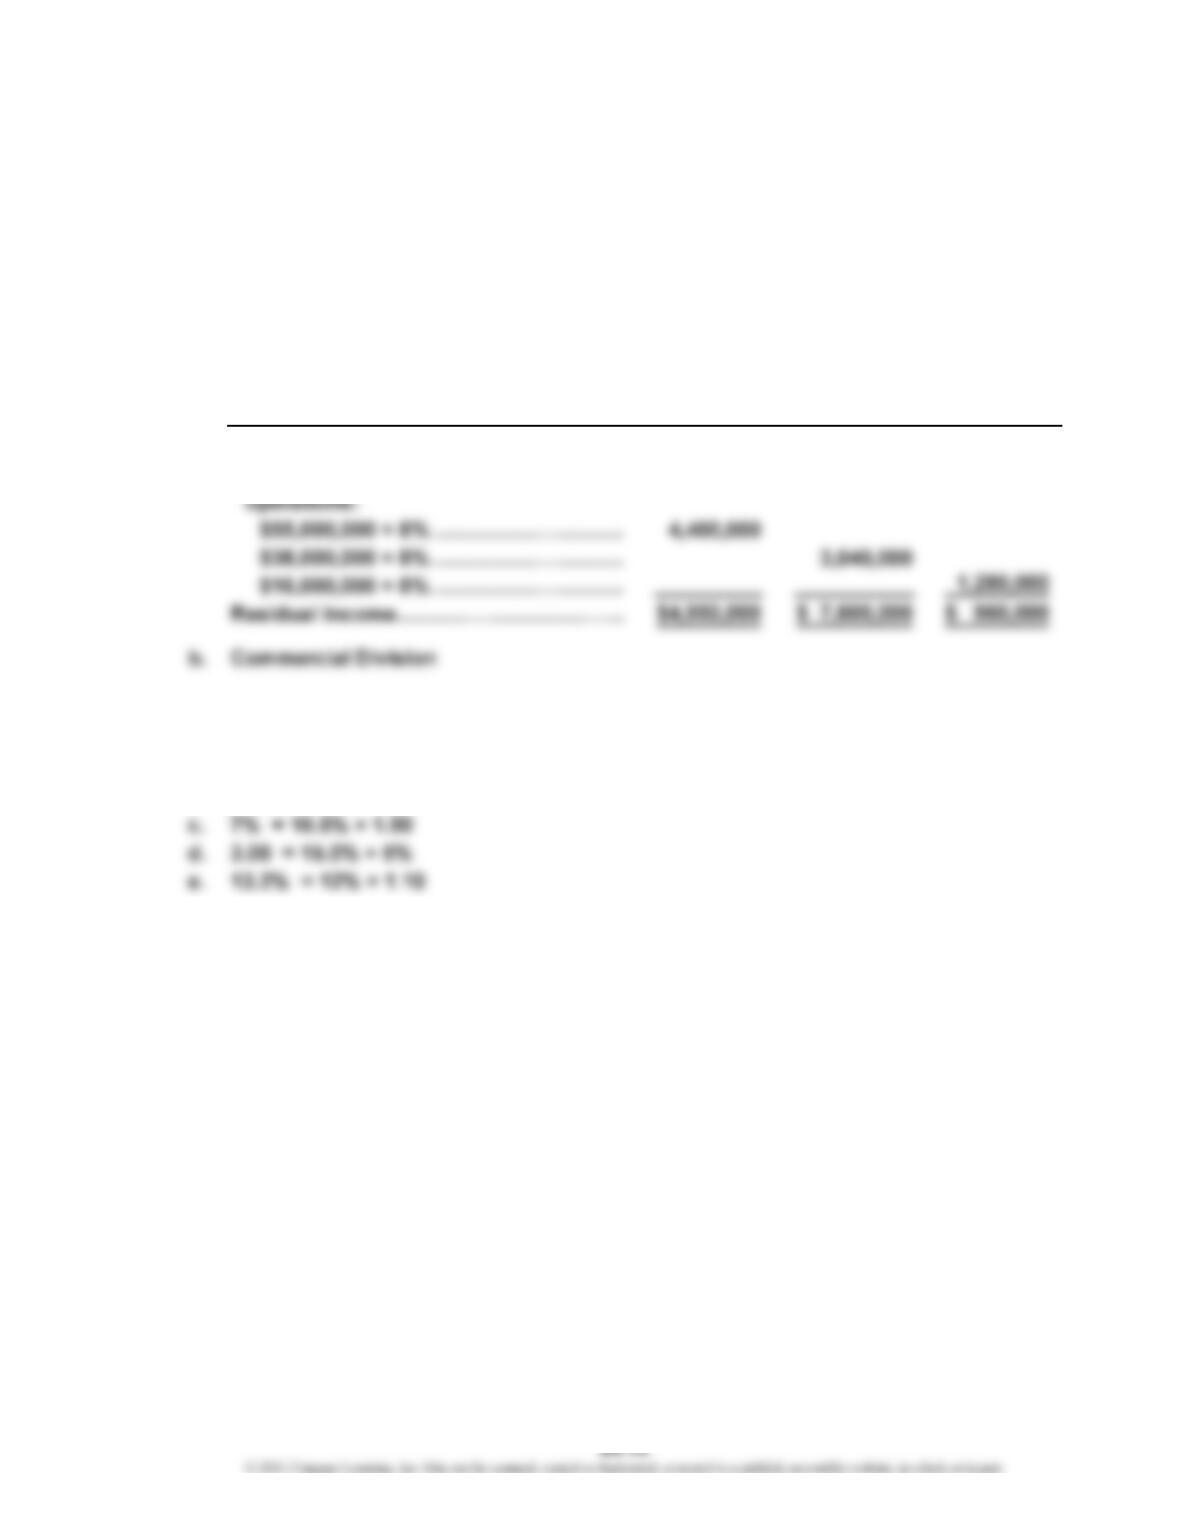
b. Commercial Division
Ex. 24-11
a. Retail Commercial Internet
Division Division Division
Income from operations…………………
…
$9,350,000 $10,640,000 $2,240,000
Minimum amount of income from
Ex. 24-12
a. 2.20 = 13.2% ÷ 6%
b. 18% = 10% × 1.80
CHAPTER 24 Decentralized Operations
Ex. 24-13
Return on
Investment
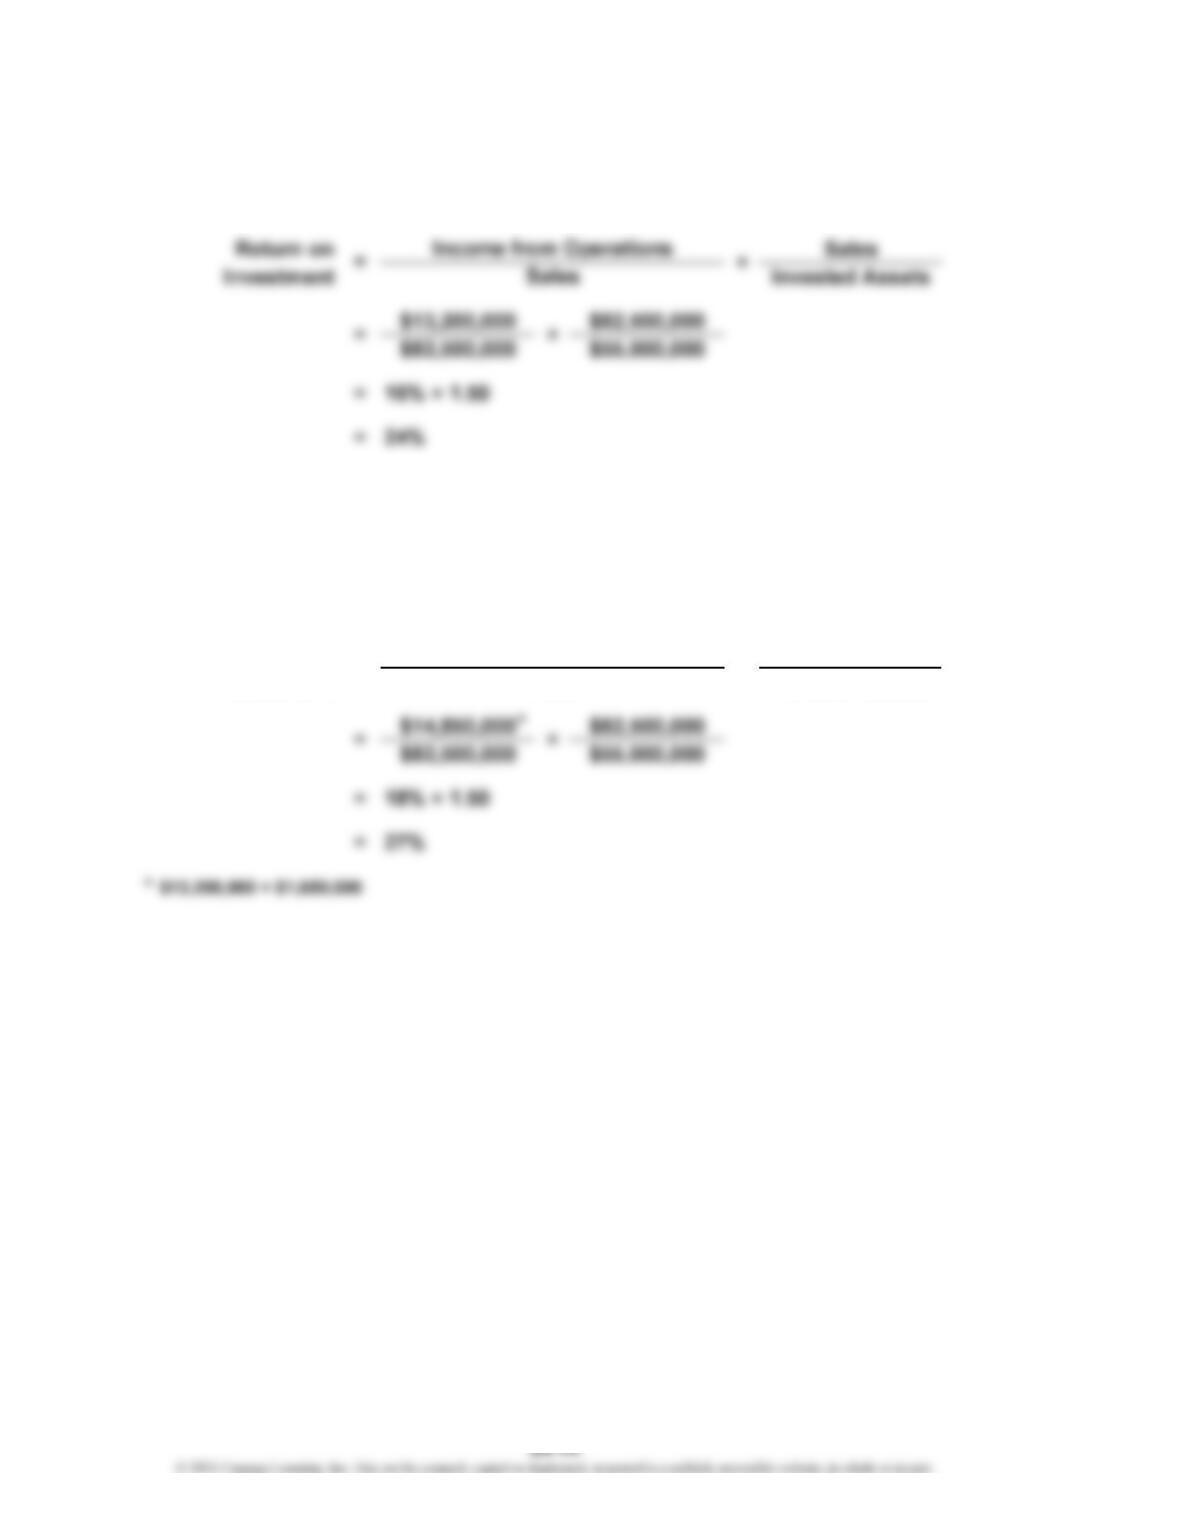
b. The profit margin would increase from 16% to 18%, the investment turnover
would remain unchanged, and the return on investment would increase from
24% to 27%, as shown below.
Return on
Investment
Return on Sales
Investment Invested Assets
a. = Profit Margin × Investment Turnover
= Profit Margin × Investment Turnover
=Income from Operations ×
Sales
CHAPTER 24 Decentralized Operations
Ex. 24-14
Return on Revenues
Investment Invested Assets
$6,625 $24,500
$24,500 $35,899
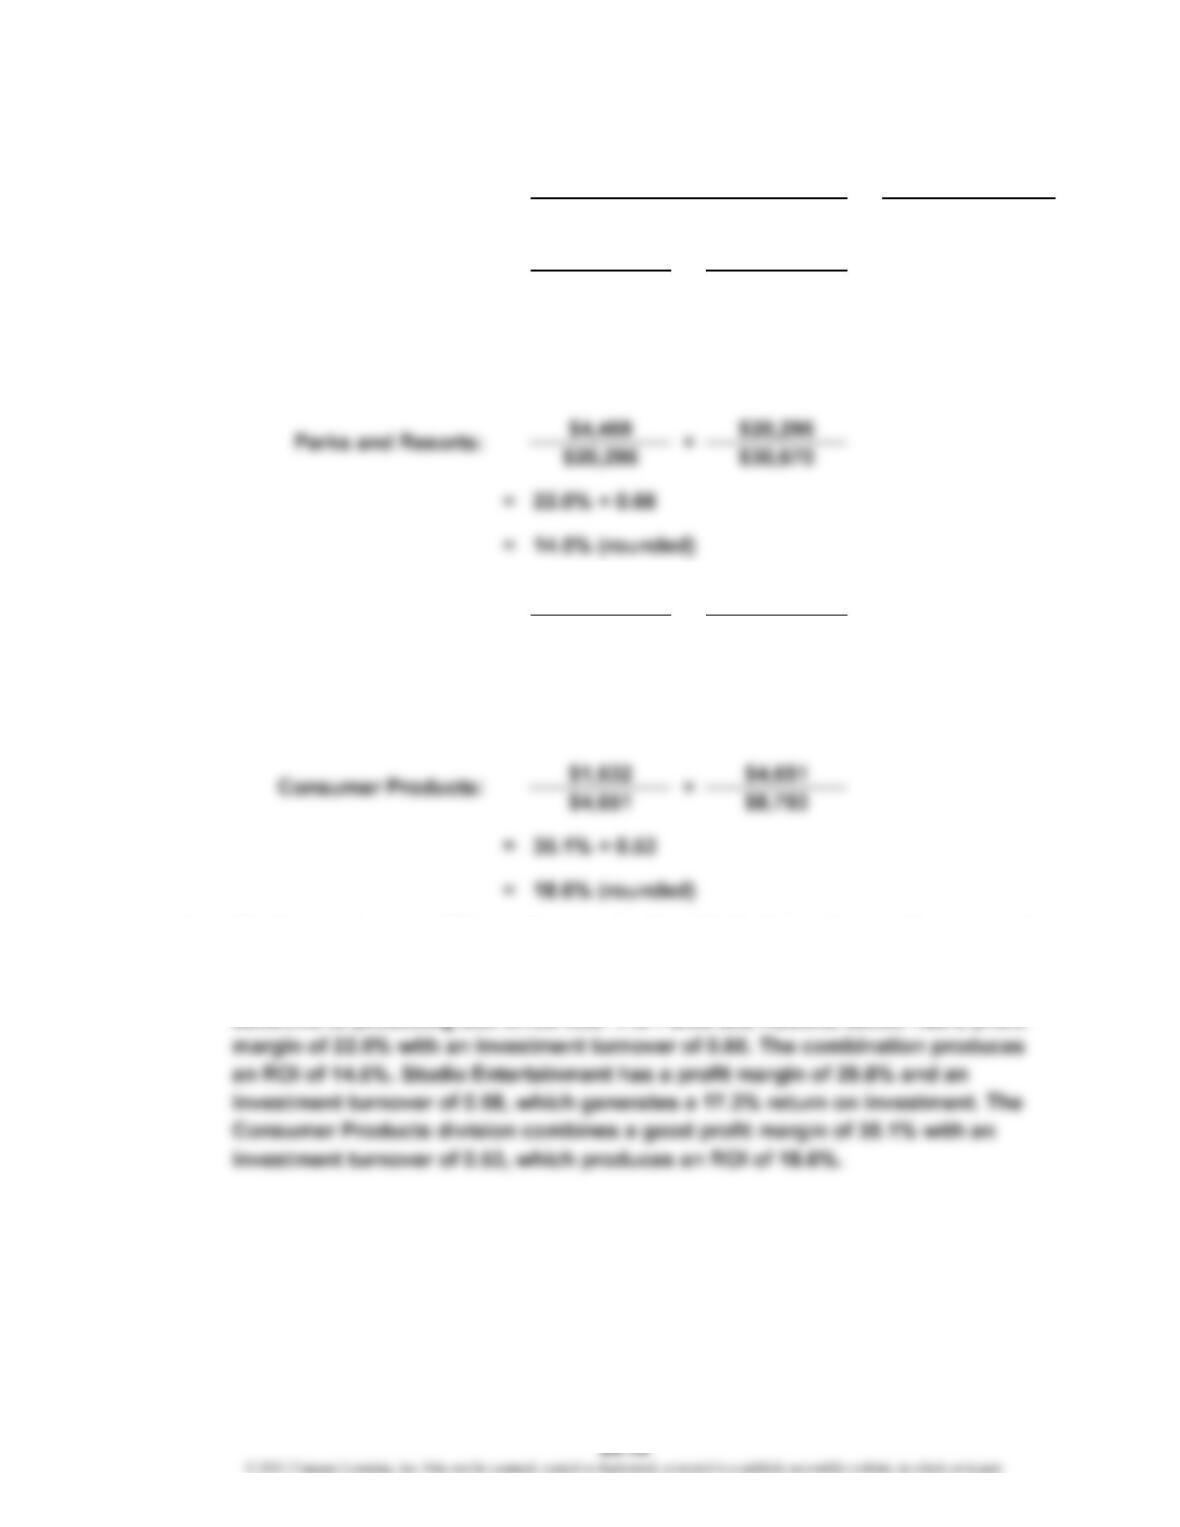
= 27.0% × 0.68
= 18.4% (rounded)
$2,980 $9,987
$9,987 $17,154
= 29.8% × 0.58
= 17.3% (rounded)
b. The four sectors are different from each other. Media Networks combines a good
profit margin of 27.0% with an investment turnover of 0.68. Media Networks is
sensitive to advertising revenue, while the Studio Entertainment sector is
Studio Entertainment: ×
a. ×
Media Networks: ×
Revenues
Income from Operations
=
CHAPTER 24 Decentralized Operations
Ex. 24-15
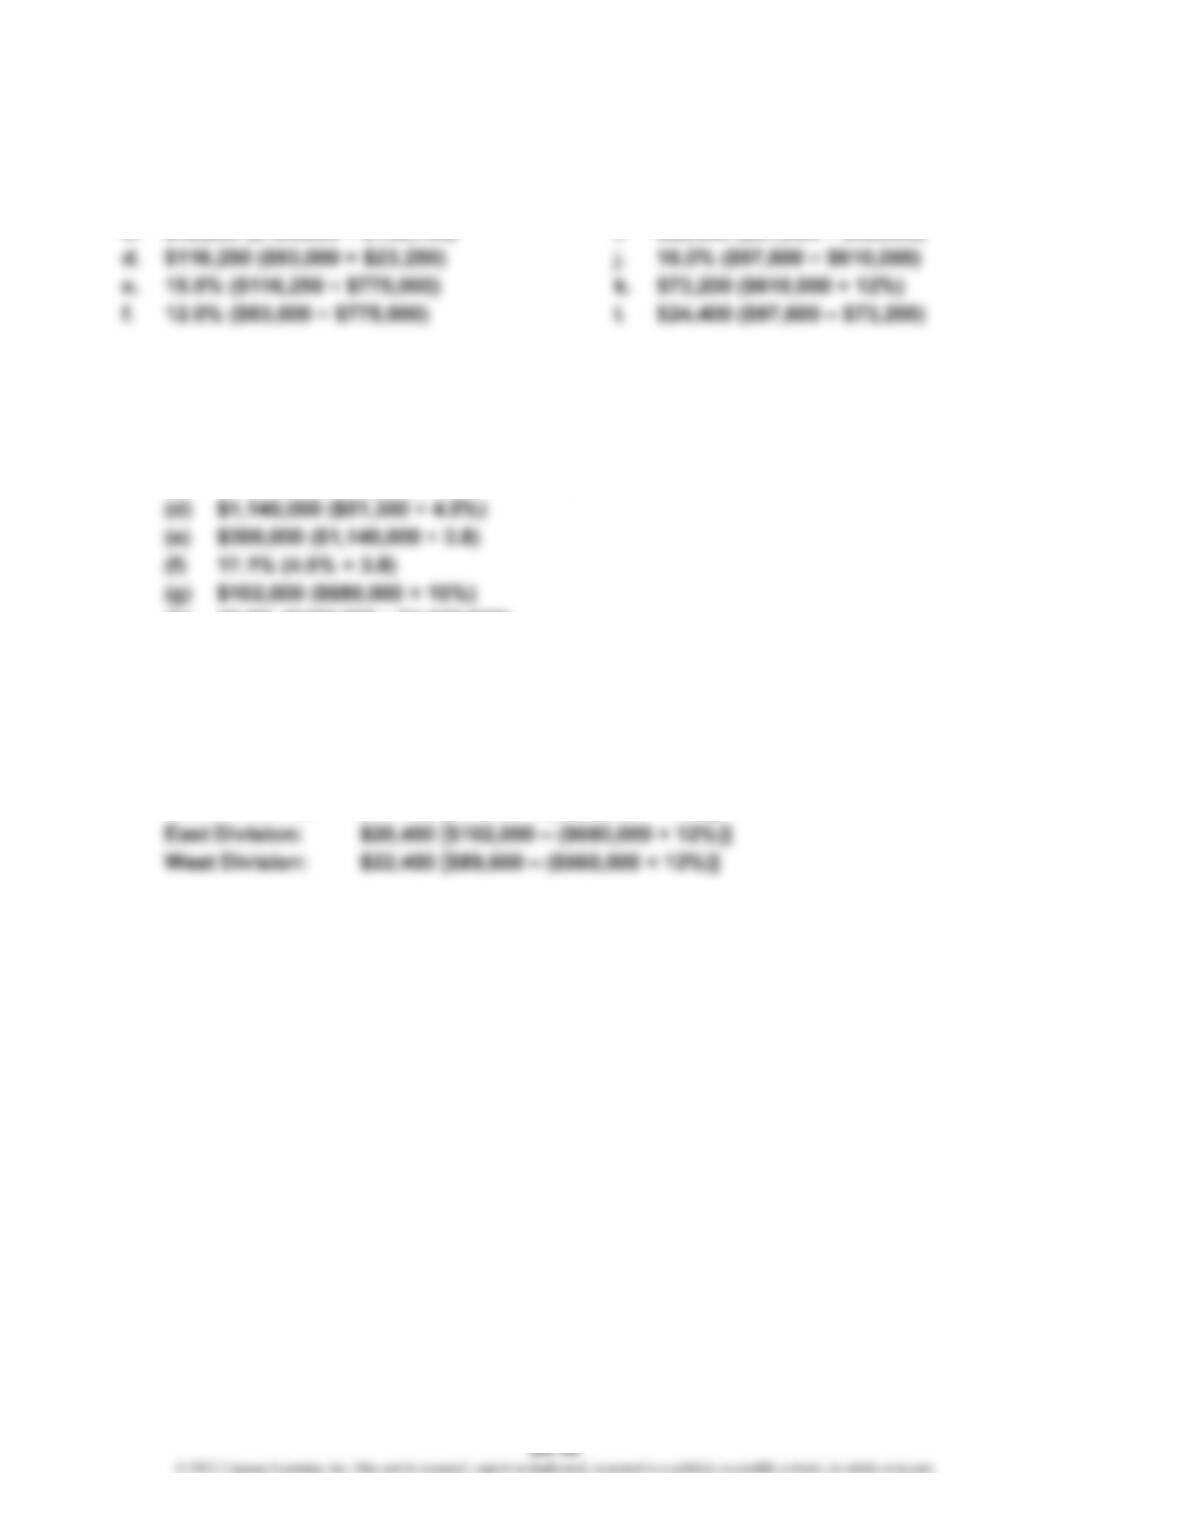
a. 20.0% ($185,000 ÷ $925,000) g. $81,000 ($450,000 × 18%)
b. $138,750 ($925,000 × 15%) h. 13.0% ($58,500 ÷ $450,000)
Ex. 24-16
a. (a) $60,200 ($860,000 × 7%)
(b) $344,000 ($60,200 ÷ 17.5%)
(c) 2.5 (17.5% ÷ 7%) or $860,000 ÷ $344,000
(h) 10.0% ($102,000 ÷ $1,020,000)
(i) 1.5 ($1,020,000 ÷ $680,000)
(j) 16.0% ($89,600 ÷ $560,000)
(k) 8.0% ($89,600 ÷ $1,120,000)
(l) 2.0 ($1,120,000 ÷ $560,000)
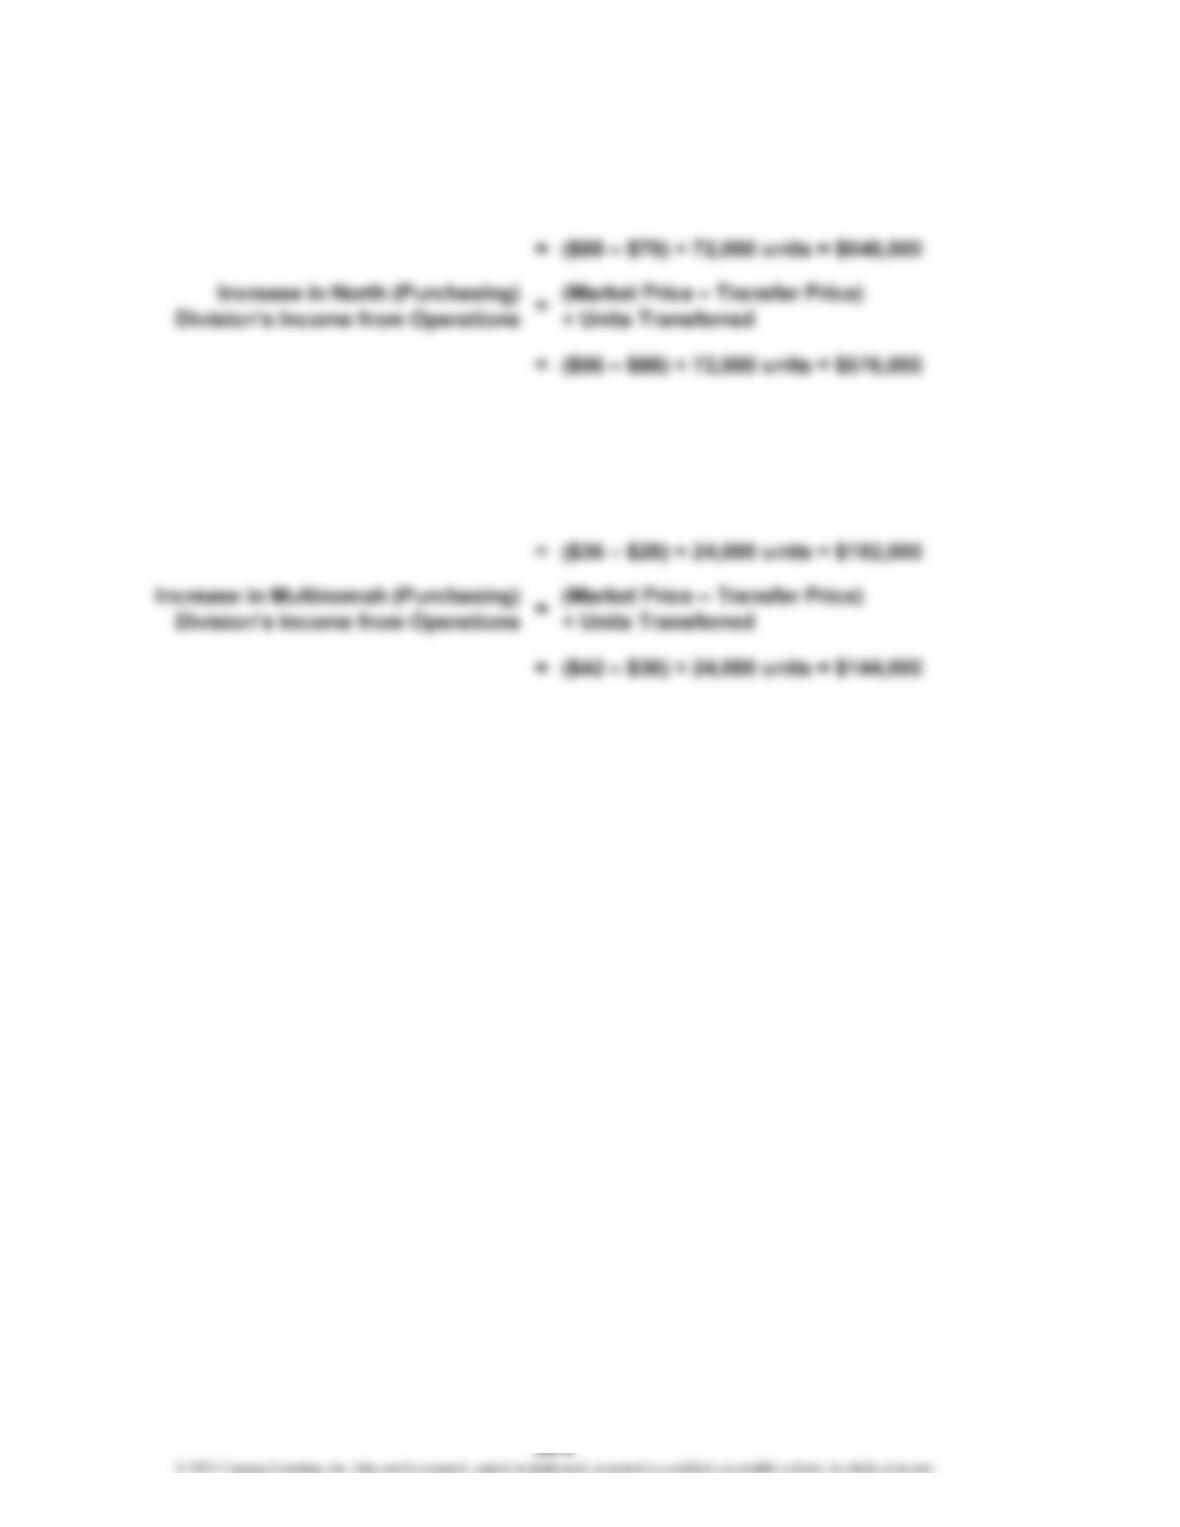
b. North Division: $18,920 [$60,200 – ($344,000 × 12%)]
South Division: $15,300 [$51,300 – ($300,000 × 12%)]
c. (1) The North Division has the highest return on investment (17.5%).
(2) The West Division has the largest residual income.
CHAPTER 24 Decentralized Operations
Ex. 24-17
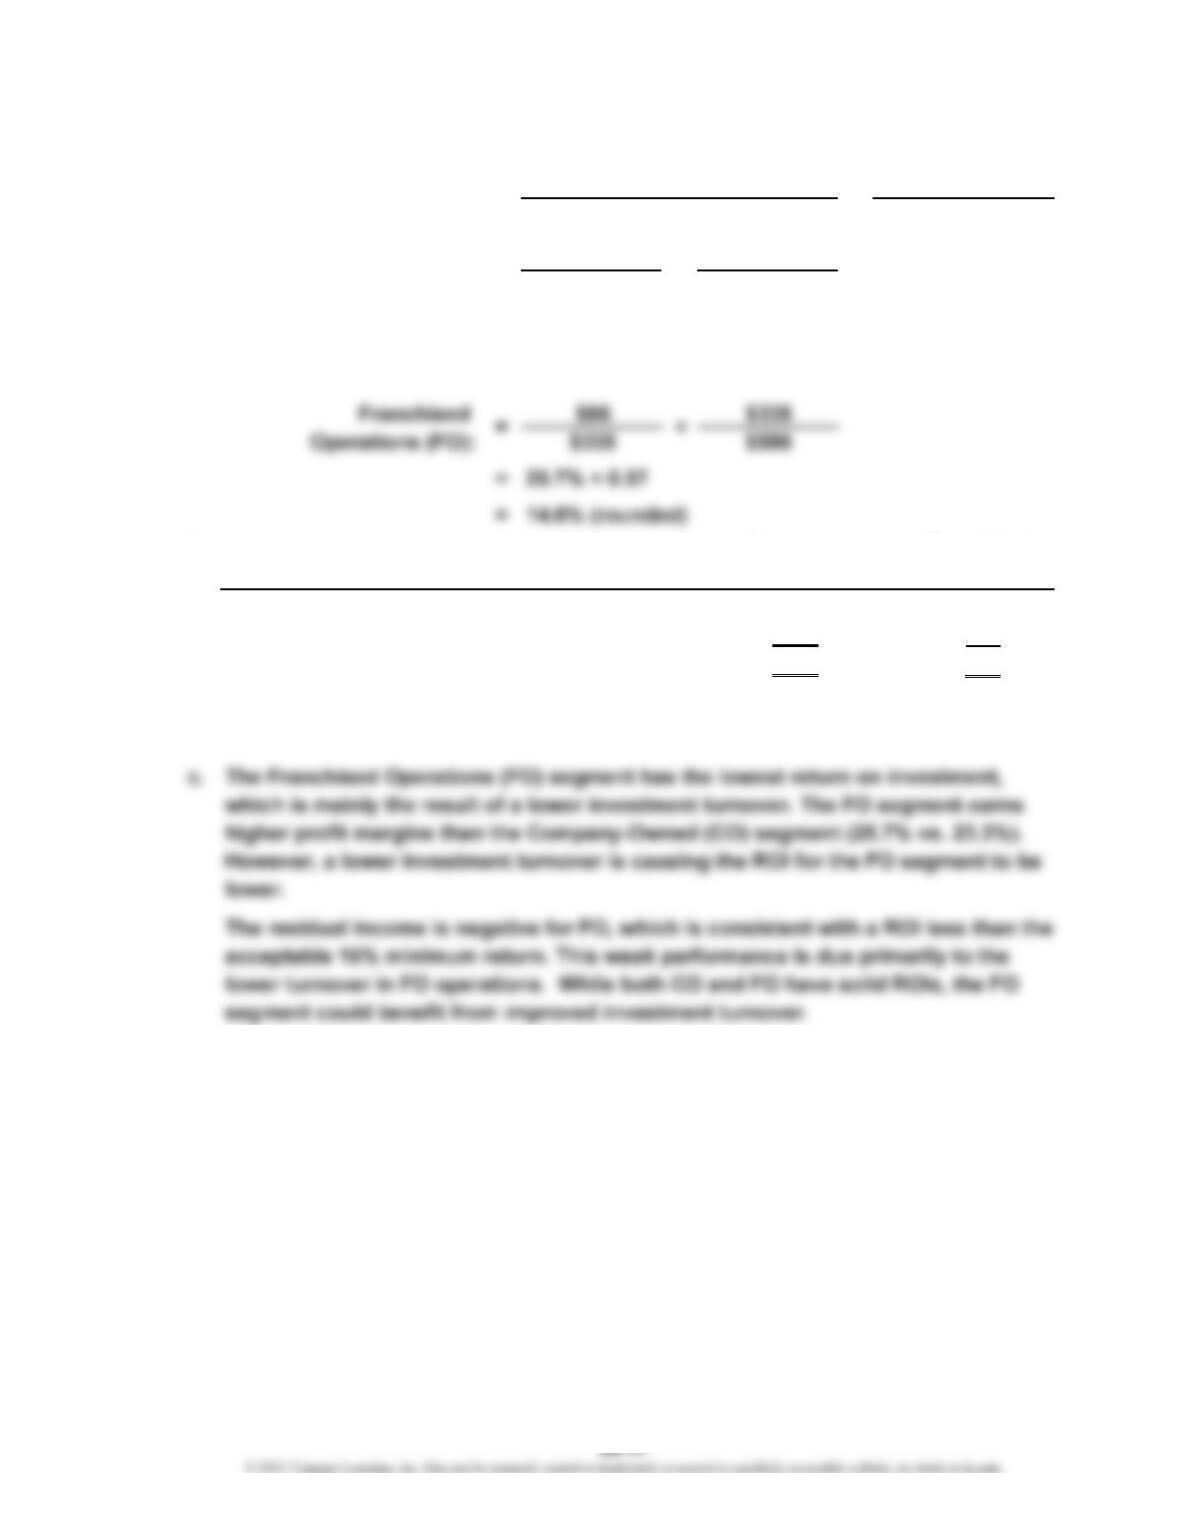
Revenues
Invested Assets
$617 $2,651
$2,651 $3,930
= 23.3% × 0.67
= 15.6% (rounded)
b.
Franchised
Operations
Income from operations……………………………
…
$86
Less minimum return (15% of assets)…………… 88
Residual income (loss)……………………………
…
$(2)
*
$3,930 × 15%
**
$586 × 15%
$617
Owned
Company-
Income from Operations
590
$27
a.
× =
Return on
Investment Revenues
Company-Owned (CO): = ×
***
CHAPTER 24 Decentralized Operations
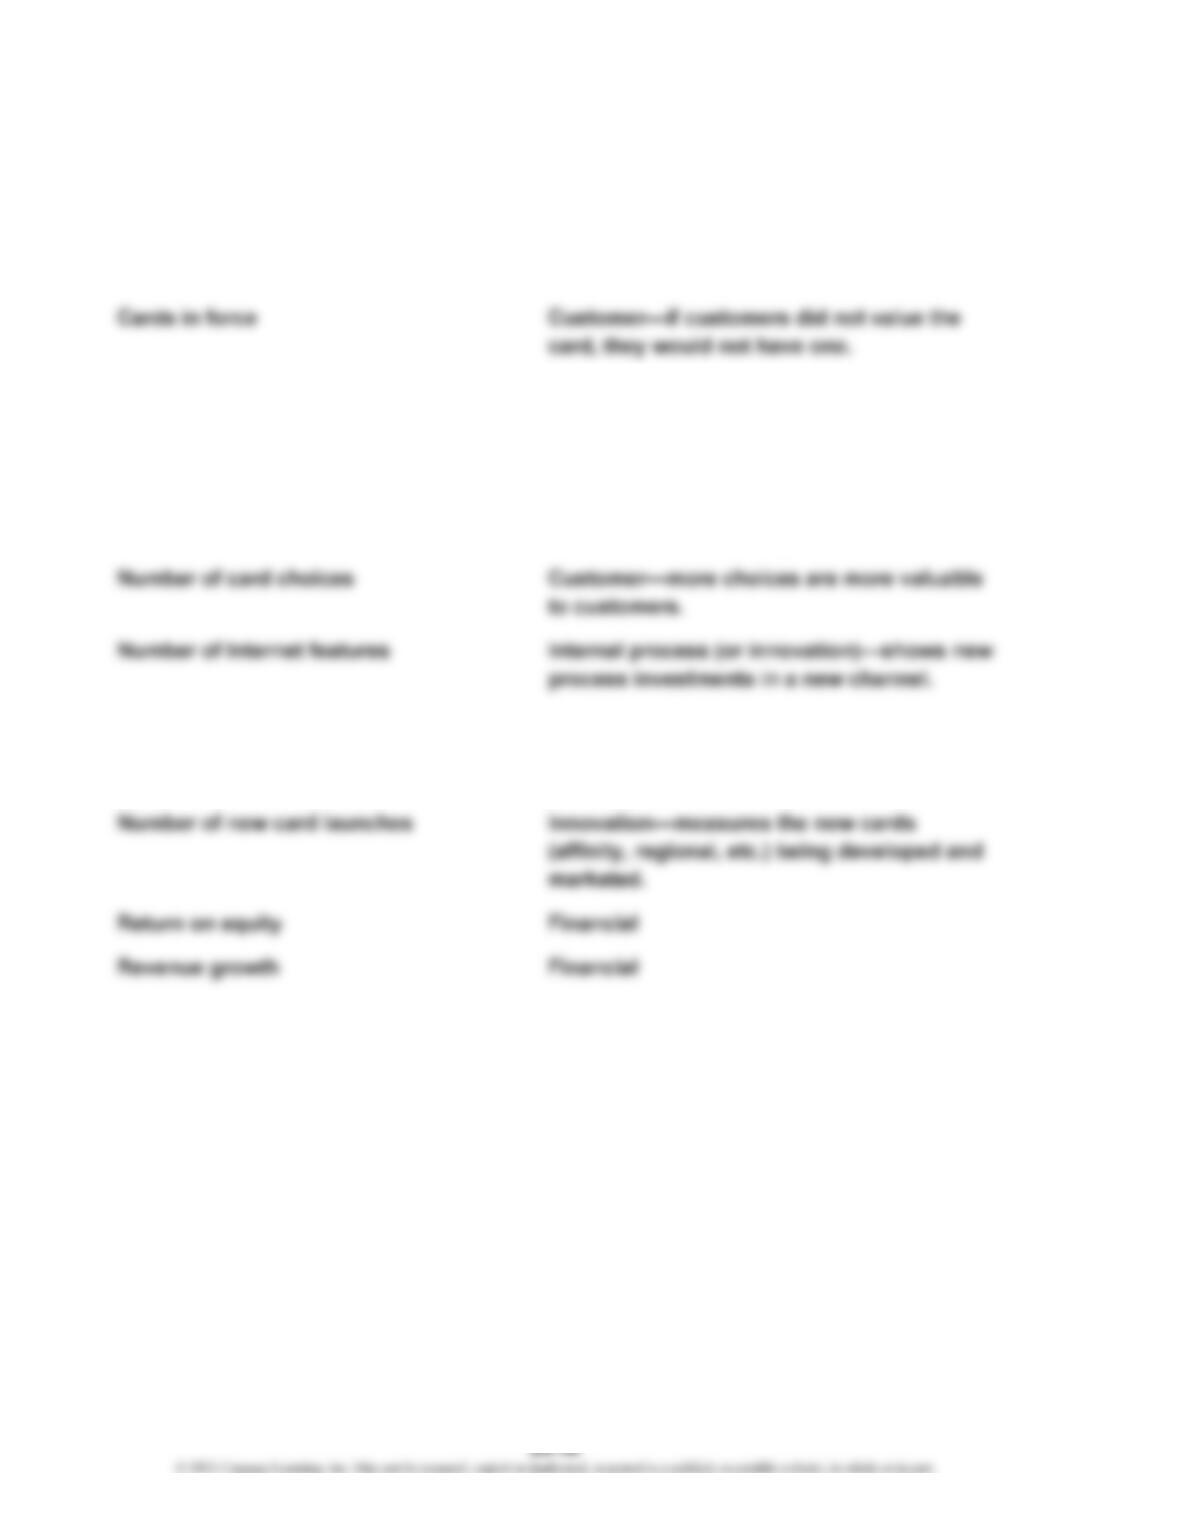
Ex. 24-18
Although there is some judgment in classifying each of these measures, the following
represents the author’s assessment with explanations:
Average card member spending Customer—demonstrates the usefulness of
the card to the customer.
Earnings growth Financial
Hours of credit consultant training Internal process—advisers will do their job
better if they are trained.
Investment in information technology Internal process (or innovation)—shows the
investment in improving processes.
Number of merchant signings Customer—the larger the number of
merchants that honor the card, the more
valuable it is to cardholders.
CHAPTER 24 Decentralized Operations
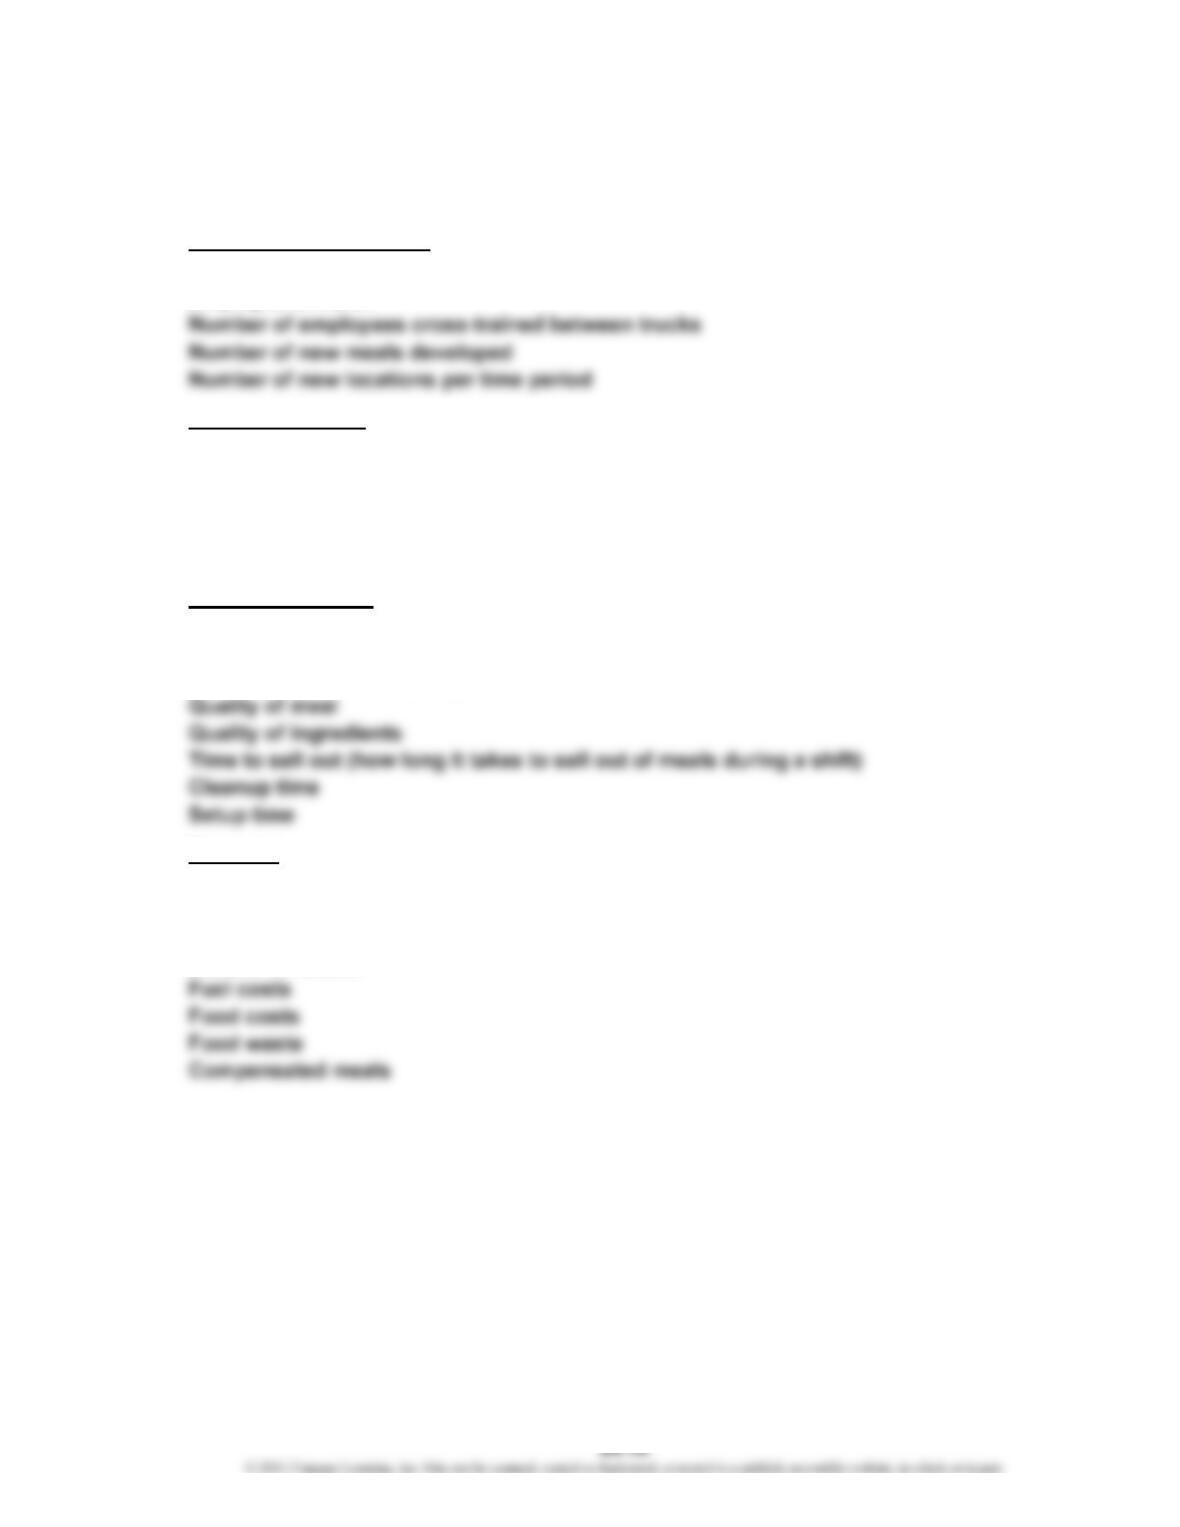
Ex. 24-19
This exercise is intended to spark discussion around using the balanced scorecard
in an emerging business. Some possible metrics are included below.
Innovation and Learning
Number of training hours
Employee turnover
Customer Service
Number of new customers
Ability to retain existing customers
Quality of food
Quality of customer interaction
Speed of the experience (how quickly customers can be served)
Internal Processes
Order delivery time
Consistency of portion size
Consistency of meal quality
Financial
Number of meals served per shift (Note: Shift might be considered breakfast, lunch,
dinner, or late night.)
Number of shifts per truck
Number of trucks
CHAPTER 24 Decentralized Operations
Ex. 24-20
a. Increase in T_Kong Industries’ Market Variable Cost Unit
Income from Operations = Price – per Unit × Transferred
$3,816,000 =($155 –$102) × 72,000
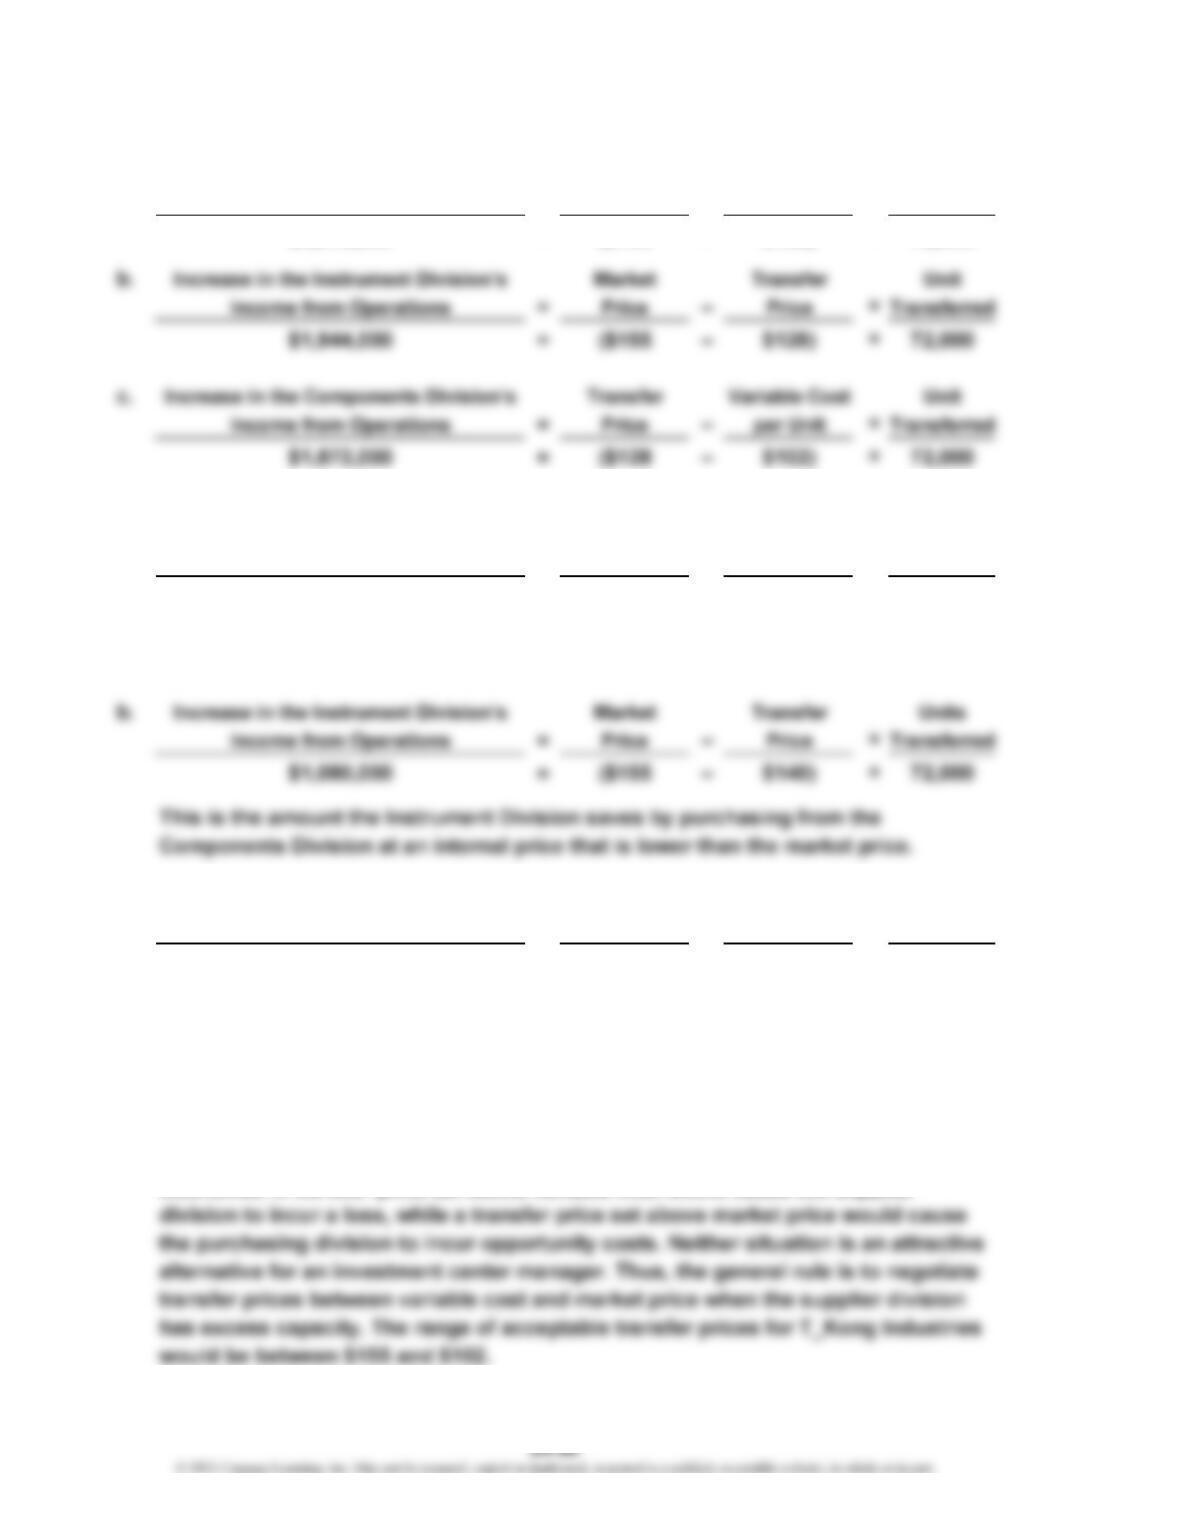
Ex. 24-21
a. Increase in T_Kong Industries’ Market Variable Cost Units
Income from Operations = Price – per Unit × Transferred
$3,816,000 =($155 –$102) × 72,000
This amount is the same amount by which T_Kong Industries’ income from
operations increased in Ex. 24-20, when a transfer price of $128 was used.
c. Increase in the Components Division’s Transfer Variable Cost Units
Income from Operations = Price – per Unit × Transferred
$2,736,000 =($140 –$102) × 72,000
This is the amount the Components Division earns by using available excess
capacity to produce and sell products above variable cost to the Instrument Division.
d. Any transfer price will cause the total income of the company to increase, as long
as the supplier division capacity is used to make materials for products that
are ultimately sold to the outside. However, transfer prices should be set between
variable cost and the market price in order to give the division managers proper