Chapter 24
Capital Budgeting and Investment
Analysis
QUESTIONS
1. Capital budgeting decisions require careful analysis because they are generally
the most difficult and risky decisions that management faces.
2. Capital budgeting is the process of planning the acquisition or sale of plant
assets.
3. Capital budgeting decisions are risky because: (1) the outcomes are uncertain,
(2) large amounts of money are usually involved, (3) the investment involves a
long-term commitment, and (4) the decisions may be difficult or impossible to
reverse.
4. The payback period ignores both the present value of cash flows and all cash
flows after the payback period.
5. A shorter payback period is desirable because management prefers to reduce
the risk that the investment might not be profitable over the long run. As a result
of acquiring assets with shorter payback periods, a company is both less
vulnerable to inaccurate long-term predictions of future cash flows and is less
subject to changes in external factors that might adversely affect the investment
project.
8. Receiving $100 one year from today is worth less than $100 today because a
return can be earned on a $100 investment during the year. If $100 to be
received one year from today is discounted at 12%, the present value is $100 x
0.8929 = $89.29 (the present value factor is taken from Table B.1). This means
that if $89.29 is invested at 12% for one year, it will be worth $100 at the end of
that year. This amount also can be found by dividing $100 by 1.12.
9. The internal rate of return is the rate that produces a net present value of zero. If
the internal rate of return is higher than the company’s hurdle rate, it means that
the net present value of the project is positive, and the company should make
the investment.
11. An investment of this nature in technology is risky for many reasons: (1) Samsung
cannot be 100% certain of the costs and benefits of such a system; (2) there is a
great amount of money involved; (3) the investment involves a long-term
commitment, (4) it may be difficult to reverse the decision once they have committed
to it, even if it looks like it will turn out poorly; and (5) new technology is always
risky due to innovation and uncertainty.
12. Some of the costs and benefits are: cost of the new equipment; cost savings from
operating the new equipment over the life of the equipment; training costs for
workers. All of these cash flows need to be evaluated using Google’s hurdle rate of
return.
13. Apple management could use one of the following common methods to evaluate the
potential investment in the expansion: payback period, accounting rate of return, net
present value, or internal rate of return.
QUICK STUDIES
Quick Study 24-1 (5 minutes)
Payback period = $27,000 / $9,000 = 3.0 years
Quick Study 24-2 (5 minutes)
Net present value of investment
Present value of four $9,000 cash inflows ($9,000 x 3.1699*) ………………
$28,529
Less immediate cash outflow ……………………………………………………….
27,000
Net present value …………………………..…………………………………………………
$ 1,529
Quick Study 24-4 (10 minutes)
1. Investment A would be preferred over Investment B because of A’s
shorter payback period.
2. No, an investment with a shorter payback period will not always be
chosen over one with a longer payback period. There are at least four
reasons why Investment B might be preferred over Investment A:
i. The present value of cash flows from Investment B might greatly
exceed the present value of cash flows from Investment A.
Quick Study 24-5 (10 minutes)
Annual net cash flow = Net income + depreciation
= $20,000 + $50,000* = $70,000
Payback period = $280,000 / $70,000 = 4.0 years
*($280,000 – $30,000)/5
Quick Study 24-6 (10 minutes)
Quick Study 24-7 (5 minutes)
Quick Study 24-8 (15 minutes)
Net present value of investment*
Present value of three $14,950 cash inflows ($14,950 x 2.2832)…………..
$34,134
Present value of $6,000 at end of three years ($6,000 x 0.6575) …………..
3,945
Present value of cash inflows ……………………………………………………….
38,079
Less immediate cash outflow ……………………………………………………….
45,000
Quick Study 24-9 (15 minutes)
Net present value of investment*
Present value of seven $10,000 cash inflows ($10,000 x 4.8684) …………
$48,684
Present value of $6,000 at end of seven years ($6,000 x 0.5132) …………
Less immediate cash outflow ……………………………………………………….
Quick Study 24–10 (10 minutes)
Project A: Profitability index = $1,100,000 / $400,000 = 2.75
Project B: Profitability index = $6,000,000 / $4,000,000 = 1.50
Higher values of the profitability index indicate a better project, so on the
basis of this measure the company should select Project A.
Quick Study 24–11 (15 minutes)
Net Cash
Flows
Present
Value of
1 at 12%
Present
Value of
Net Cash
Flows
Year 1 ……………………………………………………….
$100,000
0.8929
$ 89,290
Year 2 ……………………………………………………….
0.7972
Year 3 ……………………………………………………….
0.7118
Quick Study 24-12 (15 minutes)
Net Cash
Flows
Present
Value of
1 at 12%
Present
Value of
Net Cash
Flows
Year 1 ……………………………………………………….
$100,000
0.8929
$ 89,290
Year 2 ……………………………………………………….
90,000
0.7972
71,748
Year 3 ……………………………………………………….
0.7118
Quick Study 24-13 (10 minutes)
Present value factor = Amount invested = $47,947 = 2.2832 (rounded)
Net cash flows $21,000
Searching the three-year row in Table B.3 for a present value factor of
2.2832 shows that the internal rate of return is 15%.
Quick Study 24-14 (10 minutes)
Net present value of investment
Quick Study 24-15 (10 minutes)
Net present value of investment*
Present value of 35, $13,000 cash inflows ($13,000 x 11.6546*) ……………
$151,509.80
Less immediate cash outflow ……………………………………………………….
125,374.60
Net present value …………………………..…………………………………………………
$ 26,135.20
* 11.6546 = Present value of an annuity of 1, where n = 35, i = 8% (from Table B.3)
Since the net present value is positive the project should be accepted.
Quick Study 24-16 (10 minutes)
Quick Study 24–17 (15 minutes)
Year
Cash flows
Present value
of 1 at 10%
Present value of
cash flows
Cumulative
present value of
cash flows
0
$(90,000)
1.0000
$(90,000)
$(90,000)
1
35,000
0.9091
31,819
(58,181)
2
35,000
0.8264
28,924
(29,257)
3
35,000
0.7513
26,296
4
35,000
0.6830
23,905
5
35,000
0.6209
21,732
Quick Study 24–18 (15 minutes)
1. Payback period of investment = €80,000,000 / €16,000,000 = 5 years
EXERCISES
Exercise 24-1 (20 minutes)
Annual Net
Cumulative
Cash Flows
Cash Flows
Year 0 …………………………………………………………..
Year 1 …………………………………………………………..
$(180,000)
60,000
$(180,000)
(120,000)
Year 2 …………………………………………………………..
40,000
(80,000)
Year 3 …………………………………………………………..
70,000
(10,000)
Year 4 …………………………………………………………..
125,000
115,000
Exercise 24-2 (20 minutes)
Net Cash
Flows
Present
Value of
1 at 10%
Present
Value of
Net Cash
Flows
Year 1 ……………………………………………………….
$ 60,000
0.9091
$ 54,546
Year 2 ……………………………………………………….
40,000
0.8264
33,056
Year 3 ……………………………………………………….
70,000
0.7513
52,591
Year 4 ……………………………………………………….
0.6830
85,375
Year 5 ……………………………………………………….
0.6209
Exercise 24-3 (15 minutes)
ANNUAL CASH FLOWS
Net
Income
Depreciation*
Net Cash
Flow
Cumulative
Cash Flow
Year 0
Year 1
$ 10,000
$30,000
$(150,000)
$ 40,000
$(150,000)
(110,000
Year 2
25,000
30,000
55,000
(55,000)
Year 3
50,000
30,000
80,000
25,000
Year 4
37,500
30,000
67,500
92,500
Year 5
100,000
30,000
130,000
222,500
*($150,000 – $0)/5 = $30,000
Exercise 24-4 (30 minutes)
COMPUTATION OF ANNUAL DEPRECIATION EXPENSE
Double-declining balance rate = (100% / 5) x 2 = 40%
Annual Depr.
Beginning
(40% of
Accum. Depr.
Ending
Year
Book Value
Book Value)
at Year-End
Book Value
1
$150,000
$60,000
$ 60,000
$90,000
2
90,000
36,000
96,000
54,000
3
54,000
21,600
32,400
5
19,440
19,440
ANNUAL CASH FLOWS
Net
Income
Depreciation
Net Cash
Flow
Cumulative
Cash Flow
Year 0
Year 1
$ 10,000
$60,000
$(150,000)
$ 70,000
$(150,000)
(80,000)
Year 2
25,000
36,000
61,000
(19,000)
Year 3
50,000
21,600
71,600
52,600
Year 4
37,500
12,960
50,460
Year 5
100,000
19,440
119,440
Cost of machine ……………………………………………………………………
$150,000
Paid back in years 1 and 2 ……………………………………………………..
Exercise 24-5 (20 minutes)
a.
Payback period = = = 2.21 years
where
Annual after-tax income ……………………………………………………….
$150,000
Plus depreciation* …………………………………………………………………
85,000
Annual net cash flow …………………………………………………………….
$235,000
*Annual depreciation = = $85,000
b.
Annual after-tax income ……………………………………………………….
$ 60,000
Plus depreciation* …………………………………………………………………
45,000
Annual net cash flow …………………………………………………………….
$105,000
Exercise 24-6 (20 minutes)
a.
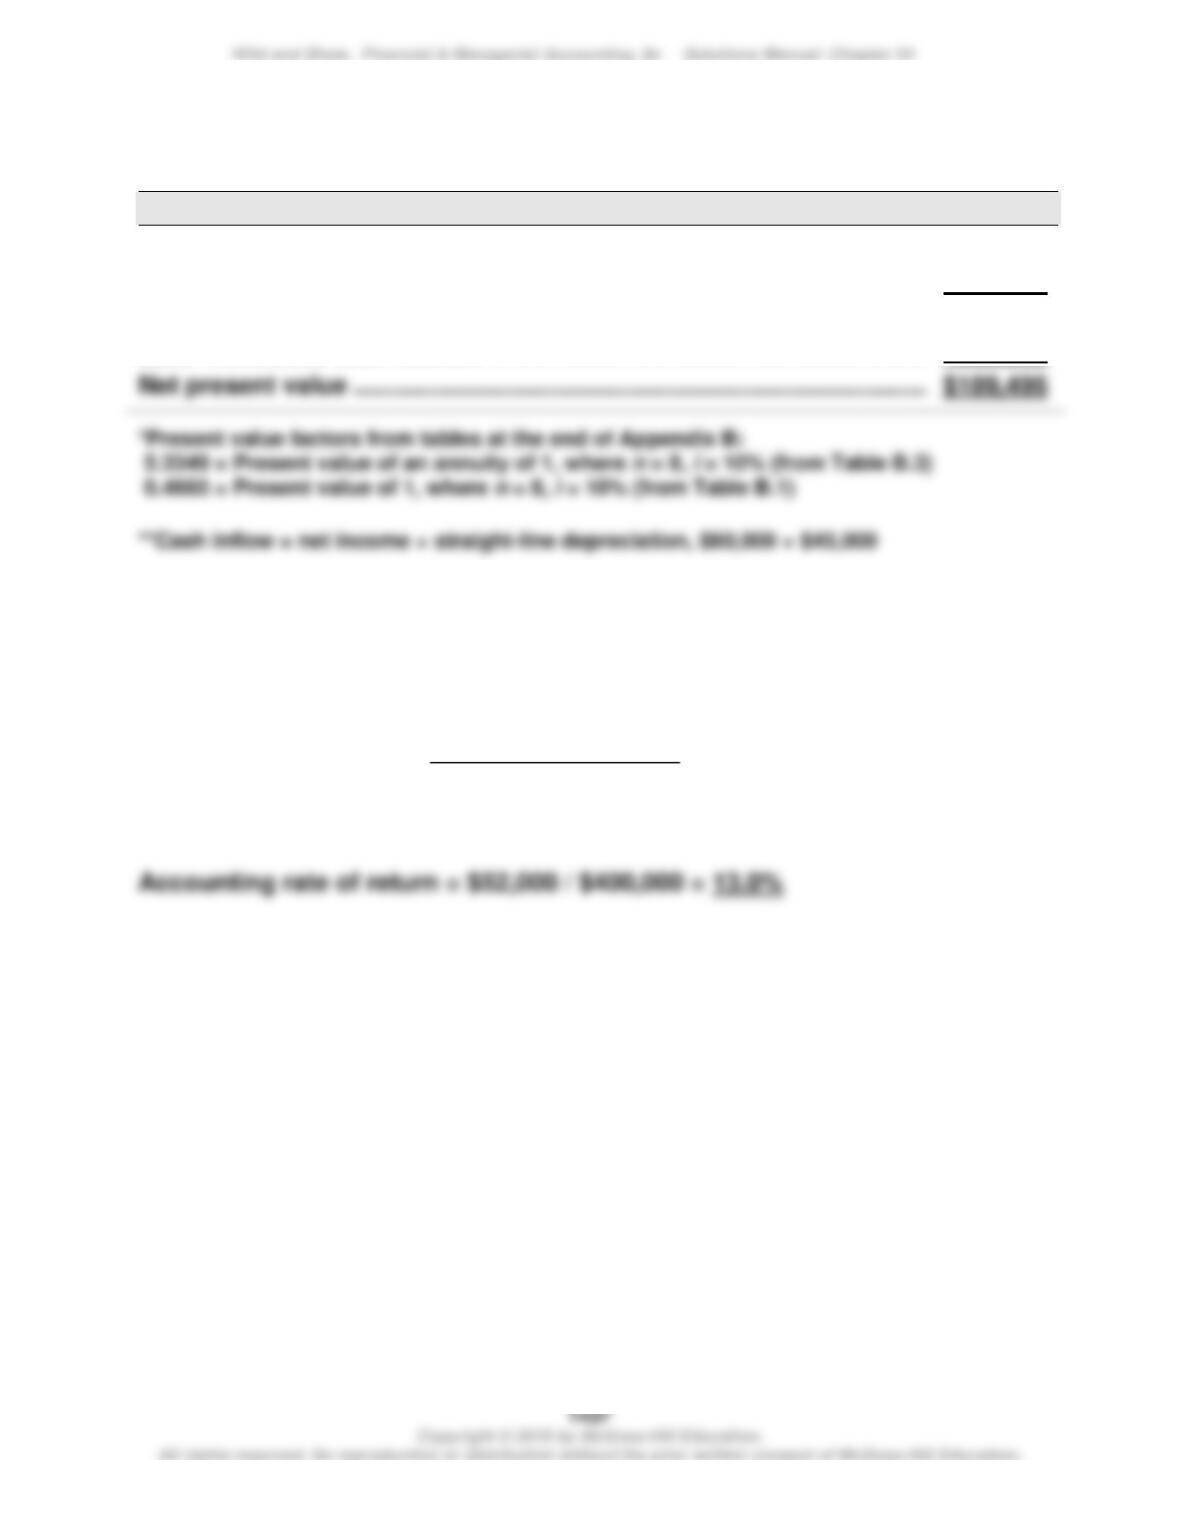
Net present value of investment*
Present value of six $235,000** cash inflows ($235,000 x 4.3553) ……….
$1,023,496
Present value of $10,000 at end of six years ($10,000 x 0.5645)…………..
5,645
Present value of cash inflows ……………………………………………………….
1,029,411
520,000
Cost of investment
Annual net cash flow
$520,000
$235,000
$520,000 – $10,000
6
Exercise 24–6 (continued)
b.
Net present value of investment*
Present value of eight $105,000** cash inflows ($105,000 x 5.3349) ……..
$560,165
Present value of $20,000 at end of eight years ($20,000 x 0.4665) ……….
9,330
Present value of cash inflows ……………………………………………………….
569,495
Less immediate cash outflow ……………………………………………………….
380,000
Exercise 24-7 (15 minutes)
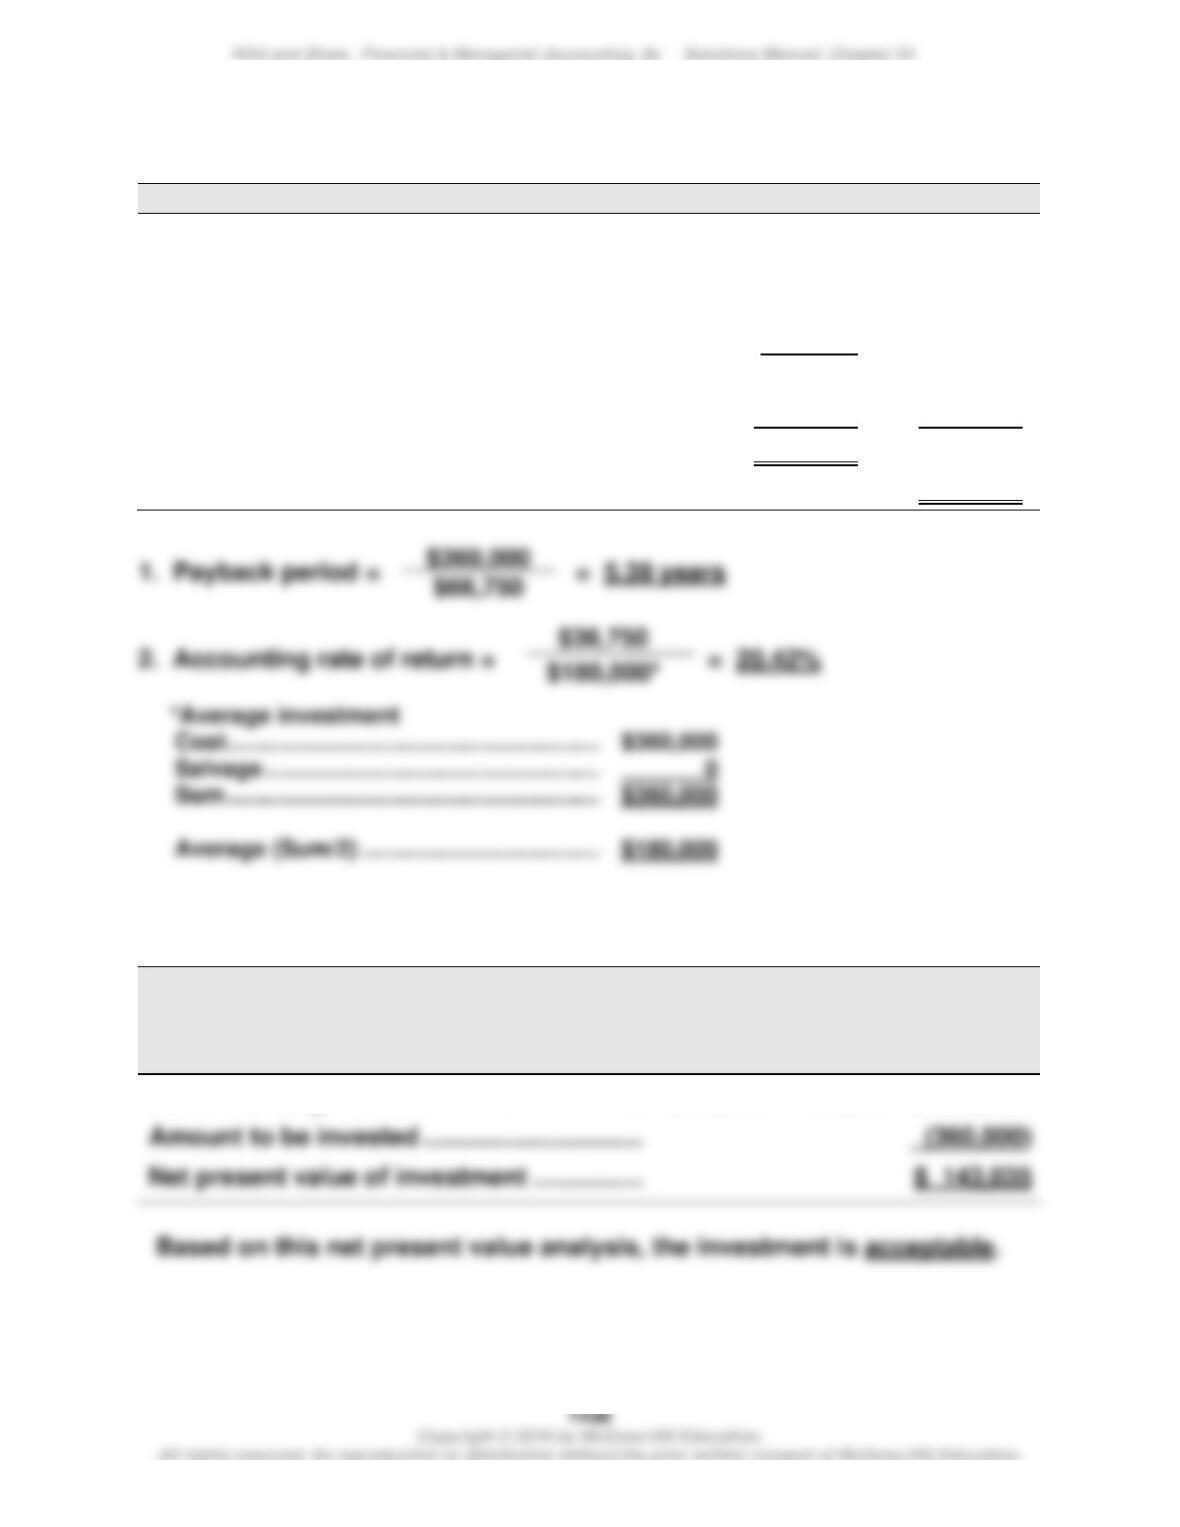
Average investment = = $400,000
$700,000 + $100,000
2
Exercise 24-8 (20 minutes)
COMPUTING NET CASH FLOWS FROM NET INCOME
Net income
Cash flows
Sales ……………………………………………………………………..
$225,000
$225,000
Materials, labor & overhead ……………………………………
120,000
120,000
Depreciation ……………………………………………………….
30,000
Selling and administrative ……………………………………..
22,500
22,500
Pretax income ……………………………………………………….
52,500
Income taxes (30%) ……………………………………………….
15,750
15,750
Net income ……………………………………………………….
$ 36,750
Net cash flows ……………………………………………………….
$ 66,750
Exercise 24-9 (15 minutes)
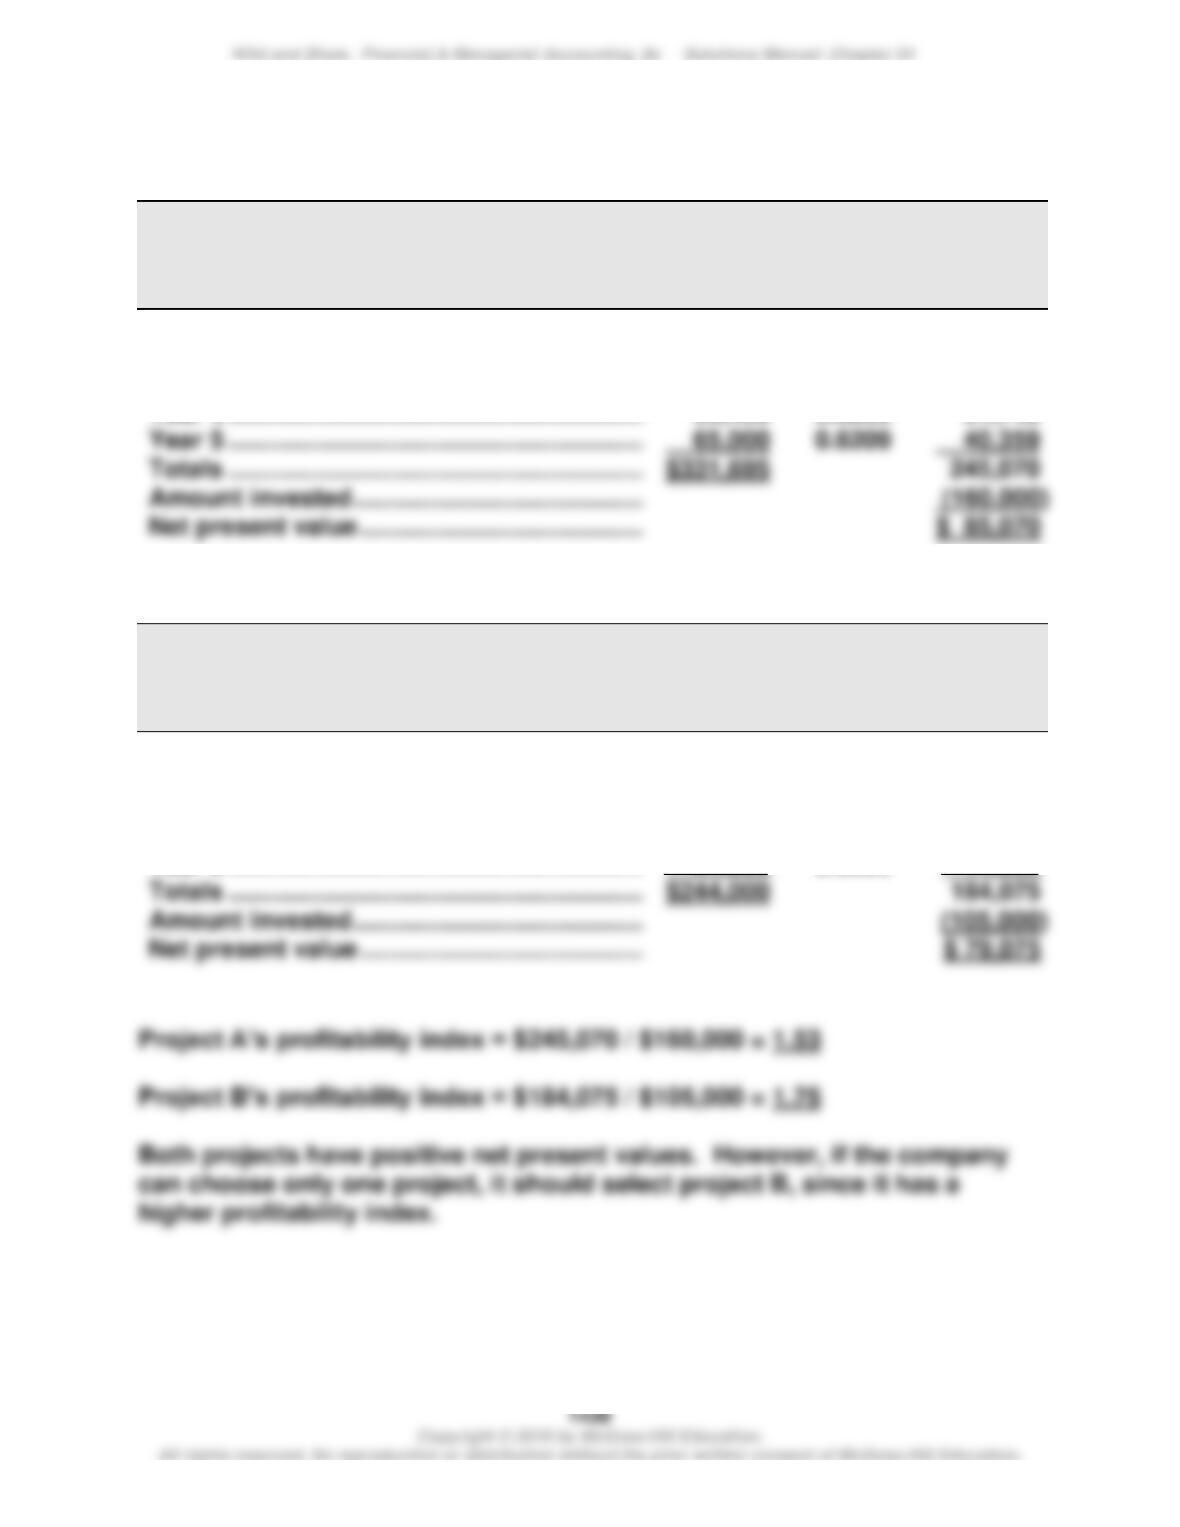
Annual
Net Cash
Flows
Present
Value of
Annuity
at 8%
Present
Value of
Net Cash
Flows
Years 1 through 12………………………………………..
$ 66,750
7.5361
$ 503,035
Exercise 24–10 (20 minutes)
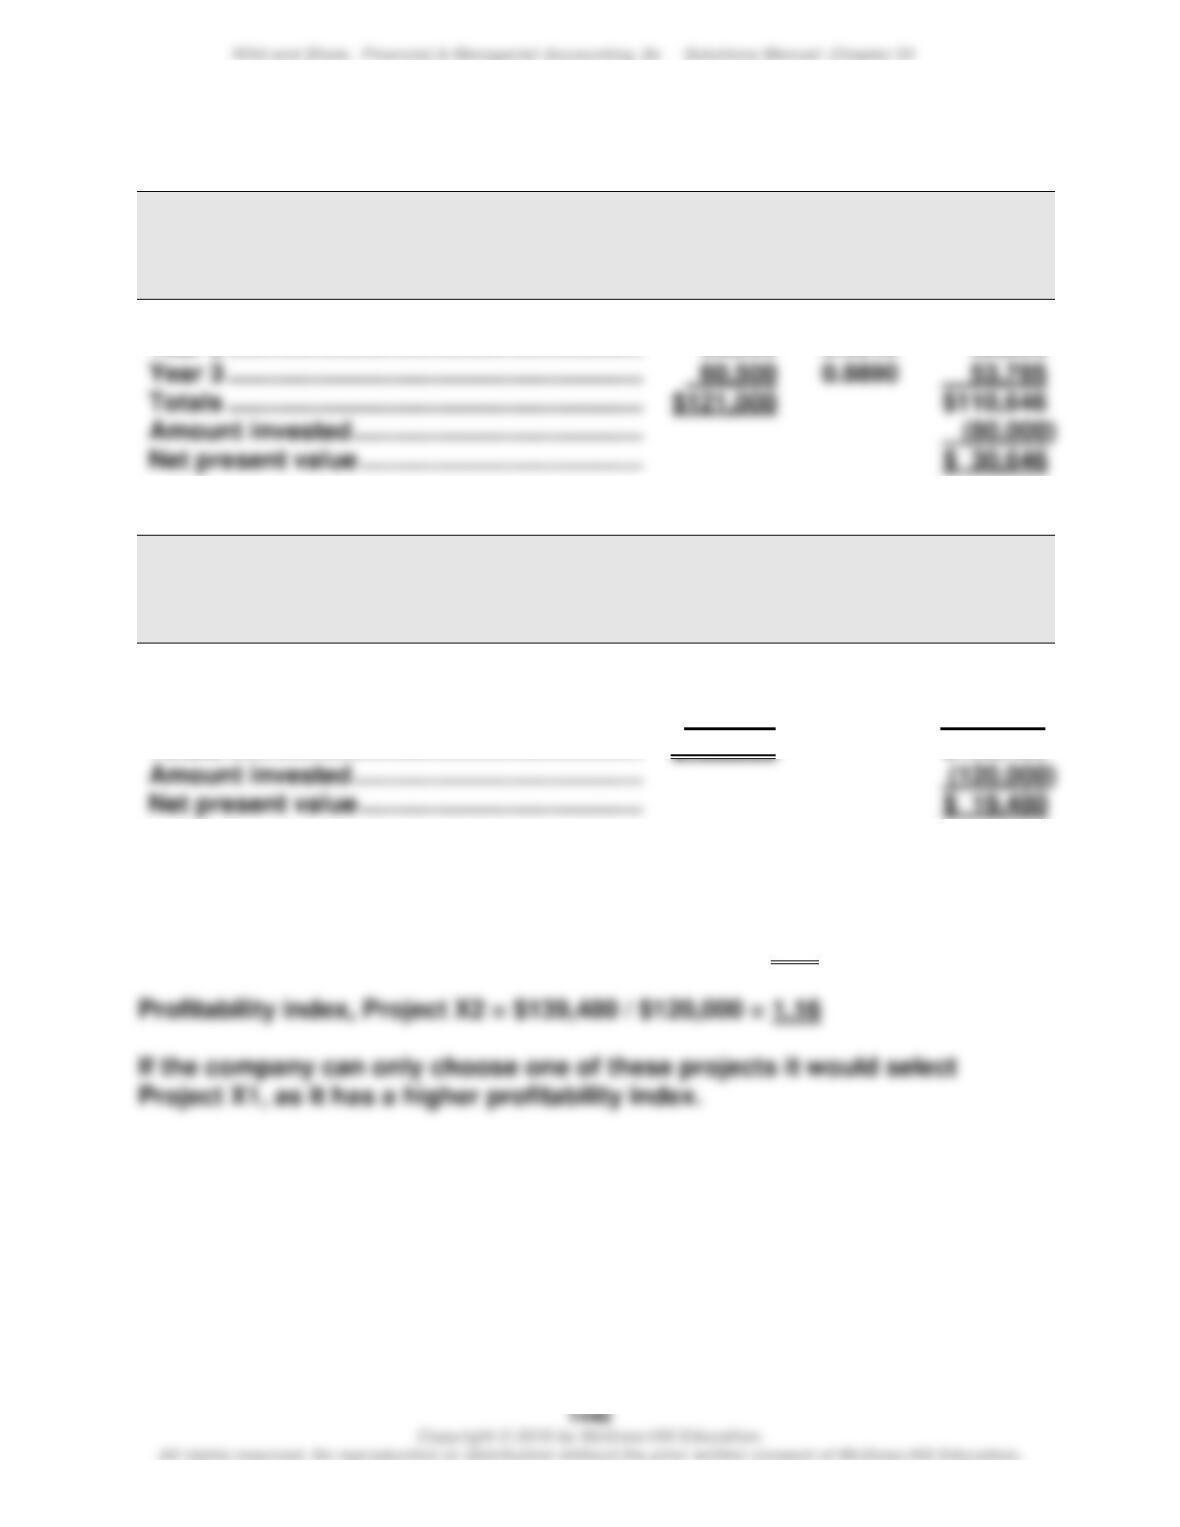
PROJECT A
Net Cash
Flows
Present
Value of
1 at 10%
Present
Value of
Net Cash
Flows
Year 1 ……………………………………………………….
$ 40,000
0.9091
$ 36,364
Year 2 ……………………………………………………….
56,000
0.8264
46,278
Year 3 ……………………………………………………….
80,295
0.7513
60,326
Year 4 ……………………………………………………….
90,400
0.6830
61,743
Year 5 ……………………………………………………….
0.6209
$331,695
(160,000)
PROJECT B
Net Cash
Flows
Present
Value of
1 at 10%
Present
Value of
Net Cash
Flows
Year 1 ……………………………………………………….
$ 32,000
0.9091
$ 29,091
Year 2 ……………………………………………………….
50,000
0.8264
41,320
Year 3 ……………………………………………………….
66,000
0.7513
49,586
Year 4 ……………………………………………………….
72,000
0.6830
49,176
Year 5 ……………………………………………………….
0.6209
$244,000
Exercise 24-11 (25 minutes)
a.
Project X1
Net Cash
Flows
Present
Value of
1 at 4%
Present
Value of
Net Cash
Flows
Year 1 ……………………………………………………….
$ 25,000
0.9615
$ 24,038
Year 2 ……………………………………………………….
35,500
0.9246
32,823
Year 3 ……………………………………………………….
60,500
0.8890
53,785
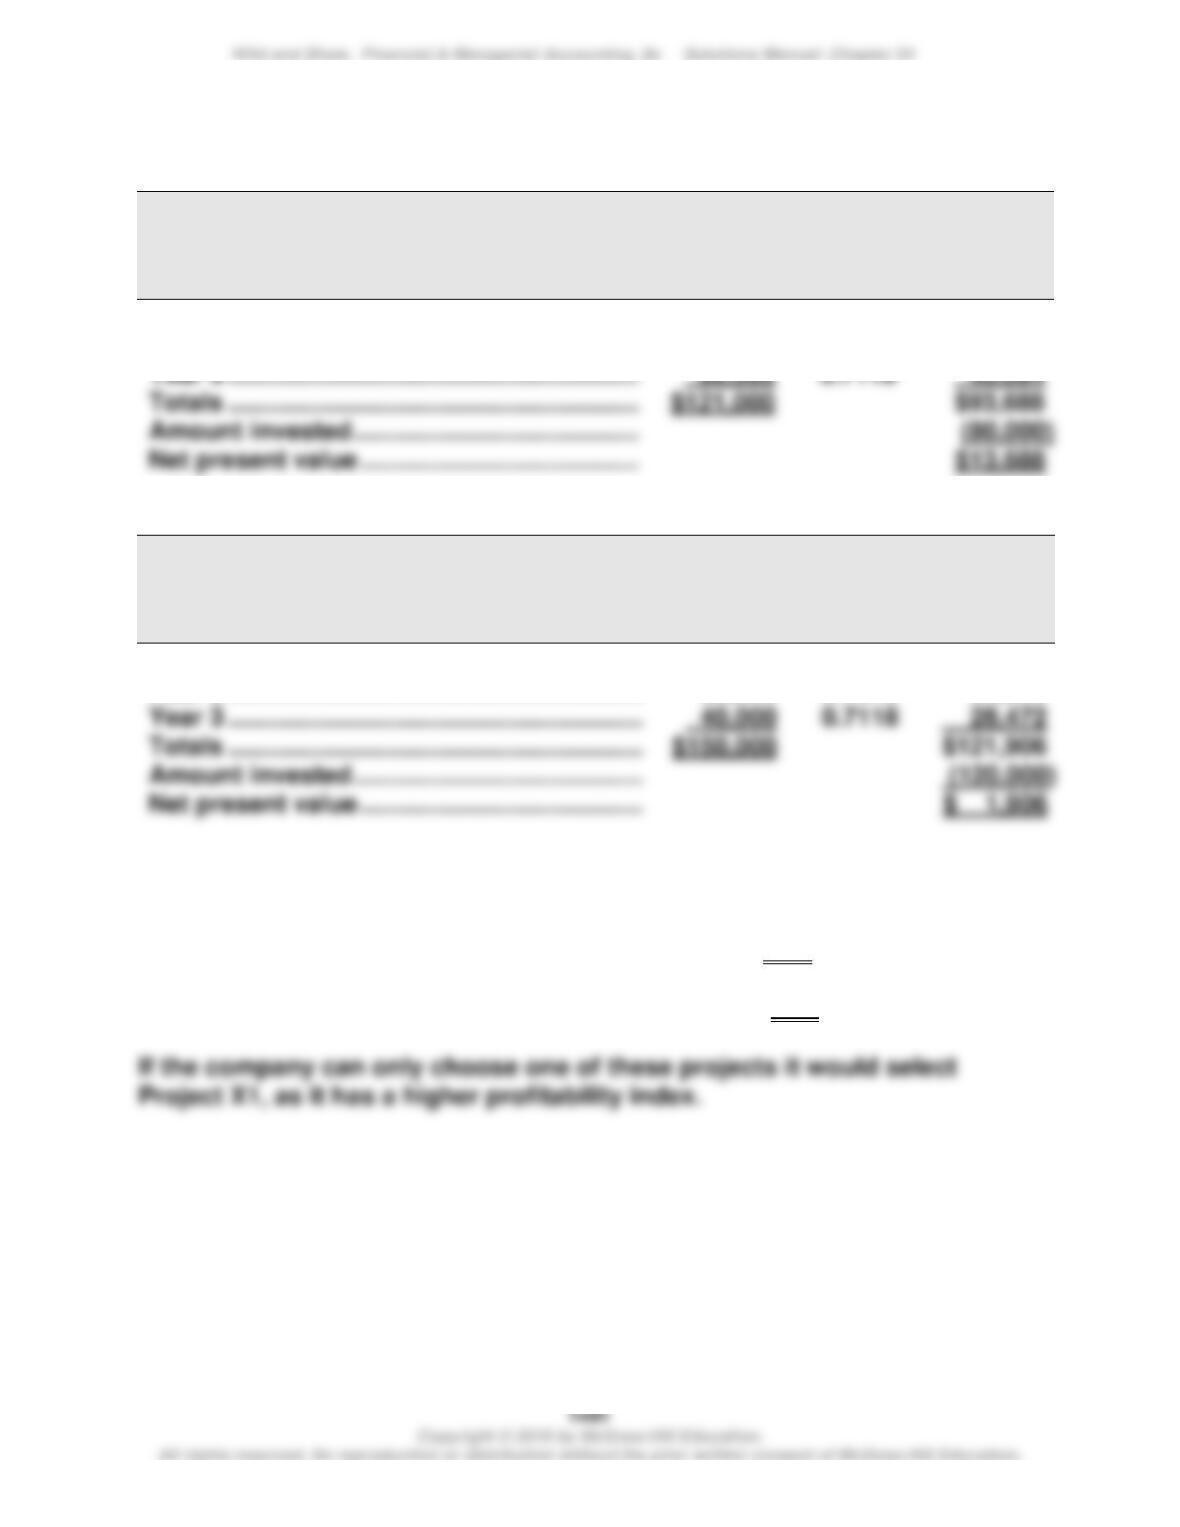
$121,000
(80,000)
Project X2
Net Cash
Flows
Present
Value of
1 at 4%
Present
Value of
Net Cash
Flows
Year 1 ……………………………………………………….
$ 60,000
0.9615
$ 57,690
Year 2 ……………………………………………………….
50,000
0.9246
46,230
Year 3 ……………………………………………………….
40,000
0.8890
35,560
b.
Profitability index, Project X1 = $110,646 / $80,000 = 1.38
Exercise 24–12 (25 minutes)
a.
Project X1
Net Cash
Flows
Present
Value of
1 at 12%
Present
Value of
Net Cash
Flows
Year 1 ……………………………………………………….
$ 25,000
0.8929
$ 22,323
Year 2 ……………………………………………………….
35,500
0.7972
28,301
Year 3 ……………………………………………………….
0.7118
Project X2
Net Cash
Flows
Present
Value of
1 at 4%
Present
Value of
Net Cash
Flows
Year 1 ……………………………………………………….
$ 60,000
0.8929
$ 53,574
Year 2 ……………………………………………………….
50,000
0.7972
39,860
Year 3 ……………………………………………………….
0.7118
b.
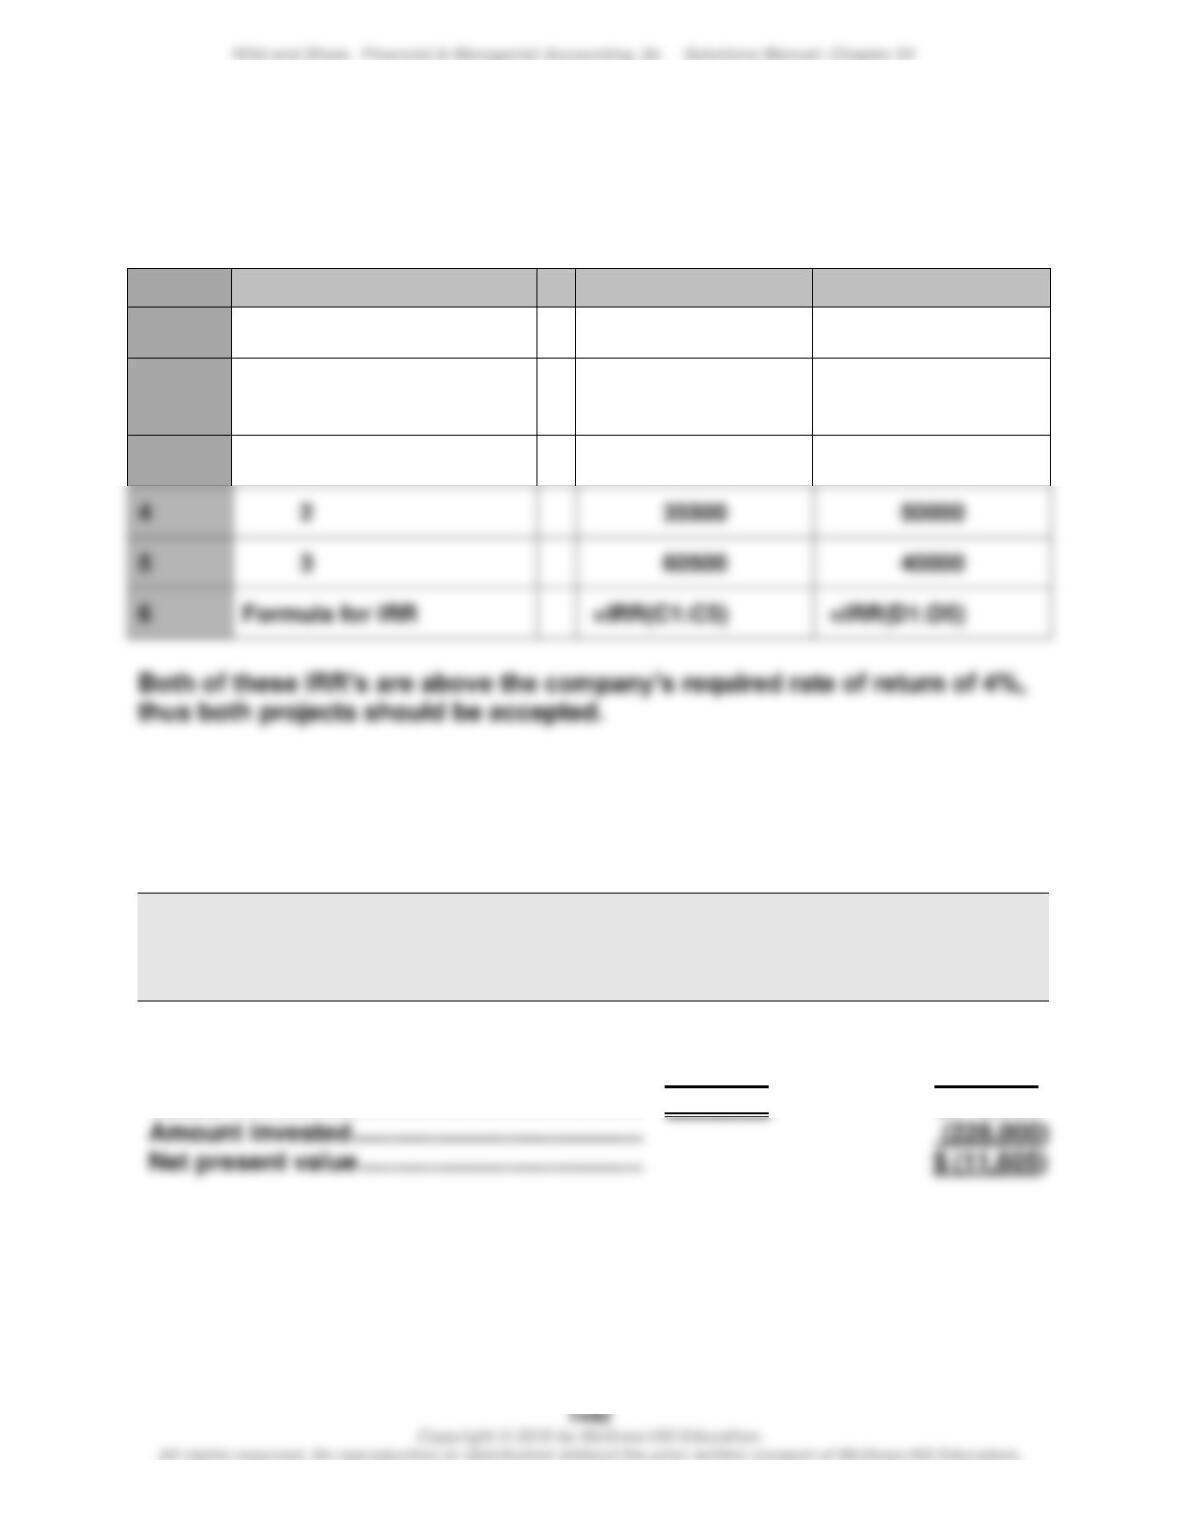
Profitability index, Project X1 = $93,688 / $80,000 = 1.17
Profitability index, Project X2 = $121,906 / $120,000 = 1.02
Exercise 24–13 (20 minutes)
Using Excel, Project X1 (X2) has an internal rate of return of 20.34% (12.99%).
Project X1 Project X2
A
B
C
D
1
Initial investment
-80000
–120000
2
Annual cash flows,
end of period
3
1
25000
60000
4
2
5
3
6
Formula for IRR
Exercise 24–14 (35 minutes)
1.
PROJECT C1
Net Cash
Flows
Present
Value of
1 at 12%
Present
Value of
Net Cash
Flows
Year 1 ……………………………………………………….
$ 12,000
0.8929
$ 10,715
Year 2 ……………………………………………………….
108,000
0.7972
86,098
Year 3 ……………………………………………………….
168,000
0.7118
119,582
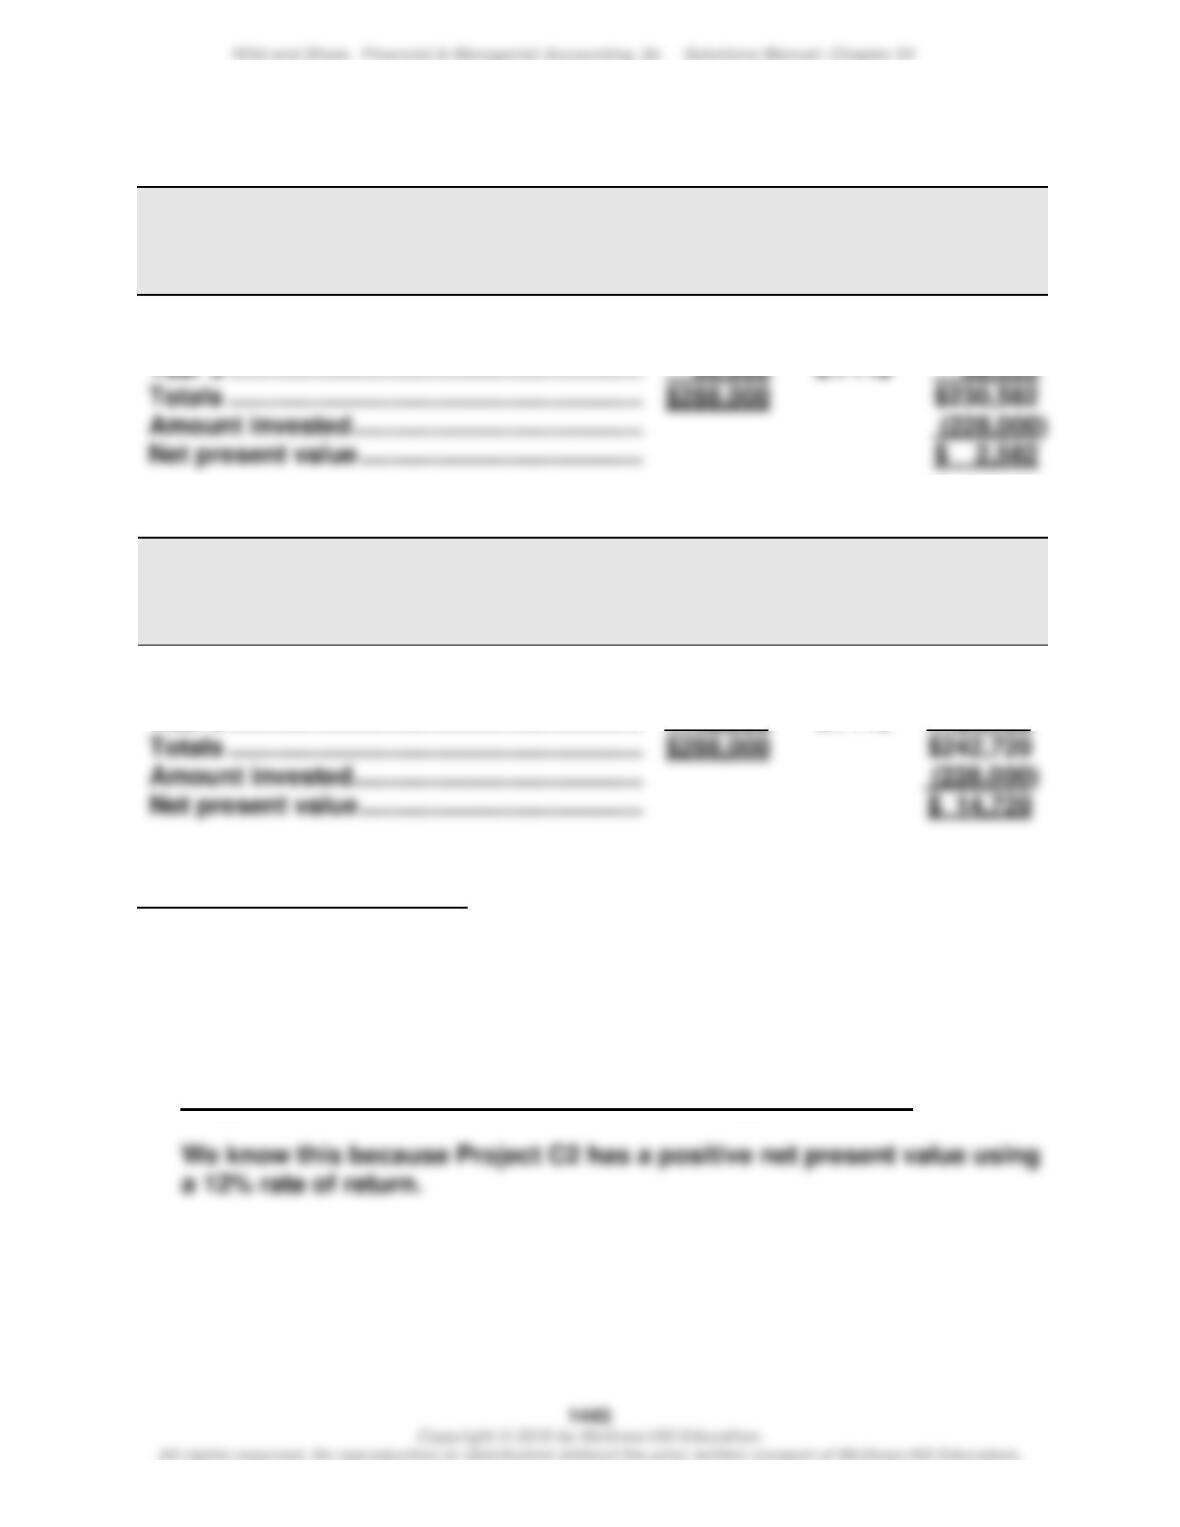
Totals ……………………………………………………….
$288,000
$216,395
Exercise 24–14 (continued)
PROJECT C2
Net Cash
Flows
Present
Value of
1 at 12%
Present
Value of
Net Cash
Flows
Year 1 ……………………………………………………….
$ 96,000
0.8929
$ 85,718
Year 2 ……………………………………………………….
96,000
0.7972
76,531
Year 3 ……………………………………………………….
0.7118
$288,000
PROJECT C3
Net Cash
Flows
Present
Value of
1 at 12%
Present
Value of
Net Cash
Flows
Year 1 ……………………………………………………….
$180,000
0.8929
$160,722
Year 2 ……………………………………………………….
60,000
0.7972
47,832
Year 3 ……………………………………………………….
0.7118
$288,000
$242,720
Analysis and Interpretation: Both Project C2 and C3 yield a positive net
present value. Accordingly, both C2 and C3 are acceptable investments.
Project C1 has a negative net present value, so it should be rejected.
2. INTERNAL RATE OF RETURN VS. NET PRESENT VALUE FOR C2
Project C2 will have an internal rate of return higher than 12%.
Exercise 24-15 (15 minutes)
1.
Annual
Net Cash
Flows
P.V. of an
Annuity of
1 at 10%
P.V. of Net
Cash
Flows
Years 1-20 direct labor savings ……………………..
$ 500,000
8.5136
$ 4,256,800
Amount invested …………………………………………..
(4,000,000)
Net present value ………………………………………….
$ 256,800
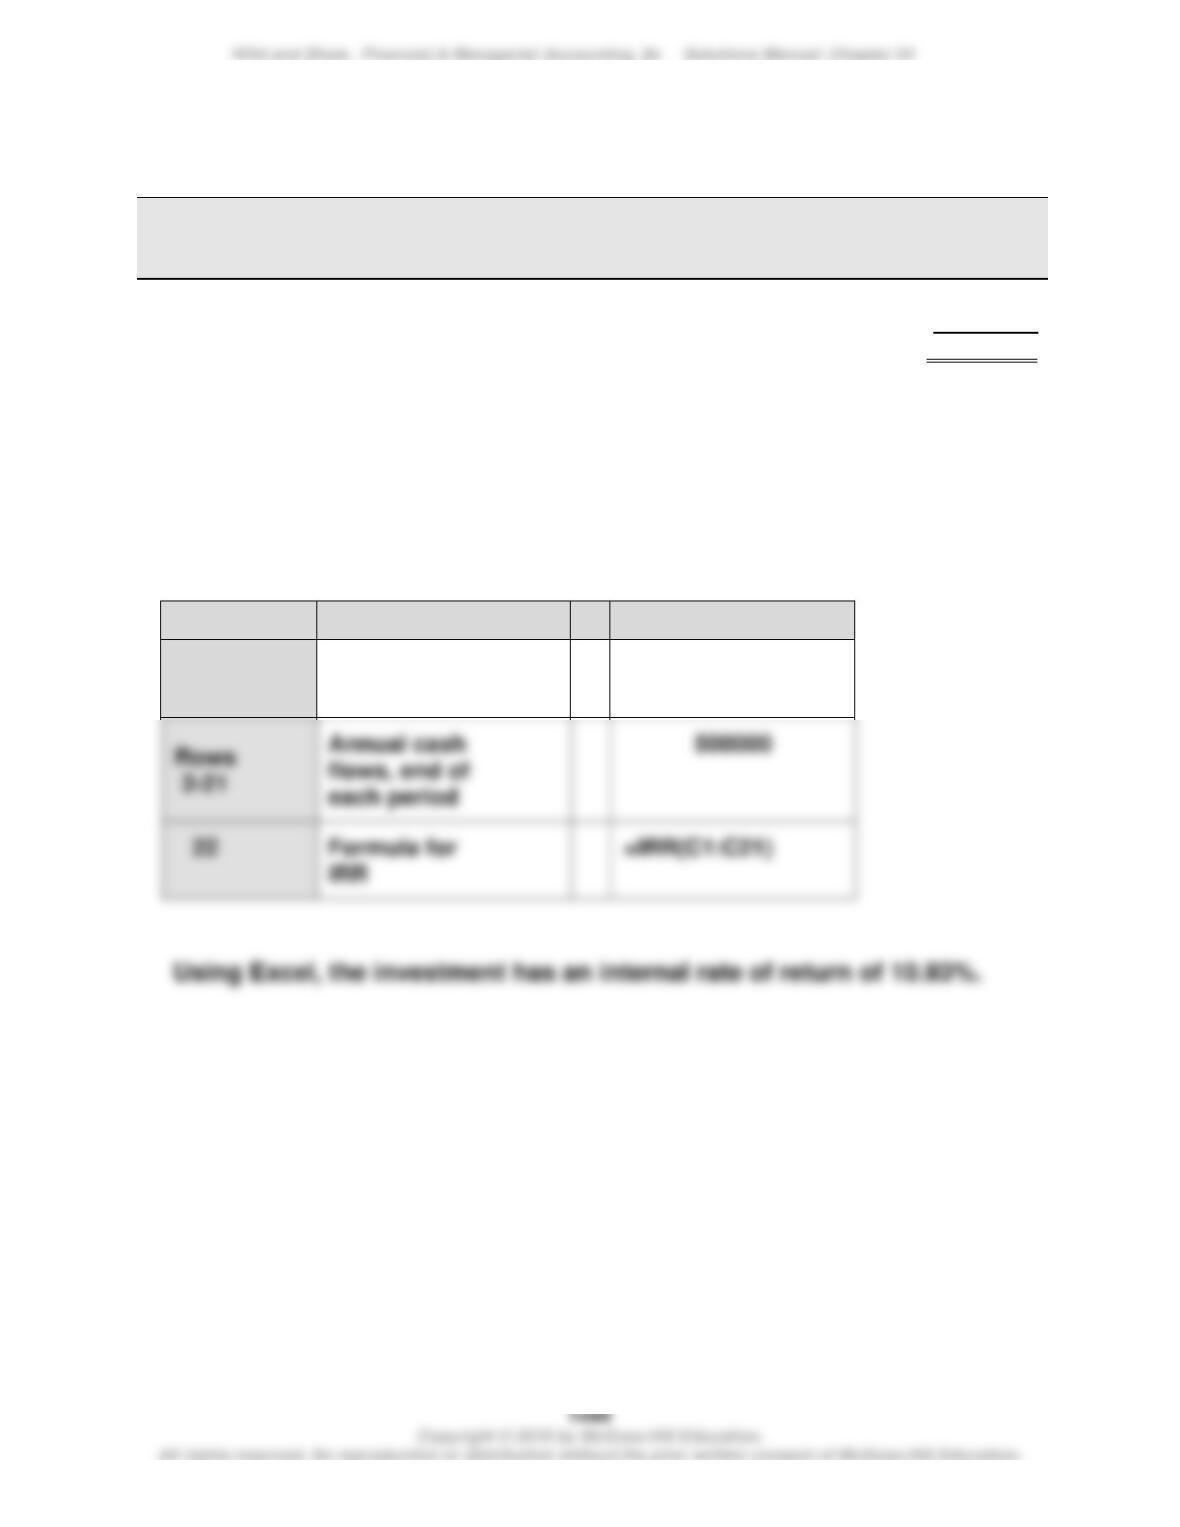
2. The project has a positive net present value, thus the internal rate of
return is greater than the required return of 10%.
Exercise 24–16A (20 minutes)
A
B
C
1
Initial
investment
-4000000
Formula for
IRR