
Copyright © 2019 McGraw-Hill Education. All rights reserved. No reproduction or distribution without the prior written consent of McGraw-Hill Education.
24-1
CHAPTER 24
CAPITAL BUDGETING AND INVESTMENT ANALYSIS
Related Assignment Materials
Student Learning Objectives
Discussion
Questions
Quick
Studies*
Exercises*
Problems*
AA and BTN
Analytical objectives:
A1. Analyze a capital investment project
using break-even time.
15
24-17
24-17, 24-18
24-5, 24-6
Analytical objectives:
P1. Compute payback period and
describe its use.
1, 2, 3, 4, 5,
13, 14
24-1, 24-4,
24-5, 24-18
24-11, 24–12,
24-14, 24–15,
24-18
24-11, 24-12,
24-14, 24-15
BTN 24-2, BTN 24-3,
BTN 24-4, BTN 24-5,
BTN 24-6
24-16
24-15, 24-16,
24-17
BTN 24-2, BTN 24-5
24-1, 24-3,
24-4, 24-5,
24-1, 24-2,
24-5, 24-6
BTN 24-2, BTN 24-3,
BTN 24-4, BTN 24-5
*See additional information on next page that pertains to these quick studies, exercises and problems.
SP refers to the Serial Problem
AA refers to Accounting Analysis
BTN refers to Beyond the Numbers
Guided Example included
Additional Information on Related Assignment Material
See Chapter 1 of the Instructor’s Resource Manual for more information on materials for this text available in
Connect.
Hints/Guided Examples
24-2
Please note that the Guided Examples are labeled as “Hints” in Connect assignments. The animated PowerPoints without
the video and audio functions for the Guided Examples are also available in the Connect Instructor Library and Exercise
Presentations. These are indicated in the Related Assignment Materials grid on page 1 in blue bold font.
Need-to-Know Videos
LO
Need–to-Know
Title
Time
P1
24-1
Payback Period
1:49
P2
24-2
Accounting Rate of Return
0:54
P3
24-3
Net Present Value
2:35
P4
24-4
Internal Rate of Return
1:45
Concept Overview Videos, (COV’s)
LO
Title
Time
A1
Analyze a capital investment project using break-even time.
Break-even Time
2:07
P1
Compute payback period and describe its use.
Payback Period with Even Cash Flows
1:12
Payback Period with Uneven Cash Flows
2:02
Evaluating Payback Period — Advantages
0:25
Evaluating Payback Period — Disadvantages
1:17
P2
Compute accounting rate of return and explain its use.
Accounting Rate of Return
2:04
Evaluating Accounting Rate of Return
0:31
P3
Compute net present value and describe its use.
Net Present Value
1:44
Decision Rule
0:20
Impact of Salvage Value
0:44
Comparing Positive NPV Projects
0:32
P4
Compute internal rate of return and explain its use.
Internal Rate of Return
1:34
Synopsis of Chapter Revision
NEW opener—Fellow Robots and entrepreneurial assignment.
New discussion of post-audit of investment decisions.
Chapter Outline
I. Capital budgeting – process of analyzing alternative long-term investments and deciding which assets to
acquired or sell
A. An objective of capital budgeting decisions is to earn a satisfactory rate of return.
B. The process begins with department or plant managers submitting proposals for new investment in
property, plant, and equipment. A capital budget committee evaluates the proposals and recommends for
approval or rejection. Finally, the board of directors approves capital expenditures for the year.
II. Methods Not Using Time Value of Money⎯Investments are expected to produce net cash outflows; Net
Cash flows equal cash inflows minus cash outflows. Simple analysis methods do not consider the time value
of money.
A. Payback Period
1. Payback period is the expected amount of time to recover the initial investment amount.
2. Evaluating Payback Period: managers prefer investments with shorter payback periods.
a. Shorter payback period reduces risk of an unprofitable investment over the long run.
b. Company’s risk due to potentially inaccurate long-term predictions of future cash flows is
reduced.
4. Payback period has two strengths: it uses cash flows, not income and it is easy to use.
5. Payback period has three main weaknesses: it does not reflect differences in the timing of net cash
flows within the payback period; it ignores all cash flows occurring after the point of fully recovered
costs; and it ignores the time value of money.
B. Accounting Rate of Return
1. The percentage accounting return on annual average investment.
2. Called “accounting” return because it is based on net income instead of on cash flows.
3. Computed as:
Annual after-tax net income
24-4
Annual = sum of individual years’ average book value
Ave. Invest number of years of the planned investment
6. Accounting Rate of Return = Annual After-tax net income
Annual Average investment
7. Risk of an investment should be considered.
a. Investment’s return is satisfactory only when related to returns from other investments with
similar lives and risk.
b. Capital investment with least risk and highest return for the longest time is often identified as
best; analysis can be challenging because different investments often yield different rankings
III. Methods Using Time Value of Money⎯Net present value and internal rate of return methods consider time
value of money.
A. Net Present Value (see also Appendix B near end of textbook)
1. Net Present Value (NPV) analysis applies the time value of money to cash inflows and cash
outflows so management can evaluate a project’s benefits and cost at one point in time.
2. NPV is computed by discounting the future net cash flows from the investment at the required rate
of return, and then subtract the initial amount invested.
3. Net Present Value Decision Rule
a. Net Present Value = PV of cash flows – Amount Invested
b. If the NPV is greater than or equal to $0, then asset is expected to recover its cost and provide a
return at least as high as that required; invest.
c. If NPV is negative, do not invest
4. NPV analysis can be used when comparing several investment opportunities; if investment
opportunities have same cost and same risk, the one with highest NPV is preferred.
5. When annual net cash flows are equal in amount, NPV calculation can be simplified.
a. Individual annual present value of $1 factors can be summed, and the total multiplied by annual
net cash flow to get total present value of net cash flows.
b. To simplify the computation, the present value of an annuity of $1 table may be used
c. Calculator with compound interest function or a spreadsheet program can also be used.
6. Cash savings from automation – NPV analysis can be used to decide whether to automate a
production process. Increased automation from use of robotics and computer numerical control
10. Inflation – net cash flows can be adjusted for inflation by using future value computations.
11. Comparing positive NPV projects is of limited value for comparison purposes if initial investment
differs substantially across projects.
12. When a company can’t fund all positive net present value projects, they can be compared using the
profitability index:
a. Profitability Index = Present value of net cash flows
Initial investment
b. A higher profitability index makes the project more desirable.
13. NPVs should be computed using different discount rates; the greater the risk, the higher the discount
rate.
14. Capital rationing – hard rationing is imposed by external forces and soft rationing is internally
imposed by management. Profitability index can be used to select the best of several competing
projects.
B. Internal Rate of Return
1. IRR is a rate used to evaluate acceptability of an investment; it equals the rate that yields a NPV of
zero for an investment.
2. Total present value of project’s net cash flows is computed using the IRR as the discount rate, and

24-6
4. When cash flows are unequal, it is best to use either a calculator or spreadsheet software to compute
IRR.
5. Compare IRR with hurdle rate (or minimum acceptable rate of return); if IRR exceeds hurdle rate,
invest.
C. Comparison of Capital Budgeting Methods (see Exhibit 24.12)
1. Payback period and accounting rate of return do not consider time value of money; NPV and IRR
do.
2. Payback period method is simple; it is sometimes used when there is limited cash to invest and a
number of projects to choose from. It gives manager an estimate of how soon the initial investment
can be recovered.
3. Accounting rate of return is a percent measure computed using accrual income instead of cash flows
and is an average rate for the entire investment period; annual returns are not reflected.
4. Net Present Value (NPV):
a. Considers all estimated net cash flows of project; can be applied to equal and unequal cash
flows.
b. Can reflect changes in level of risk over life of project.
c. Comparisons of projects of unequal sizes is more difficult
IV. Break-Even Time – time-based measure used to evaluate a capital investment’s acceptability.
A. Yields a measure of expected time, which reflects the time period until the present value of the net cash
flows equals the initial cost of the investment.
B. Break-even time computed by restating future cash flows in terms of present values and then
determining the payback period using these present values.
V. Using Excel to Compute Net Present Value and Internal Rate of Return (Appendix) NPP and IRR
calculations can be performed simply and accurately by using functions built into Excel. Examples shown in
Chapter 24 Appendix.
24-7
Chapter 24 Alternate Demo Problem
A company is planning to buy a new machine at a cost of $200,000. The machine is
expected to last for 10 years and have no salvage value at the end of its useful life.
Straight-line depreciation will be used. The company expects to save 10,000 hours of
direct labor each year because of the new machine, as well as $4,000 each year in
other operating costs.
Management’s best estimate is that on average the hourly rate for the labor saved will
be $5.50. With the exception of the initial purchase, assume all cash flows take place at
the end of the year, and a tax rate of 40%.
Required:
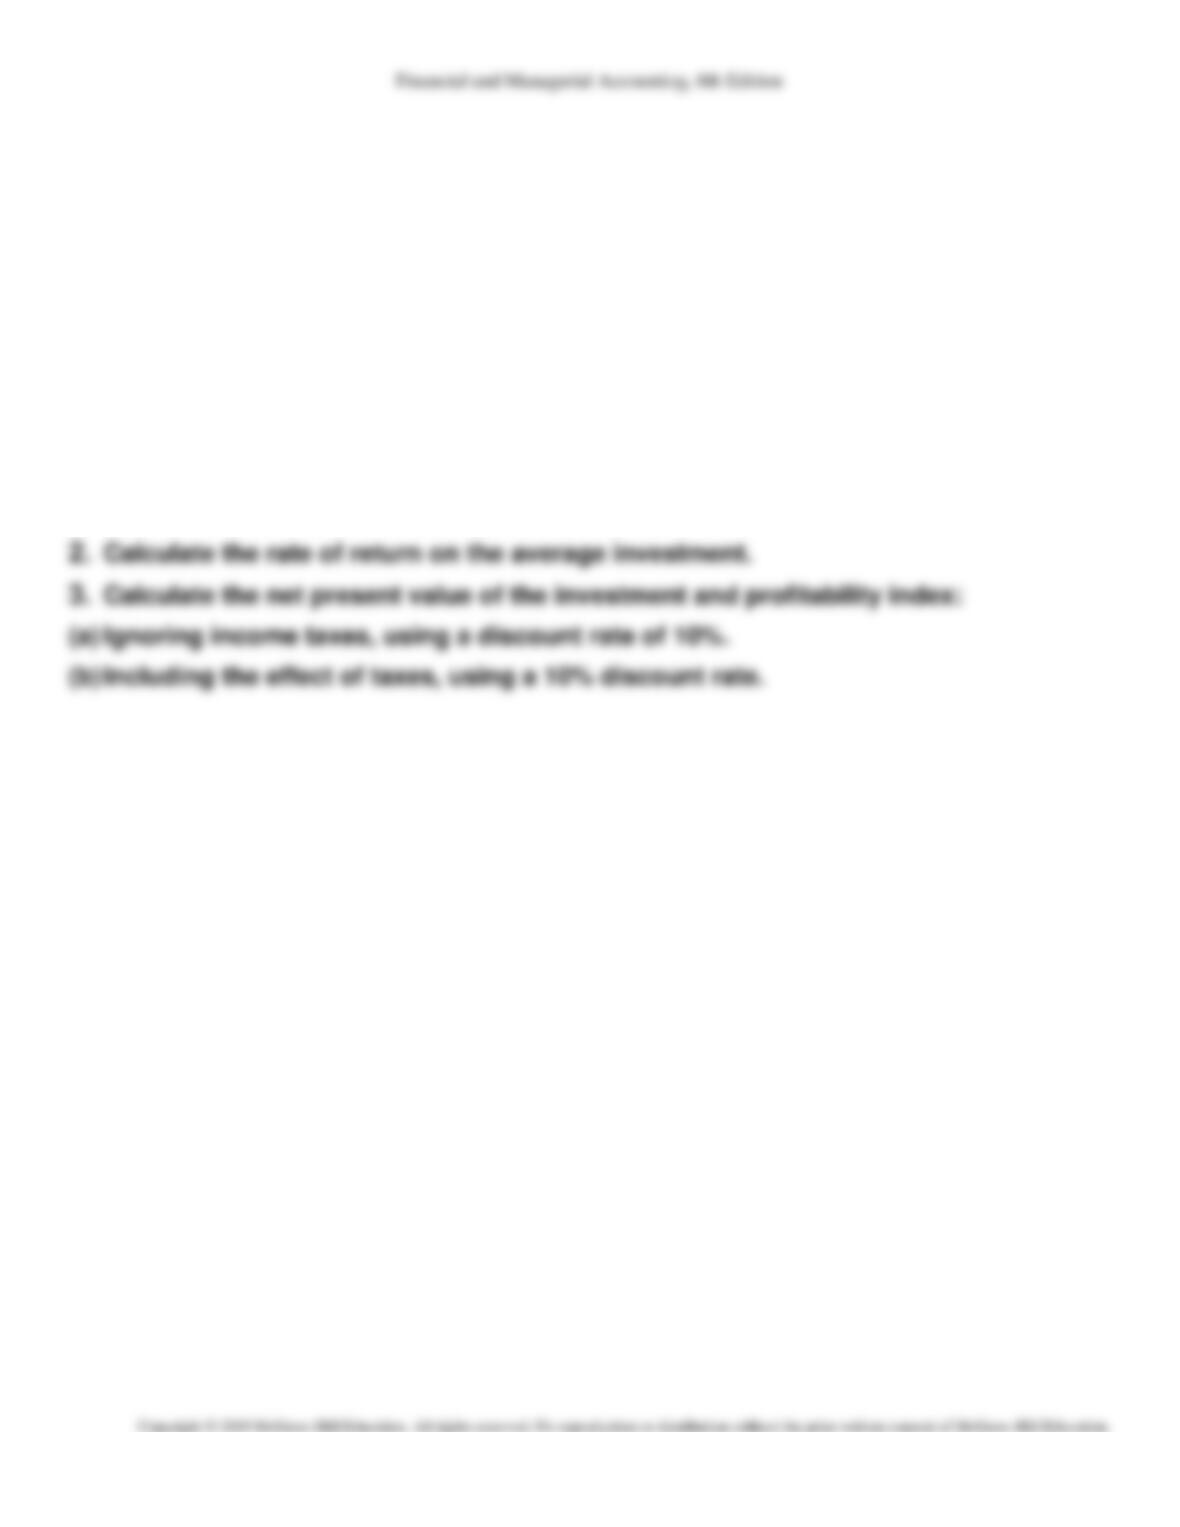
1. Calculate the payback period on the investment in new machinery.
24-8
1.
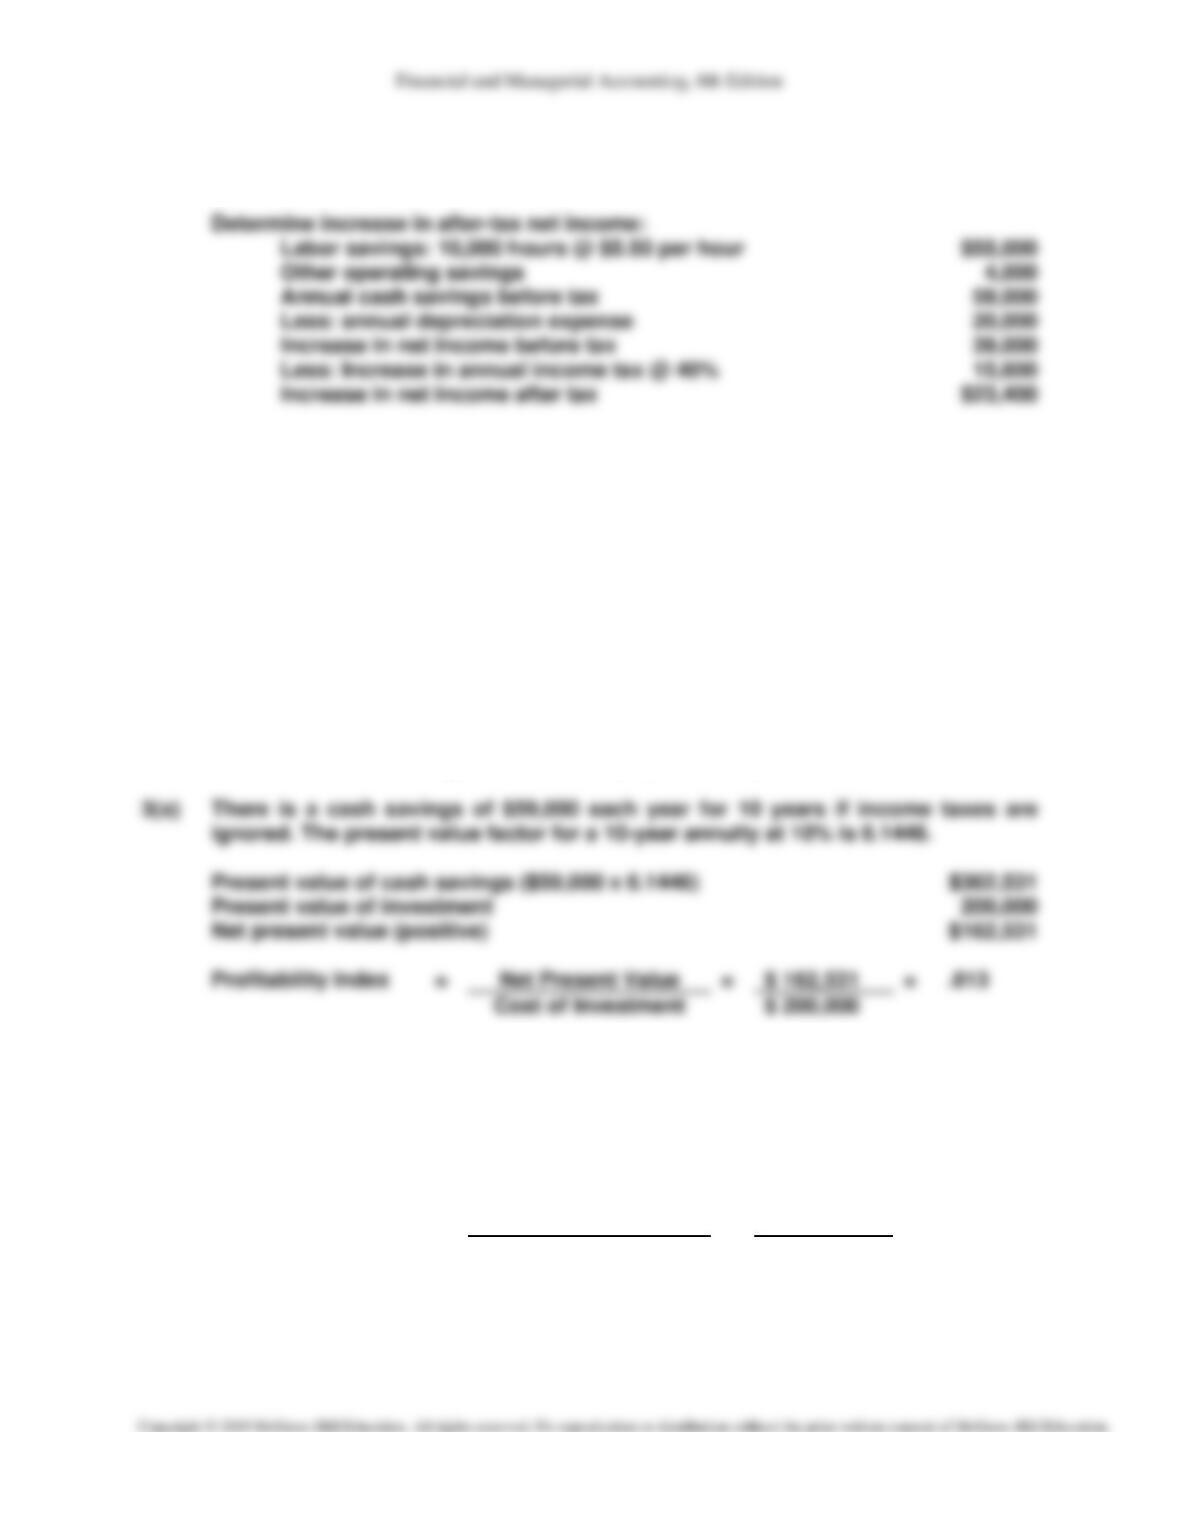
Determine increase in after-tax net income:
Labor savings: 10,000 hours @ $5.50 per hour
$55,000
Other operating savings
Annual cash savings before tax
59,000
Less: annual depreciation expense
20,000
Increase in net income before tax
Less: Increase in annual income tax @ 40%
15,600
Increase in net income after tax
$23,400
Chapter 24 Alternate Demo Problem: Solution
First, calculate annual net cash flow:
Then, add back depreciation expense (noncash):
Increase in net income after tax
$23,400
Plus annual depreciation expense
20,000
Annual net cash flow
$43,400
Payback period equals cost of new machine divided by annual net cash flow or
$200,000 / $43,400 = 4.6 years.
2.
The rate of return on average investment equals the increase in net income after
tax divided by the amount of the average investment.
The average investment would be $200,000 / 2, or $100,000.
Rate of return on average investment = $23,400 / $100,000 = 23.4%
3(a)
There is a cash savings of $59,000 each year for 10 years if income taxes are
ignored. The present value factor for a 10-year annuity at 10% is 6.1446.
Present value of cash savings ($59,000 x 6.1446)
$362,531
Present value of investment
200,000
Net present value (positive)
$162,531
Profitability Index
=
=
$ 162,531
=
.813
Cost of Investment
$ 200,000
3(b)
There is a cash savings of only $43,400 each year for 10 years if income taxes are
considered.
Present value of cash savings ($43,400 x 6.1446)
$266,676
Present value of investment
200,000
Net present value (positive)
$ 66,676
Profitability Index
=
Net Present Value
=
$ 66,676
=
.333
Cost of Investment
$ 200,000