CHAPTER 24 Performance Evaluation for Decentralized Operations
Prob. 24–1A
1.
Over Under
Budget Actual Budget Budget
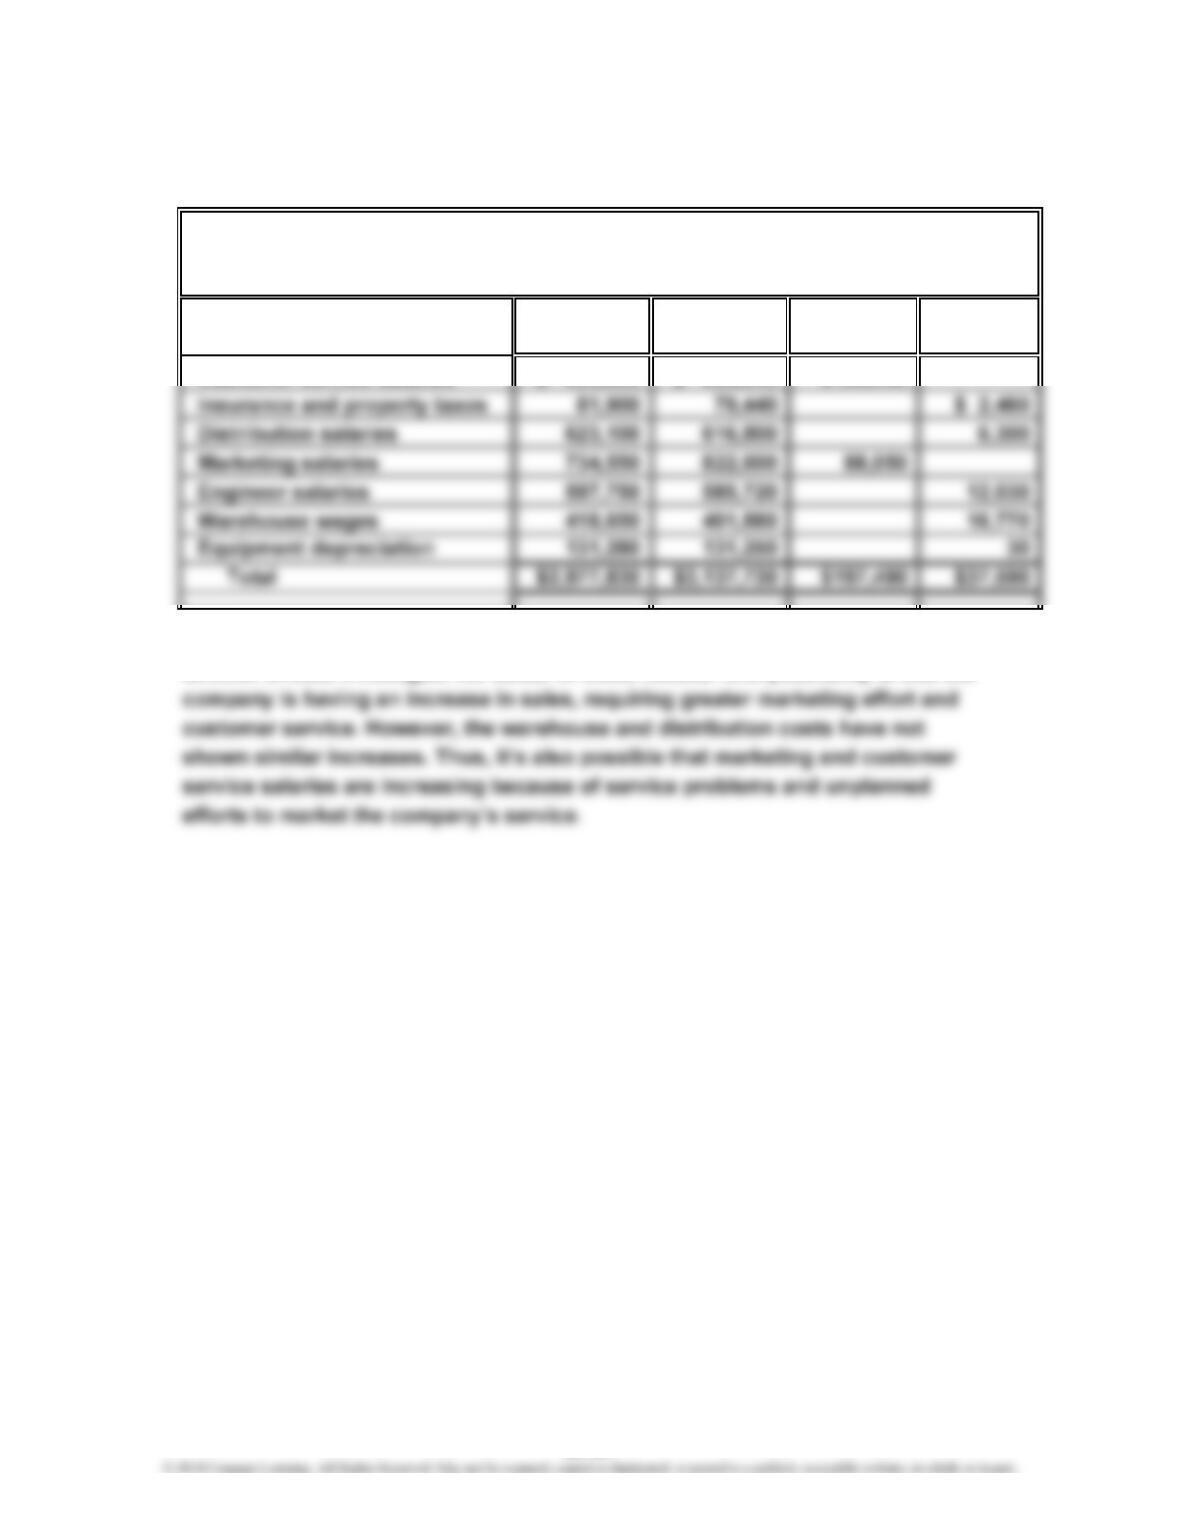
Customer service salaries $ 390,600 $ 500,040 $109,440
2. The customer service and marketing salaries are significantly over budget. The
director should investigate the cause of these results. One possibility is that the
PROBLEMS
E-NET COMPANY
Budget Performance Report—Director, Consumer Products Division
For the Month Ended January 31, 2014
24-21
CHAPTER 24 Performance Evaluation for Decentralized Operations
Prob. 24–2A
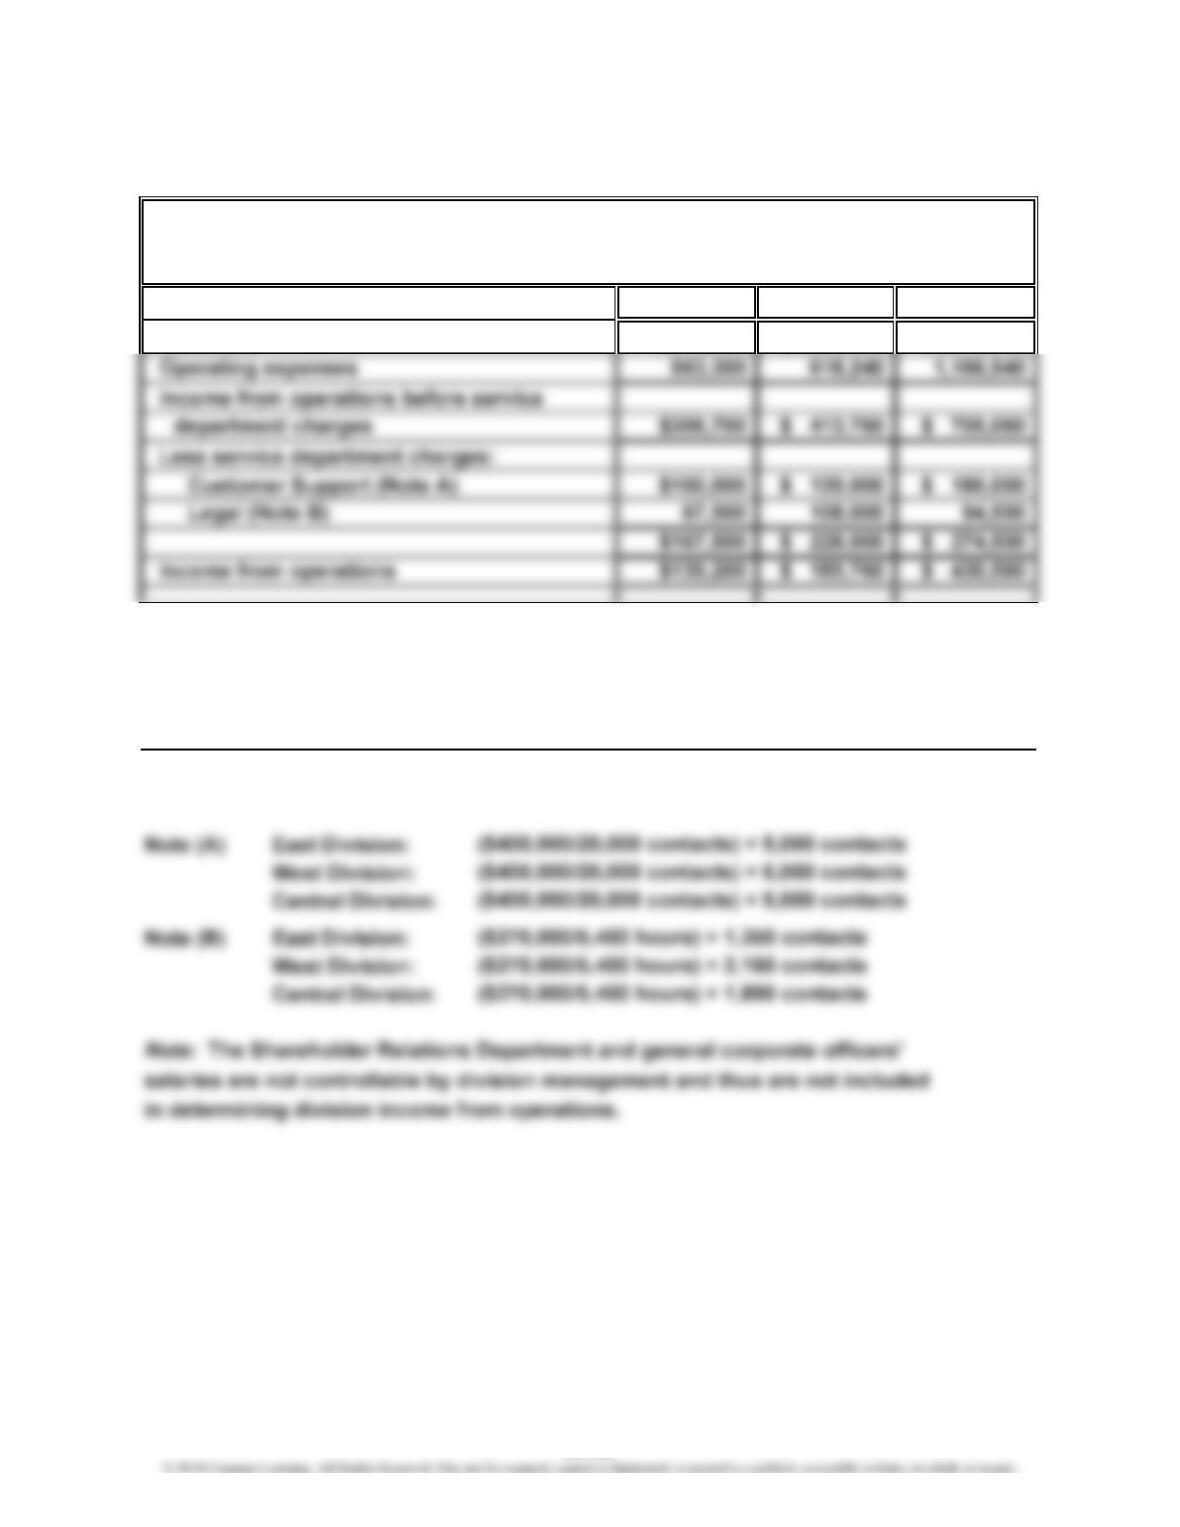
1.
West Central
Revenues $1,032,000 $1,872,000
Supporting Schedule:
Service department charge rates for the two service departments, Customer
Support and Legal, are determined as follows:
West Central Total
Number of customer contacts…
…
6,000 9,000 20,000
Number of hours billed…………
…
2,160 1,890 5,400
5,000
1,350
TRAXONIA RAILROAD INC.
Divisional Income Statements
For the Quarter Ended December 31, 2014
East
East
$870,000
24-22
CHAPTER 24 Performance Evaluation for Decentralized Operations
Prob. 24–2A (Concluded)
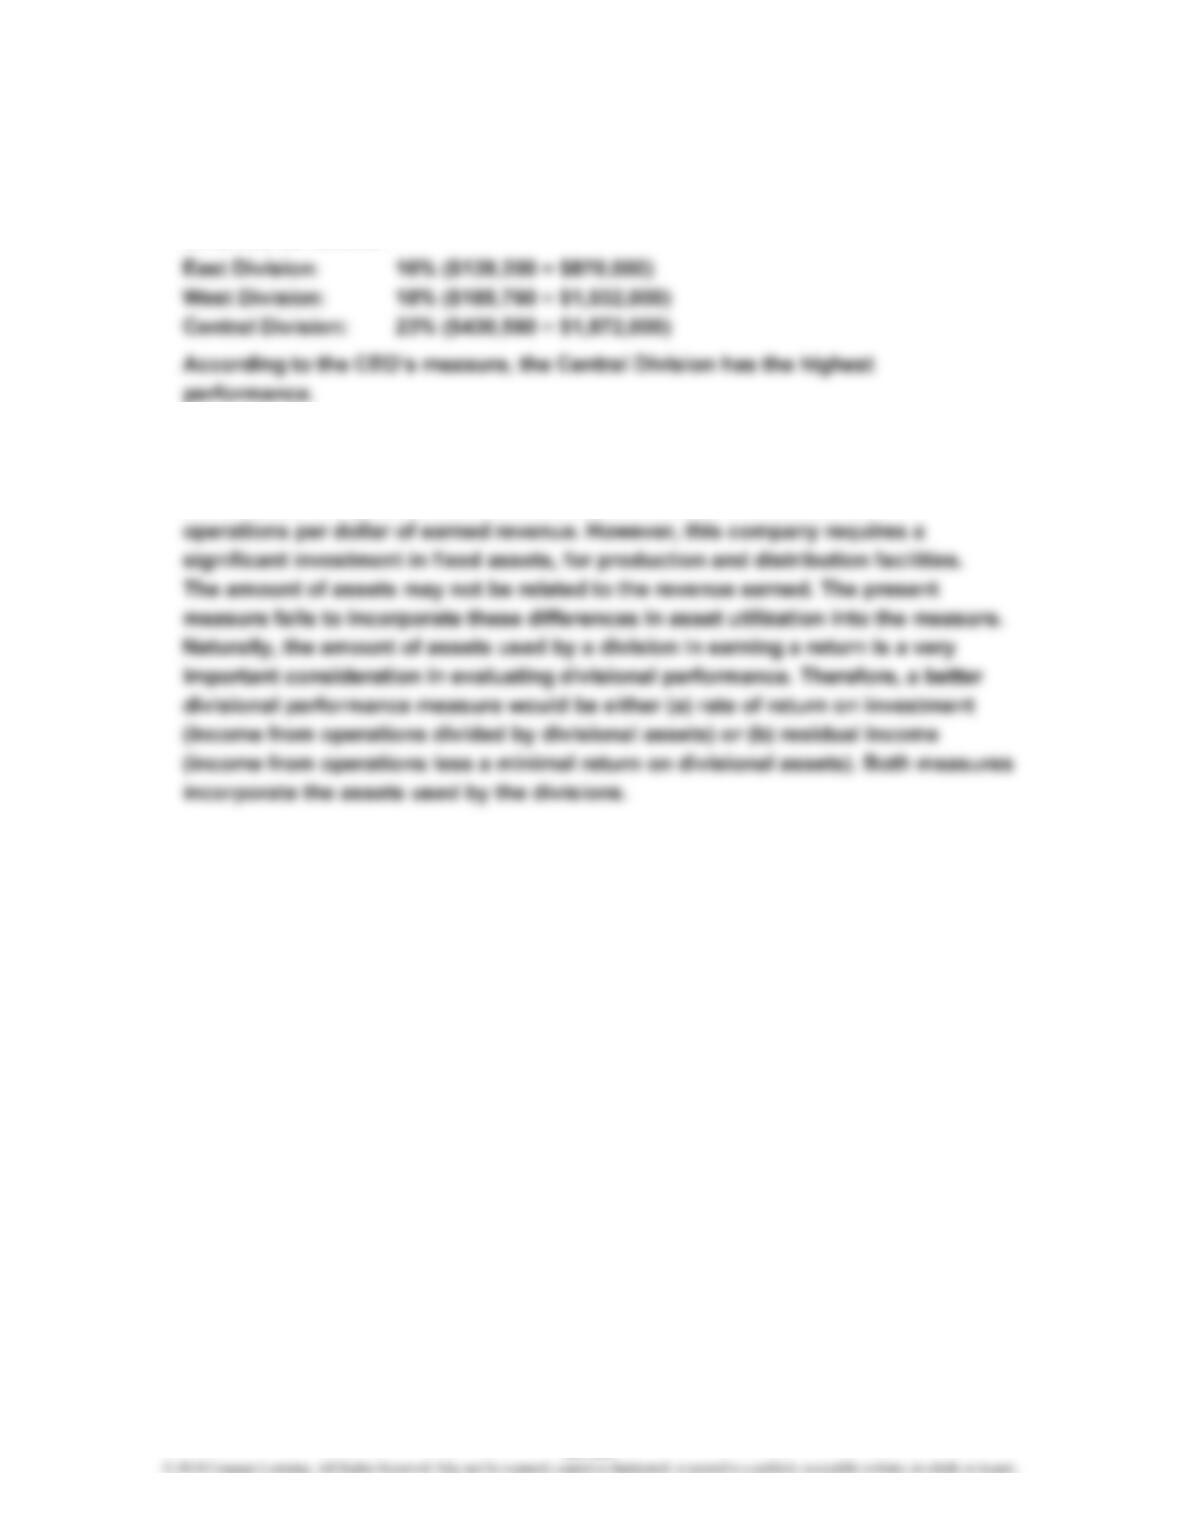
2. The CEO evaluates the three divisions using income from operations as a
percent of revenues (profit margin). This measure is calculated for the three
divisions as follows:
3. To: CEO
The method used to evaluate the performance of the divisions should be
reevaluated. The present method identifies the amount of income from
24-23
CHAPTER 24 Performance Evaluation for Decentralized Operations
Prob. 24–3A
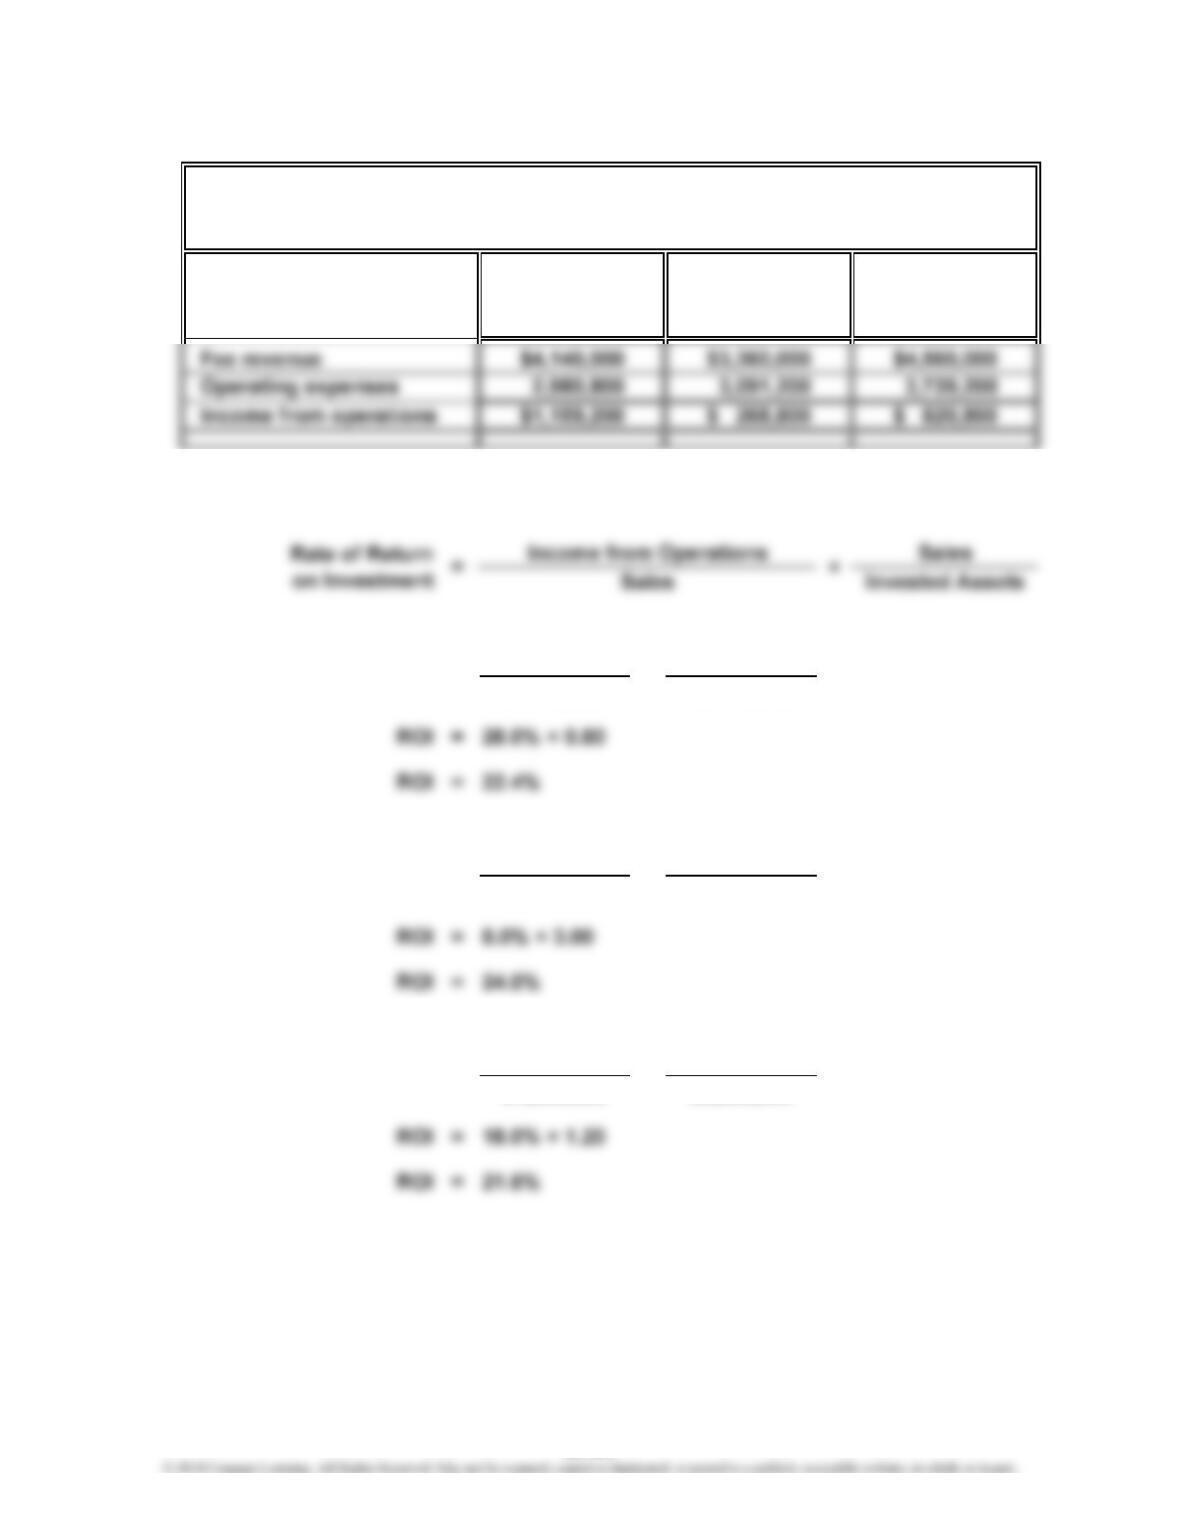
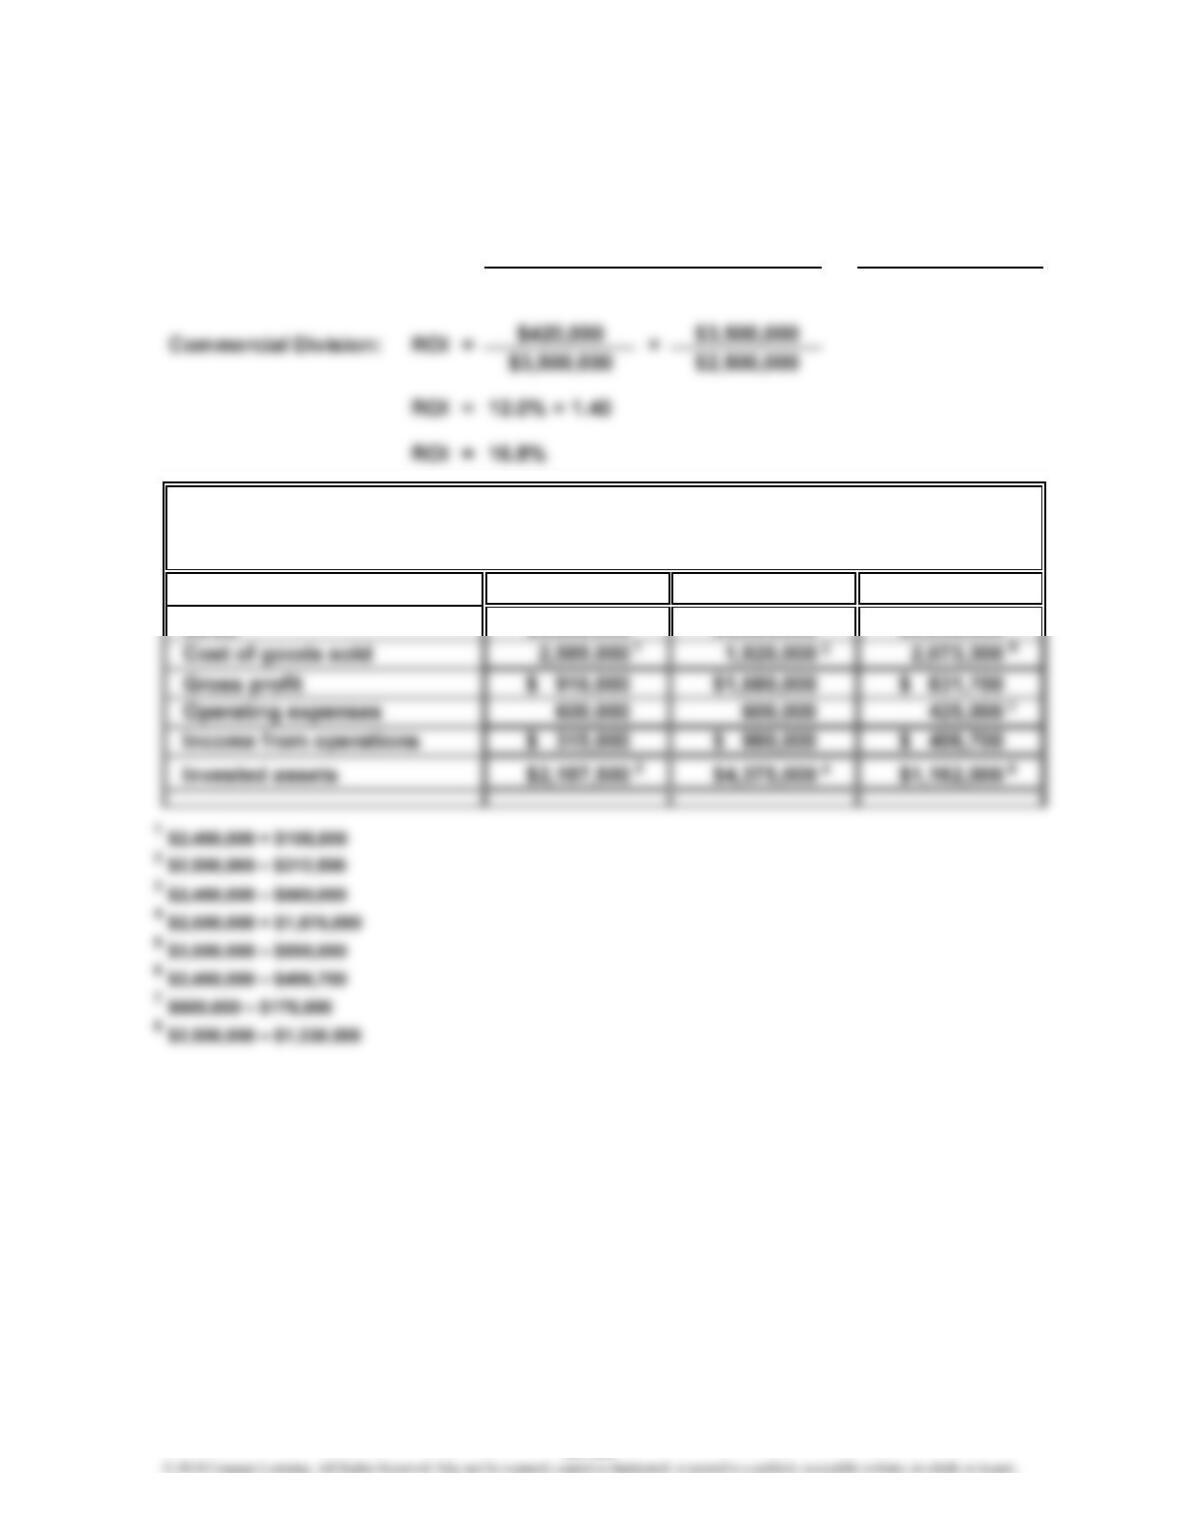
1.
Mutual Fund Division:
$1,159,200 $4,140,000
$4,140,000 $5,175,000
Electronic Brokerage Division:
$268,800 $3,360,000
$3,360,000 $1,120,000
Investment Banking Division:
$820,800 $4,560,000
$4,560,000 $3,800,000
ROI = ×
ROI
= ×
Investment
Banking
Division
Fund
Electronic
Brokerage
E.F. LYNCH COMPANY
Divisional Income Statements
For the Year Ended June 30, 2014
Mutual
Division Division
2. Rate of Return
on Investment = Profit Margin × Investment Turnover
ROI = ×
24-24
CHAPTER 24 Performance Evaluation for Decentralized Operations
Prob. 24–3A (Concluded)
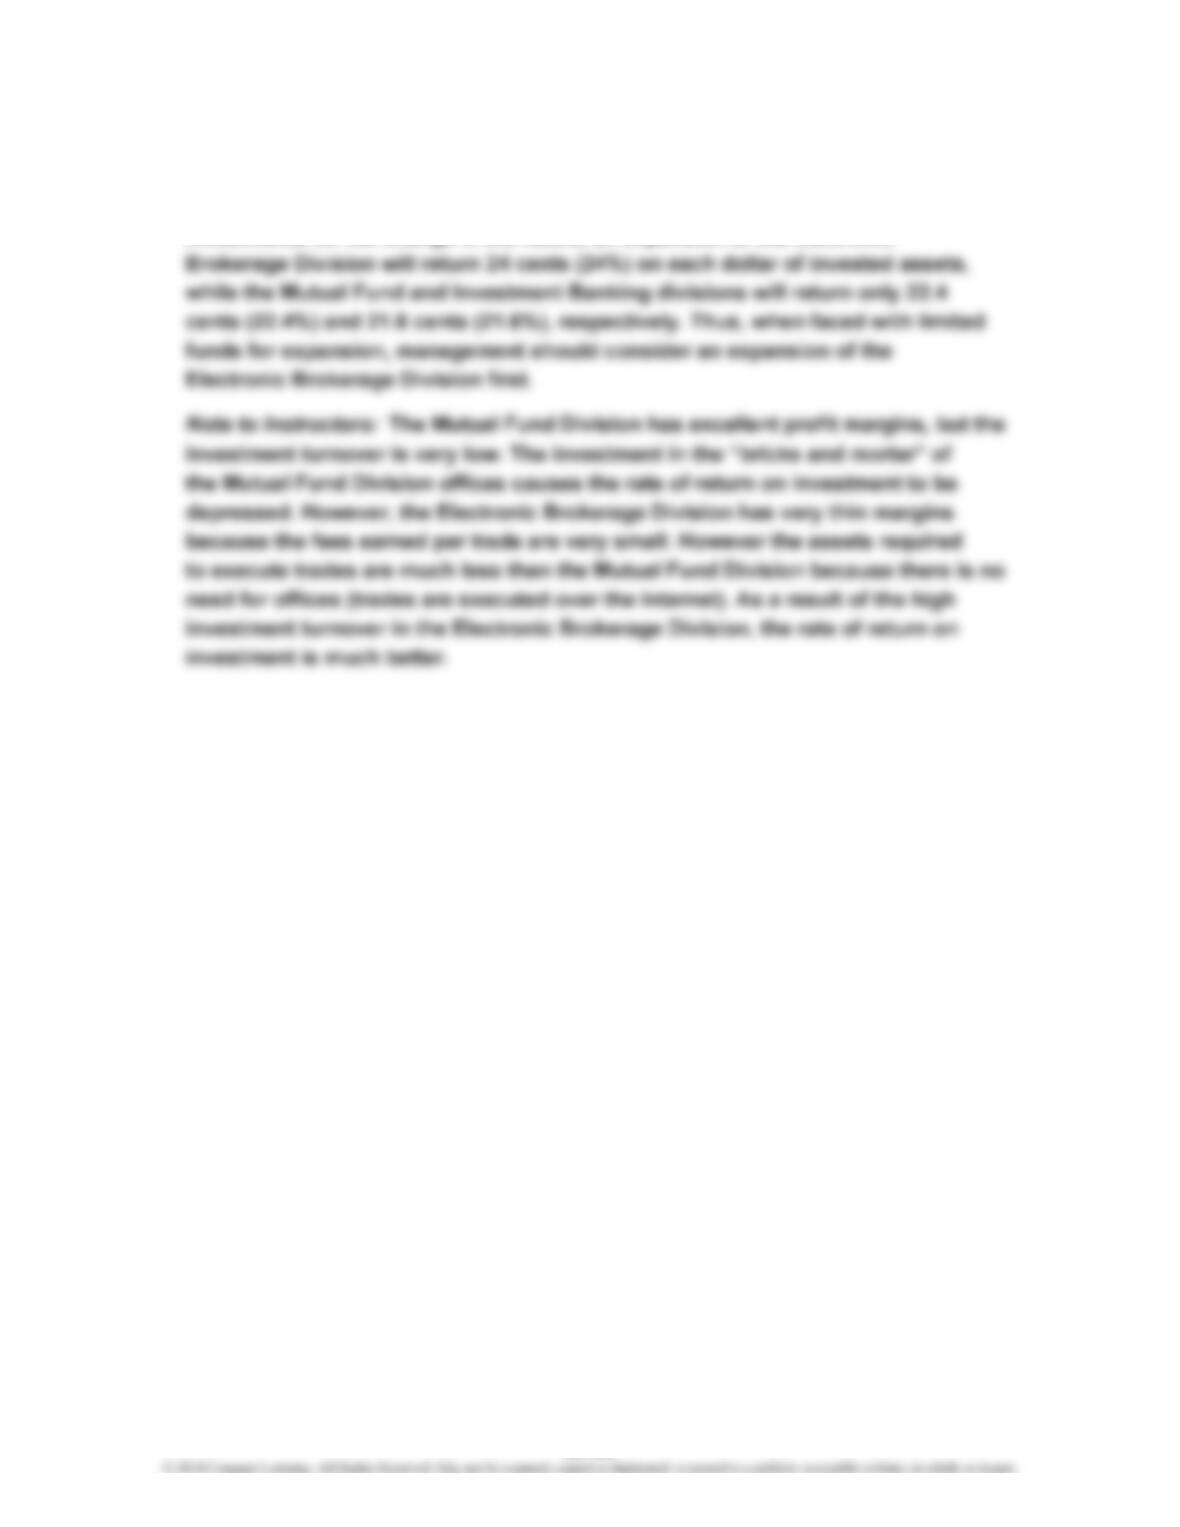
3. Per dollar of invested assets, the Electronic Brokerage Division is the most
profitable of the three divisions. Assuming that the rates of return on
investments do not change in the future, an expansion of the Electronic
24-25
CHAPTER 24 Performance Evaluation for Decentralized Operations
Prob. 24–4A
2.
Sales
1. =
$3,500,000
Proposal 1
For the Year Ended December 31, 2014
Proposal 2
Sales
Income from Operations
×
Profit Margin × Investment Turnover
MAXELL MANUFACTURING INC.—COMMERCIAL DIVISION
Estimated Income Statements
Rate of Return
on Investment
Invested Assets
Rate of Return
on Investment
Sales
=
$2,905,000
Proposal 3
$3,500,000
5
24-26
CHAPTER 24 Performance Evaluation for Decentralized Operations
Prob. 24–4A (Concluded)
$315,000 $3,500,000
$3,500,000 $2,187,500
$980,000 $3,500,000
$3,500,000 $4,375,000
$406,700 $2,905,000
$2,905,000 $1,162,000
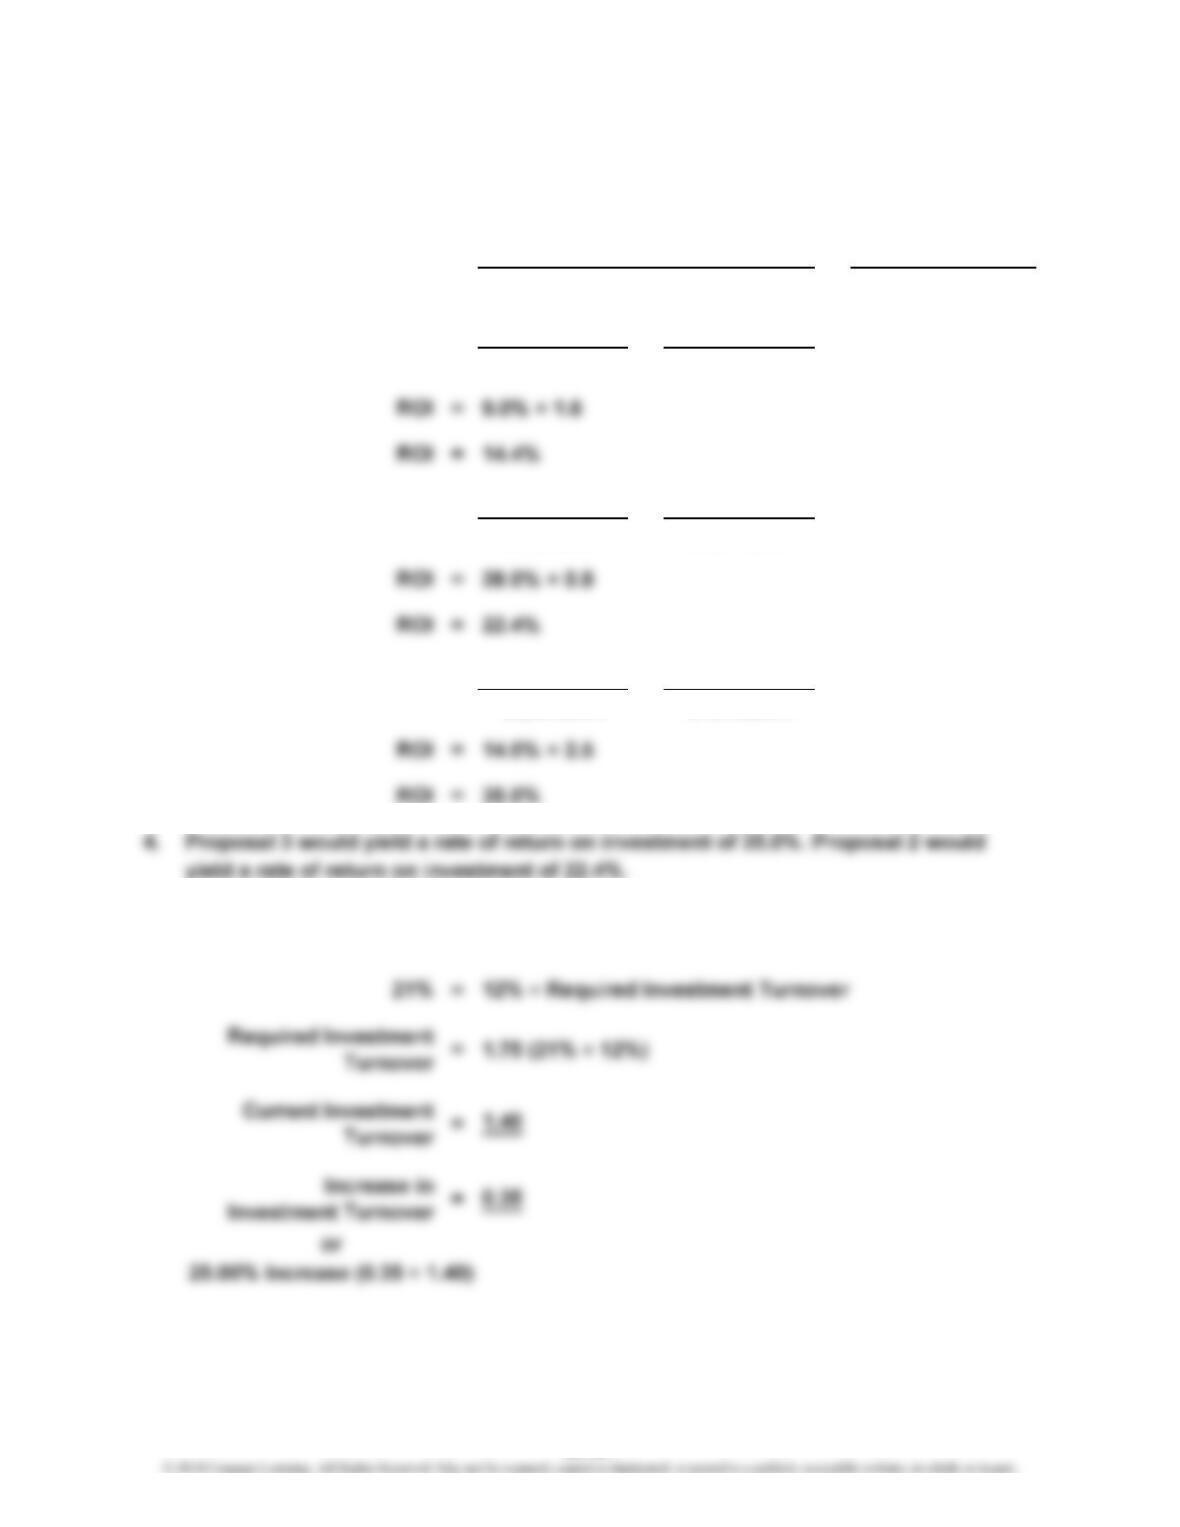
5.
Proposal 1:
Proposal 2:
Proposal 3:
ROI =
ROI =
Rate of Return
on Investment
Rate of Return
on Investment
Rate of Return
on Investment
= Profit Margin × Investment Turnover
Invested Assets
×
×
×
= ×
Sales
Income from Operations
3. = Profit Margin × Investment Turnover
ROI =
Sales
24-27
CHAPTER 24 Performance Evaluation for Decentralized Operations
Prob. 24–5A
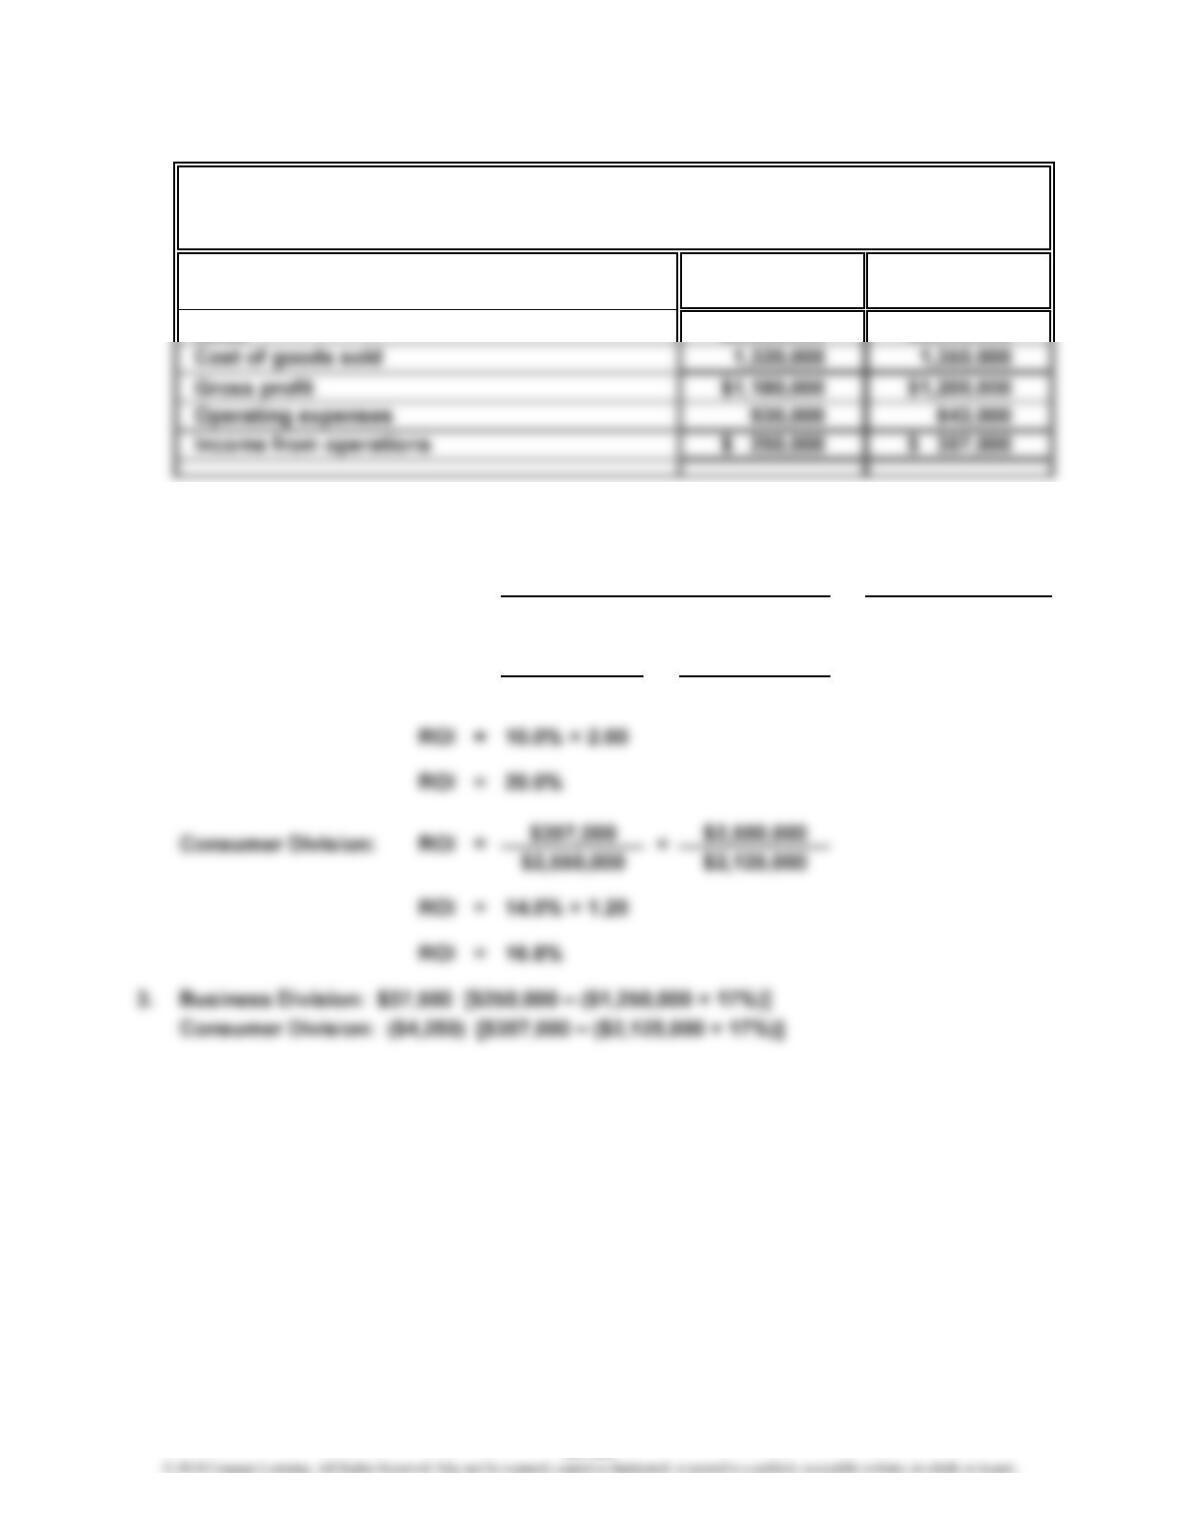
1.
Sales
$250,000 $2,500,000
$2,500,000 $1,250,000
PAVONE COMPANY
Divisional Income Statements
For the Year Ended December 31, 2014
$2,550,000
=
2. = Profit Margin × Investment Turnover
Rate of Return
on Investment
Business Division:
×
$2,500,000
Rate of Return
on Investment
ROI ×
Sales
Invested Assets
=
Sales
Income from Operations
Business Consumer
Division Division
24-28
CHAPTER 24 Performance Evaluation for Decentralized Operations
Prob. 24–5A (Concluded)
4. On the basis of income from operations, the Consumer Division generated
$107,000 ($357,000 – $250,000) more income from operations than did the
24-29
CHAPTER 24 Performance Evaluation for Decentralized Operations
Prob. 24–6A
1. No. When unused capacity exists in the supplying division (the Consumer
2. The Consumer Division’s income from operations would increase by $31,680:
Increase in Consumer Variable
(Supplying) Division’s Transfer Cost Units
The Commercial Division’s income from operations would increase by $100,800:
Increase in Commercial
(Purchasing) Division’s Market Transfer Units
By purchasing from the Consumer Division, the Commercial Division saves $35
per unit on its purchases.
Garcon Inc.’s total income from operations would increase by $132,480:
Variable
Increase in Garcon Market Cost Units
24-30
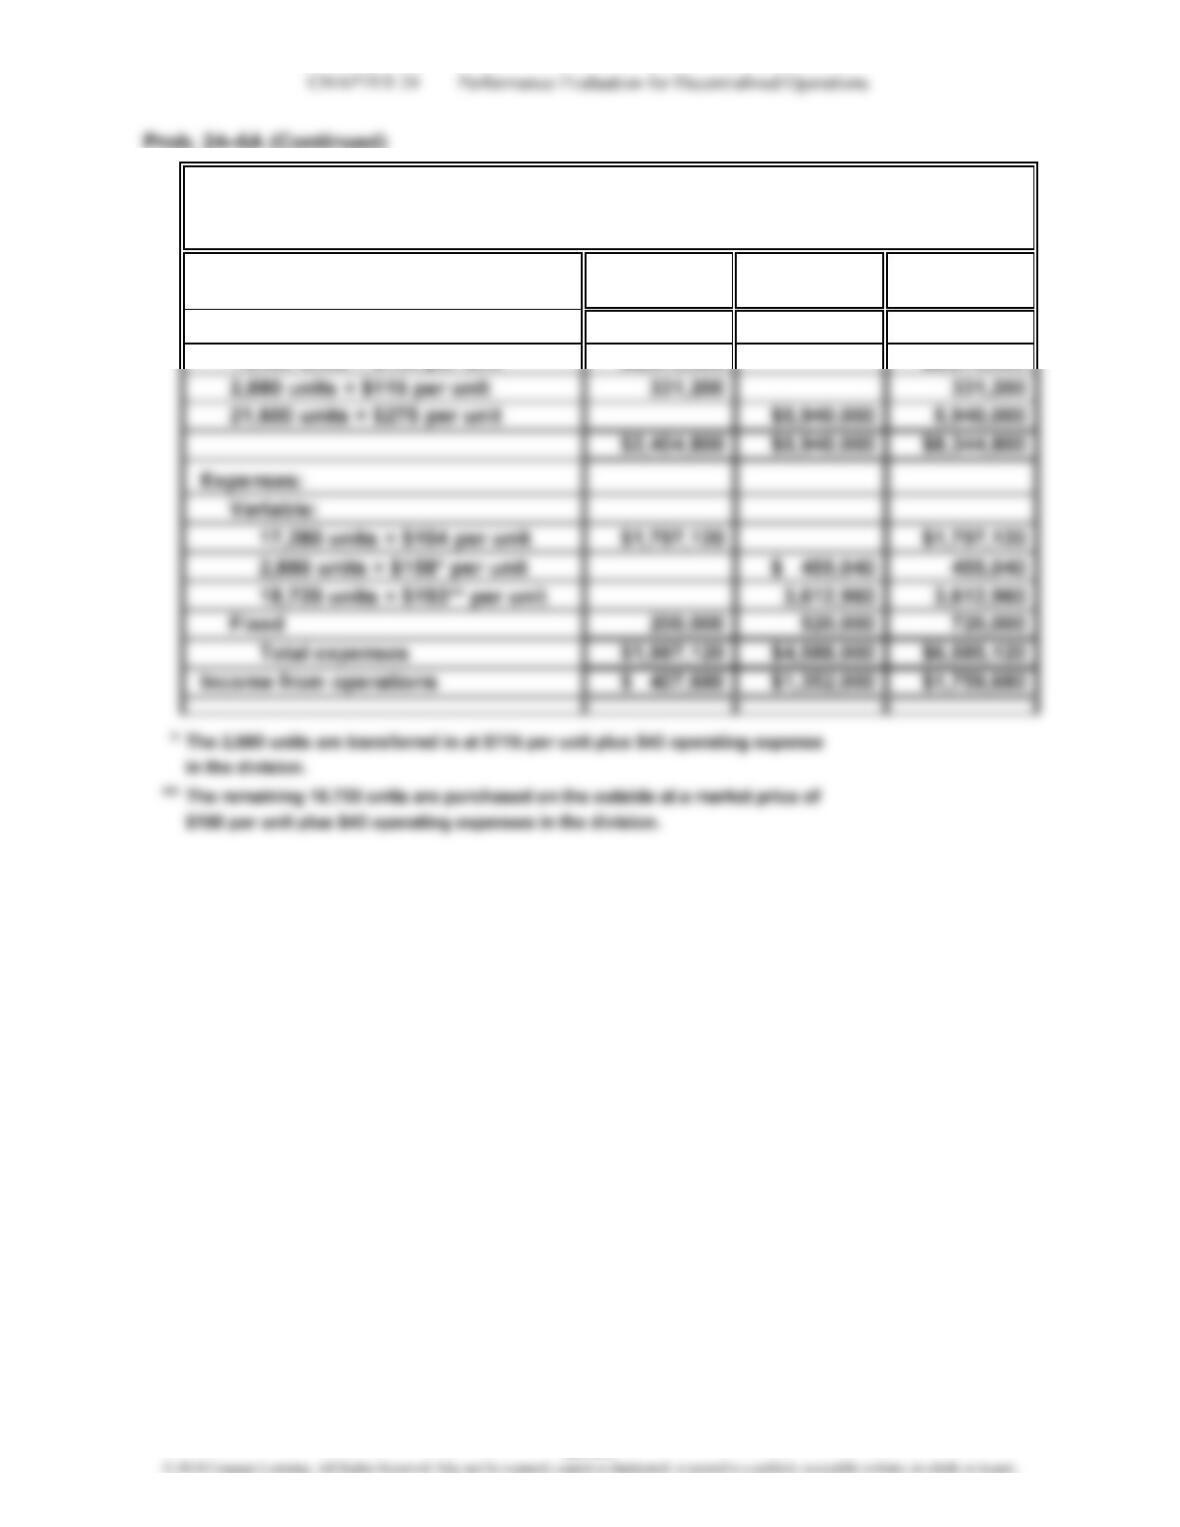
3.
Consumer Commercial
Division Division Total
Sales:
14,400 units × $144 per unit $2,073,600 $2,073,600
GARCON INC.
Divisional Income Statements
For the Year Ended December 31, 2014
24-31
CHAPTER 24 Performance Evaluation for Decentralized Operations
Prob. 24–6A (Concluded)
4. The Consumer Division’s income from operations would increase by $63,360:
Increase in Consumer Variable
(Supplying) Division’s Transfer Cost Units
Income from Operations = Price – per Unit × Transferred
The Commercial Division’s income from operations would increase by $69,120:
Increase in Commercial
(Purchasing) Division’s Market Transfer Units
Income from Operations = Price – Price × Transferred
Garcon Inc.’s total income from operations would increase by the same amount
as in part (2), $132,480:
Variable
Increase in Garcon Market Cost Units
Income from Operations = Price – per Unit × Transferred
5. a. Any transfer price greater than the Consumer Division’s variable expenses
per unit of $104 but less than the market price of $150 would be acceptable.
24-32
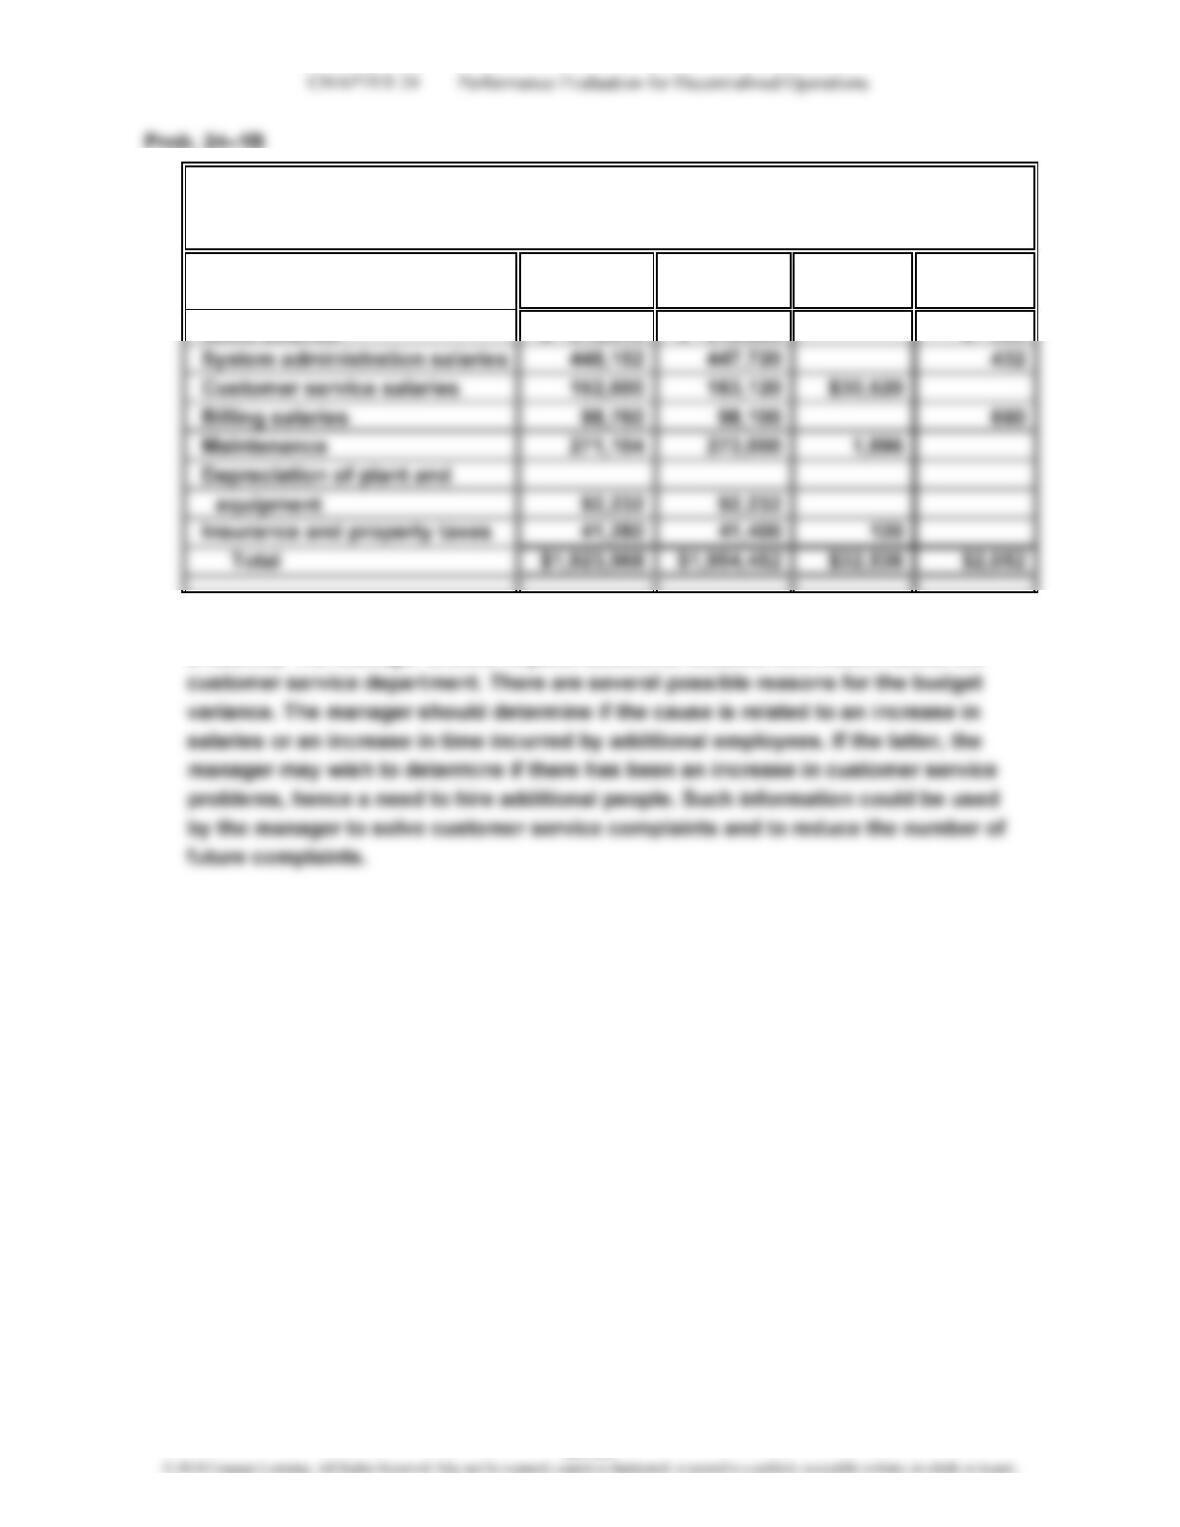
1.
Over Under
Budget Actual Budget Budget
Sales salaries $ 819,840 $ 818,880 $ 960
2. The customer service salaries exceed the budget by 20% of budget ($30,520 ÷
$152,600). The manager should request additional detailed information about the
ADELSON INC.
Budget Performance Report—Supervisor, Eastern District
For the Month Ended December 31, 2014
24-33
CHAPTER 24 Performance Evaluation for Decentralized Operations
Prob. 24–2B
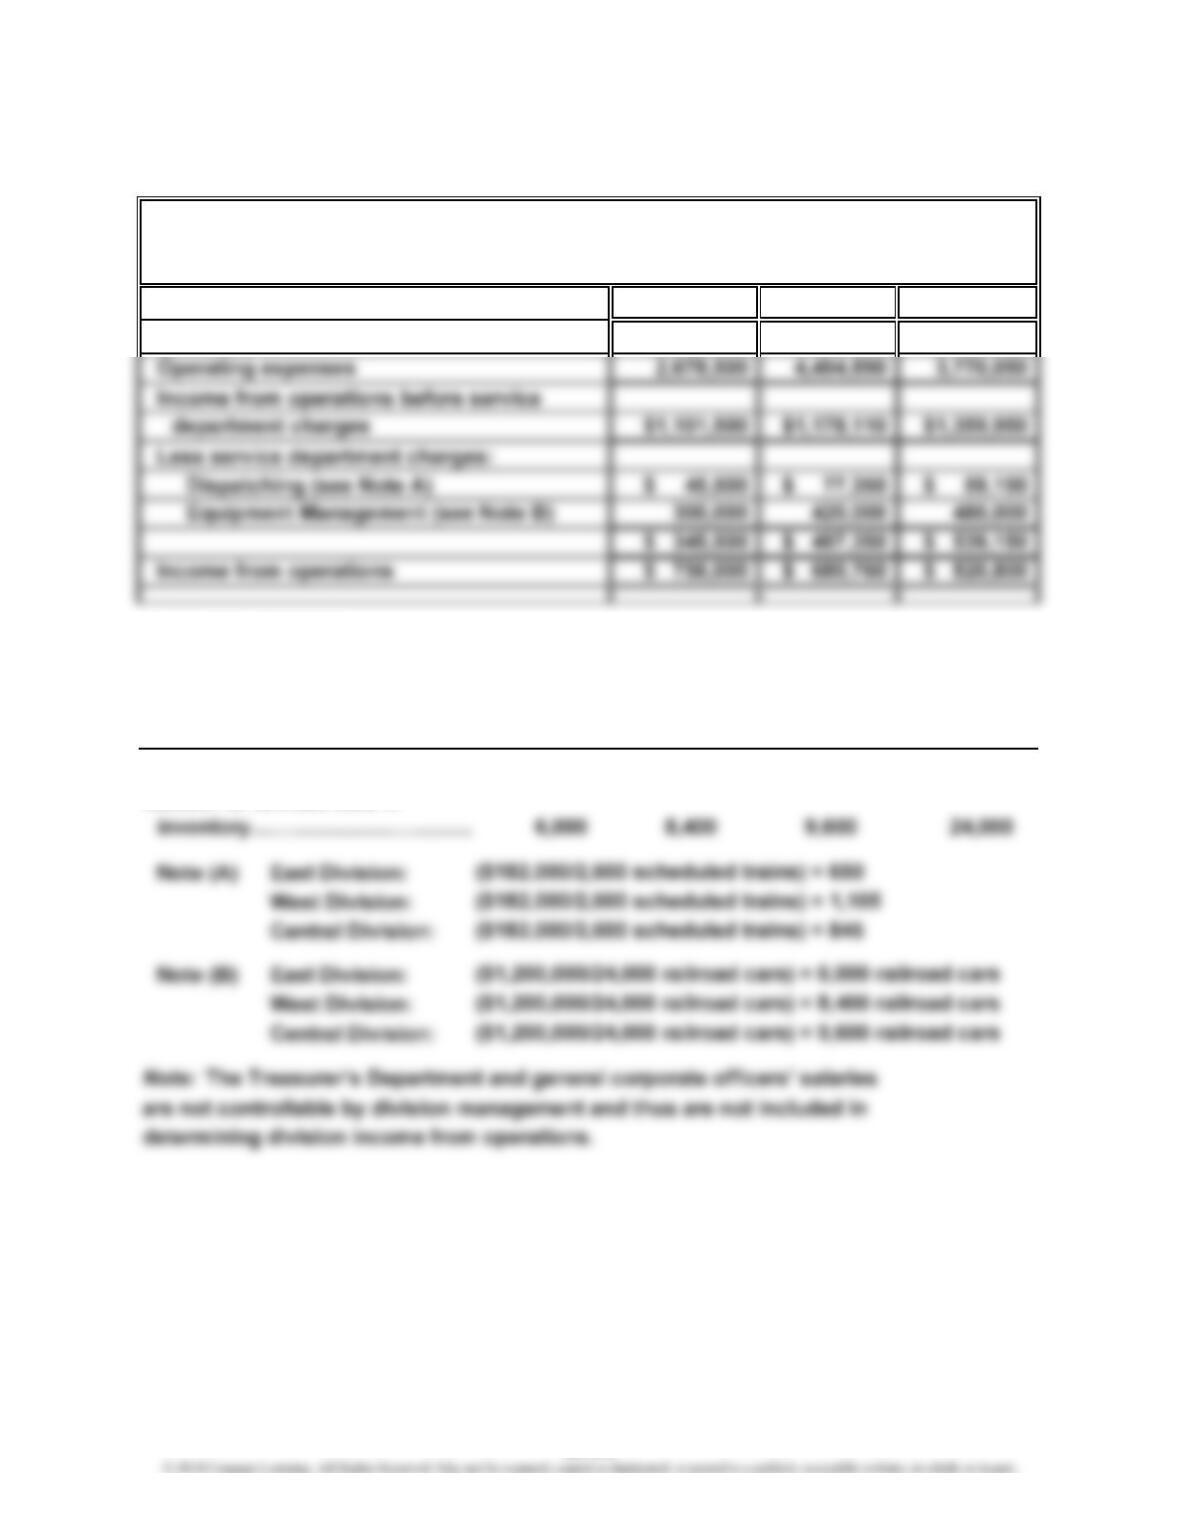
1.
South West
Revenues $5,673,000 $5,130,000
Supporting Schedule:
Service department charge rates for the two service departments, Dispatching and
Equipment Management, are determined as follows:
South West Total
Number of scheduled trains……
…
1,105 845 2,600
Number of railroad cars in
North
650
THOMAS RAILROAD COMPANY
Divisional Income Statements
For the Quarter Ended December 31, 2014
North
$3,780,000
24-34
CHAPTER 24 Performance Evaluation for Decentralized Operations
Prob. 24–2B (Concluded)
2. The CEO evaluates the three regions using income from operations as a percent
of revenues. This measure is calculated for the three regions as follows:
3. To: CEO
The method used to evaluate the performance of the regions should be
reevaluated. The present method identifies the amount of income from operations
per dollar of earned revenue. However, a railroad company requires a significant
24-35