CHAPTER 23 Evaluating Variances from Standard Costs
Comp. Prob. 5 (Continued)
8.
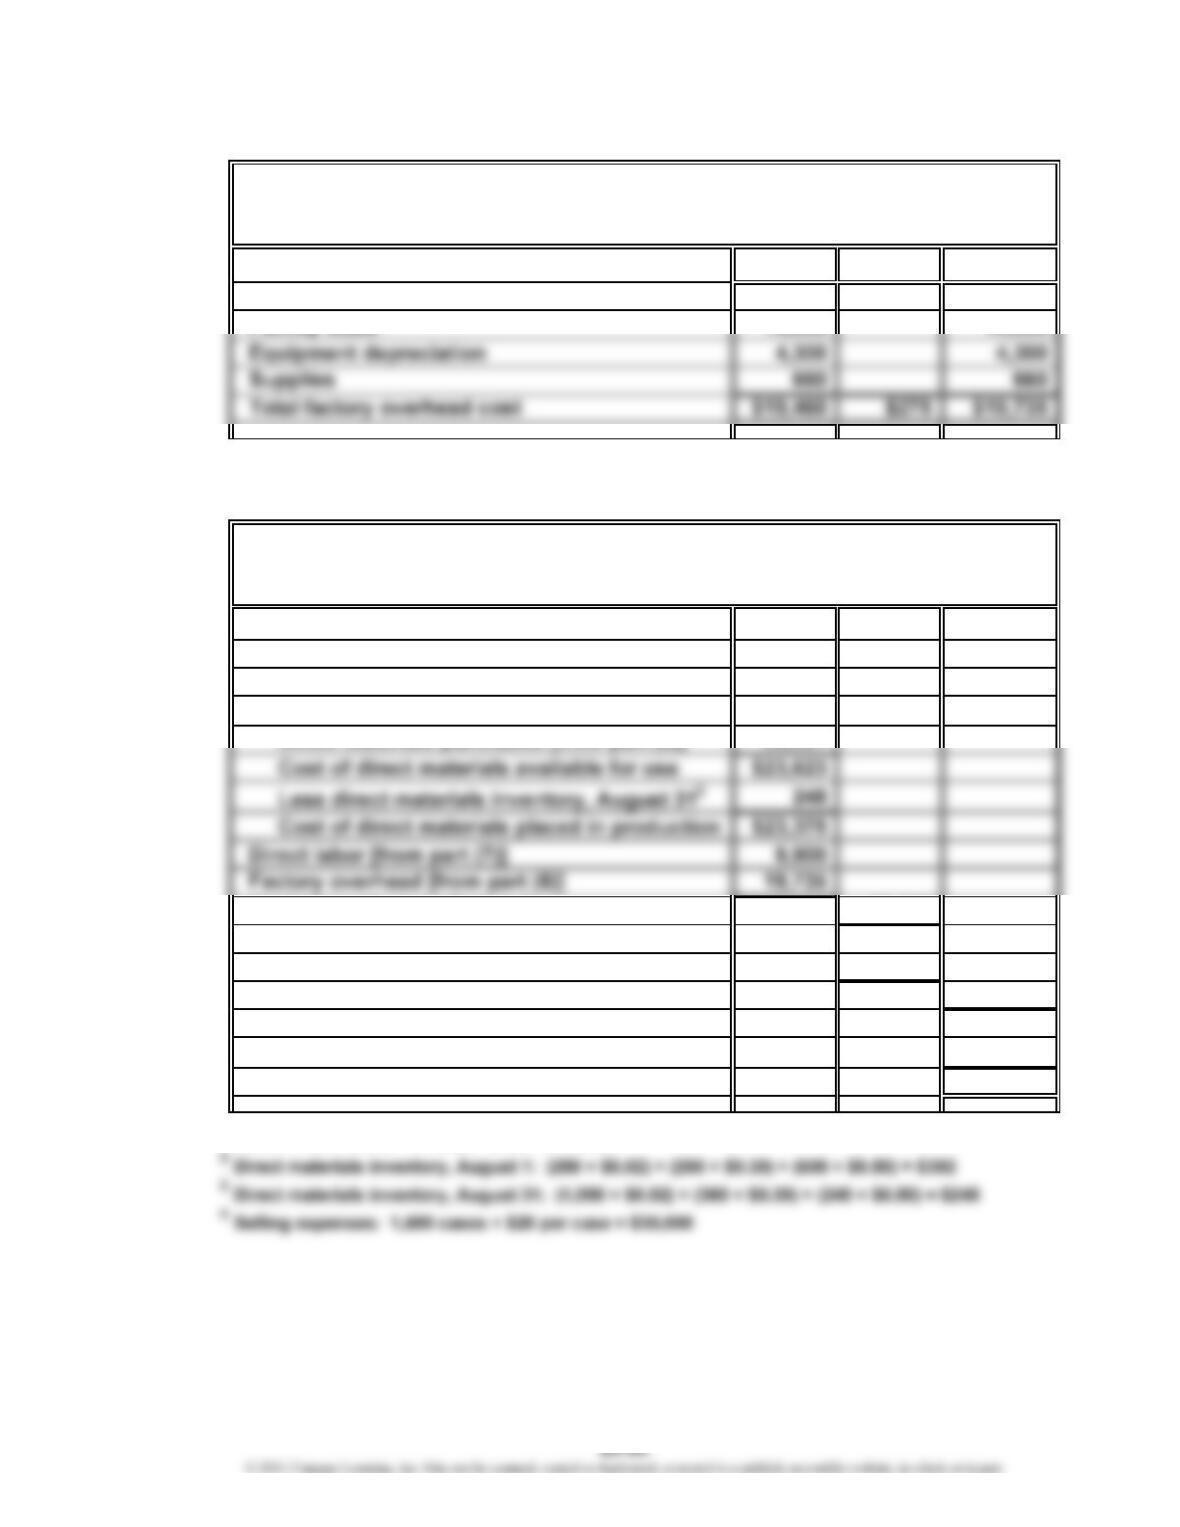
Fixed1Variable2Total
Utilities $ 500 $275 $ 775
1Fixed costs [from part (3)]
2Variable utility cost: $0.20 × 1,375 cases = $275
9.
Sales1$150,000
Finished goods inventory, August 1 $12,000
Direct materials:
Direct materials inventory, August 12$ 392
Cost of goods manufactured 53,010
Cost of finished goods available for sale $65,010
Less finished goods inventory, August 31 7,000
Cost of goods sold 58,010
Gross profit $ 91,990
Selling expenses430,000
Income from operations $ 61,990
1Sales: 1,500 cases × $100 per case = $150,000
For the Month Ended August 31
Genuine Spice Inc.
Genuine Spice Inc.
Factory Overhead Cost Budget
For the Month Ended August 31
Budgeted Income Statement
CHAPTER 23 Evaluating Variances from Standard Costs
Comp. Prob. 5 (Continued)
Part C
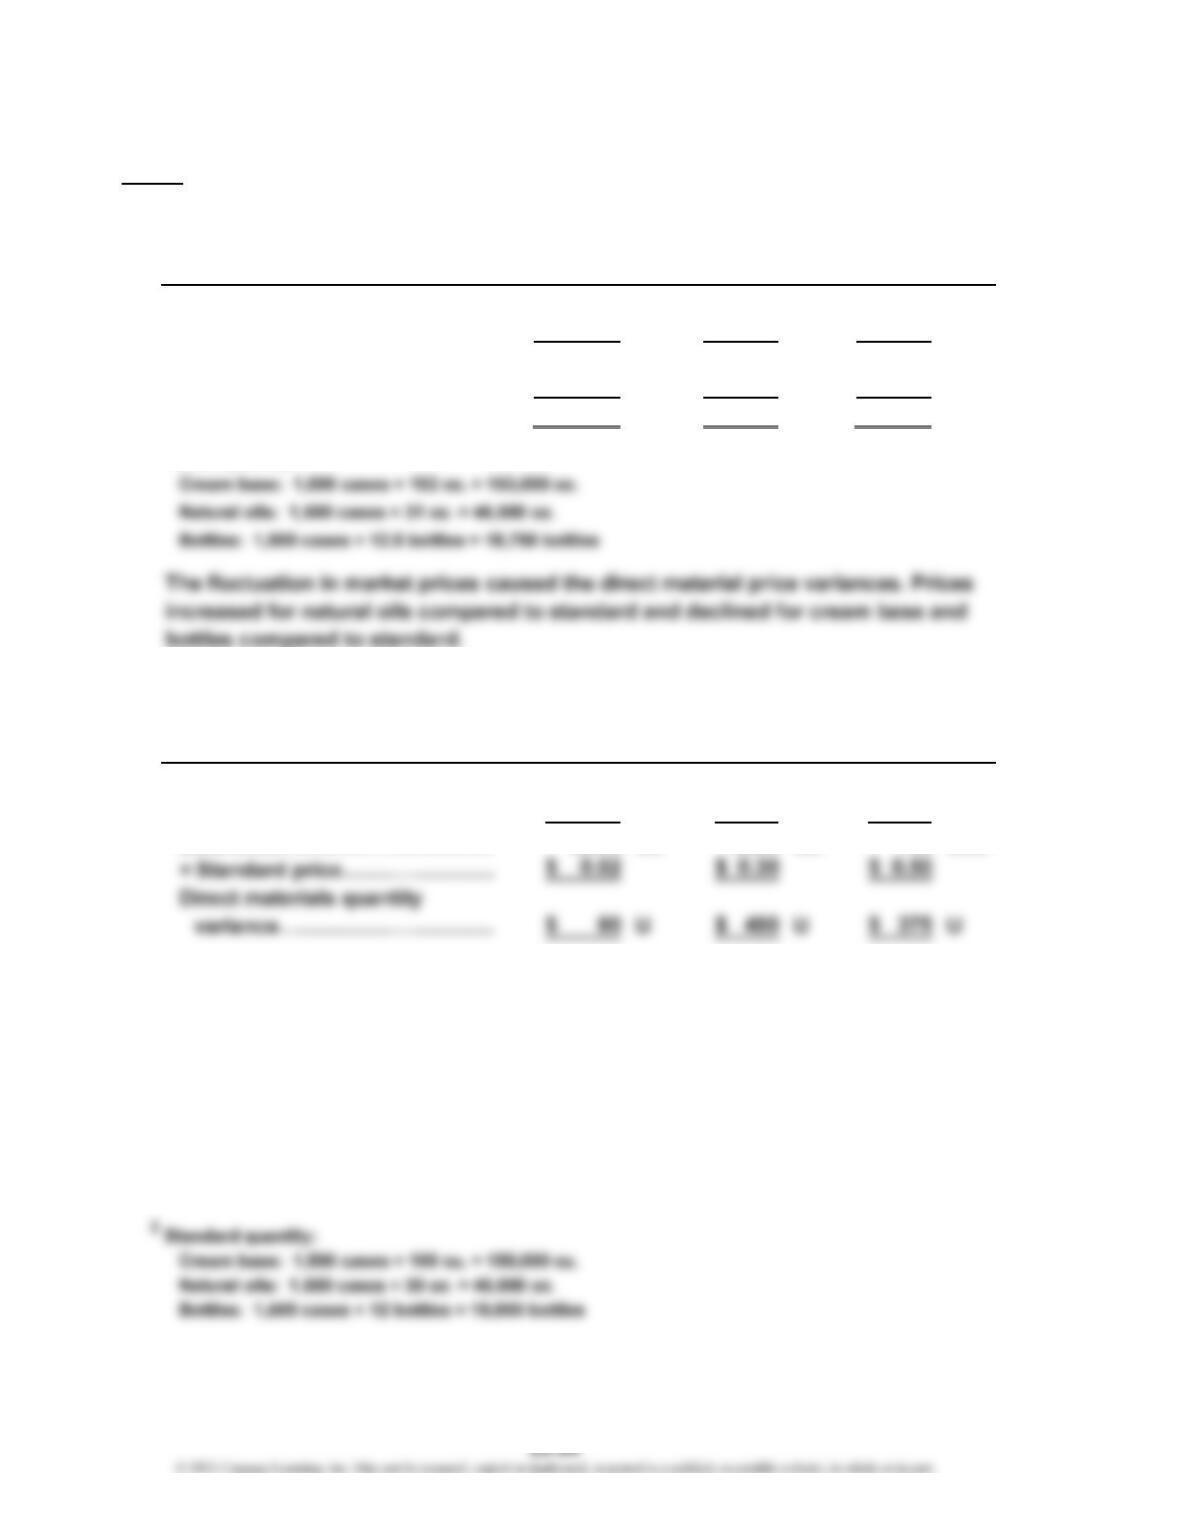
10. Direct Materials Price Variance:
Actual price………………………
…
$ 0.016 $ 0.32 $ 0.42
Standard price……………………
…
0.020 0.30 0.50
Difference…………………………
…
$ (0.004) $ 0.02 $ (0.08)
× Actual quantity (units)*………
…
153,000 oz. 46,500 oz. 18,750 btls.
Direct materials price variance
…
$ (612) F$ 930 U$ (1,500) F
*Actual quantity:
Direct Materials Quantity Variance:
Actual quantity1…………………
…
153,000 oz. 46,500 oz. 18,750 btls.
Standard
q
uantit
y
2………………
…
150,000 45,000 18,000
Difference…………………………
…
3,000 oz. 1,500 oz. 750 btls.
Note: All the direct materials quantity variances were unfavorable, indicating
some material losses, scrap, and quality rejections. All the quantity variances
were unfavorable because the standards were set at ideal quantity amounts.
Thus, only unfavorable variances were possible. The standard quantities were
ideal standards for 12 8-ounce bottles per case (96 oz. total), as shown below.
1Actual quantity:
Cream base: 1,500 cases × 102 oz. = 153,000 oz.
Natural oils: 1,500 cases × 31 oz. = 46,500 oz.
Bottles: 1,500 cases × 12.5 bottles = 18,750 bottles
BottlesOilsBase
Cream Natural
Base
Cream Natural
BottlesOils
CHAPTER 23 Evaluating Variances from Standard Costs
Comp. Prob. 5 (Continued)
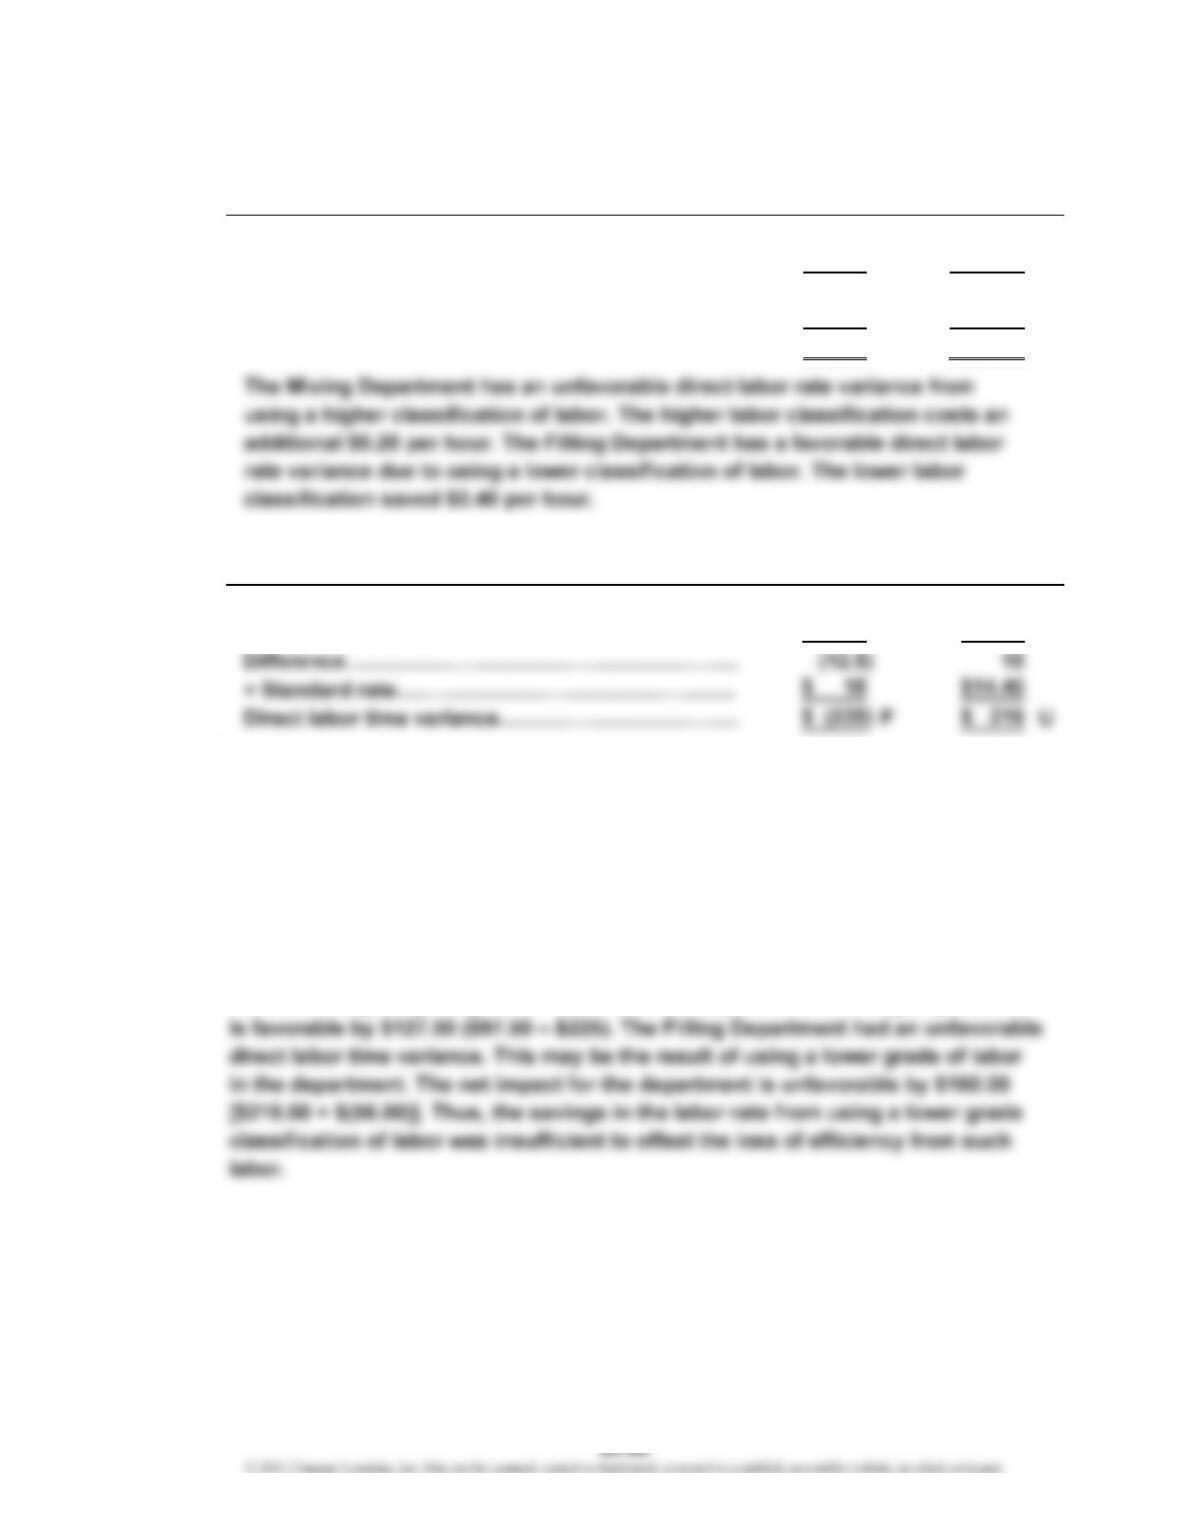
11. Direct Labor Rate Variance:
Actual rate………………………………………………
…
$18.20 $ 14.00
Standard rate……………………………………………
…
18.00 14.40
Difference………………………………………………
…
$ 0.20 $ (0.40)
× Actual time
(
hours
)
1…………………………………
…
487.5 140.00
Direct labor rate variance……………………………
…
$97.50 U$ (56.00) F
Direct Labor Time Variance:
Actual time (hours)1……………………………………
…
487.5 140
Standard time
(
hours
)
2………………………………… 500 125
…
1Actual time:
Mixing: (1,500 units × 19.50 min.) ÷ 60 min. = 487.5 hrs.
Filling: (1,500 units × 5.60 min.) ÷ 60 min. = 140 hrs.
2Standard time:
Mixing: (1,500 units × 20.00 min.) ÷ 60 min. = 500 hrs.
Filling: (1,500 units × 5.00 min.) ÷ 60 min. = 125 hrs.
The Mixing Department is producing at a labor time that is slightly better than
standard, thus producing a favorable direct labor time variance. This may be the
result of using a higher grade of labor. The net impact for the Mixing Department
Filling
DepartmentDepartment
Mixing
Mixing Filling
Department Department
CHAPTER 23 Evaluating Variances from Standard Costs
Comp. Prob. 5 (Continued)
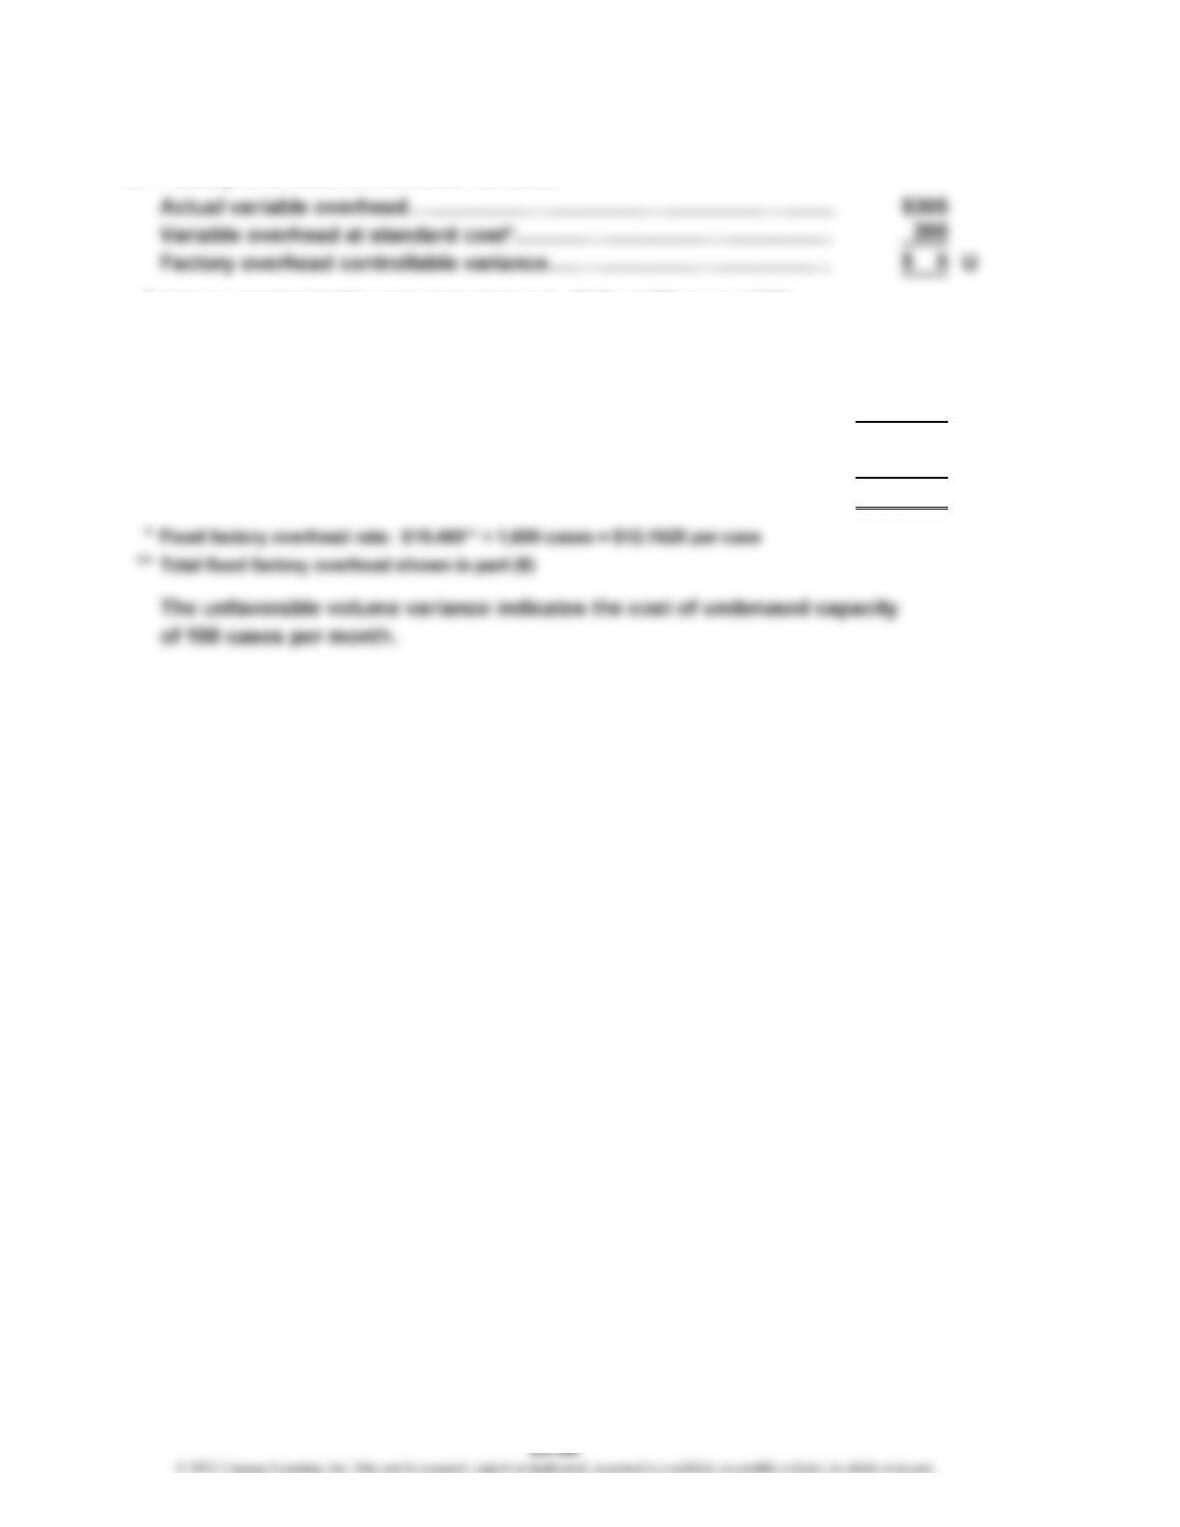
12. Factory Overhead Controllable Variance:
*Variance overhead (utility cost) at standard cost: $0.20 × 1,500 cases = $300
13. Factory Overhead Volume Variance:
Normal volume (cases)………………………………………………………
…
1,600
Actual volume (cases)………………………………………………………
…
1,500
Difference………………………………………………………………………
…
100
× Fixed factory overhead rate*………………………………………………
…
$ 12.1625
$1,216.25 U
CHAPTER 23 Evaluating Variances from Standard Costs
Comp. Prob. 5 (Concluded)
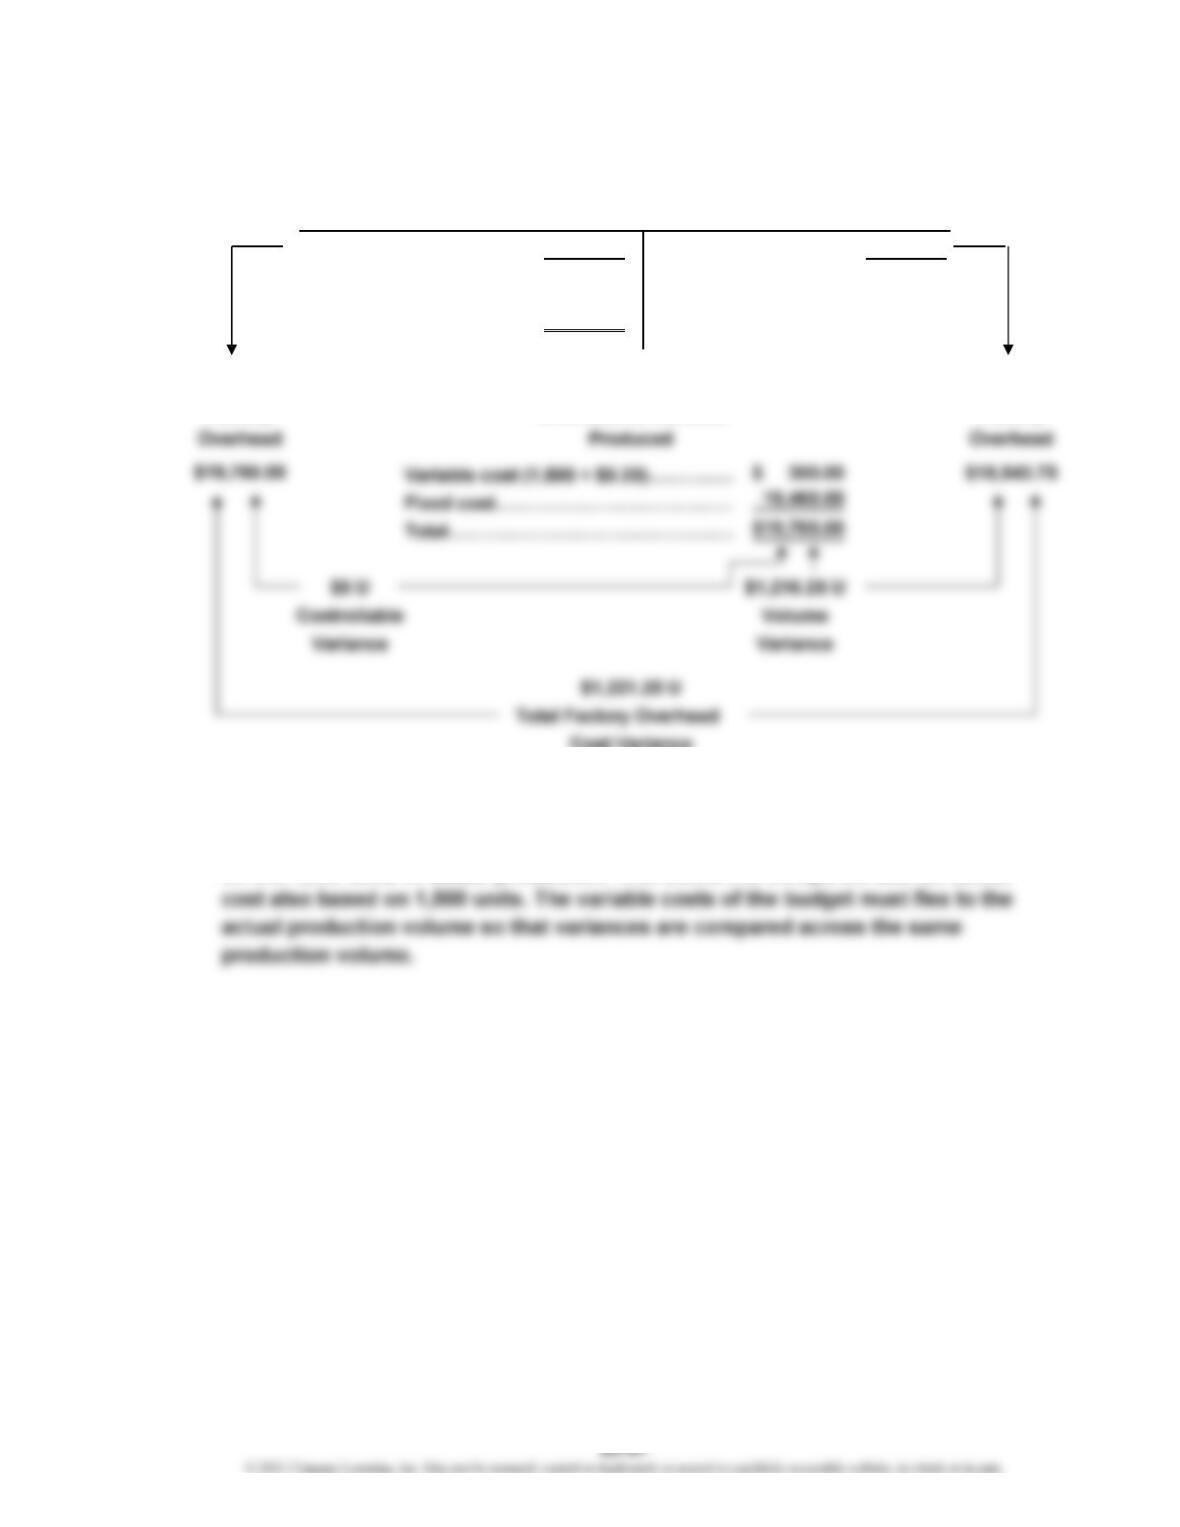
Actual costs 19,765.00 Applied costs 18,543.75
($19,460 + $305) [1,500 × ($12.1625 + $0.20)]
Balance (underapplied) 1,221.25
Applied
Factory
14. The production volume of 1,375 cases determined in part (5) was planned at the
beginning of August. The variances compare the actual cost and the standard
cost of actual production for the month. Thus, the standard cost must be based
on the 1,500 units of actual production. This amount is compared with an actual
Overhead for Amount
Alternative Computation of Overhead Variances
Factory Overhead
Budgeted FactoryActual
Factory
Cost Variance
CHAPTER 23 Evaluating Variances from Standard Costs
CP 23-1
The use of ideal standards is a legitimate concern for Henry. It is likely that such
standards are too tight and do not include the necessary fatigue factors that are
likely in this type of operation. It seems as though Henry is arguing for practical
standards that can be attained if the operation is running well. Maybe some standard
in between is warranted, but that is not the issue. The issue is Dash’s method of
CASES & PROJECTS
CHAPTER 23 Evaluating Variances from Standard Costs
CP 23-2
Use this activity to compare performance measures from different groups and their
selected cities.
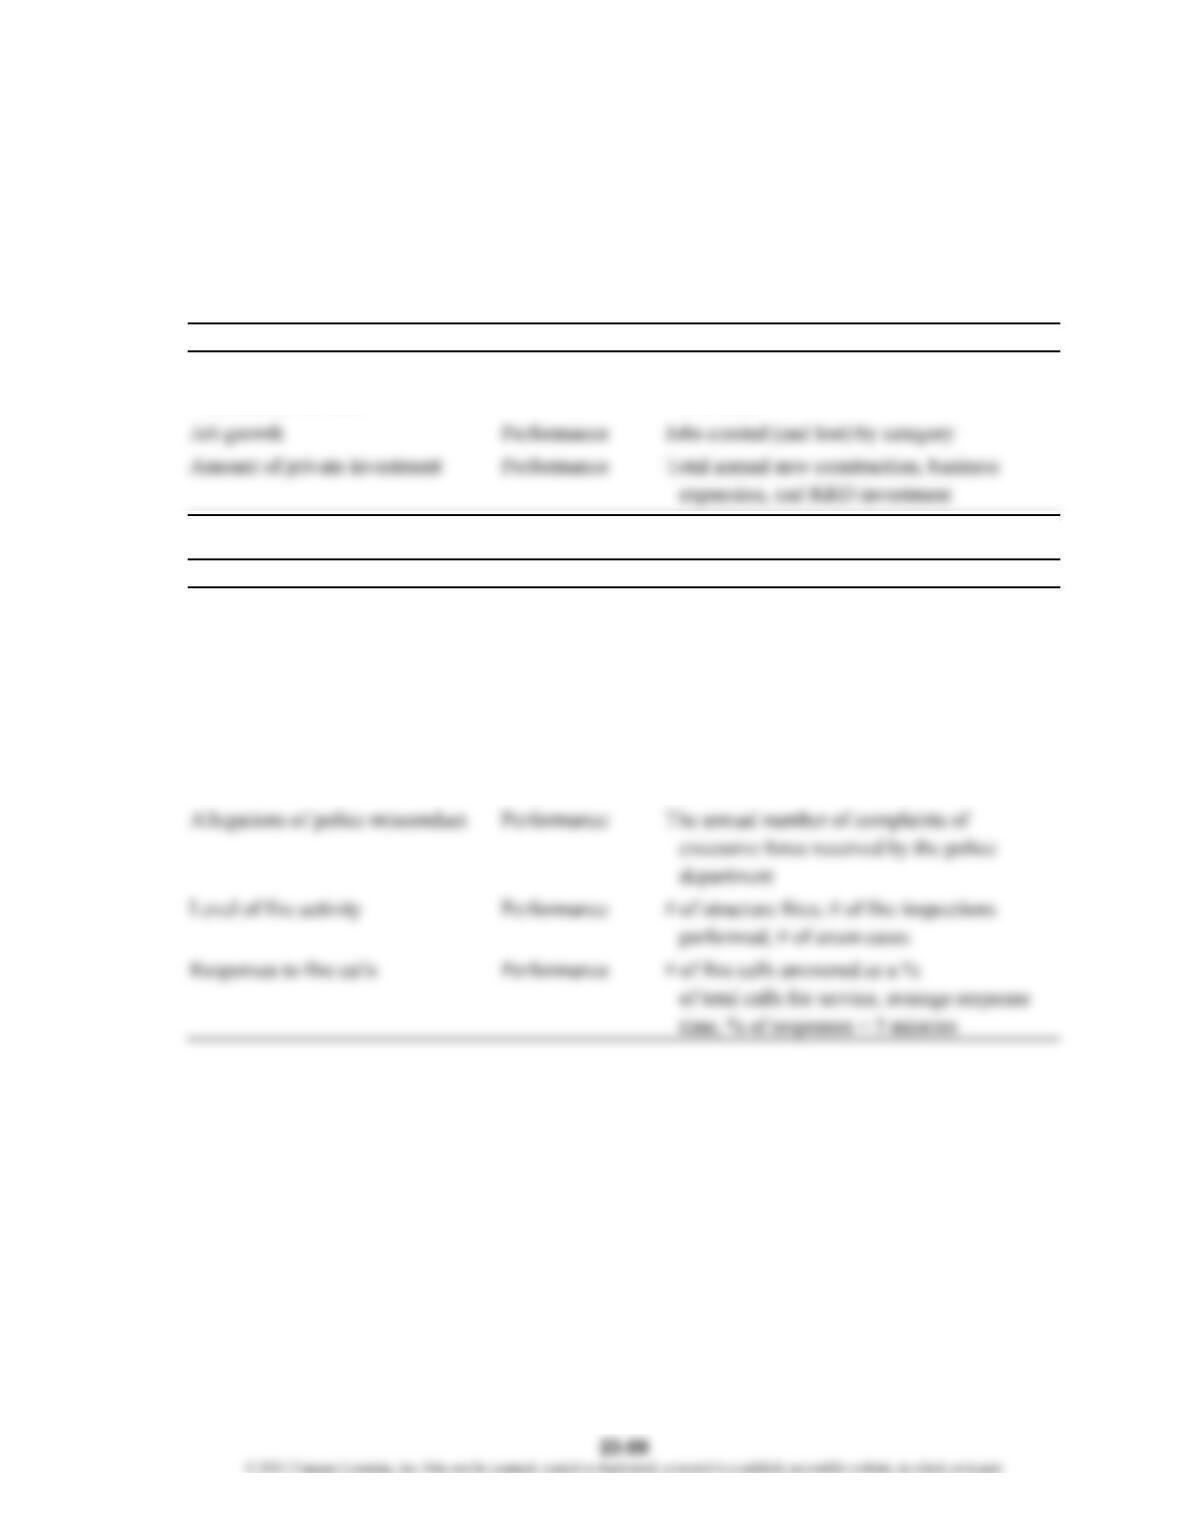
The following are examples of performance measures from Worcester,
Massachusetts:
ECONOMIC DEVELOPMENT
Indicator Outcome Type Measured As
Growth of commercial and Performance Change in total assessed value
residential tax base over time
PUBLIC SAFETY
Indicator Outcome Type Measured As
Level of crime Performance Crime rate and clearance rate by type
of crime
Police community relations Performance Responses to annual citizen survey
questions, performance of personnel
on tests of courtesy, professionalism,
and respect
All measured both citywide and by neighborhood
CHAPTER 23 Evaluating Variances from Standard Costs
CP 23-2 (Continued)
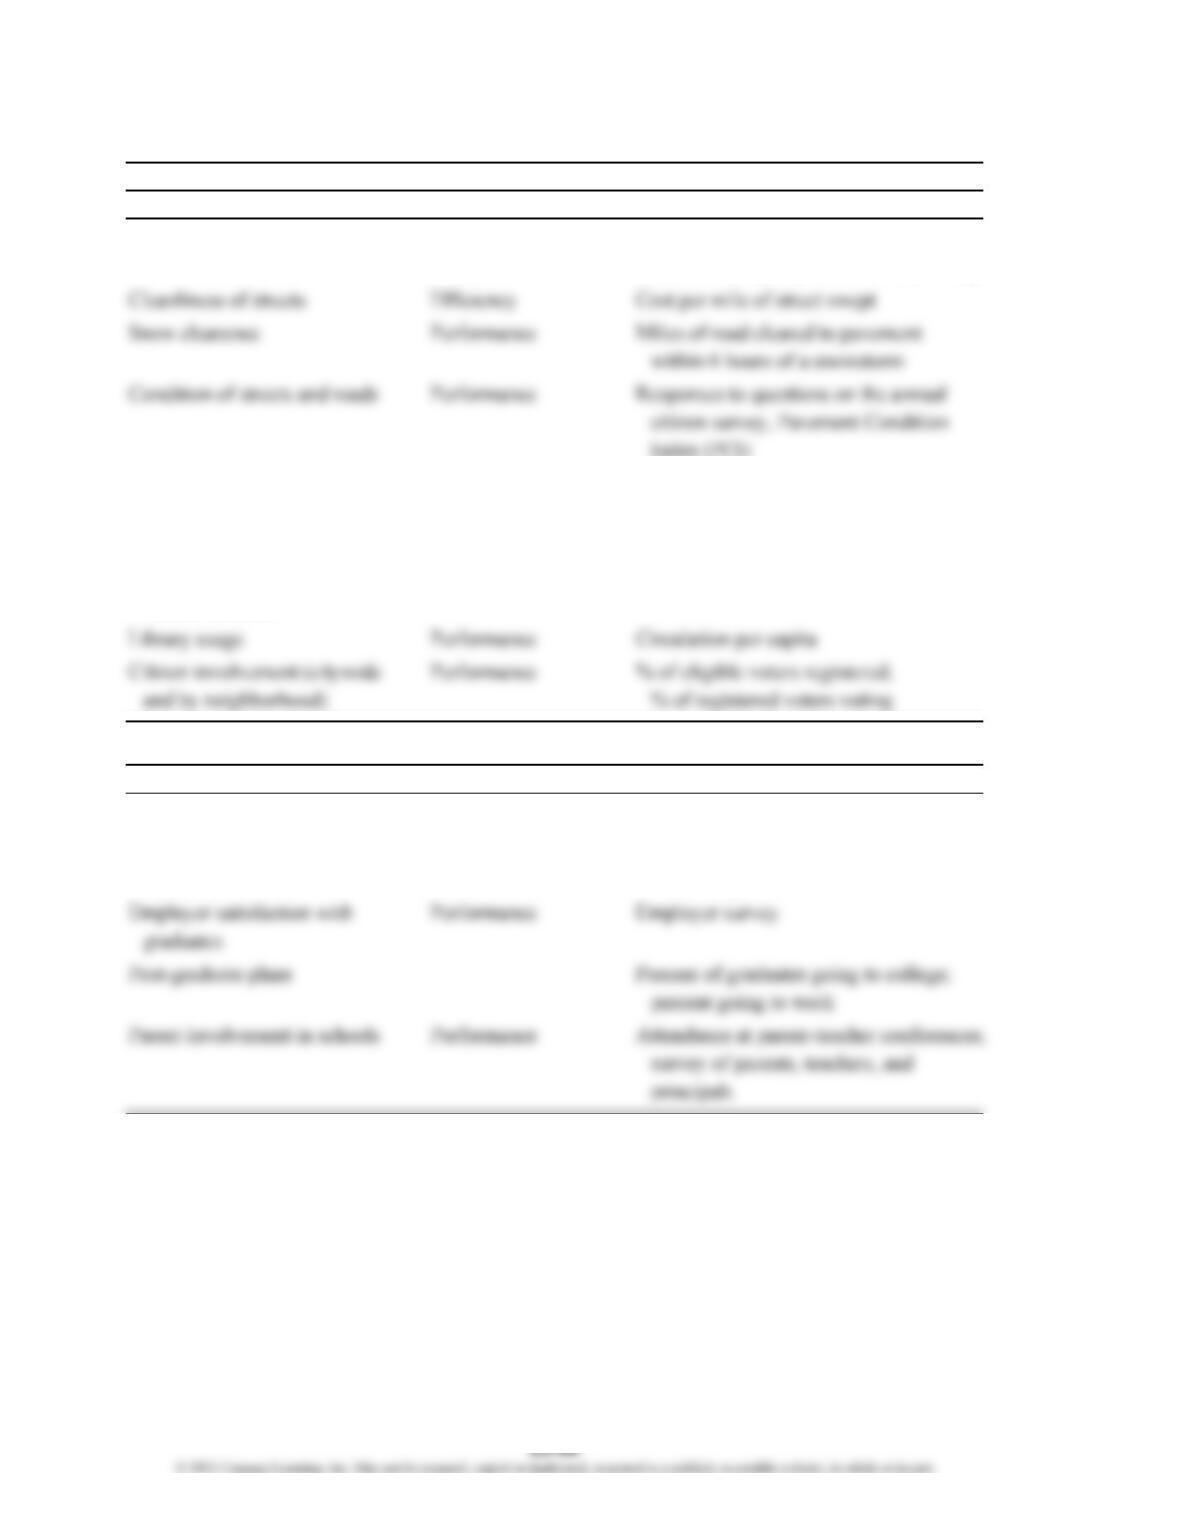
IMPROVED MUNICIPAL SERVICES
Indicator Outcome Type Measured As
Cleanliness of streets Performance Responses to questions on the annual
citizen survey, objective resident ratings
Index (PCI)
Effectiveness of recycling program Performance % of trash recycled
Effectiveness of anti-graffiti Performance # of graffiti incident responses, response
program time from call for service to cleanup
Cost effectiveness of solid Efficiency Cost per ton of waste collected
waste collection
EDUCATION
Indicator Outcome Type Measured As
Student and school achievement Performance MCAS test scores
Graduation rate Performance Percent graduating
Dropout rate Performance Percent dropouts
CHAPTER 23 Evaluating Variances from Standard Costs
CP 23-2 (Concluded)
IMPROVED YOUTH SERVICES
Indicator Outcome Type Measured As
Presence of “at risk youth” Performance Responses to questions from the Youth
Risk Behavior Survey (includes
questions on drug and alcohol use
and violent behavior) by high school
Extent of juvenile crime Performance Juvenile crime rate, citywide and by
neighborhood
Source: Michael D. Goodman and Roberta R. Schaefer, Benchmarking Municipal Performance: A Tool
for Streamlining Municipal Government, Worcester Municipal Research Bureau, 2013.
CP 23-3
To: David Tun
g
ston
From: IMA Student
Re: Performance Measurement S
y
stem
Although the Tungston Company’s performance measurement system uses both
financial and nonfinancial measures, there may still be some serious performance
omissions. Net income as a percent of stockholders’ equity and revenue growth
are good measures of financial performance. Likewise, employee satisfaction
provides good insight into employee morale, which is necessary for overall
business success. There is, however, at least one major shortcoming to the
CHAPTER 23 Evaluating Variances from Standard Costs
CP 23-4
This is a case where there is strong evidence that the poor performance that is
occurring inside the Assembly Department may be the result of behaviors outside
of the department. This is one of the classic problems with variance analysis. Often,
(1) the materials price variance is very favorable; (2) the Fabrication Department’s
labor time variance is also very favorable. A possible explanation is that the
Purchasing Department found a low-price supplier. The low price translated into a
favorable variance. Unfortunately, it appears the company is “getting what it paid
for.” Specifically, it appears that the quality of the purchased parts has gone down,
thus making assembly much more difficult in the Assembly Department. The
Fabrication Department may be performing work faster than standard—again,
resulting in a favorable labor time variance. It may be that the department is working
too fast. Specifically, the speed is resulting in poor fabrication quality. Again, the
Assembly Department is bearing the cost of poorly fabricated parts. The problem in
CHAPTER 23 Evaluating Variances from Standard Costs
CP 23-5
The plant manager is placing pressure on the controller because the controllable
variance is very unfavorable. The claim is that these costs are not really variable at
all. This is a very difficult claim to accept. This is a small company, so it purchases
its power from the outside. The power and light bill is variable to the amount of
The indirect wages may not be completely variable. However, the variance is $8,500,
or 28% higher than the standard. This is much greater than the 10% difference
between the existing production volume and full capacity. In other words, even
granting the plant manager’s position on the indirect wages still does not explain
the overall size of the variance. More is being spent on indirect wages than would
be implied by even 100% production. Something appears amiss.