
chapter
23
Performance Evaluation
Using Variances from
Standard Costs
______________________________________________
OPENING COMMENTS
Standard cost systems set budgets for the materials, labor, and factory overhead used by a manufacturer to
produce its product. Deviations from these standards are reported as variances.
After studying the chapter, your students should be able to:
1. Describe the types of standards and how they are established.
2. Describe and illustrate how standards are used in budgeting.
3. Compute and interpret direct materials and direct labor variances.
4. Compute and interpret factory overhead controllable and volume variances.
5. Journalize the entries for recording standards in the accounts and prepare an income statement that
includes variances from standard.
6. Describe and provide examples of nonfinancial performance measures.
KEY TERMS
budget performance report
budgeted variable factory overhead
controllable variance
cost variance
currently attainable standards

420 Chapter 23 Performance Evaluation Using Variances from Standard Costs
direct labor rate variance
direct labor time variance
direct materials price variance
direct materials quantity variance
factory overhead cost variance report
favorable cost variance
ideal standards
nonfinancial performance measure
process
standard cost
standard cost systems
standards
total manufacturing cost variance
unfavorable cost variance
volume variance
STUDENT FAQS
• Do we need to know all these variance formulas? If so, is there a shortcut method we can use to
calculate the six formulas?
• What is a standard, and why can it vary from company to company?
• How often should a standard change?
• Why does management need to evaluate variances and make adjustments?
• Factory overhead is divided into fixed and variable costs. Why not call volume, fixed and
controllable, variable? It is easier to remember.
• Remind me again, what’s the difference between “applied” and “budgeted”?
• What do volume and controllable variances really mean?
OBJECTIVE 1
Describe the types of standards and how they are established.
SYNOPSIS
Manufacturing companies usually use standard costs for direct materials, direct labor, and factory
overhead. Accounting systems use standard cost systems to determine how much a product should cost
and how much it does cost. The differences are reported as cost variances. It requires the efforts of
engineers, accountants, and others to set standards. Ideal standards are those that can be achieved only
under perfect conditions; currently attainable standards are those that can be achieved with reasonable
effort. Standards are periodically reviewed to ensure they reflect current conditions. The use of standards
is often criticized for the following reasons: discourage improvement beyond standard, too difficult to
maintain, cause employees to lose sight of larger goals, and encourage a narrow focus.

Chapter 23 Performance Evaluation Using Variances from Standard Costs 421
Key Terms and Definition
• Currently Attainable Standards – Standards that represent levels of operation that can be
attained with reasonable effort.
• Ideal Standards – Standards that can be achieved only under perfect operating conditions, such
as no idle time, no machine breakdowns, and no materials spoilage; also called theoretical
standards.
• Standard Cost – A detailed estimate of what a product should cost.
• Standard Cost Systems – Accounting systems that use standards for each element of
manufacturing cost entering into the finished product.
• Standards – Performance goals, often relating to how much a product should cost.
SUGGESTED APPROACH
Manufacturing firms set standards for the amount and price of direct materials, direct labor, and overhead
consumed by their products. Standards establish a benchmark to be used in evaluating actual
performance. They allow management to recognize when costs are not in line with the company’s
projections and to take corrective action.
Ask your students to describe examples of standards in their daily lives. Examples include maximum and
minimum speed limits on highways or rating scales on video games (such as novice, expert, etc.)
This objective also discusses the motivational impact of standards and when they should be revised.
Stress the following points:
1. Unrealistically high standards frustrate employees and stifle motivation. As a result, most companies
do not use theoretical standards, which can be achieved only under perfect operating conditions.
2. Standards that are too low encourage employees to be inefficient. Most companies use currently
attainable standards (normal standards), which can be achieved with reasonable effort.
3. Standards should be changed when they no longer reflect operating conditions. They should not be
revised simply because workers fail to meet standards.
CLASS DISCUSSION—Motivational Impact of Standards
Ask your students to discuss whether they view the grading standards of this course, or other college
courses, as ideal (theoretical standards) or normal (currently attainable standards). Ask them to comment
on how grading standards impact their motivation to study and complete assignments.

422 Chapter 23 Performance Evaluation Using Variances from Standard Costs
OBJECTIVE 2
Describe and illustrate how standards are used in budgeting.
SYNOPSIS
Budgeting assists managers in their control function or budgetary performance evaluation. Manufacturing
standard costs are split into two components: standard price and standard quantity. The standard cost per
unit is computed as: standard cost per unit = standard price × standard quantity. The differences between
actual and standard costs are variances. A favorable cost variance occurs when the actual cost is less than
the standard cost. An unfavorable variance occurs when the actual cost exceeds the standard cost. The
total manufacturing cost variance is the difference between total standard cost and total actual cost for the
units produced. For control purposes, the total cost variance is separated into direct materials, direct labor,
and factory overhead cost variance. Each of these variances is compared to the standard cost and
investigated so the reasons for the favorable and unfavorable variances can be understood.
Key Terms and Definitions
• Budget Performance Report – A report comparing actual results with budget figures.
• Cost Variance – The difference between actual cost and the flexible budget at actual volumes.
• Favorable Cost Variance – A variance that occurs when the actual cost is less than standard cost.
• Total Manufacturing Cost Variance – The difference between total standard costs and total
actual costs for units produced.
• Unfavorable Cost Variance – A variance that occurs when the actual cost exceeds the standard
cost.
Relevant Example Exercises and Exhibits
• Exhibit 1 – Standard Cost for XL Jeans
• Exhibit 2 – Cost Variances
• Exhibit 3 – Budget Performance Report
• Exhibit 4 – Manufacturing Cost Variances
SUGGESTED APPROACH
Budgets exist to help companies plan, direct, and control operations. The budget performance report is a
tool that compares actual costs to budgeted costs.
A sample budget performance report is presented in text Exhibit 2. Point out that the column labeled
“Standard Cost at Actual Volume” is essentially a flexible budget. Flexible budgets were introduced in
Chapter 22.
The following example can be used to illustrate performance measurement under standard costing.
Assume a pizza company has set $5 as the standard cost of ingredients per pizza. The company
anticipates selling 1,000 pizzas during the next week. The budget at the beginning of the week would be
$5,000. This amount would be used for planning.

Chapter 23 Performance Evaluation Using Variances from Standard Costs 423
Now, assume the actual number of pizzas sold during the week was 1,200. The standard cost for
ingredients to make 1,200 pizzas is $6,000. If the pizza parlor actually used $6,900 in ingredients during
the week, there is a $900 variance from standard. This is an unfavorable variance since actual costs
exceeded the standard cost for 1,200 pizzas.
This information would be presented on a budget performance report as follows:
Standard Cost
Actual at Actual Volume Cost Variance
Cost (1,200 pizzas) (Favorable)/Unfavorable
Pizza Ingredients $6,900 $6,000 $900
Management should investigate to determine whether this variance resulted from using ingredients that
were more expensive than anticipated or from using more ingredients per pizza than budgeted. Note that
comparing the $6,900 actual cost to the $5,000 original budget is not meaningful.
OBJECTIVE 3
Compute and interpret direct materials and direct labor variances.
SYNOPSIS
As demonstrated in the prior objective, direct materials and direct labor variances are separated. The direct
materials variance is separated into price and quantity variances. The actual cost is calculated as follows:
actual direct materials cost = actual price × actual quantity. The standard materials cost is calculated as
follows: standard direct materials cost = standard price × standard quantity. The direct materials price
variance is calculated as follows: direct materials price variance = (actual price – standard price) × actual
quantity. The direct materials quantity variance is calculated as: direct materials quantity variance = (actual
quantity – standard quantity) × standard price. These relationships are shown in Exhibit 6.
The direct labor variance is separated into rate and time variances. The actual costs are calculated as:
actual direct labor cost = actual rate per hour × actual time. The standard costs are calculated as follows:
standard direct labor cost = standard rate per hour × standard time. The direct labor rate variance is: direct
labor rate variance = (actual rate per hour – standard rate per hour) × actual hours. The direct labor time
variance is calculated as follows: direct labor time variance = (actual direct labor hours – standard direct
labor hours) × standard rate per hour. These relationships are illustrated in Exhibit 7. Direct labor time
standards can also be developed for administrative, selling, and service activities.
Key Terms and Definitions
• Direct Labor Rate Variance – The cost associated with the difference between the standard rate
and the actual rate paid for direct labor used in producing a commodity.
• Direct Labor Time Variance – The cost associated with the difference between the standard
hours and the actual hours of direct labor spent producing a commodity.

424 Chapter 23 Performance Evaluation Using Variances from Standard Costs
• Direct Materials Price Variance – The cost associated with the difference between the standard
price and the actual price of direct materials used in producing a commodity.
• Direct Materials Quantity Variance – The cost associated with the difference between the
standard quantity and the actual quantity of direct materials used in producing a commodity.
Relevant Example Exercises and Exhibits
• Example Exercise 23-1 Direct Materials Variances
• Example Exercise 23-2 Direct Labor Variances
• Exhibit 5 – Direct Materials and Direct Labor Cost Variances
• Exhibit 6 – Direct Materials Variance Relationships
• Exhibit 7 – Direct Labor Variance Relationships
SUGGESTED APPROACH—Direct Material
Variances are a perplexing topic for many students. As a result, you will probably need to dedicate
significant class time to this topic. For materials variances, demonstrate how each variance is calculated
and give your students the opportunity to practice these calculations using group learning activities.
DEMONSTRATION PROBLEM—Direct Materials Variances
To demonstrate materials variances, use the following data for Martin Manufacturing during the month of
November.
Standard: 5 pounds of direct materials are required per unit at $3.20 per pound
Actual: 104,000 pounds were used to produce 20,000 units; actual materials cost was
$3.15 per pound
Price Variance: Emphasize that a direct materials price variance shows the difference between the actual
and standard price for the actual quantity of materials used. The formula for this calculation is:
(Actual Price per Unit – Standard Price per Unit) Actual Quantity Used
(AP – SP) AQ Used
Using the data from Martin Manufacturing:
($3.15 – $3.20) 104,000 = $5,200 favorable price variance
This variance is favorable because the materials cost $0.05 less per pound than standard.
Quantity Variance: Emphasize that the direct materials quantity variance shows the difference between
the actual and standard quantity of materials used. This difference is measured at the standard price
because the effect of the $0.05 per pound price savings was computed in the price variance. The formula
to compute the quantity variance is:
Chapter 23 Performance Evaluation Using Variances from Standard Costs 425
(Actual Quantity Used – Standard Quantity) Standard Price per Unit
(AQ Used – SQ) SP per Unit
Using the data from Martin Manufacturing:
(104,000 – 100,000) $3.20 = $12,800 unfavorable quantity variance
Note that the standard quantity is 100,000 (5 lbs. per unit 20,000 units actually produced).
This variance is unfavorable because Martin used 4,000 more pounds than standard.
Total Variance: The total materials variance is the difference between the actual and standard cost of
materials. It may be computed as follows:
(Actual Quantity Actual Price per Unit) – (Standard Quantity Standard Price per Unit)
(AQ AP per Unit) – (SQ SP per Unit)
Using the data from Martin Manufacturing:
(104,000 pounds $3.15 per pound) – (100,000 pounds $3.20 per pound)
= $327,600 – $320,000
= $7,600 unfavorable total direct materials cost variance
The total variance may also be computed as follows:
Price variance $ 5,200 favorable
Quantity variance 12,800 unfavorable
Total variance $ 7,600 unfavorable
GROUP LEARNING ACTIVITY—Direct Materials Variances
Transparency Master (TM) 23-1 presents standard and actual cost data for direct materials used by Brass
Works, Inc., a manufacturer of brass lamps and gift products. Instruct your students to compute materials
price and quantity variances for Brass Works, Inc. The solution to this activity is on TM 23-2.
CLASS DISCUSSION—Interpreting Materials Variances
As you review the solution to the group learning activity above (TM 23-2), ask your students to identify
which department of Brass Works, Inc. should be held accountable for each variance. Also ask them to
brainstorm possible reasons for the variance. Some examples follow:
Amount Responsibility Possible Reason(s) for Variance
Materials $420 U Purchasing Price increase from supplier.
Price Variance Department Extra freight charge on a rush order.

426 Chapter 23 Performance Evaluation Using Variances from Standard Costs
Materials $250 U Production Waste due to machine malfunction.
Quantity Variance Department Poor quality materials.
SUGGESTED APPROACH—Direct Labor
The labor rate and time variances closely mirror the materials price and quantity variances. As you
present the formulas to calculate labor variances, stress the similarity to the materials variances. Ask your
students to apply these formulas using a Group Learning Activity.
LECTURE AID—Direct Labor Variances
Differences between actual and standard labor costs are analyzed by computing a rate and a time
variance. The labor rate variance essentially performs the same analysis as the materials price variance. It
computes the cost difference due to a change in labor rate. The formula for the rate variance is:
(Actual Rate per Hour – Standard Rate per Hour) Actual Hours Worked
(AR per Hour – SR per Hour) AH Worked
The labor time variance computes the labor cost difference due to using more or less labor time than
standard. This variance parallels the materials quantity variance. The formula is:
(Actual Hours Worked – Standard Hours) Standard Rate per Hour
(AH Worked – SH) SR per Hour
Ask your students to identify which labor variances could be caused by new employees. Answer: New
employees will usually create an unfavorable time variance as they learn their job. They may also cause a
favorable rate variance if standards were based on wages earned by experienced employees and the new
employee wage rate is below that amount.
GROUP LEARNING ACTIVITY—Direct Labor Variances
TM 23-3 presents labor data for Brass Works, Inc. Ask your students to work in groups to calculate labor
rate and time variances using the above formulas. The solution is shown on TM 23-4.
CLASS DISCUSSION—Interpreting Materials Variances
As you review the solution on TM 23-4, ask your students to identify which department of Brass Works,
Inc. should be held accountable for each labor variance. Also ask them to brainstorm possible reasons for
the variance. Some examples follow:
Amount Responsibility Possible Reason(s) for Variance
Labor $2,380 F Production Workers at lower wage rate
Rate Variance Department assigned to job (e.g., temporary
employees, less-skilled workers).

Chapter 23 Performance Evaluation Using Variances from Standard Costs 427
Labor $3,800 U Production Extra labor time required due to
Time Variance Department poor quality materials.
Extra labor time required due to
machine malfunctions.
SUGGESTED APPROACH—Nonmanufacturing Businesses
Standards can be applied to nonmanufacturing businesses, provided that they use repetitive activities to
produce a common product or service. For example, businesses that specialize in fast, no-appointment-
needed oil changes provide a standard service comprised of repetitive activities. A standard cost to
perform an oil change could be developed based on the (1) standard labor time to change a customer’s oil,
(2) standard wage rate, (3) standard quantity of supplies used (motor oil, filters, etc.), and (4) standard
price of supplies.
Public accounting firms are another example of businesses that rely heavily upon standards. Budgets and
standards are used to measure performance on various client engagements, such as audits and tax work.
WRITING EXERCISE—Standards in a Nonmanufacturing Environment
Ask your students to answer the following in writing (TM 23-8).
Describe a nonmanufacturing business that could benefit from the use of standards. Also
explain how standards would help that business control its operations.
Possible response: One example of a business that could benefit from the use of standards in a
nonmanufacturing environment would be medical or legal transcription. The number of words
transcribed per minute is an easy measurement to determine how employees are performing
against a standard. Labor rates are also easy to track in this environment. This is only one
example; your students should provide additional examples to discuss.
OBJECTIVE 4
Compute and interpret factory overhead controllable and volume variances.
SYNOPSIS
The factory overhead costs are analyzed differently than materials and labor due to fixed and variable
components. Factory overhead is first separated to allow its components to be analyzed. The factory
overhead rate is figured as: factory overhead rate = budgeted factory overhead at normal capacity/normal
productive capacity. The formula to analyze the variable component is: variable factory overhead rate =
budgeted variable overhead at normal capacity/normal productive capacity. To find the fixed factory
component, fixed factory overhead rate = budgeted fixed overhead at normal capacity/normal productive
capacity. The variable factory overhead controllable variance is the difference between the actual

428 Chapter 23 Performance Evaluation Using Variances from Standard Costs
overhead costs and the budgeted variable overhead for actual production. It is computed as: variable
factory overhead controllable variance = actual variable factory overhead – budgeted variable factory
overhead. The budgeted variable overhead is computed as: budgeted variable factory overhead = standard
hours for actual units produced × variable factory overhead rate. The variable factory controllable
variance is computed as: variable factory overhead controllable variance = actual variable factory
overhead – budgeted variable factory overhead. The fixed factory overhead volume variance is the
difference between the budgeted fixed overhead at 100% of normal capacity and the standard fixed
overhead for the actual units produced computed as: fixed factory overhead volume variance = (standard
hours for 100% of normal capacity – standard hours for actual units produced) × fixed factory overhead
rate. The volume variance measures the use of fixed overhead resources. Management should determine
the causes of the unfavorable variance and consider taking corrective action. The total factory overhead
cost variance can also be determined as the sum of the variable factory overhead costs. The factory
overhead cost variance report is shown in Exhibit 10. At the end of the period, the factory overhead
account normally has a balance. A debit balance in Factory Overhead represents underapplied overhead,
which occurs when actual factory overhead costs exceed the applied factory overhead. A credit balance in
Factory Overhead occurs when actual factory overhead costs are less than the actual applied factory
overhead. If the actual factory overhead exceeds the budgeted factory overhead, the controllable variance
is unfavorable. If the actual factory overhead is less than the budgeted factory overhead, the volume
variance is unfavorable.
Key Terms and Definitions
• Budgeted Variable Factory Overhead – The standard variable overhead for the actual units
produced.
• Controllable Variance – The difference between the actual amounts of variable factory overhead
cost incurred and the amount of variable factory overhead budgeted for the standard product.
• Factory Overhead Cost Variance Report – Reports budgeted and actual costs for variable and
fixed factory overhead along with the related controllable and volume variances.
• Volume Variance – The difference between the budgeted fixed overhead at 100% of normal
capacity and the standard fixed overhead for the actual production achieved during the period.
Relevant Example Exercises and Exhibits
• Example Exercise 23-3 Factory Overhead Controllable Variance
• Example Exercise 23-4 Factory Overhead Volume Variance
• Exhibit 8 – Factory Overhead Cost Budget Indicating Standard Factory Overhead Rate
• Exhibit 9 – Graph of Fixed Overhead Volume Variance
• Exhibit 10 – Factory Overhead Cost Variance Report
• Exhibit 11 – Factory Overhead Variances
SUGGESTED APPROACH
Consider spending extra time covering factory overhead variances, since students seem to have the most
difficulty with these variances. One of the major reasons for this is that, while direct materials and direct
labor costs are variable, factory overhead costs have both fixed and variable components. You can
continue the pattern of demonstrating variance calculations and asking students to practice these
computations, using the aids below.

Chapter 23 Performance Evaluation Using Variances from Standard Costs 429
DEMONSTRATION PROBLEM—Overhead Variances
In most cases, factory overhead costs are applied to production, using a predetermined factory overhead
rate, calculated as follows:
Estimated Total Factory Overhead Costs
Estimated Activity Base (or Driver) (e.g., direct labor or machine hours)
Factory overhead variances result when factory overhead applied to products does not equal actual
overhead. Therefore, factory overhead variances occur whenever:
1. Factory overhead costs were greater or less than estimated.
2. The company operated above or below the capacity anticipated when estimating the activity driver.
Use the following data to illustrate factory overhead variances.
Martin Manufacturing applies factory overhead to products using direct labor hours. To calculate a
predetermined overhead rate, Martin developed the following estimates for one month of production.
Direct labor hours at 100 percent of normal capacity 12,000 hrs.
Estimated fixed factory overhead costs $120,000
Estimated variable factory overhead costs at 100 percent of normal capacity $ 84,000
As a result, Martin’s predetermined factory overhead rate is $17 per direct labor hour. Of that rate, fixed
factory overhead is $10 per hour ($120,000/12,000 hrs.) and variable factory overhead is $7 per hour
($84,000/12,000 hrs.).
Martin’s labor standards allow 0.5 direct labor hours for each unit produced. During November, 20,000
units were produced. Actual fixed factory overhead costs were $120,000. Actual variable factory
overhead costs were $88,000.
Variable Factory Overhead Controllable Variance: The text defines this variance as the difference
between actual variable overhead costs and variable overhead budgeted for the amount of product actually
produced. (Note that the text is essentially presenting a two-way overhead analysis.) This can be
expressed in the following formula:
Actual Var. OH – (Var. OH Rate per Hr. Units Produced Standard Hrs. per Unit)
Using data from Martin Manufacturing:
Actual Variable Factory Overhead = $88,000
Budgeted Variable Factory Overhead for
Actual Amount Produced = $7 20,000 units 0.50 hrs. per unit = $70,000
Controllable Variance = $88,000 – $70,000 = $18,000 unfavorable
430 Chapter 23 Performance Evaluation Using Variances from Standard Costs
Fixed Factory Overhead Volume Variance: This variance measures the difference between the budgeted
fixed overhead at 100 percent of normal capacity and the standard fixed overhead for the amount of
product actually produced. In essence, it measures the impact of spreading fixed overhead over the wrong
number of units, whenever actual production does not equal the amount anticipated by the predetermined
fixed overhead rate. This can be expressed in the following formula:
(Hrs. at 100% of normal capacity – Std. Hrs. for Actual Production) Fixed OH Rate per Hr.
Remind students that the term “Hrs. at 100% of normal capacity” is the hours used in computing the
predetermined overhead rate.
Using the data from Martin Manufacturing:
(12,000 hours – 10,000 hours) $10 per hr. = $20,000 unfavorable
Therefore, Martin’s total overhead variance is as follows:
Controllable variance $ 18,000 unfavorable
Volume variance 20,000 unfavorable
Total overhead variance $ 38,000 unfavorable
Emphasize that the total factory overhead variance is also the difference between actual overhead costs
and overhead applied using a predetermined overhead rate. Therefore, the $38,000 unfavorable total
factory overhead variance also represents $38,000 of underapplied overhead. The concept of over– and
underapplied overhead was introduced in Chapter 19 when covering Job Order Costing.
GROUP LEARNING ACTIVITY—Overhead Variances
TM 23-5 presents data for your students to use in calculating overhead variances. The solution to the
exercise is provided on TM 23-6.
OBJECTIVE 5
Journalize the entries for recording standards in the accounts and prepare an income
statement that includes variances from standard.
SYNOPSIS
Standard costs may be used as a management tool to control costs separately from the accounts in the
general journal in the general ledger. However, many companies include standard costs in their accounts.
To do so, when purchasing materials, Materials would be debited at the standard price, Accounts Payable
would be credited for the actual price, and the variance would be debited or credited depending on the
difference between the prices. The variance for quantity would be journalized in a similar manner. Work
in Process would be debited, Direct Materials Quantity Variance would be either debited or credited
depending on whether the amount requested was above or below the standard, and Materials would be

Chapter 23 Performance Evaluation Using Variances from Standard Costs 431
credited. A debit balance in the direct materials quantity variance account represents an unfavorable
variance. The direct labor entries are summarized as: Work in Process is debited, Wages Payable is
credited for the actual direct labor cost, Direct Labor Rate Variance is debited for an unfavorable variance
and credited for a favorable variance, and Direct Labor Time Variance is debited for an unfavorable
variance and credited for a favorable variance. These variances may be reported on an income statement
prepared for management’s use. These variances are not on the income statement for external users.
Relevant Example Exercises and Exhibits
• Example Exercise 23-5 Standard Cost Journal Entries
• Example Exercise 23-6 Income Statement with Variances
• Exhibit 12 – Variance from Standards in Income Statement
SUGGESTED APPROACH
Some companies choose to integrate standards and variances into their accounting records. When this
occurs, entries to the materials, work in process, and finished goods inventory accounts are recorded at
standard, not actual, costs. It is helpful to illustrate these entries for your students. A demonstration
problem is included below for that purpose.
DEMONSTRATION PROBLEM—Journal Entries at Standard
The group learning activities under Objectives 3 and 4 asked your students to compute materials and labor
variances. Use these calculations to illustrate the following journal entries.
Purchase of Materials: Brass Works used 1,050 pounds of direct materials that cost $5.40 per pound. The
effect of paying $0.40 more per pound than standard was a $420 unfavorable price variance. The purchase
of these materials would be recorded as follows:
Materials (1,050 pounds $5.00) 5,250
Direct Materials Price Variance 420
Accounts Payable (1,050 pounds $5.40) 5,670
Note that the Materials account is debited for the standard cost of materials purchased.
Requisition of Materials: Brass Works used 1,050 pounds of direct materials for production when the
standard materials quantity was only 1,000 pounds. The effect of using more materials than standard is
recorded when the materials are transferred to Work in Process.
Work in Process (1,000 pounds $5.00) 5,000
Direct Materials Quantity Variance 250
Materials (1,050 pounds $5.00) 5,250
Note that the work in process account is debited for the standard price and quantity of materials. The
materials account is credited for the actual quantity of materials used but at the standard price. The actual

432 Chapter 23 Performance Evaluation Using Variances from Standard Costs
quantity of materials used must be removed from the account in order to have an accurate record of the
amount of materials still on hand.
Payment of Direct Labor Costs: Brass Works incurred 2,380 direct labor hours at a cost of $9 per hour.
The standard was 2,000 hours at $10 per hour. The payroll entry to record direct labor wages is:
Work in Process (2,000 hours $10) 20,000
Direct Labor Time Variance 3,800
Direct Labor Rate Variance 2,380
Wages Payable 21,420
The work in process account is debited for the standard labor rate and standard labor time.
Remind students that variances are usually transferred to Cost of Goods Sold at the end of the year.
Unfavorable variances (resulting from costs above standard) increase Cost of Goods Sold; favorable
variances (resulting from costs below standard) decrease Cost of Goods Sold. If variances are material,
they should be allocated to Work in Process, Finished Goods, and Cost of Goods Sold.
LECTURE AID—Reporting Variances on the Income Statement
Variances are not usually reported on financial statements prepared for stockholders, creditors, or other
parties outside company management. However, they may be included on income statements prepared for
management use. Exhibit 9 in the text provides an example of an income statement that reports variances.
The key to this exhibit is understanding how the variances affect gross profit. Use the chart on TM 23-7 to
explain the impact of favorable and unfavorable variances on gross profit.
OBJECTIVE 6
Describe and provide examples of nonfinancial performance measures.
SYNOPSIS
A nonfinancial performance measure expresses performance in a measure other than dollars. Using
financial and nonfinancial performance measures aids managers and employees in considering multiple
performance objectives. Examples of nonfinancial performance measures are listed in Exhibit 13.
Nonfinancial measures are often linked to either the inputs or outputs of an activity or process. A process
is a sequence of activities for performing a task. The relationship between an activity or a process and its
inputs can be measured; this relationship is shown in Exhibit 14.
Key Terms and Definitions
• Nonfinancial Performance Measure – A performance measure expressed in units rather than
dollars.
• Process – A sequence of activities linked together for performing a particular task.

Chapter 23 Performance Evaluation Using Variances from Standard Costs 433
Relevant Example Exercises and Exhibits
• Example Exercise 23-7 Activity Inputs and Outputs
• Exhibit 13 – Nonfinancial Performance Measures
• Exhibit 14 – Relationship Between a Process and Its Inputs and Outputs
• Exhibit 15 – Inputs/Outputs for a Fast-Food Restaurant
SUGGESTED APPROACH
Measurements encourage improving the actions that are being measured. This is true both in the business
world and in the classroom. Use the writing exercise below to stimulate your students to think about the
benefits and difficulties of nonfinancial performance measures.
WRITING EXERCISE—Nonfinancial Performance Measures
Ask your students to write their opinion on the following questions (TM 23-9):
Students’ scores on exams may be equated to financial measures used to evaluate
employee performance in a business. Should college professors limit their evaluation of
students to these “financial” measures? Do you see any potential benefits or disadvantages
of including other measures of student performance in assigning course grades?
Possible response: Professors use optional measures to evaluate students all the time.
Attendance, extra credit, and the subjective nature of some assignments provide options for
evaluation on course work other than exam scores. Benefits include motivating students to put in
extra time and effort to grasp the subject. In academia as in business, financial measures are not
always the final or only performance measure.
CLASS DISCUSSION—Nonfinancial Performance Measures
Ask your students to share examples of any nonfinancial measures used by their employers to evaluate
their work. Question your students on why these measures are used. In other words, what behavior is the
employer trying to encourage with these nonfinancial measures?
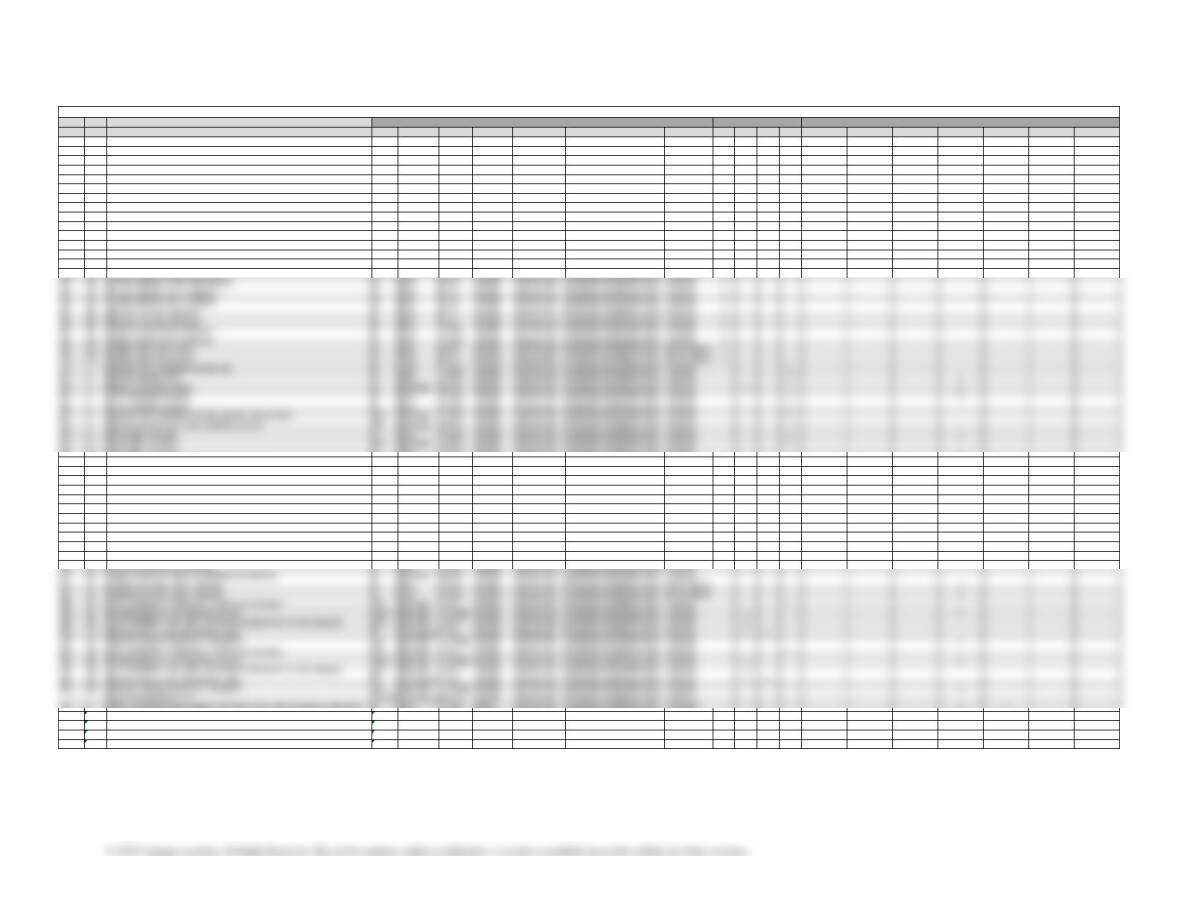
Type Item Description LO(s) Difficulty Time Est BUSPROG AICPA ACBSP – APC Bloom’s EE Excel GL SMH FAI Service Real World Writing Ethics Internet Group
DQ 1 1 Easy 5 min. Analytic Measurement Budgeting and Responsibility Remembering
DQ 2 1 Easy 5 min. Analytic Measurement Budgeting and Responsibility Remembering
DQ 3 3 Easy 5 min. Analytic Measurement Budgeting and Responsibility Remembering
DQ 4 2 Easy 5 min. Analytic Measurement Budgeting and Responsibility Remembering
DQ 5 3 Easy 5 min. Analytic Measurement Budgeting and Responsibility Remembering
DQ 6 3 Easy 5 min. Analytic Measurement Budgeting and Responsibility Remembering
DQ 7 3 Easy 5 min. Analytic Measurement Budgeting and Responsibility Remembering
DQ 8 4 Easy 5 min. Analytic Measurement Budgeting and Responsibility Remembering
DQ 9 5 Easy 5 min. Analytic Measurement Budgeting and Responsibility Remembering
DQ 10 6 Easy 5 min. Analytic Measurement Budgeting and Responsibility Remembering
PE 1A Direct materials variances 3 Easy 10 min. Analytic Measurement Budgeting and Responsibility Applying x
PE 1B Direct materials variances 3 Easy 10 min. Analytic Measurement Budgeting and Responsibility Applying x
PE 2A Direct labor variances 3 Easy 10 min. Analytic Measurement Budgeting and Responsibility Applying x
PE 2B Direct labor variances 3 Easy 10 min. Analytic Measurement Budgeting and Responsibility Applying x
PE 3A Factory overhead controllable variance 4 Easy 5 min. Analytic Measurement Budgeting and Responsibility Applying x
EX 10 Direct labor variances 3 Easy 10 min. Analytic Measurement Budgeting and Responsibility Applying x
EX 11 Direct labor standards for nonmanufacturing expenses 3 Moderate 15 min. Analytic Measurement Budgeting and Responsibility Applying
EX 12 Direct labor standards for nonmanufacturing operations 2,3 Easy 15 min. Analytic Measurement Budgeting and Responsibility Applying
EX 13 Direct labor variances for a service company 3 Moderate 15 min. Analytic Measurement Budgeting and Responsibility Applying x
EX 14 Direct materials and direct labor variances 3 Moderate 15 min. Analytic Measurement Budgeting and Responsibility Applying x
EX 15 Flexible overhead budget 4 Moderate 30 min. Analytic Measurement Budgeting and Responsibility Applying
EX 16 Flexible overhead budget 4 Moderate 30 min. Analytic Measurement Budgeting and Responsibility Applying
EX 17 Factory overhead cost variances 4 Moderate 20 min. Analytic Measurement Budgeting and Responsibility Applying
EX 18 Factory overhead cost variances 4 Easy 15 min. Analytic Measurement Budgeting and Responsibility Applying x
EX 19 Factory overhead variance corrections 4 Moderate 20 min. Analytic Measurement Budgeting and Responsibility Applying
EX 20 Factory overhead cost variance report 4 Moderate 30 min. Analytic Measurement Budgeting and Responsibility Applying x
EX 21 Recording standards in accounts 5 Easy 10 min. Analytic Measurement Budgeting and Responsibility Applying
CP 1 Ethics and professional conduct in business using nonmanufacturing standards 1 Easy 15 min. Ethics Measurement Budgeting and Responsibility Analyzing x x
CP 2 Nonfinancial performance measures 6 Easy 15 min. Analytic Measurement Budgeting and Responsibility Analyzing x
CP 3 Variance interpretation 3 Moderate 30 min. Analytic Measurement Budgeting and Responsibility Evaluating x
CP 4 Variance interpretation 4 Moderate 20 min. Analytic Measurement Budgeting and Responsibility Evaluating x x
CP 5 Nonmanufacturing performance measures – government 6 Moderate 1 hour Analytic Measurement Budgeting and Responsibility Applying
HOMEWORK CHART WITH LEARNING OUTCOMES TAGGING
TAGGING
RESOURCES
FOCUS