1. In a centralized operation, all major planning and operating decisions are made by top management
.
In a decentralized operation, managers of separate divisions or units are delegated operating
2. The department manager of a profit center has responsibility for and authority over costs and
3. Payroll: Number of checks issued. Accounts payable: Number of invoices paid. Accounts
4. The major shortcoming of using income from operations as a measure of investment center
p
5. A division of a decentralized company could be considered the least profitable, even though
6. By dividing income from operations by the amount of invested assets, each division is placed
on a comparable basis of income from operations per dollar invested.
7. The balanced scorecard attempts to identify the underlying nonfinancial drivers, or causes, of
financial performance related to innovation and learning, customer service, and internal processes.
8. The objective of transfer pricing is to encourage each division manager to work in the best
b
9. When unused capacity exists in the supplying division, the negotiated price approach is
p
referred over the market price approach.
CHAPTER 23 (FIN MAN); CHAPTER 8 (MAN)
PERFORMANCE EVALUATION
DISCUSSION QUESTIONS
FOR DECENTRALIZED OPERATIONS
23-1
CHAPTER 23 Performance Evaluation for Decentralized Operations
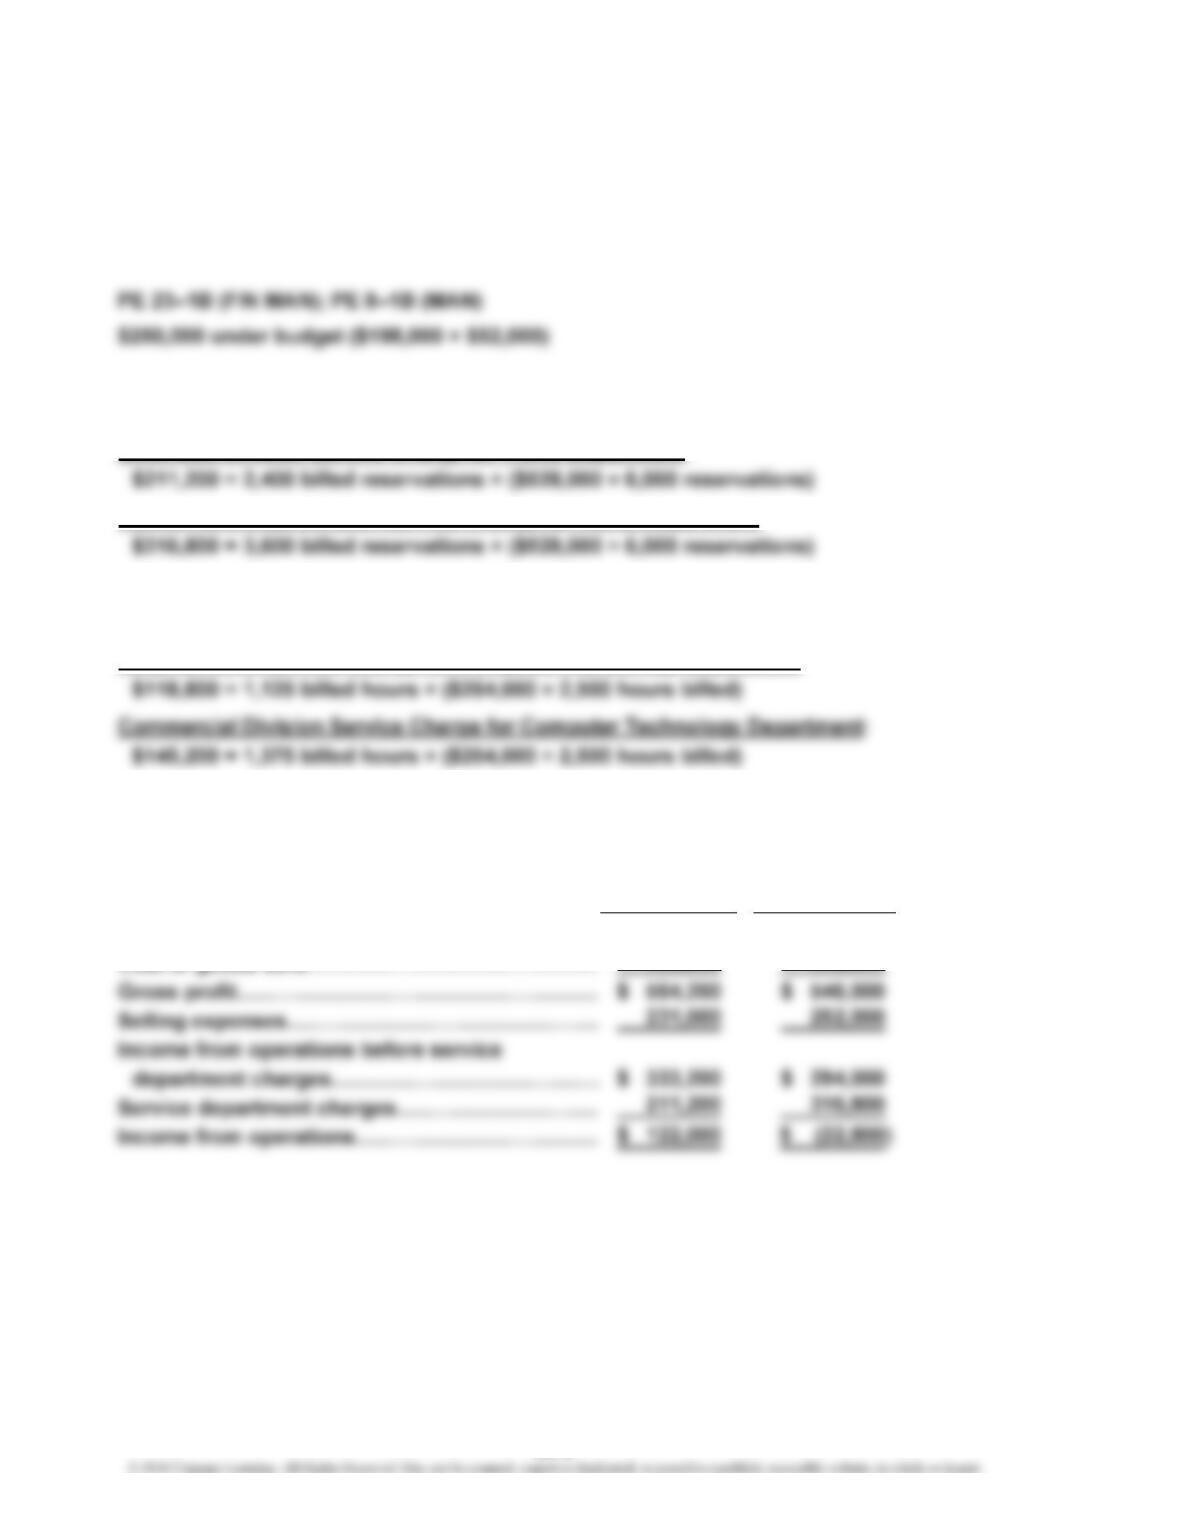
PE 23–1A (FIN MAN); PE 8–1A (MAN)
$366,500 over budget ($319,000 + $47,500)
PE 23–2A (FIN MAN); PE 8–2A (MAN)
Southeast Division Service Charge for Travel Department:
Pacific Northwest Division Service Charge for Travel Department:
PE 23–2B (FIN MAN); PE 8–2B (MAN)
Retail Division Service Charge for Computer Technology Department:
PE 23–3A (FIN MAN); PE 8–3A (MAN)
Northeast Pacific
Division Division
Sales……………………………………………………
…
$1,155,000 $1,204,000
Cost of goods sold…………………………………… 590,800 658,000
PRACTICE EXERCISES
23-2
CHAPTER 23 Performance Evaluation for Decentralized Operations
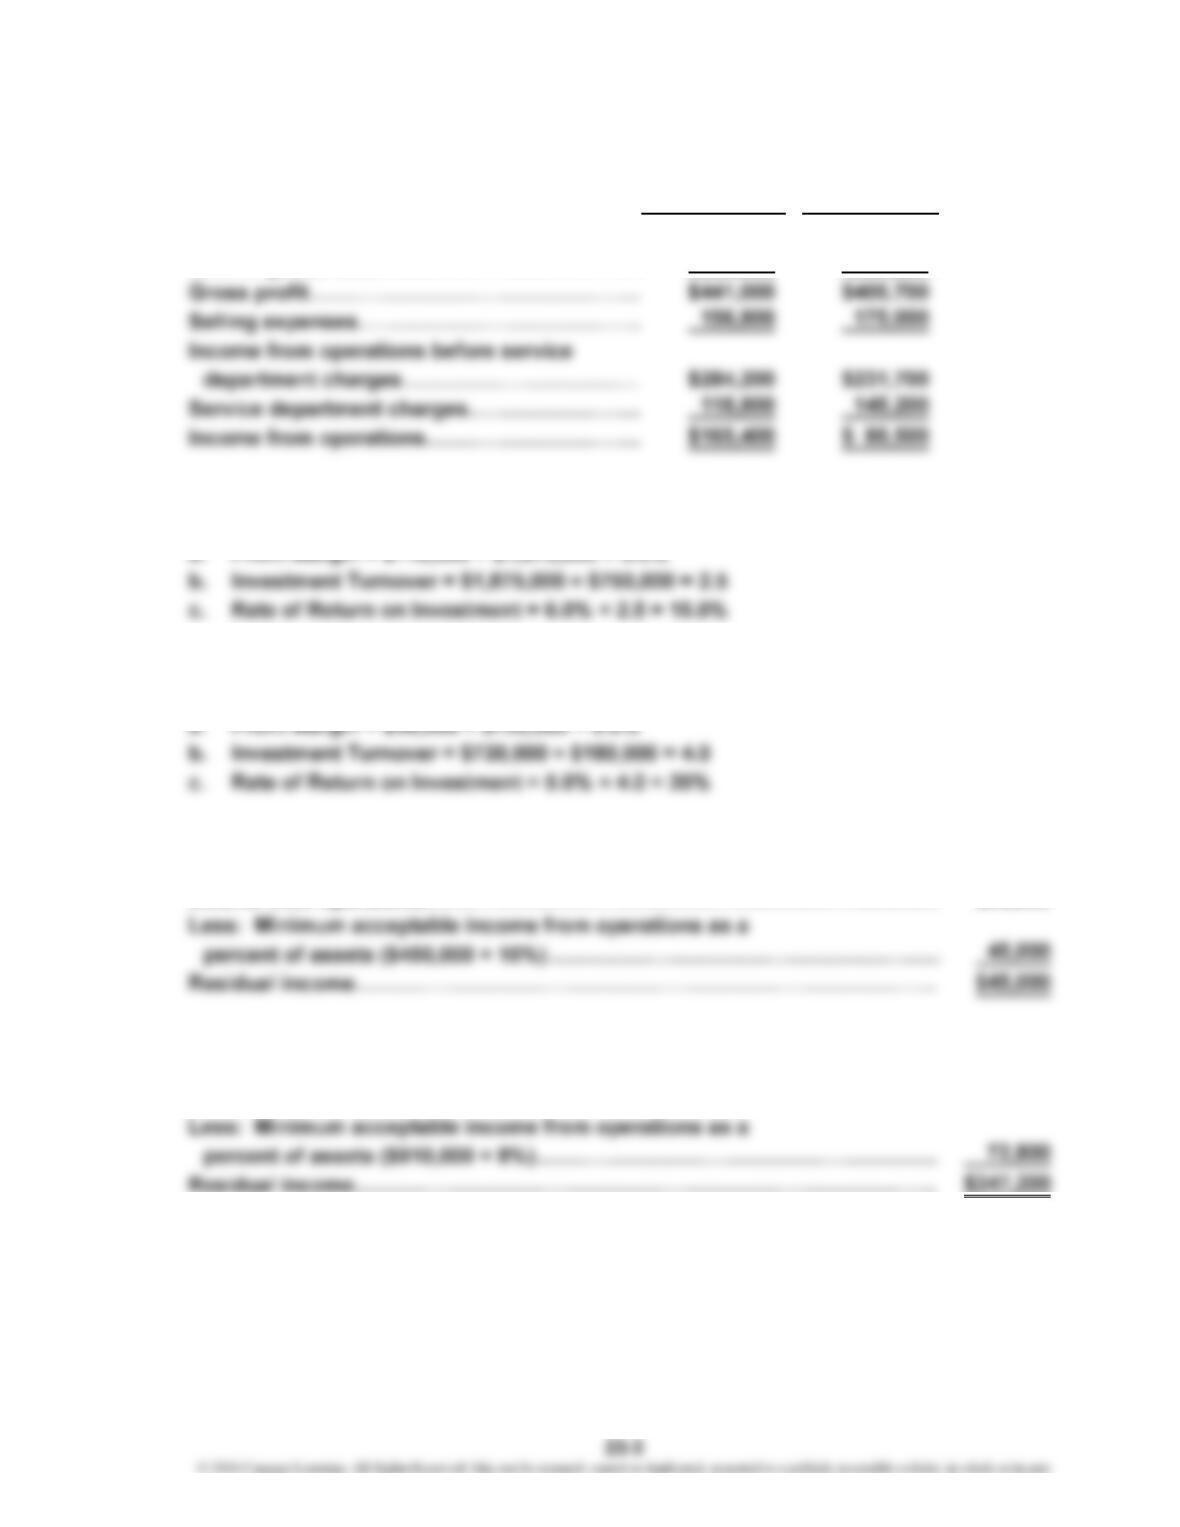
PE 23–3B (FIN MAN); PE 8–3B (MAN)
Retail Commercial
Division Division
Sales…………………………………………………
…
$945,000 $966,000
Cost of goods sold………………………………
…
504,000 559,300
PE 23–4A (FIN MAN); PE 8–4A (MAN)
a. Profit Margin = $112,500 ÷ $1,875,000 = 6.0%
PE 23–4B (FIN MAN); PE 8–4B (MAN)
PE 23–5A (FIN MAN); PE 8–5A (MAN)
Income from operations………………………………………………………………
…
$90,000
PE 23–5B (FIN MAN); PE 8–5B (MAN)
Income from operations………………………………………………………………
…
$420,000
CHAPTER 23 Performance Evaluation for Decentralized Operations
PE 23–6A (FIN MAN); PE 8–6A (MAN)
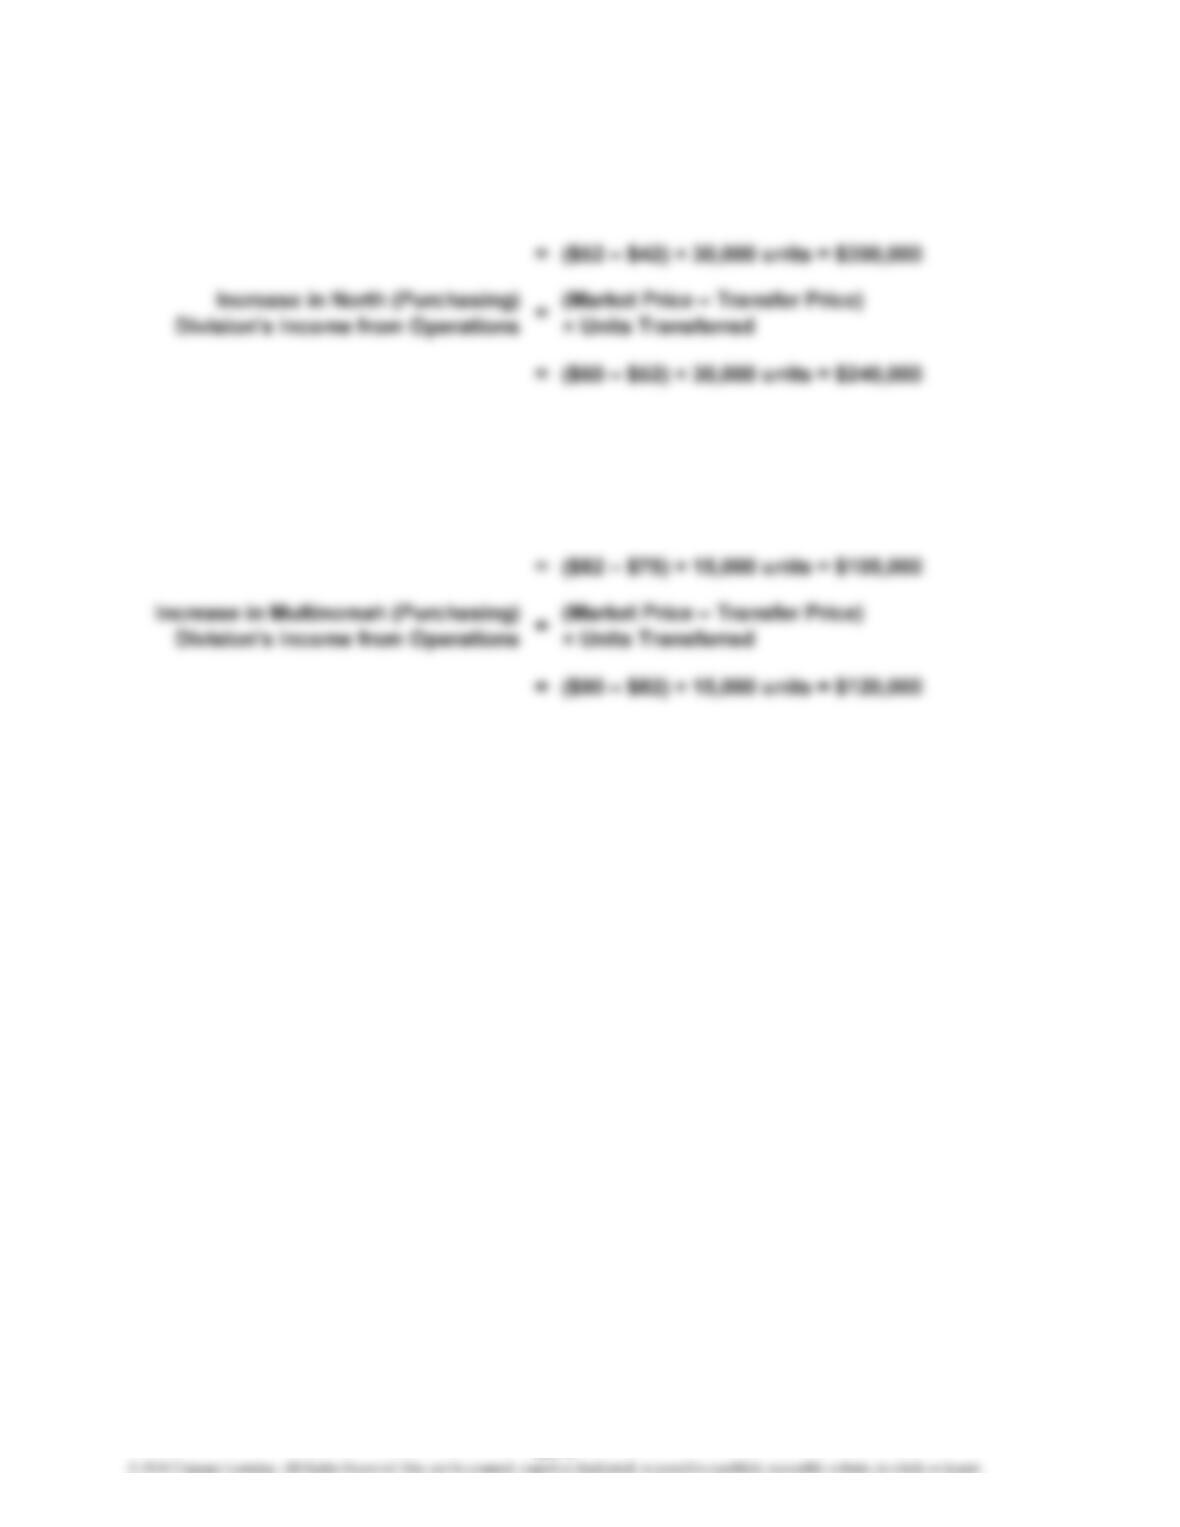
PE 23–6B (FIN MAN); PE 8–6B (MAN)
Increase in Pembroke (Supplying)
Division’s Income from Operations =(Transfer Price – Variable Cost per Unit)
× Units Transferred
Increase in South (Supplying)
Division’s Income from Operations =(Transfer Price – Variable Cost per Unit)
× Units Transferred
23-4
CHAPTER 23 Performance Evaluation for Decentralized Operations
Ex. 23–1 (FIN MAN); Ex. 8–1 (MAN)
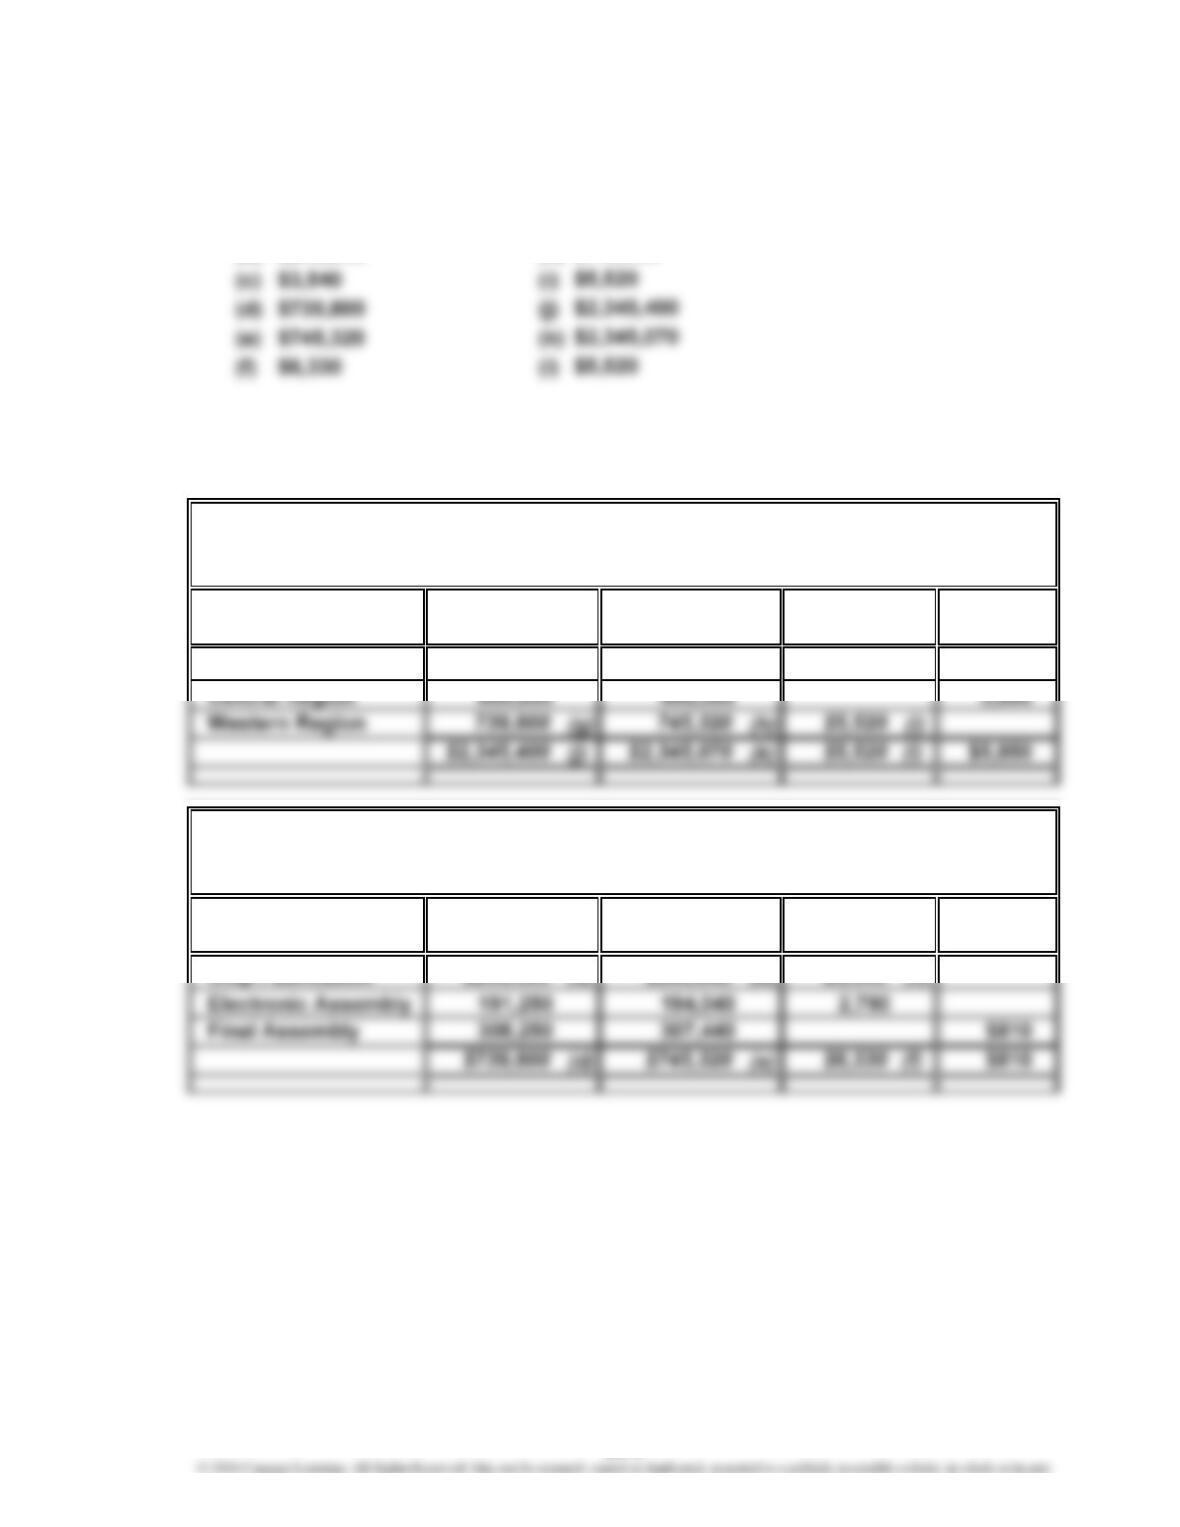
a. (a) $240,300 (g
)
(b) $243,840 (h
)
Schedules of supporting calculations (answers in italics; the solution requires
working from the department level, up to the plant level, then to the vice president
of production level):
Under
Budget
Eastern Region $ 933,750 $2,250
Under
Budget
Chip Fabrication (a) $243,840 (b) $3,540 (c)
BudgetPlant
$240,300
Department
Actual
Over
Over
SASKATOON COMPANY
Budget Performance Report—Manager, Western Region Plant
For the Month Ended June 30, 2016
Budget Actual
Budget
Budget
$ 936,000
EXERCISES
SASKATOON COMPANY
Budget Performance Report—Vice President, Production
For the Month Ended June 30, 2016
$739,800
$745,320
23-5
CHAPTER 23 Performance Evaluation for Decentralized Operations
Ex. 23–1 (FIN MAN); Ex. 8–1 (MAN) (Concluded)
Under
Budget
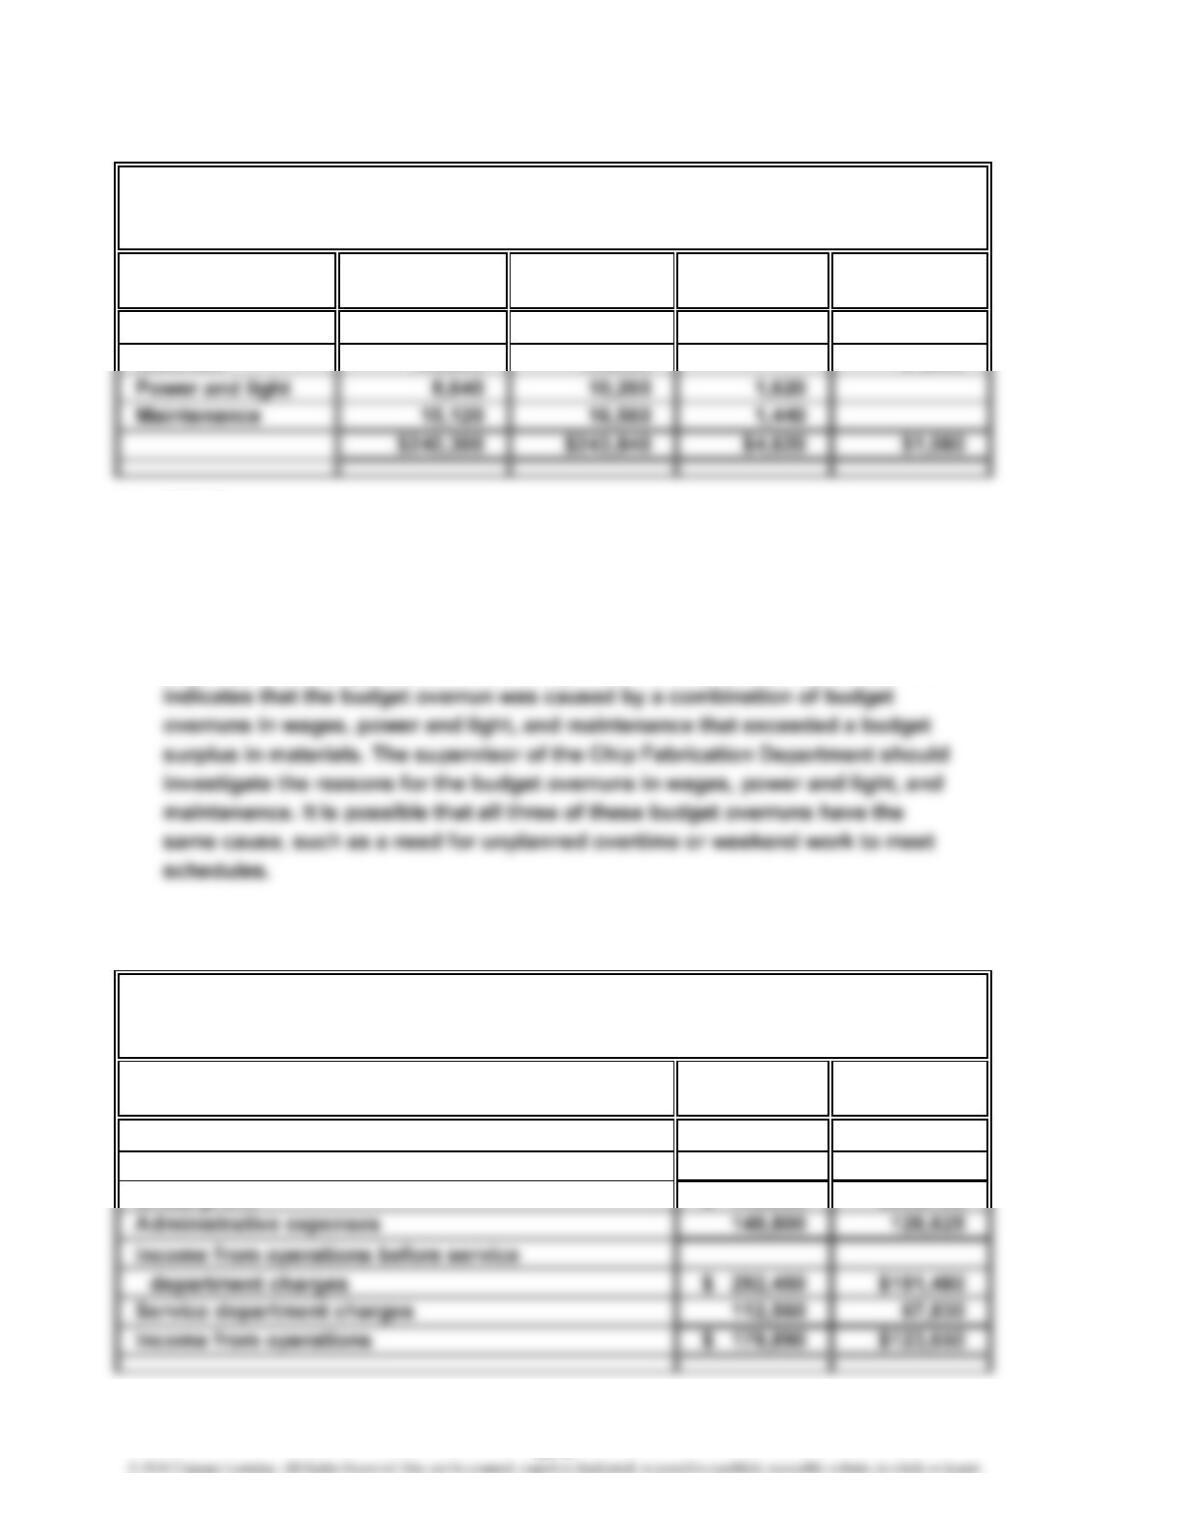
Factory wages
Materials $1,080
b. MEMO
To: Robin Mooney, Vice President of Production
The Western Region plant has experienced a budget overrun, while the Eastern
and Central Region plants have experienced a budget surplus. The budget of the
Western Region plant reveals that the Chip Fabrication Department causes the
majority of the budget overrun. The budget for the Chip Fabrication Department
Ex. 23–2 (FIN MAN); Ex. 8–2 (MAN)
Residential
Division
Net sales $743,780
Cost of goods sold 423,675
Gross profit $320,105
$1,354,500
912,250
$ 442,250
Commercial
Divisional Income Statements
Division
For the Year Ended June 30, 2016
JERSEY COAST CONSTRUCTION COMPANY
155,520
$ 59,940 $1,560
156,600
Budget Actual
$ 61,500
SASKATOON COMPANY
Budget Performance Report—Supervisor, Chip Fabrication
For the Month Ended June 30, 2016
Over
Cost Budget
23-6
CHAPTER 23 Performance Evaluation for Decentralized Operations
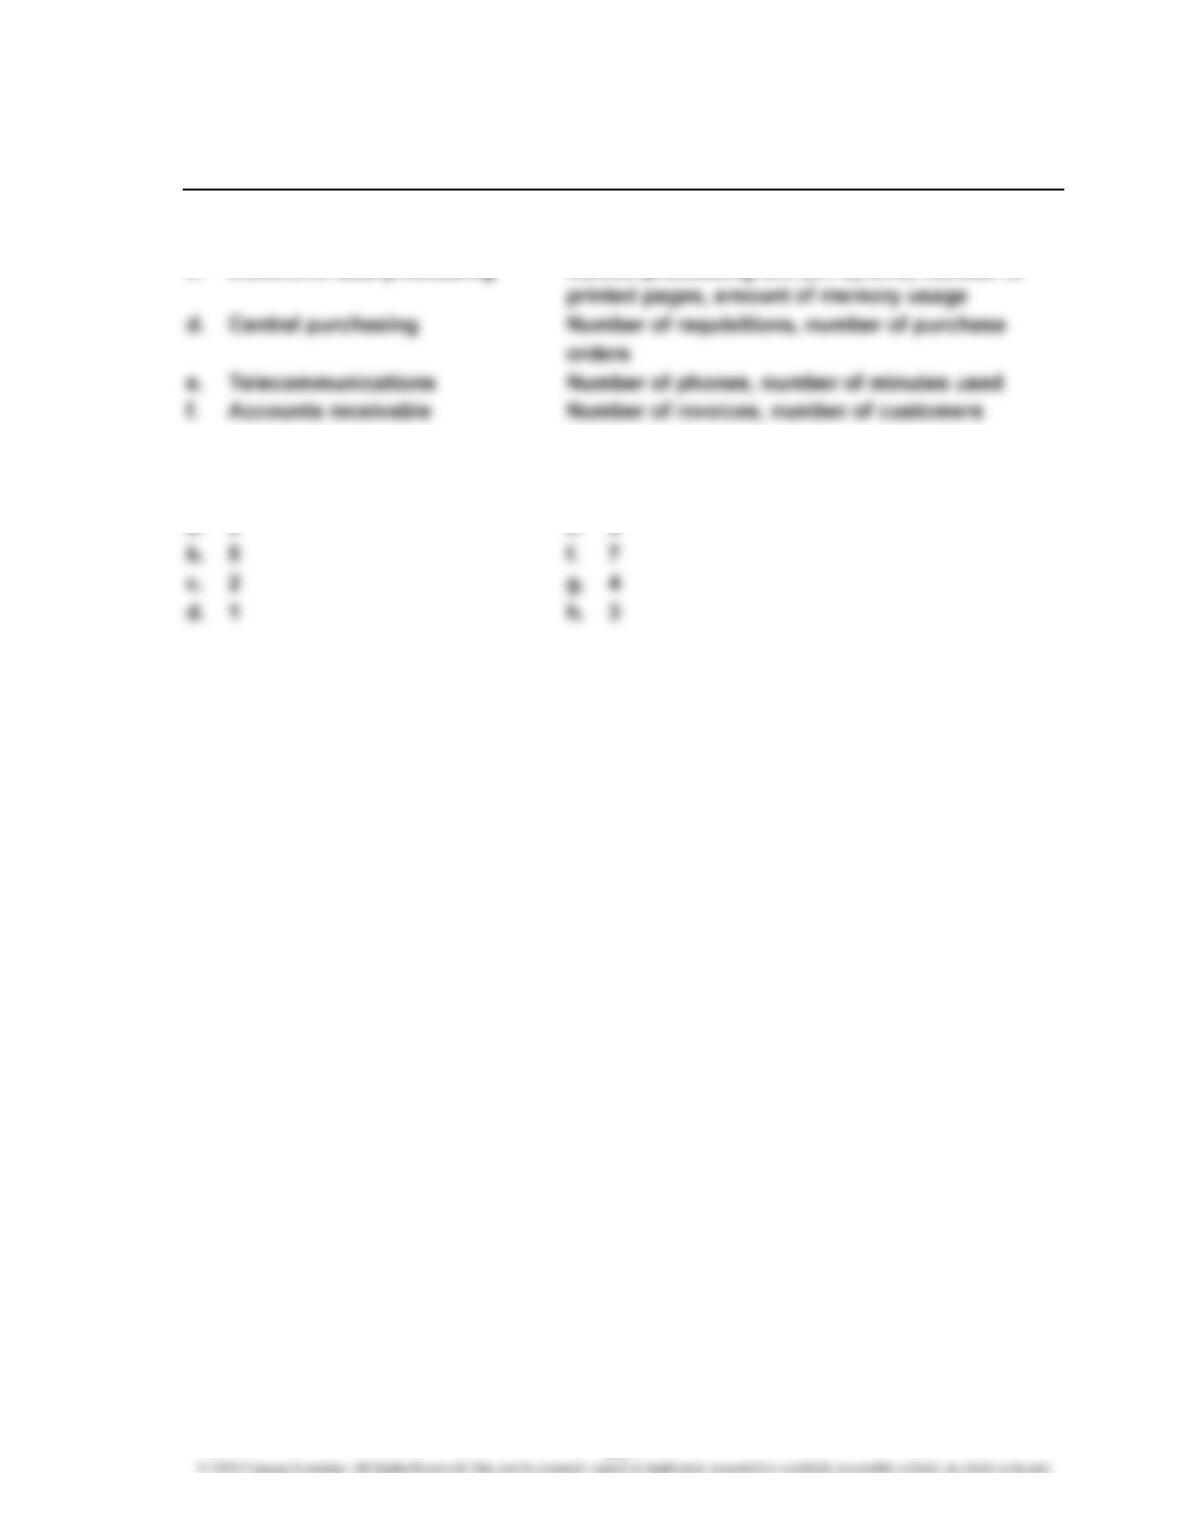
Ex. 23–3 (FIN MAN); Ex. 8–3 (MAN)
Expense Activity Bases
a. Legal Number of hours of legal service
b. Duplication services Number of pages copied
c. Electronic data processing Central processing unit (CPU) time, number of
Ex. 23–4 (FIN MAN); Ex. 8–4 (MAN)
a. 6 e. 8
23-7
CHAPTER 23 Performance Evaluation for Decentralized Operations
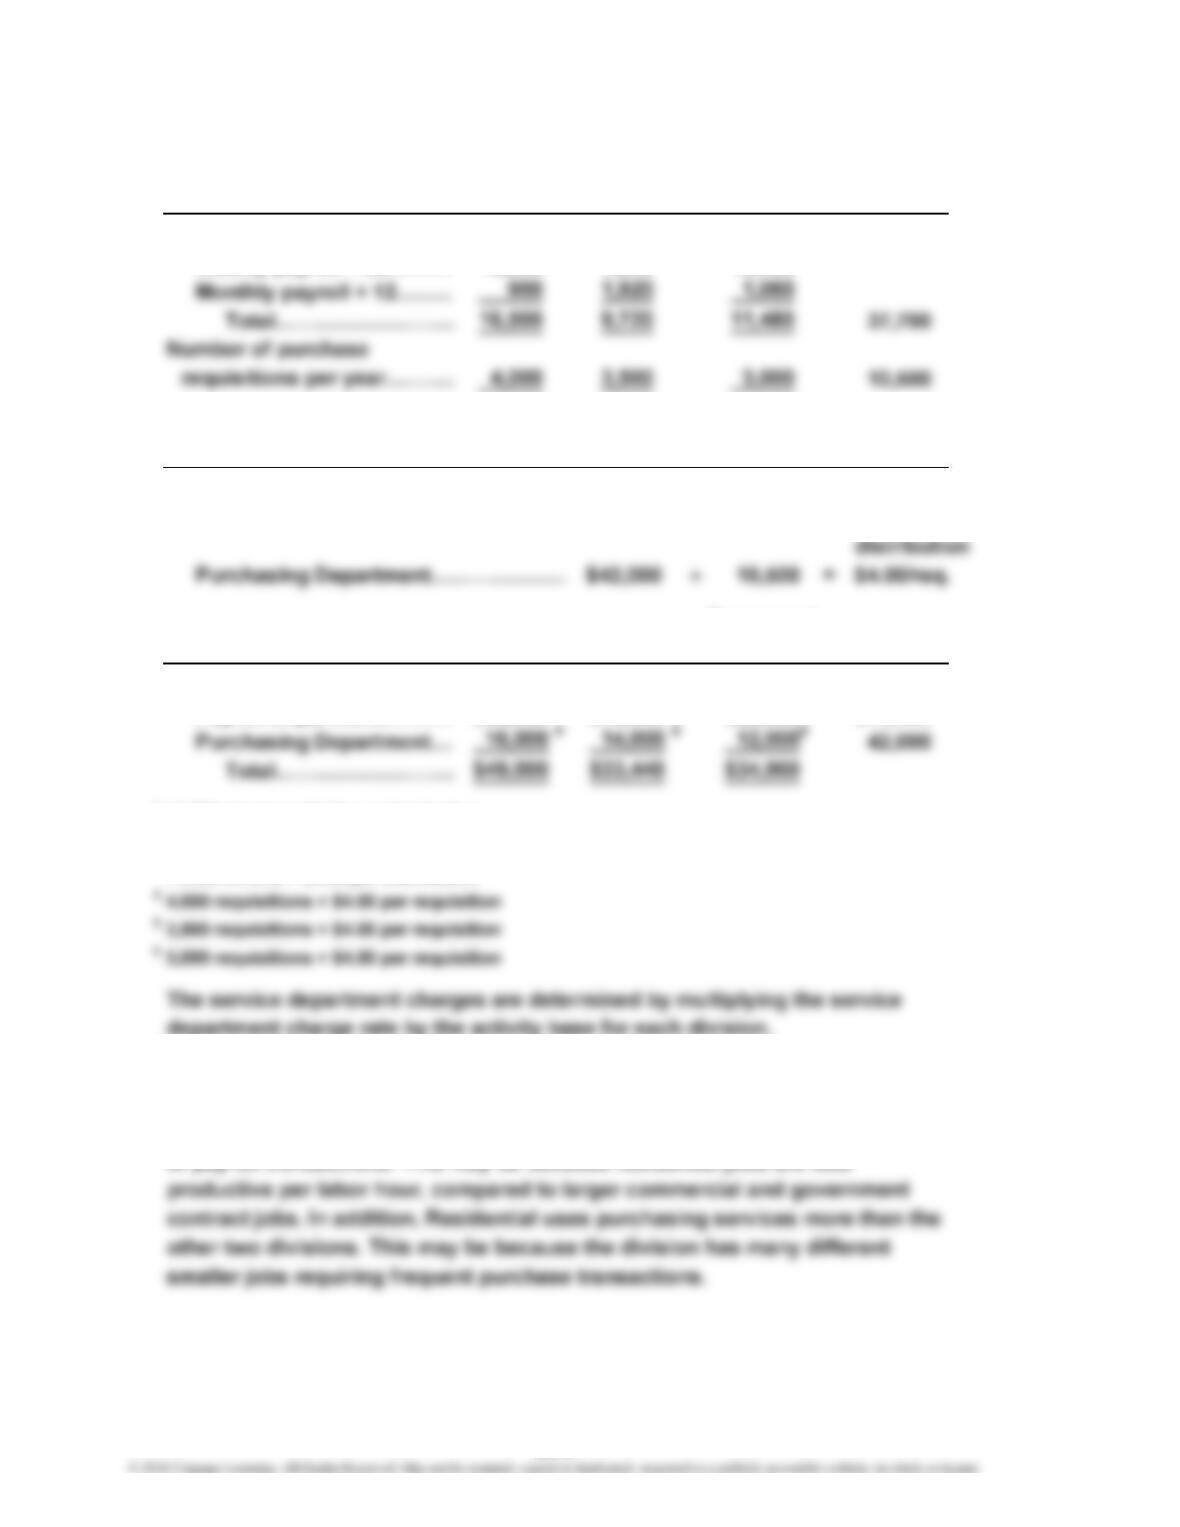
Ex. 23–5 (FIN MAN); Ex. 8–5 (MAN)
Government
a. Residential Commercial Contract Total
Number of payroll checks:
Weekly payroll × 52………
…
15,600 7,800 10,400
Service Activity Charge
b. Dept. Cost ÷ Base = Rate
Service department charge rates:
Payroll Department……………………
…
$75,400
÷
37,700 = $2.00/
Government
Residential Commercial Contract Total
Service department charges:
Payroll Department………
…
$33,000 $19,440 $22,960 $75,400
1
16,500 checks × $2.00 per distribution
2
9,720 checks × $2.00 per distribution
3
11,480 checks × $2.00 per distribution
department charge rate by the activity base for each division.
c. Residential’s service department charge is higher than the other two divisions
because Residential is a heavy user of service department services. Residential
has many employees on a weekly payroll, which translates into a larger number
of payroll transactions. This may be because residential jobs are less
3
21
23-8
CHAPTER 23 Performance Evaluation for Decentralized Operations
Ex. 23–6 (FIN MAN); Ex. 8–6 (MAN)
$160,000
3,200 calls
b. October charges to the COMM sector:
Help desk charge:
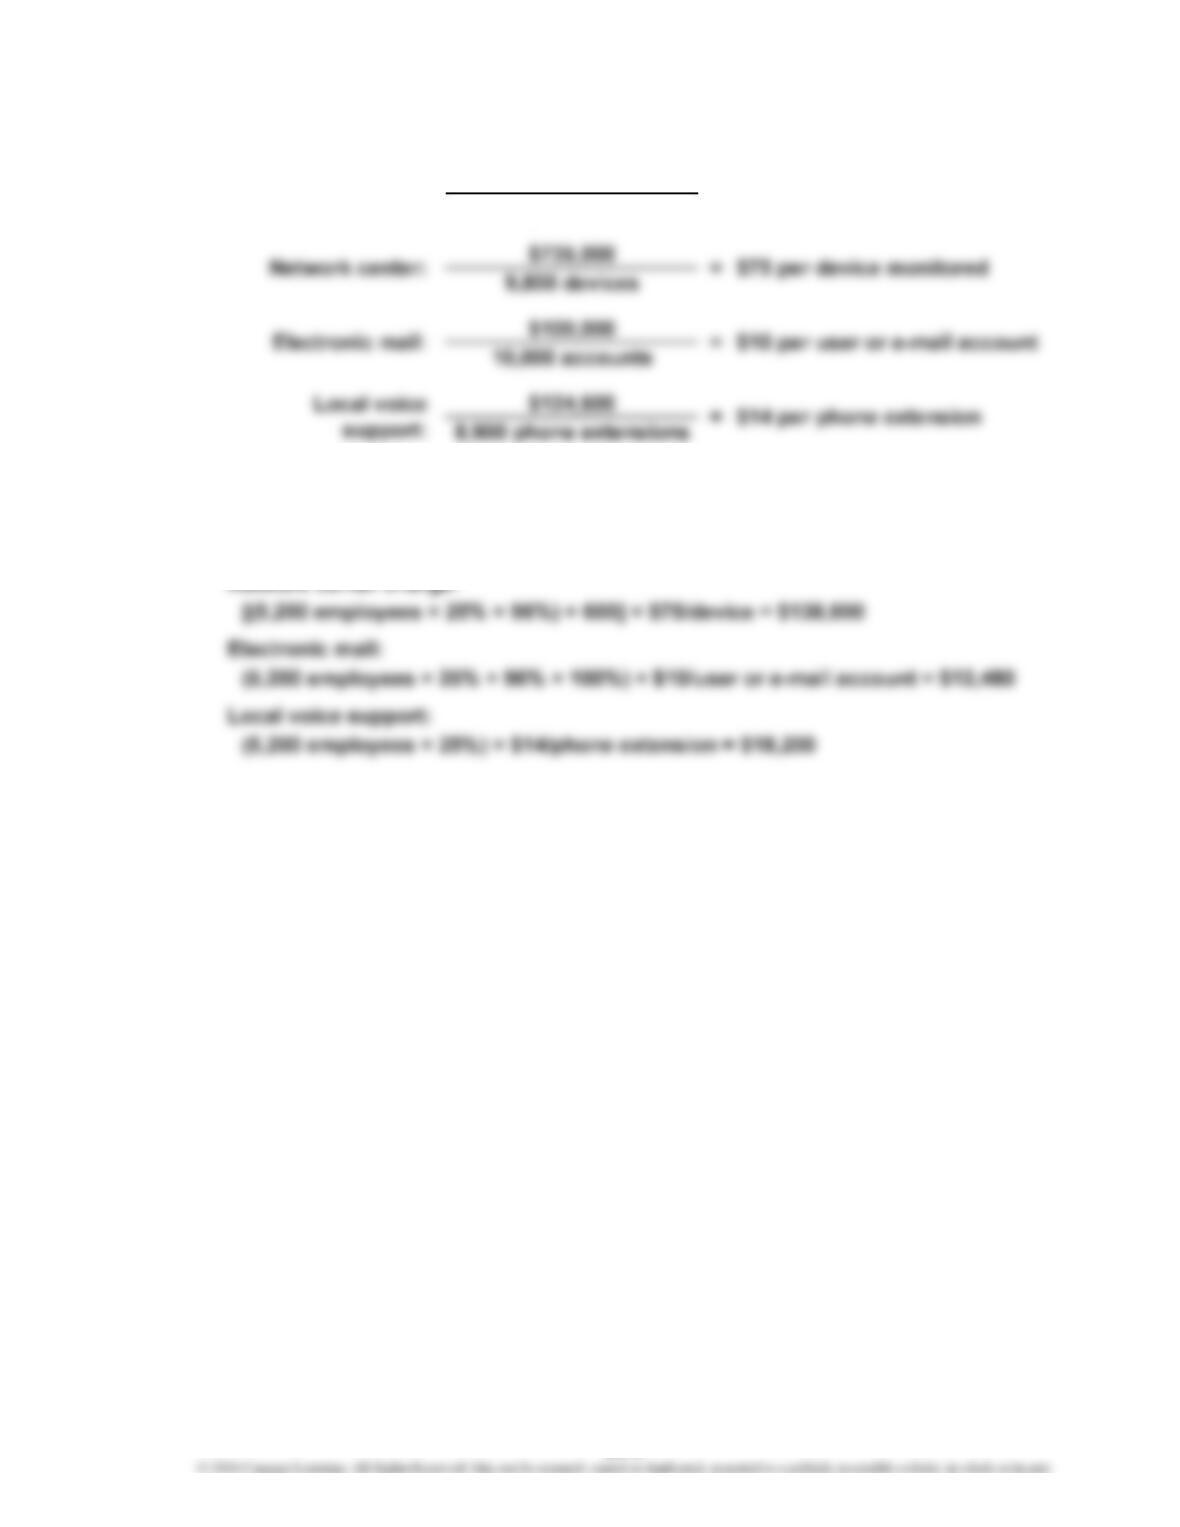
(5,200 employees × 25% × 96% × 1.5) × $50/call = $93,600
a. Help desk:
= $50 per call
23-9
CHAPTER 23 Performance Evaluation for Decentralized Operations
Ex. 23–7 (FIN MAN); Ex. 8–7 (MAN)
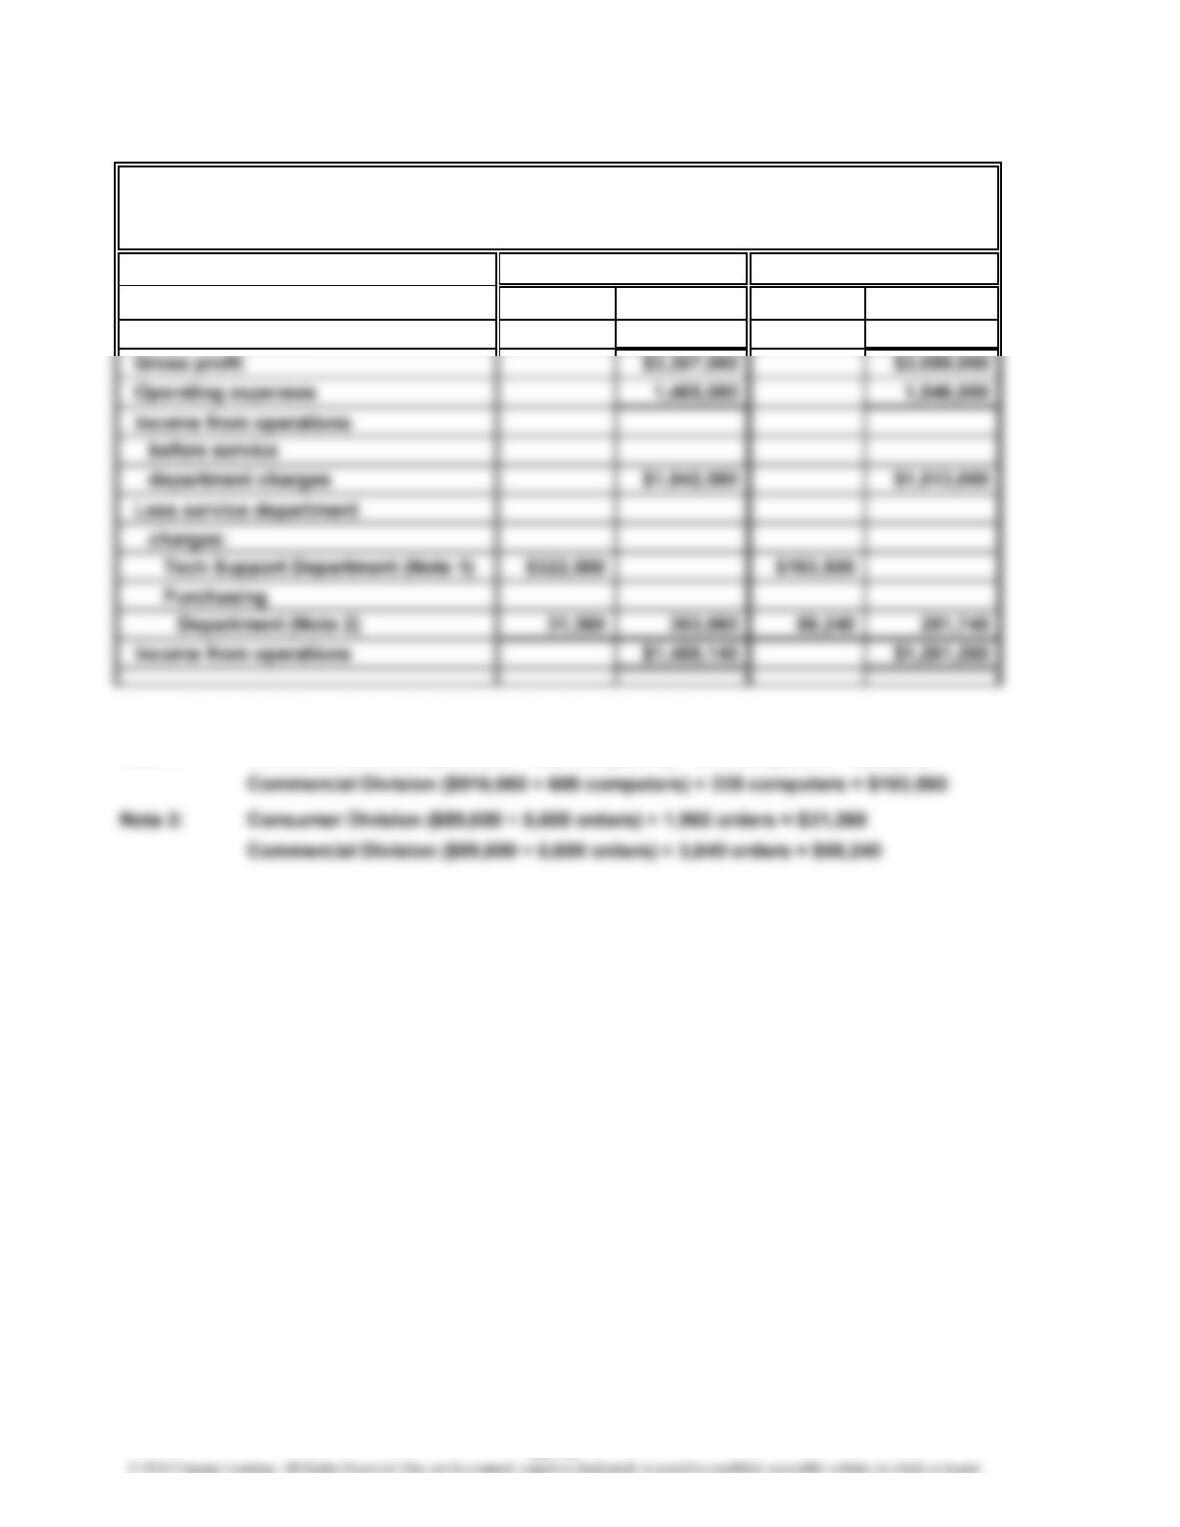
Revenues $7,430,000 $6,184,000
Cost of goods sold 4,123,000 3,125,000
Supporting calculations for controllable service department charges:
Note 1: Consumer Division ($516,000 ÷ 600 computers) × 375 computers = $322,500
YOZAMBA TECHNOLOGY
Divisional Income Statements
For the Year Ended December 31, 2016
Consumer Division Commercial Division
23-10
CHAPTER 23 Performance Evaluation for Decentralized Operations
Ex. 23–8 (FIN MAN); Ex. 8–8 (MAN)
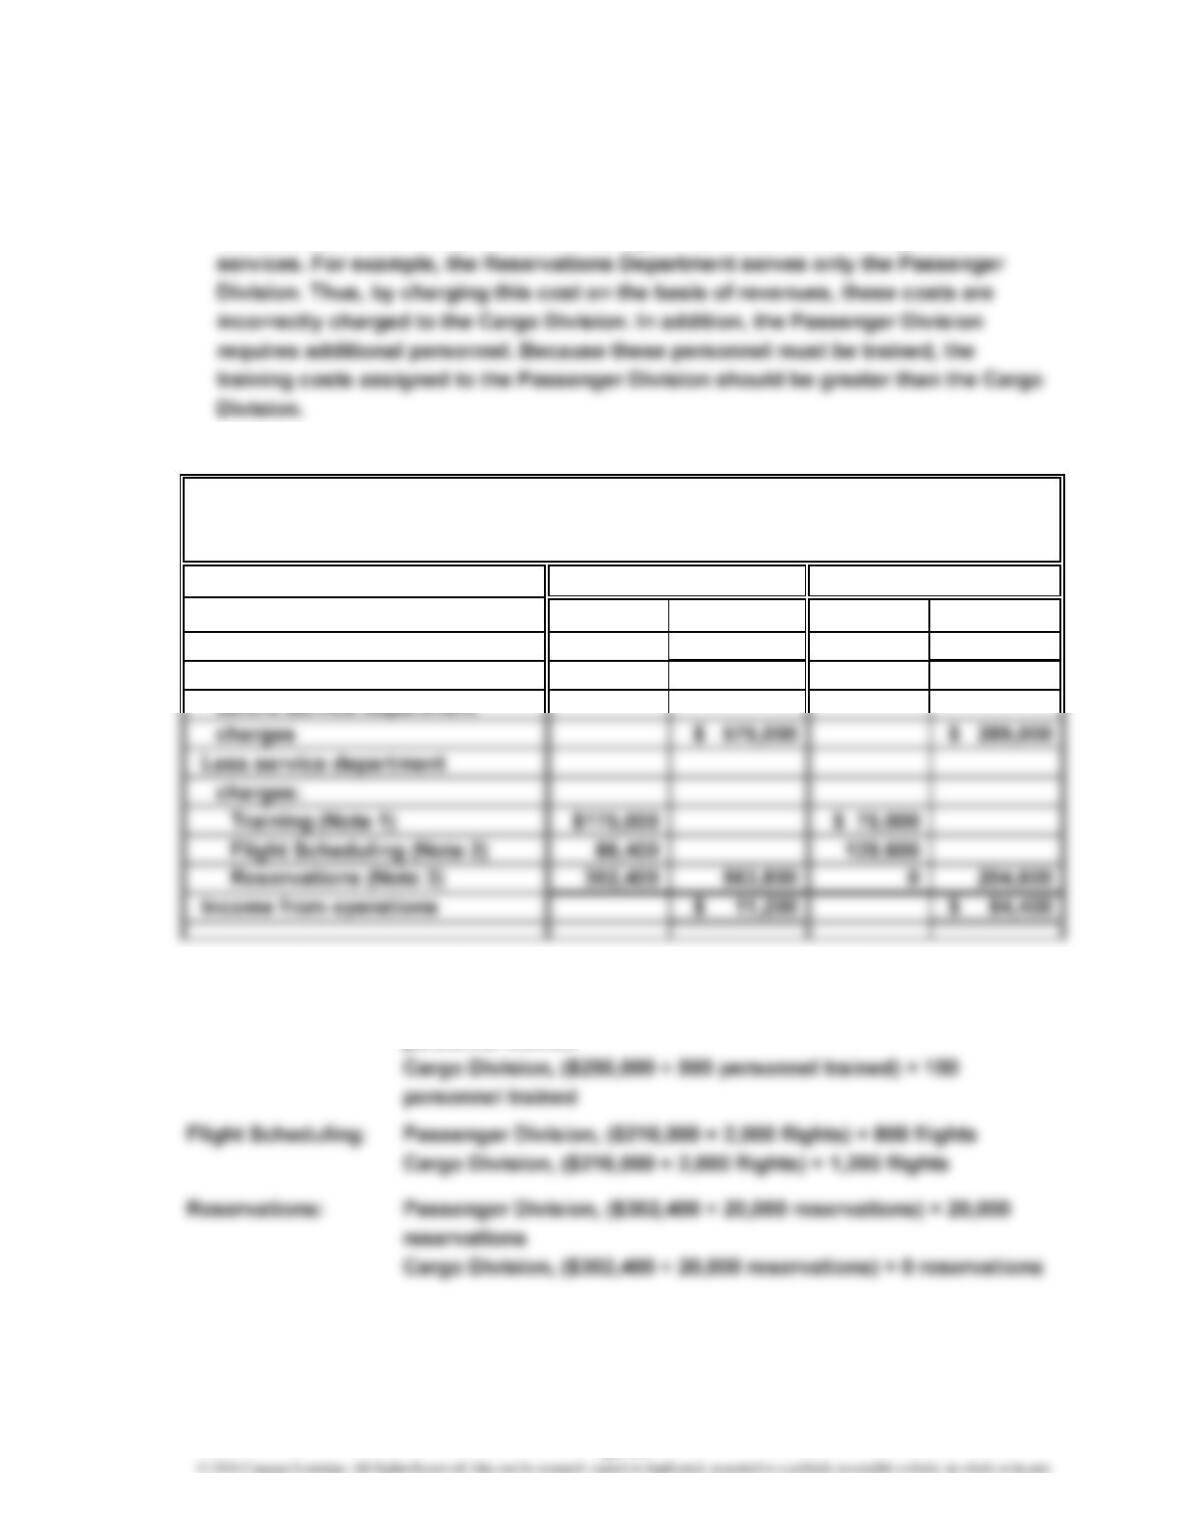
a. The reported income from operations does not accurately measure performance
because the service department charges are based on revenues. Revenues are
not associated with the profit center manager’s use of the service department
b.
Revenues $3,025,000 $3,025,000
Operating expenses 2,450,000 2,736,000
Income from operations
Supporting calculations for controllable service department charges:
Training: Passenger Division, ($250,000 ÷ 500 personnel trained) × 350
personnel trained
WILD SUN AIRLINES INC.
Divisional Income Statements
For the Year Ended December 31, 2016
Passenger Division Cargo Division
23-11
CHAPTER 23 Performance Evaluation for Decentralized Operations
Ex. 23–9 (FIN MAN); Ex. 8–9 (MAN)
Winter Summer
Sports Sports
Division Division
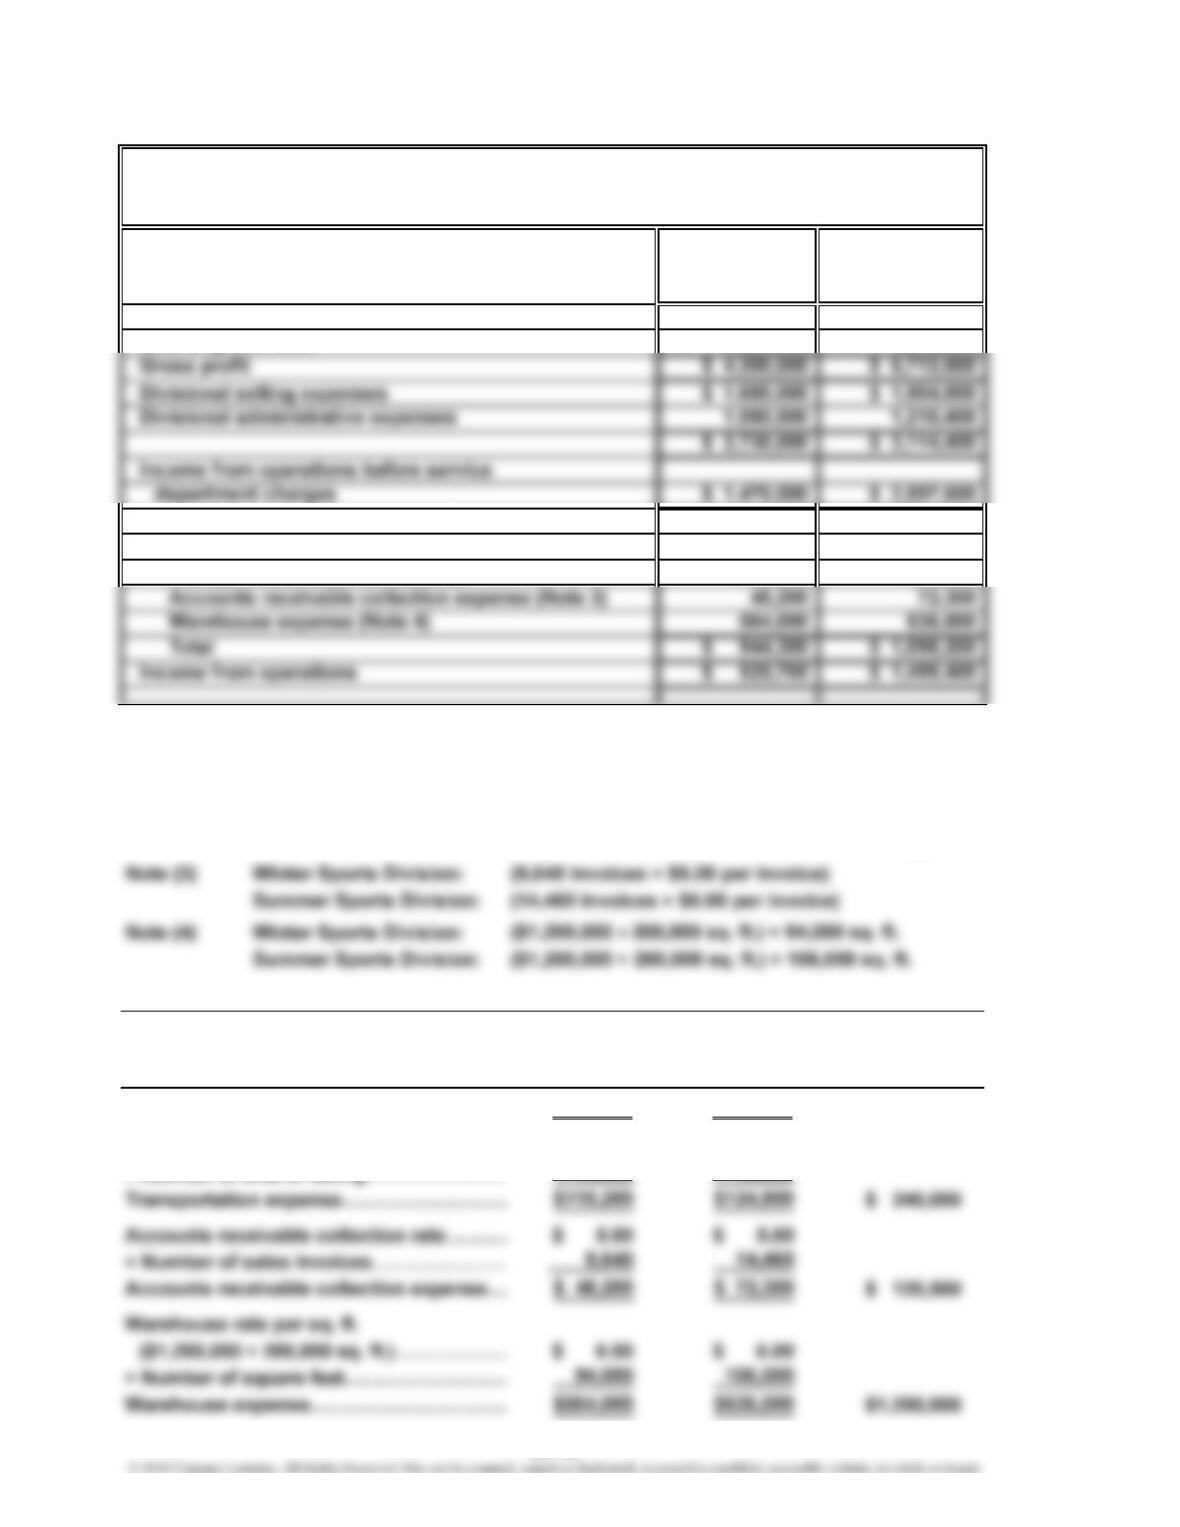
Sales $10,500,000 $13,600,000
Cost of goods sold 6,300,000 7,888,000
Less service department charges:
Advertising expense (Note 1) $ 216,900 $ 265,100
Transportation expense (Note 2) 115,200 124,800
Supporting Schedule:
Note (1) Winter Sports Division: $216,900
Summer Sports Division: $265,100
Note (2) Winter Sports Division: (14,400 bills of lading × $8.00 per bill of lading)
Summer Sports Division: (15,600 bills of lading × $8.00 per bill of lading)
Winter Summer
Sports Sports
Division Division Total
Advertising expense…………………………
…
$216,900 $265,100 $ 482,000
Transportation rate per bill of lading……
…
$ 8.00 $ 8.00
× Number of bills of lading…………………
…
14,400 15,600
…
Service Department Charges
XSPORT SPORTING GOODS CO.
Divisional Income Statements
For the Year Ended December 31, 2016
23-12
CHAPTER 23 Performance Evaluation for Decentralized Operations
Ex. 23–10 (FIN MAN); Ex. 8–10 (MAN)
a. Retail Division: 26% ($343,200 ÷ $1,320,000)
b. Retail Division
Ex. 23–11 (FIN MAN); Ex. 8–11 (MAN)
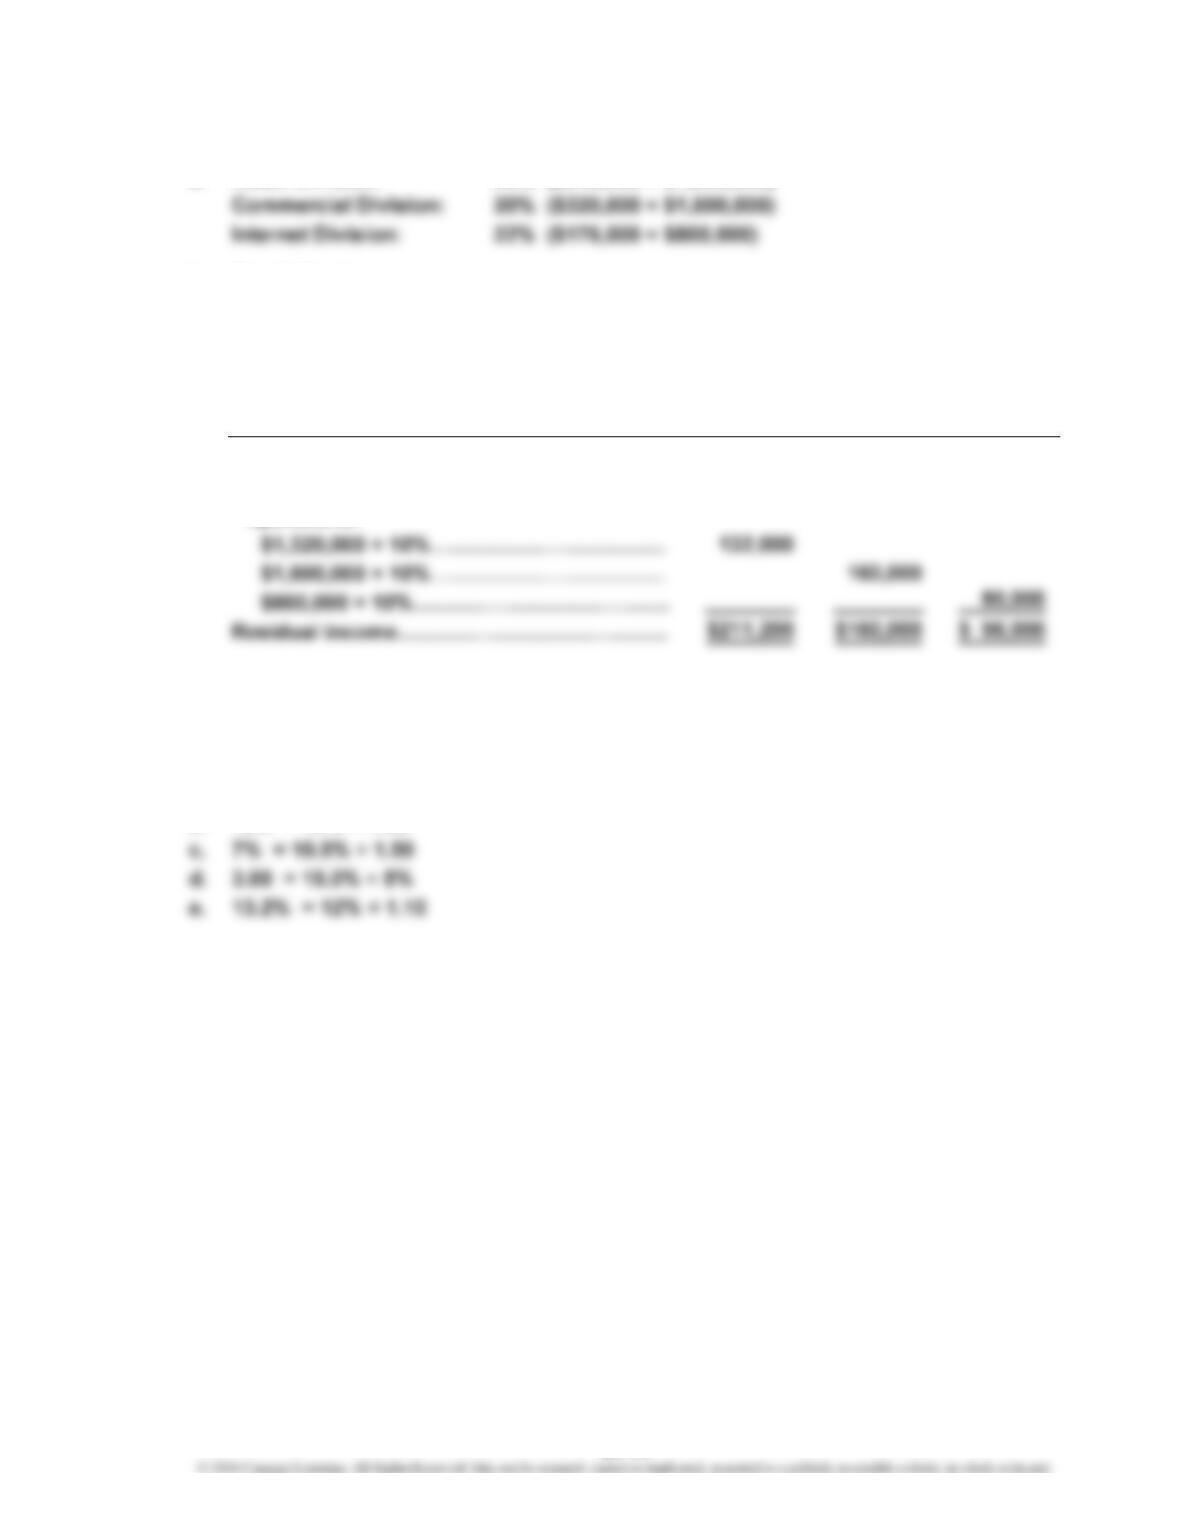
a. Retail Commercial Internet
Division Division Division
Income from operations………………………
…
$343,200 $320,000 $176,000
Minimum amount of income from
operations:
b. Retail Division
Ex. 23–12 (FIN MAN); Ex. 8–12 (MAN)
a. 2.20 = 13.2% ÷ 6%
b. 18% = 10% × 1.80
23-13
CHAPTER 23 Performance Evaluation for Decentralized Operations
Ex. 23–13 (FIN MAN); Ex. 8–13 (MAN)
Sales
Invested Assets
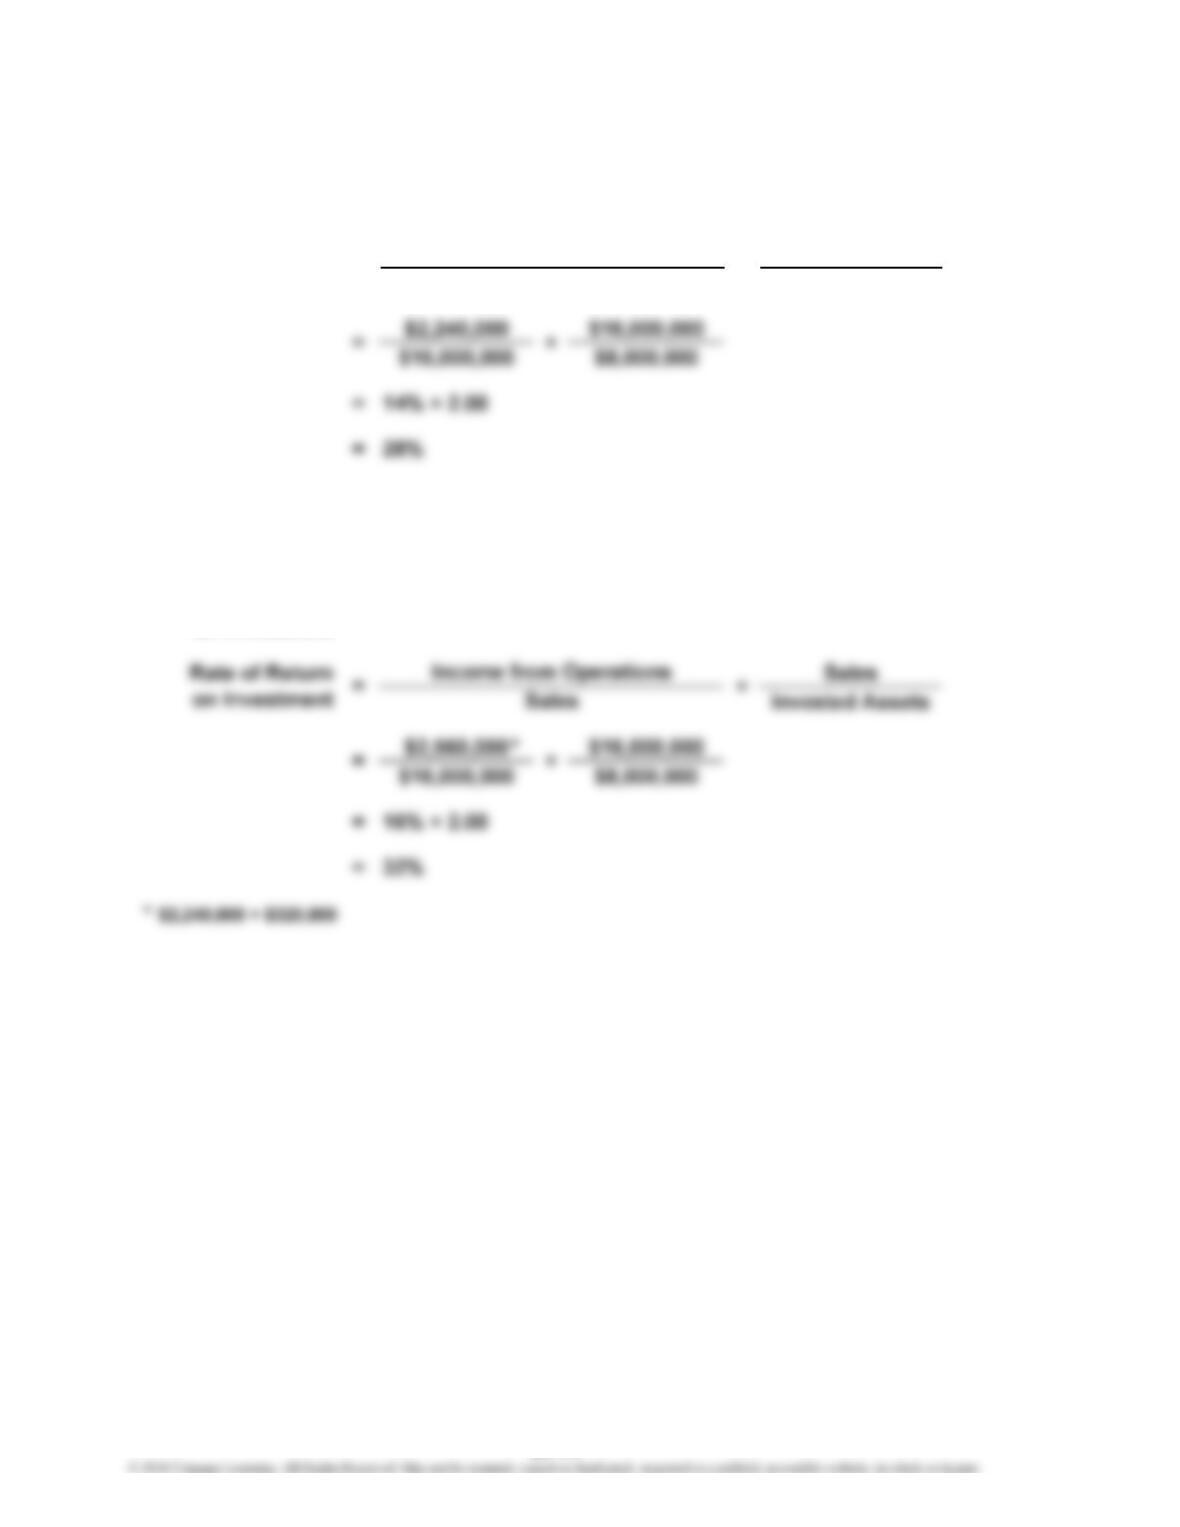
b. The profit margin would increase from 14% to 16%, the investment turnover
would remain unchanged, and the rate of return on investment would increase
from 28% to 32%, as shown below.
×
=
Rate of Return
on Investment Sales
Income from Operations
a. Rate of Return
on Investment = Profit Margin × Investment Turnover
Rate of Return
on Investment = Profit Margin × Investment Turnover
23-14
CHAPTER 23 Performance Evaluation for Decentralized Operations
Ex. 23–14 (FIN MAN); Ex. 8–14 (MAN)
Revenues
Invested Assets
$6,818 $20,356
$20,356 $28,627
= 33.5% × 0.71
= 23.8% (rounded)
$661 $5,979
$5,979 $14,750
$1,112 $3,811
$3,811 $7,506
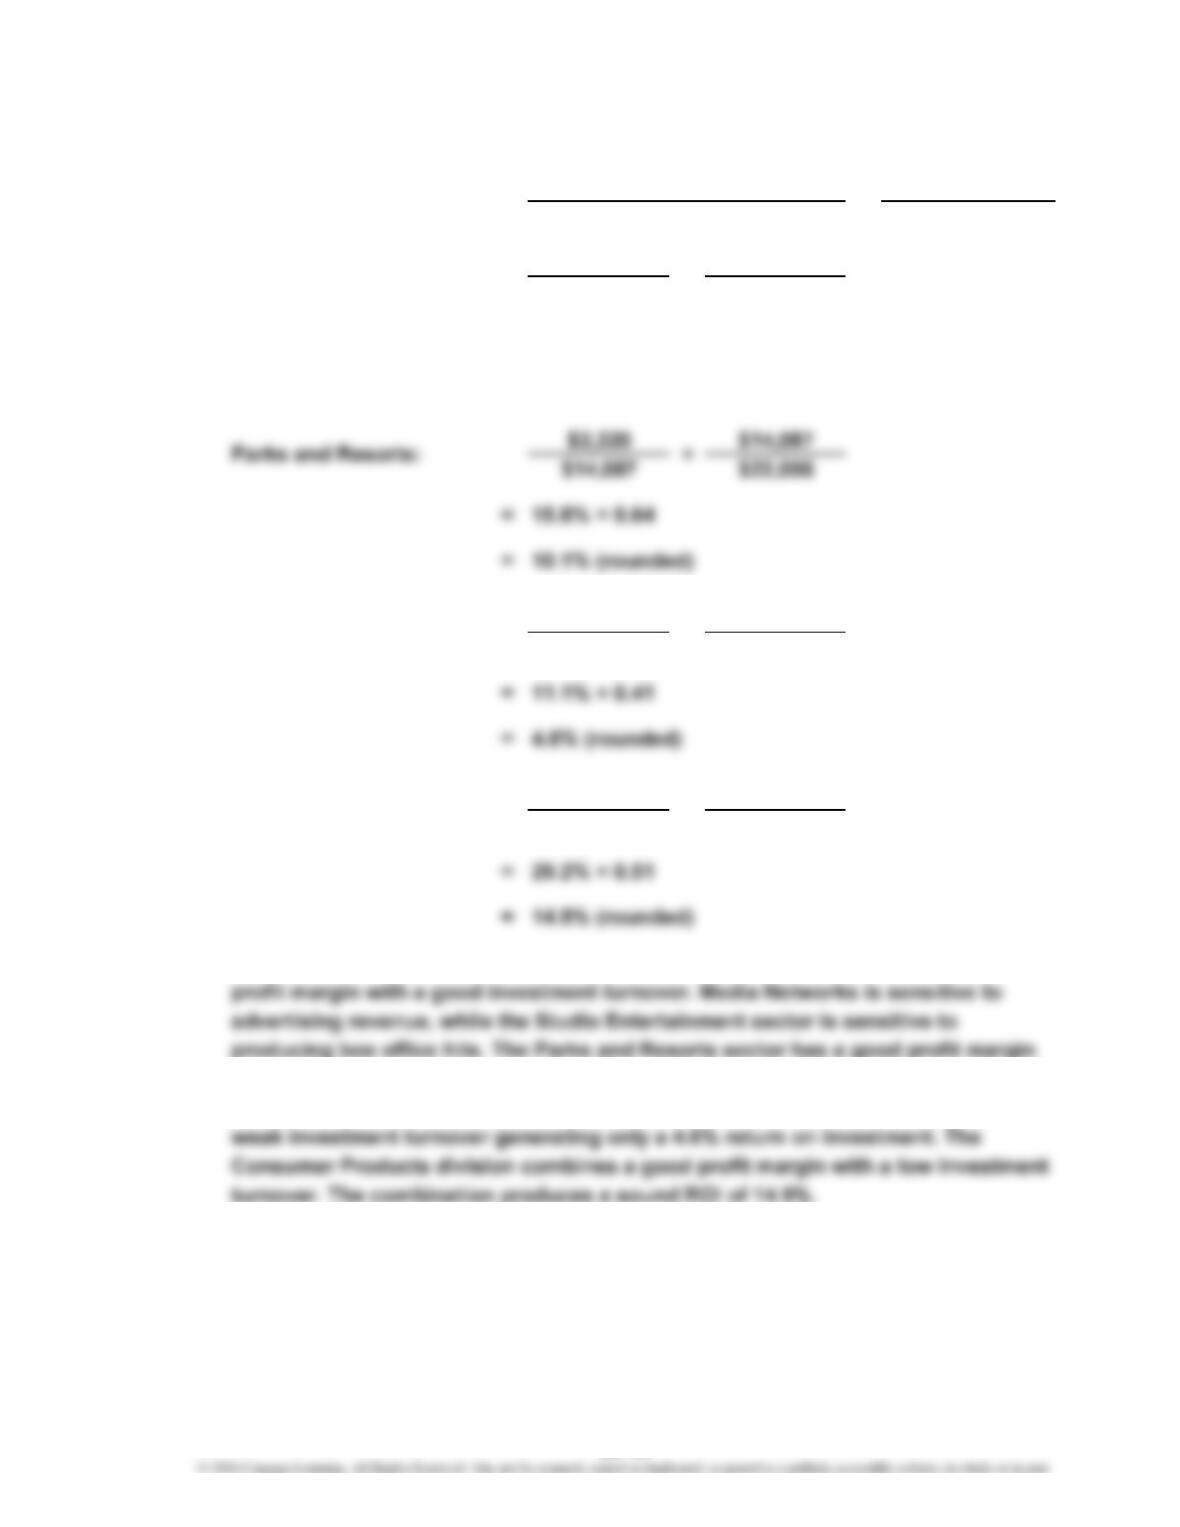
b. The four sectors are different from each other. Media Networks combines a good
at 15.8% with an average investment turnover. The combination produces a
respectable ROI of 10.1%. Studio Entertainment has a weak profit margin and a
Studio Entertainment: ×
Consumer Products: ×
=
Rate of Return
on Investment
a. ×
Media Networks: ×
Revenues
Income from Operations
23-15
CHAPTER 23 Performance Evaluation for Decentralized Operations
Ex. 23–15 (FIN MAN); Ex. 8–15 (MAN)
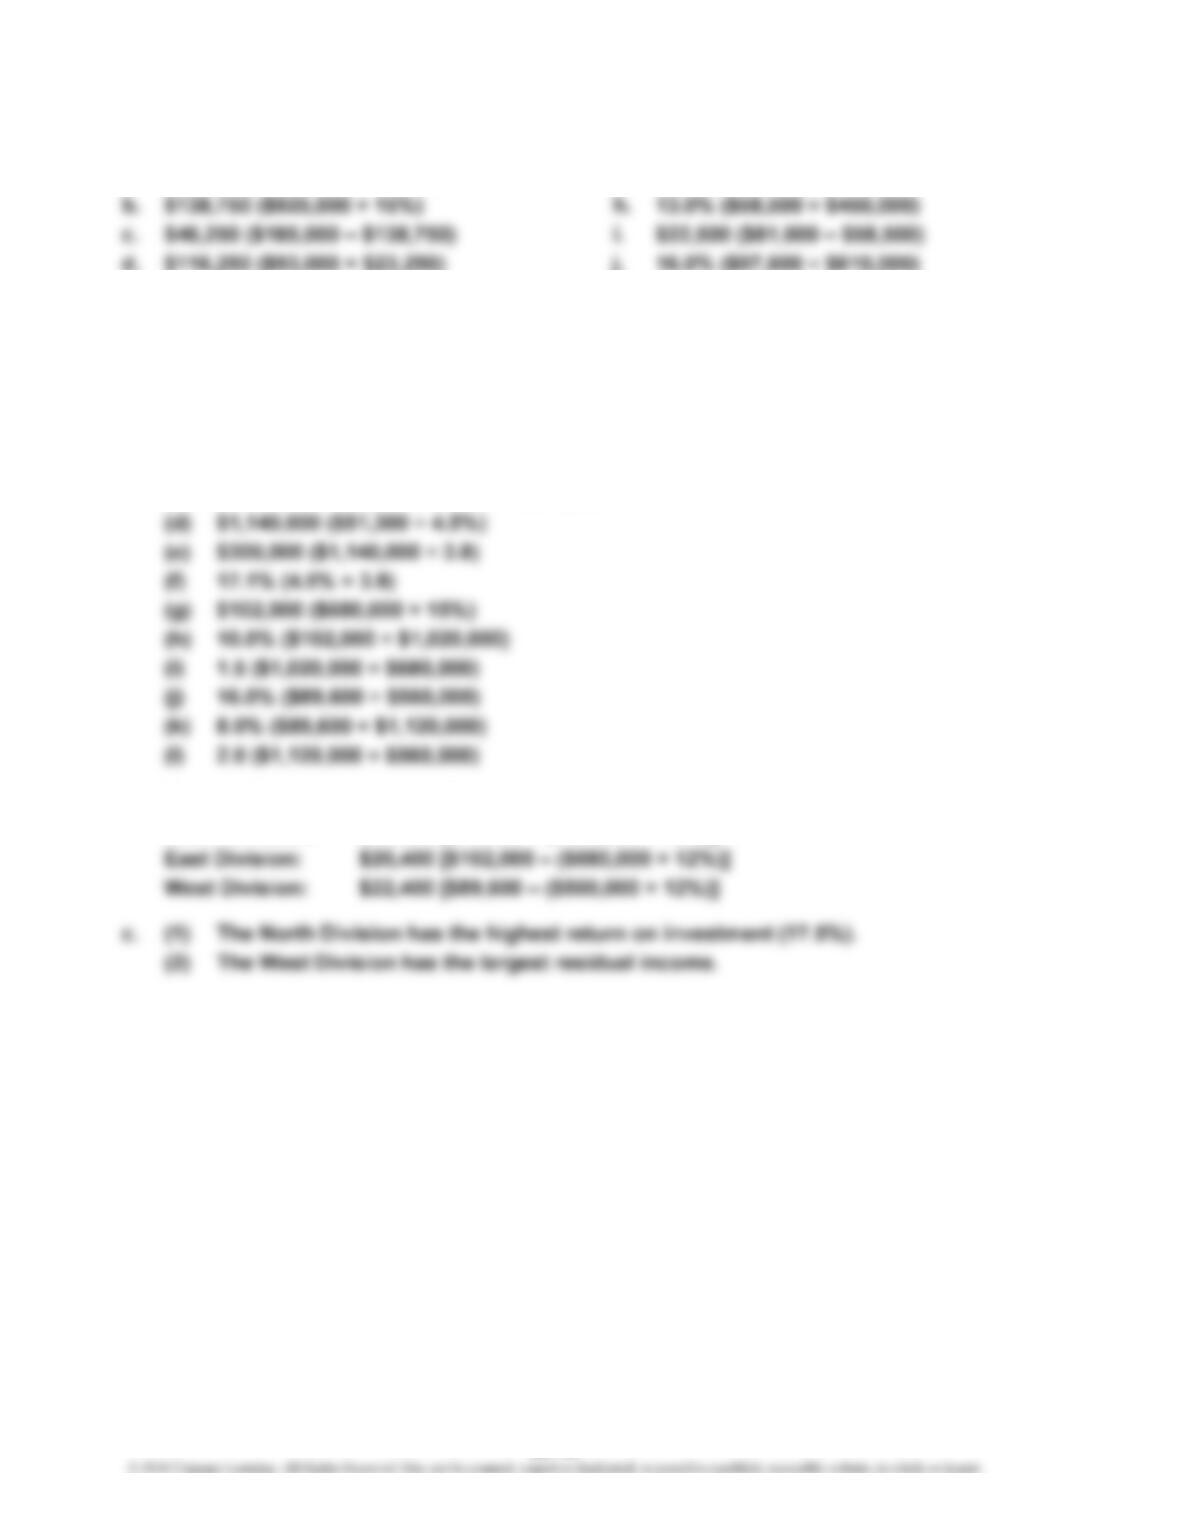
a. 20.0% ($185,000 ÷ $925,000) g. $81,000 ($450,000 × 18%)
e. 15.0% ($116,250 ÷ $775,000) k. $73,200 ($610,000 × 12%)
f. 12.0% ($93,000 ÷ $775,000) l. $24,400 ($97,600 – $73,200)
Ex. 23–16 (FIN MAN); Ex. 8–16 (MAN)
a. (a) $60,200 ($860,000 × 7%)
(b) $344,000 ($60,200 ÷ 17.5%)
(c) 2.5 (17.5% ÷ 7%) or $860,000 ÷ $344,000
b. North Division: $18,920 [$60,200 – ($344,000 × 12%)]
South Division: $15,300 [$51,300 – ($300,000 × 12%)]
23-16
CHAPTER 23 Performance Evaluation for Decentralized Operations
Ex. 23–17 (FIN MAN); Ex. 8–17 (MAN)
Revenues
Invested Assets
$105 $688
$688 $2,139
b.
Vacation
Ownership
Income from operations……………………………
…
$105
Less: Minimum return (5% of assets)…………… 107
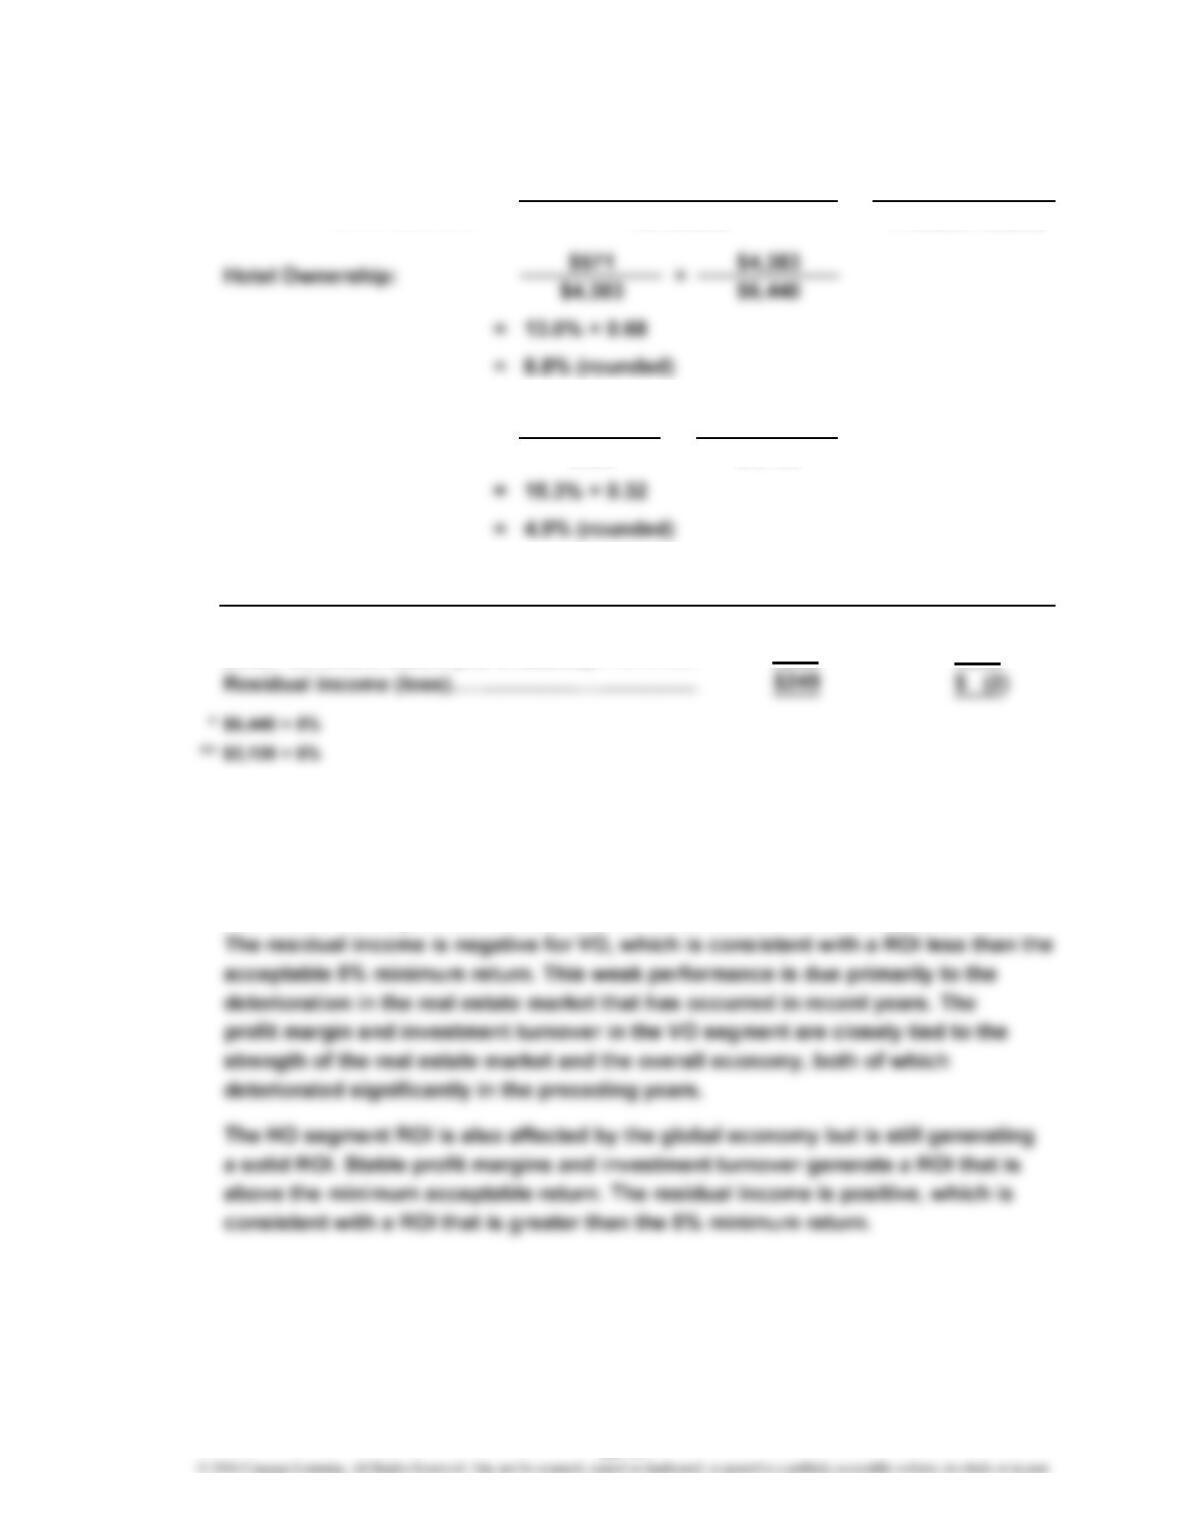
c. The Vacation Ownership (VO) segment has the weakest return on investment,
which is mainly the result of a weak investment turnover. The VO segment earns
profit margins that are higher than the profit margins in the Hotel Ownership (HO)
segment (15.3% vs. 13.0%). However, weak investment turnover is causing the
ROI for the VO segment to be less than the assumed minimum acceptable return.
$571
Ownership
Hotel
Income from Operations
322
a.
Vacation Ownership: ×
× =
Rate of Return
on Investment Revenues
***
23-17
CHAPTER 23 Performance Evaluation for Decentralized Operations
Ex. 23–18 (FIN MAN); Ex. 8–18 (MAN)
Although there is some judgment in classifying each of these measures, the following
represents the author’s assessment with explanations:
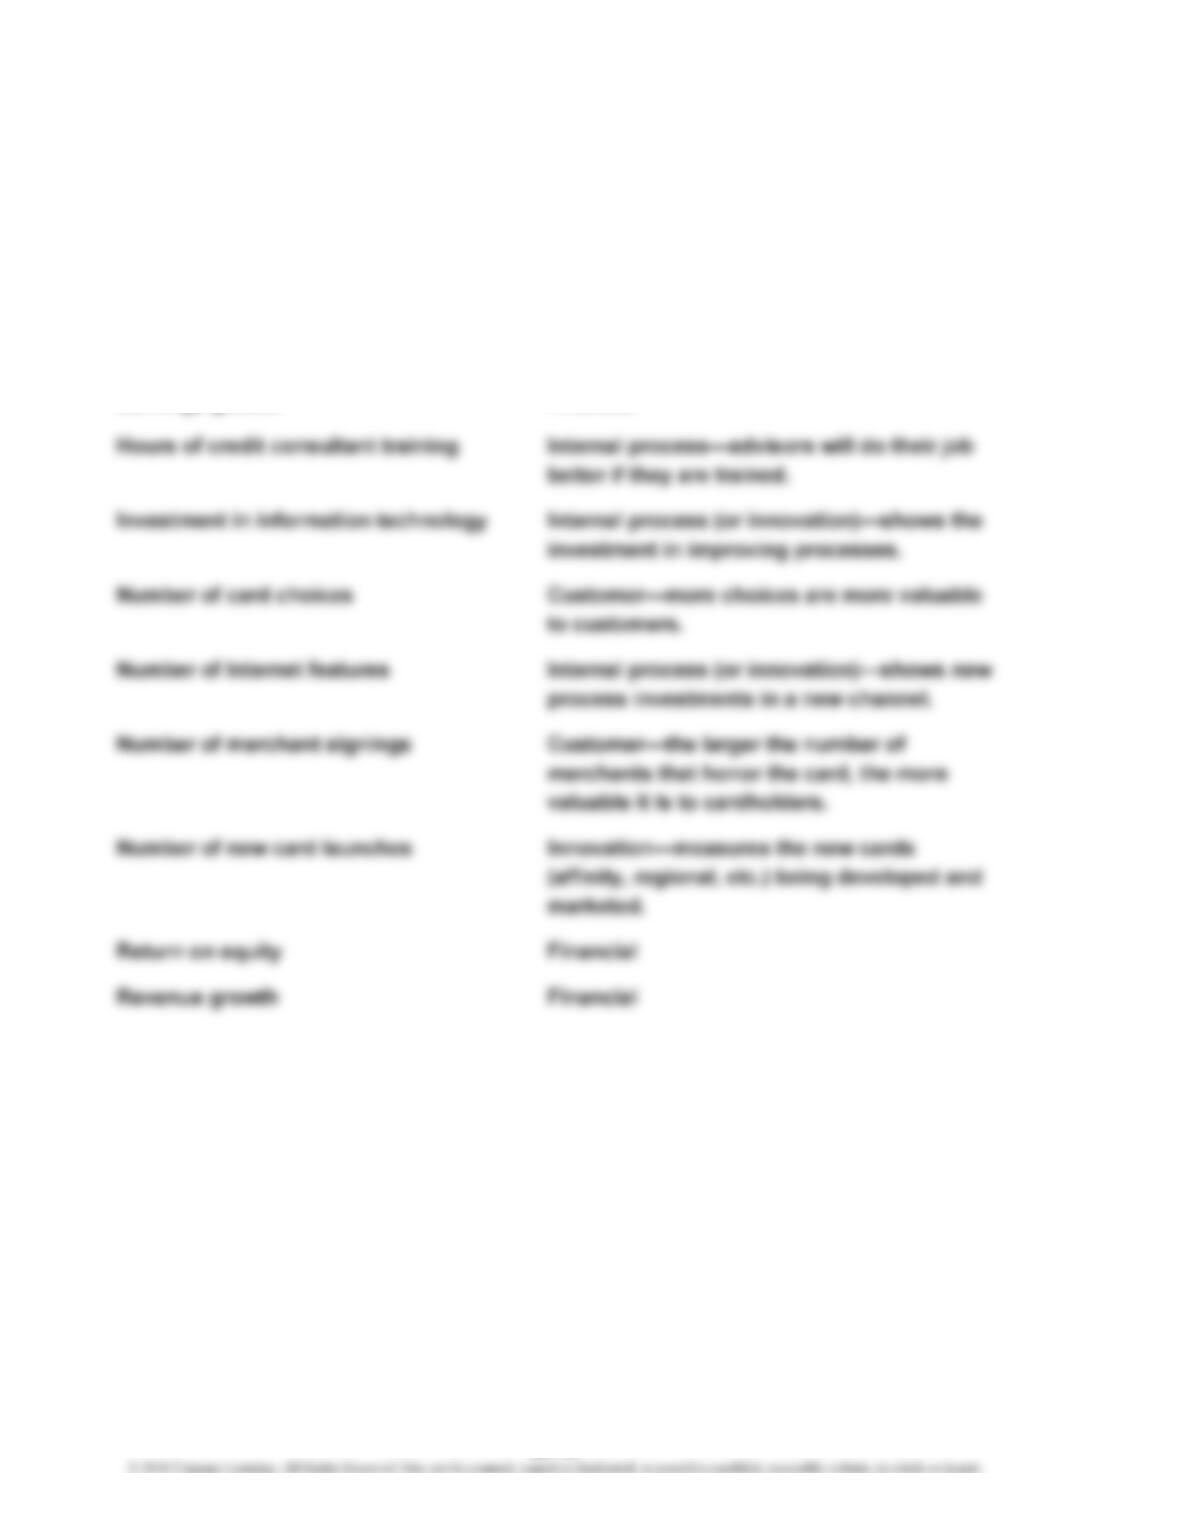
Average card member spending Customer—demonstrates the usefulness of
the card to the customer.
Cards in force Customer—if customers did not value the
card, they would not have one.
Earnings growth Financial
23-18
CHAPTER 23 Performance Evaluation for Decentralized Operations
Ex. 23–19 (FIN MAN); Ex. 8–19 (MAN)
This exercise is intended to spark discussion around using the balanced scorecard
in an emerging business. Some possible metrics are included below.
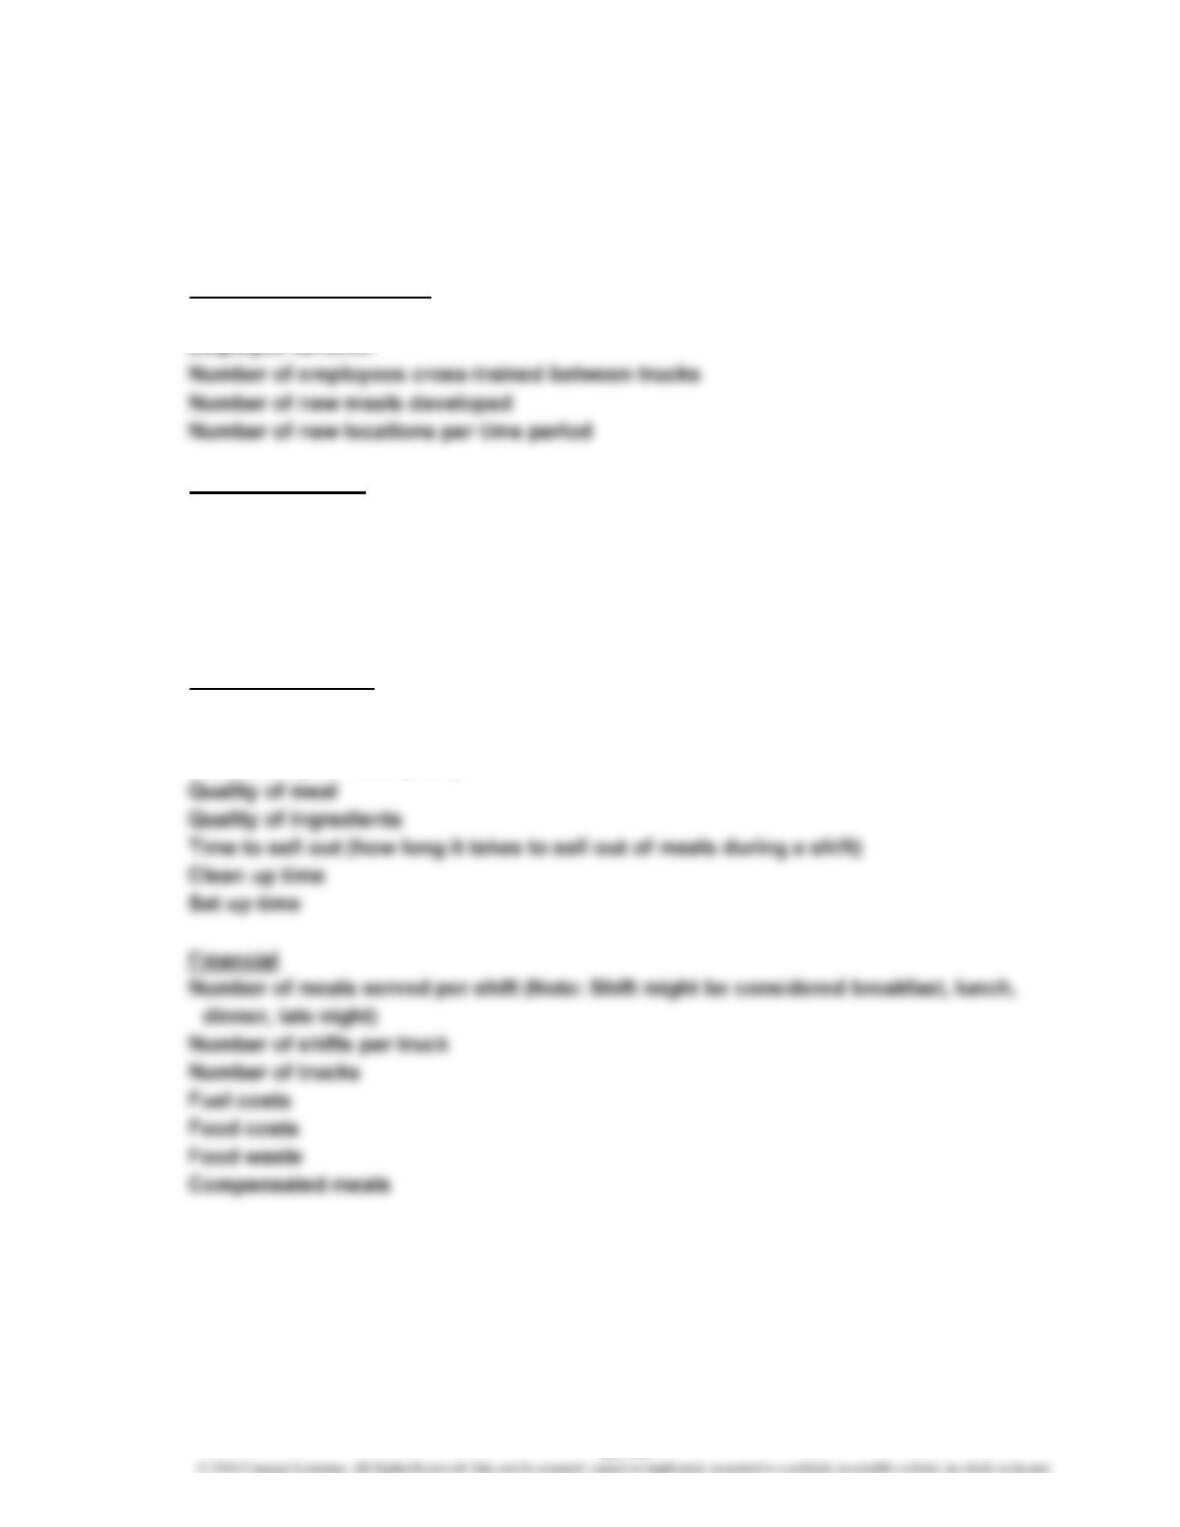
Innovation and Learning
Number of training hours
Customer Service
Number of new customers
Retaining existing customers
Quality of food
Quality of customer interaction
Speed of the experience (how quickly customers can be served)
Internal Processes
Order delivery time
Consistency of portion size
Consistency of meal quality
23-19
CHAPTER 23 Performance Evaluation for Decentralized Operations
Ex. 23–20 (FIN MAN); Ex. 8–20 (MAN)
a. Increase in XPort Industries’ Market Variable Cost Unit
Income from Operations = Price – per Unit × Transferred
$3,000,000 =($210 –$160) × 60,000
Ex. 23–21 (FIN MAN); Ex. 8–21 (MAN)
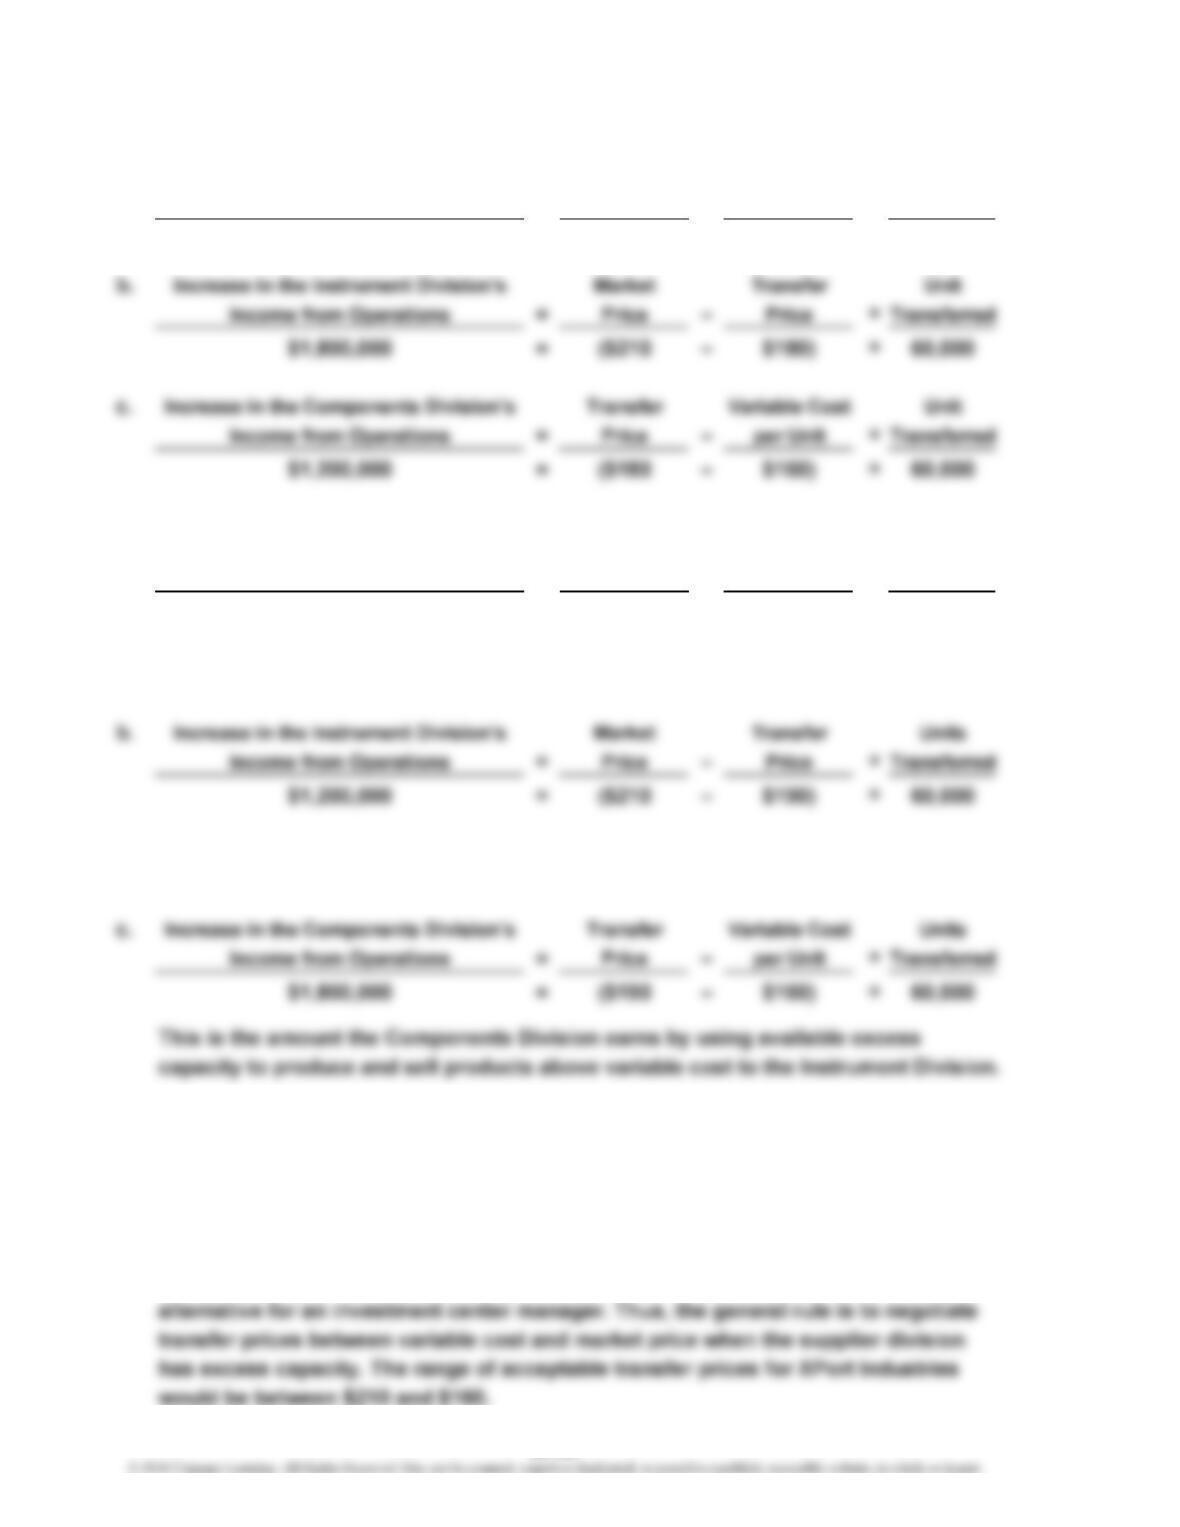
a. Increase in XPort Industries’ Market Variable Cost Units
Income from Operations = Price – per Unit × Transferred
$3,000,000 =($210 –$160) × 60,000
This amount is the same amount by which XPort Industries’ income from
operations increased in Ex. 23–20, when a transfer price of $180 was used.
This is the amount the Instrument Division saves by purchasing from the
Components Division at an internal price that is lower than the market price.
d. Any transfer price will cause the total income of the company to increase, as long
as the supplier division capacity is used toward making materials for products that
are ultimately sold to the outside. However, transfer prices should be set between
variable cost and the market price in order to give the division managers proper
incentives. A transfer price set below variable cost would cause the supplier
division to incur a loss, while a transfer price set above market price would cause
the purchasing division to incur opportunity costs. Neither situation is an attractive
23-20