CHAPTER 23 Performance Evaluation Using Variances from Standard Costs
Ex. 23–15
Direct labor hours 18,000 20,000 22,000
Variable overhead cost:
Indirect factory labor $162,000 $180,000 $198,000
Power and light 10,800 12,000 13,200
LENO MANUFACTURING COMPANY
Factory Overhead Cost Budget—Press Department
For the Month Ended November 30
1
2
23-21
CHAPTER 23 Performance Evaluation Using Variances from Standard Costs
Ex. 23–16
a.
Direct labor hours 9,000 10,000 11,000
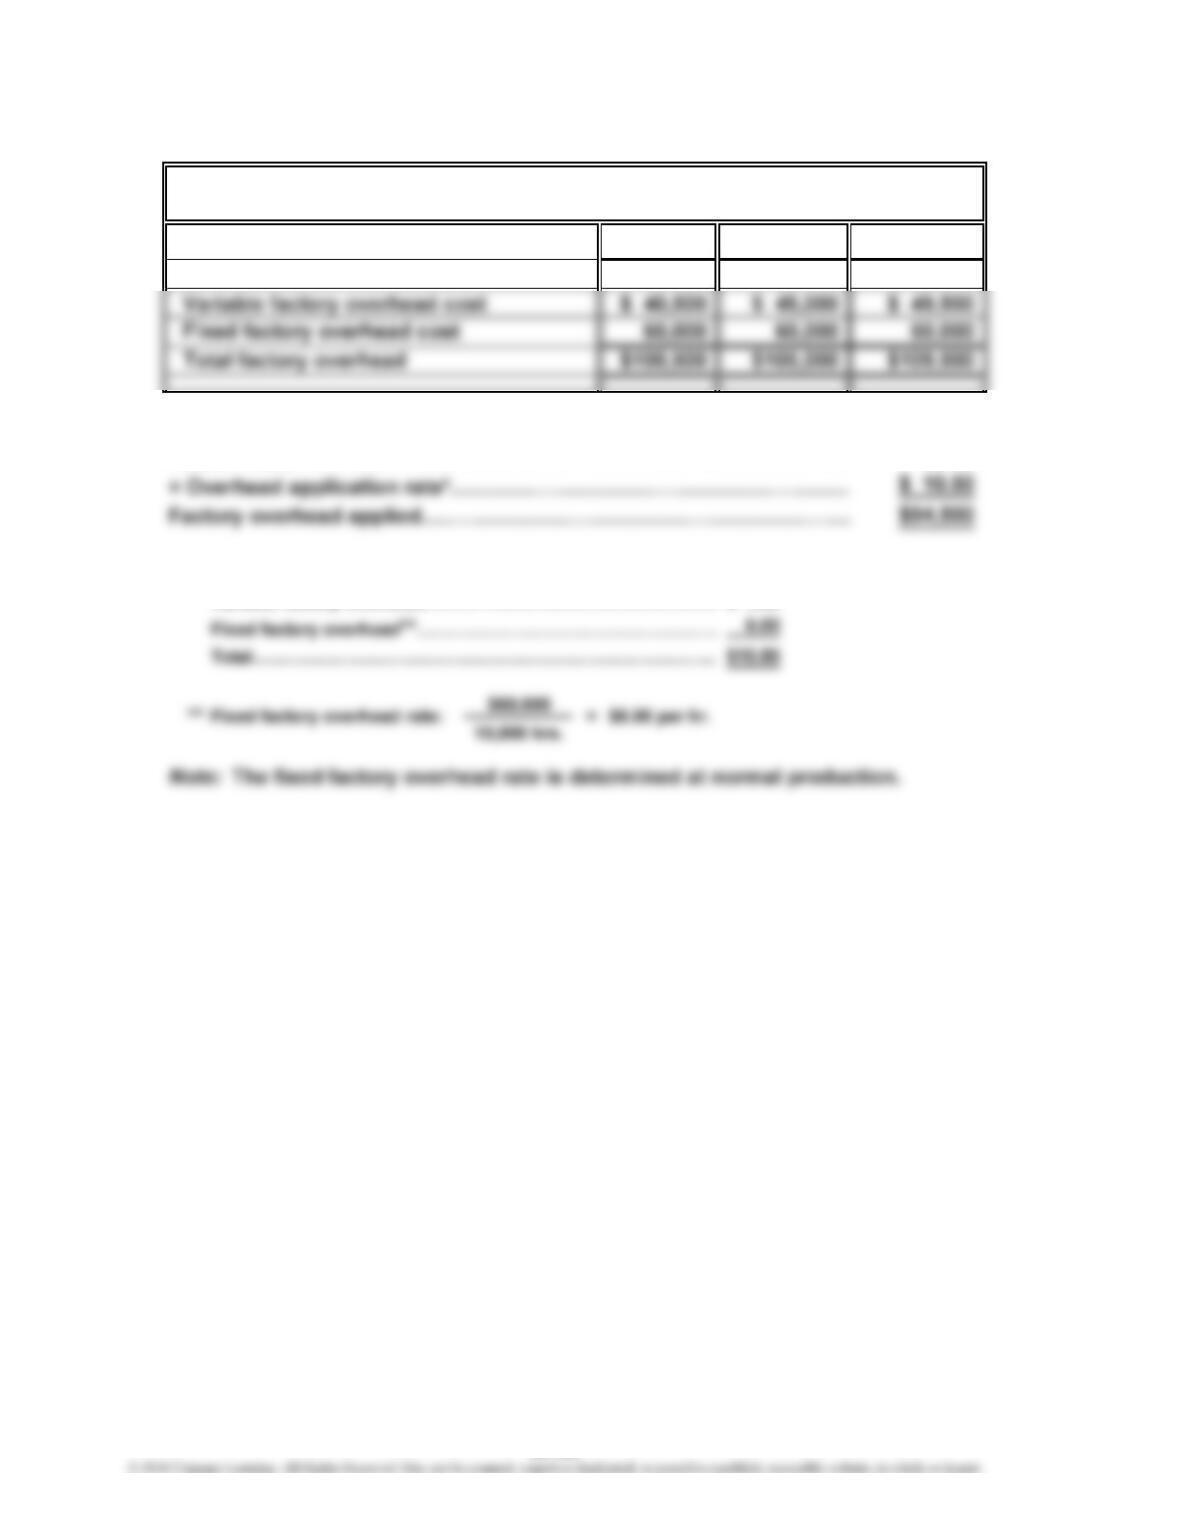
b. Overhead applied at actual production:
Actual hours……………………………………………………………………
…
9,000
…
*Total factory overhead rate to be applied to production:
V
ariable factory overhead…………………………………………… $ 4.50
WIKI WIKI COMPANY
Monthly Factory Overhead Cost Budget—Fabrication Department
23-22
CHAPTER 23 Performance Evaluation Using Variances from Standard Costs
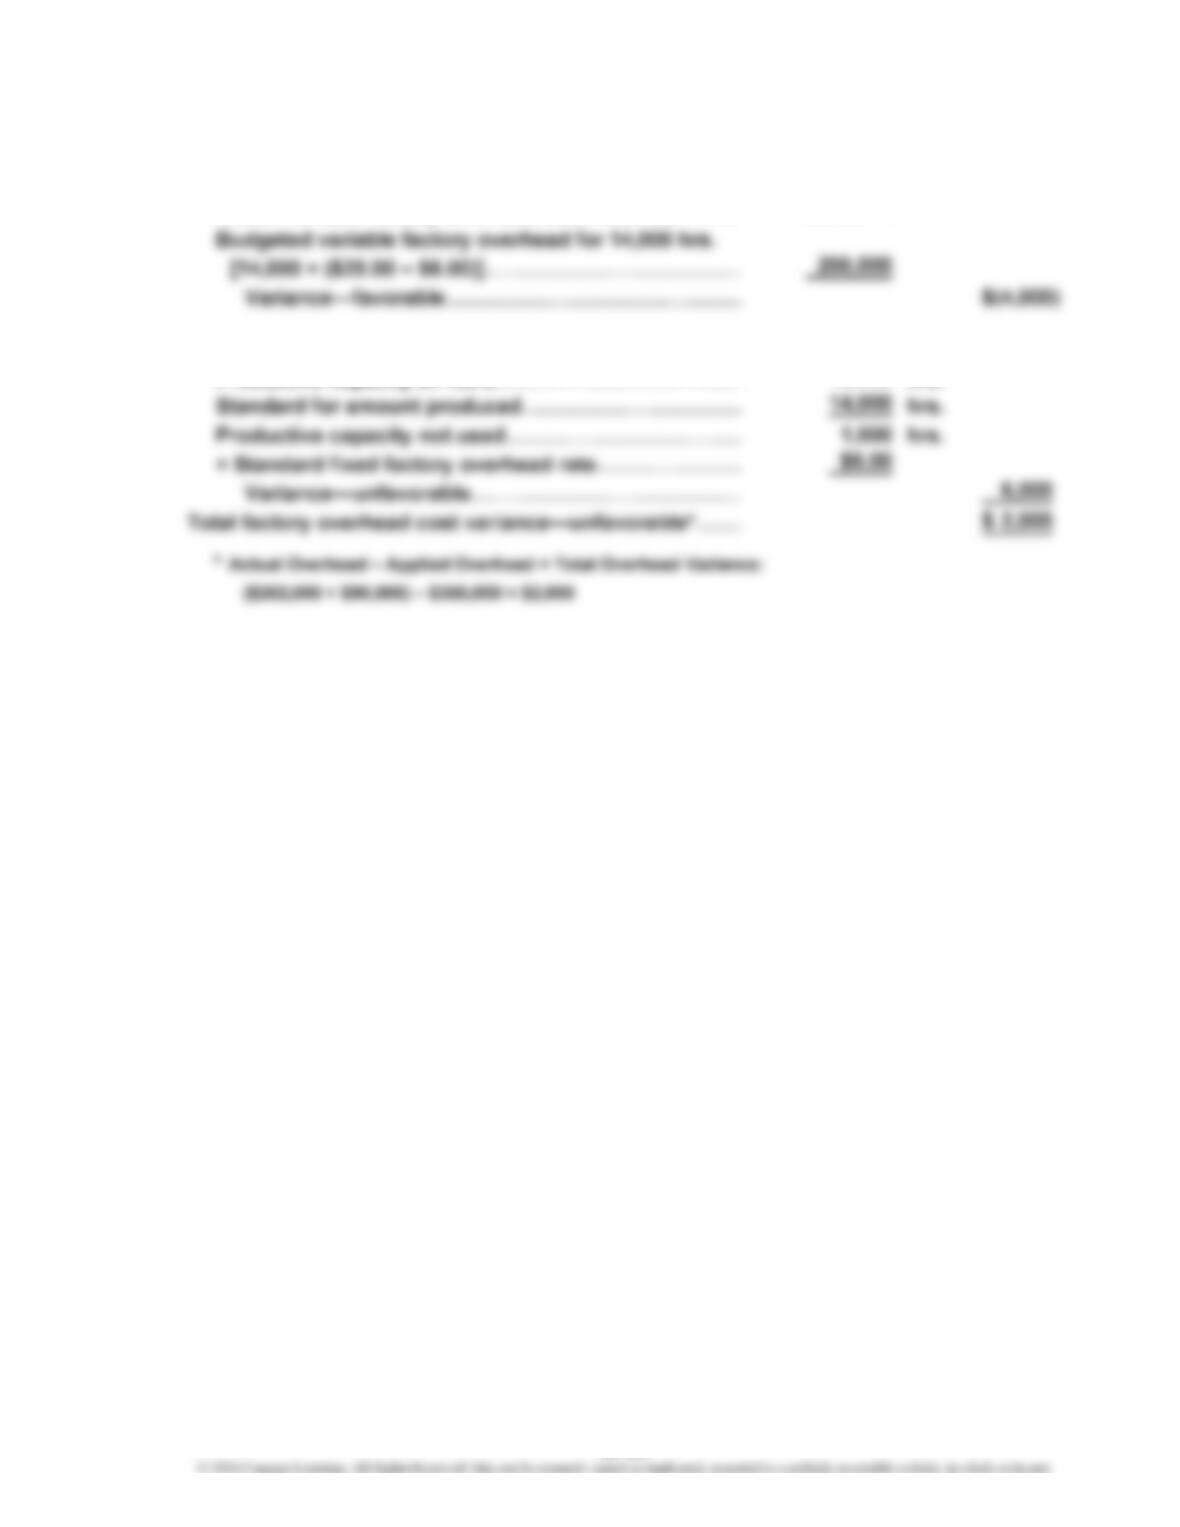
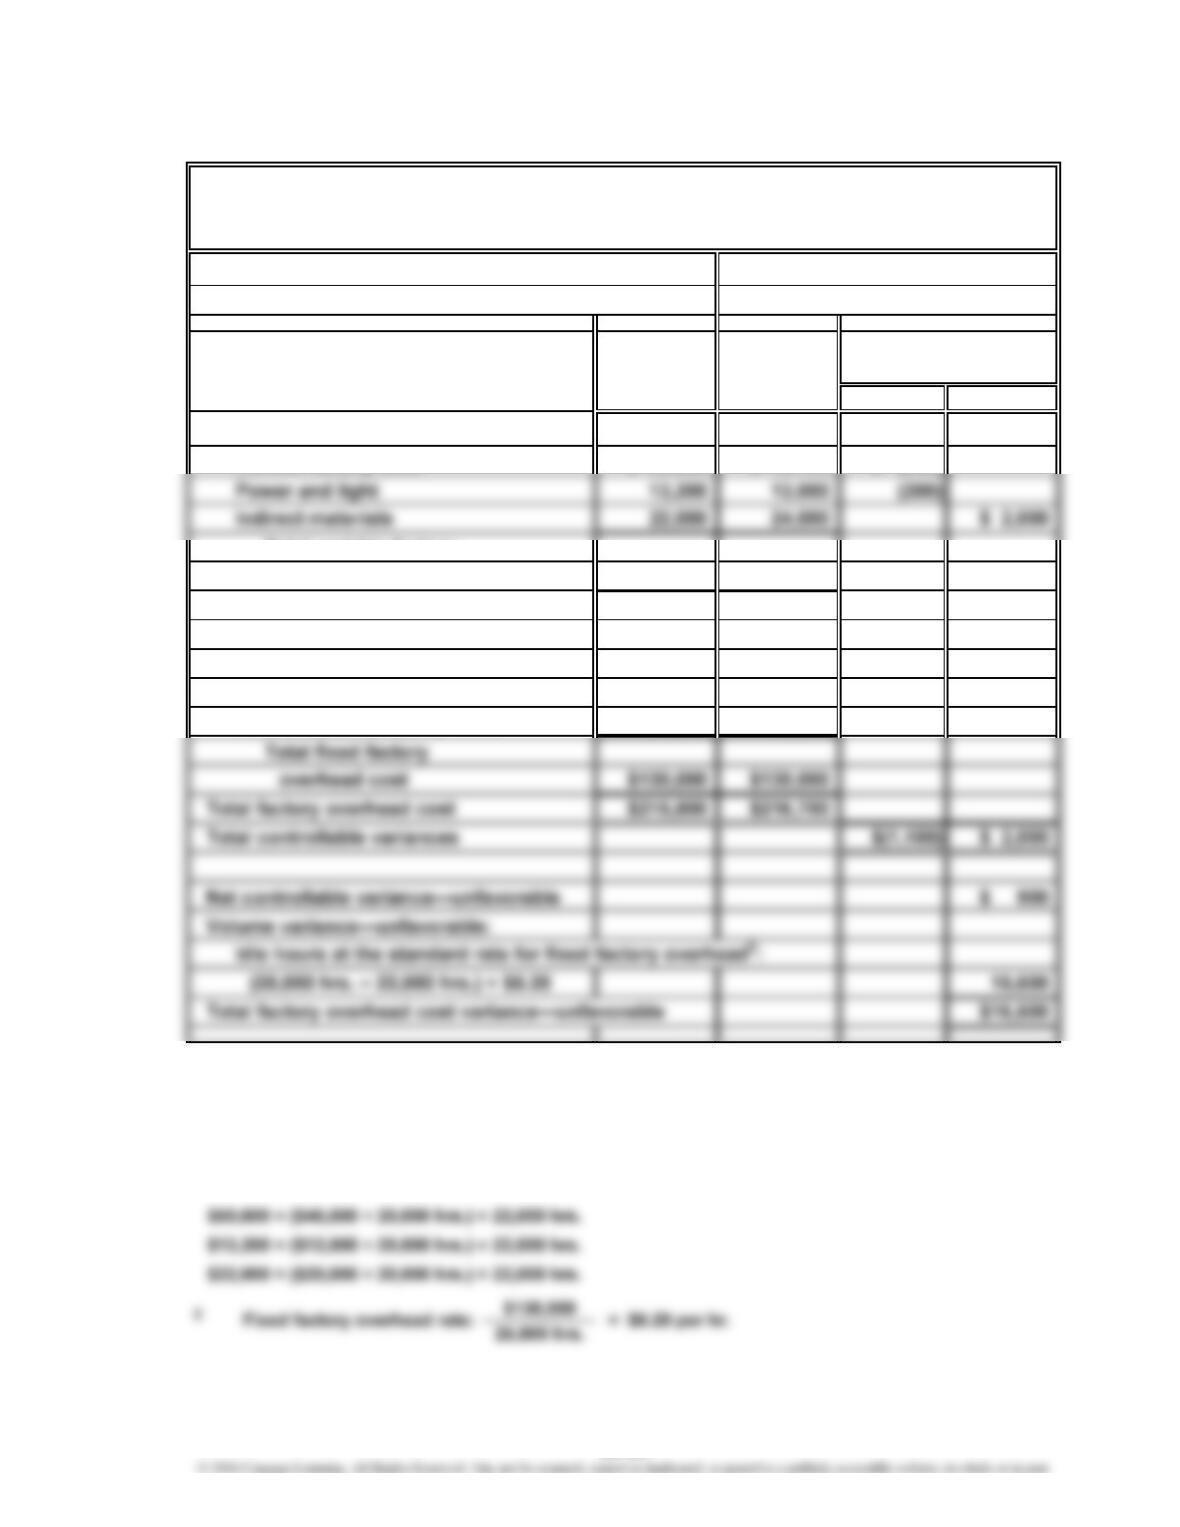
Ex. 23–17
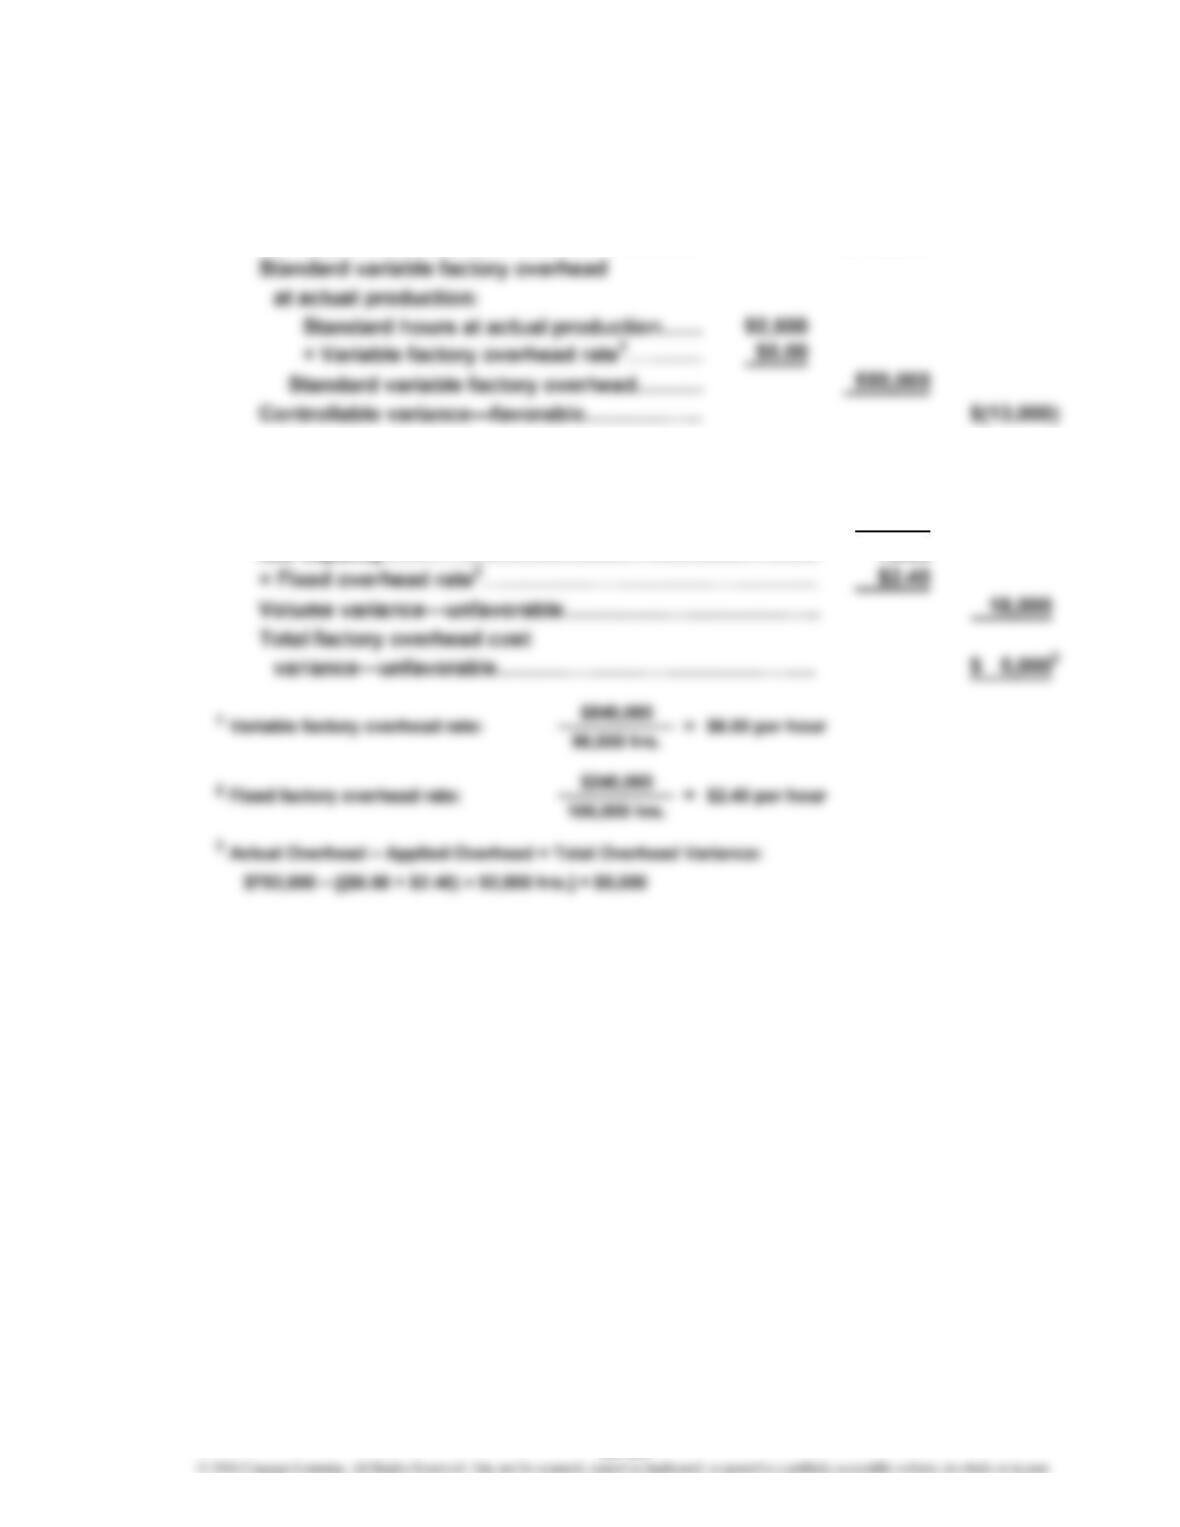
Variable factory overhead controllable variance:
Actual variable factory overhead cost incurred………
…
$262,000
Fixed factory overhead volume variance:
Productive capacity at 100%……………………………
…
15,000 hrs.
23-23
CHAPTER 23 Performance Evaluation Using Variances from Standard Costs
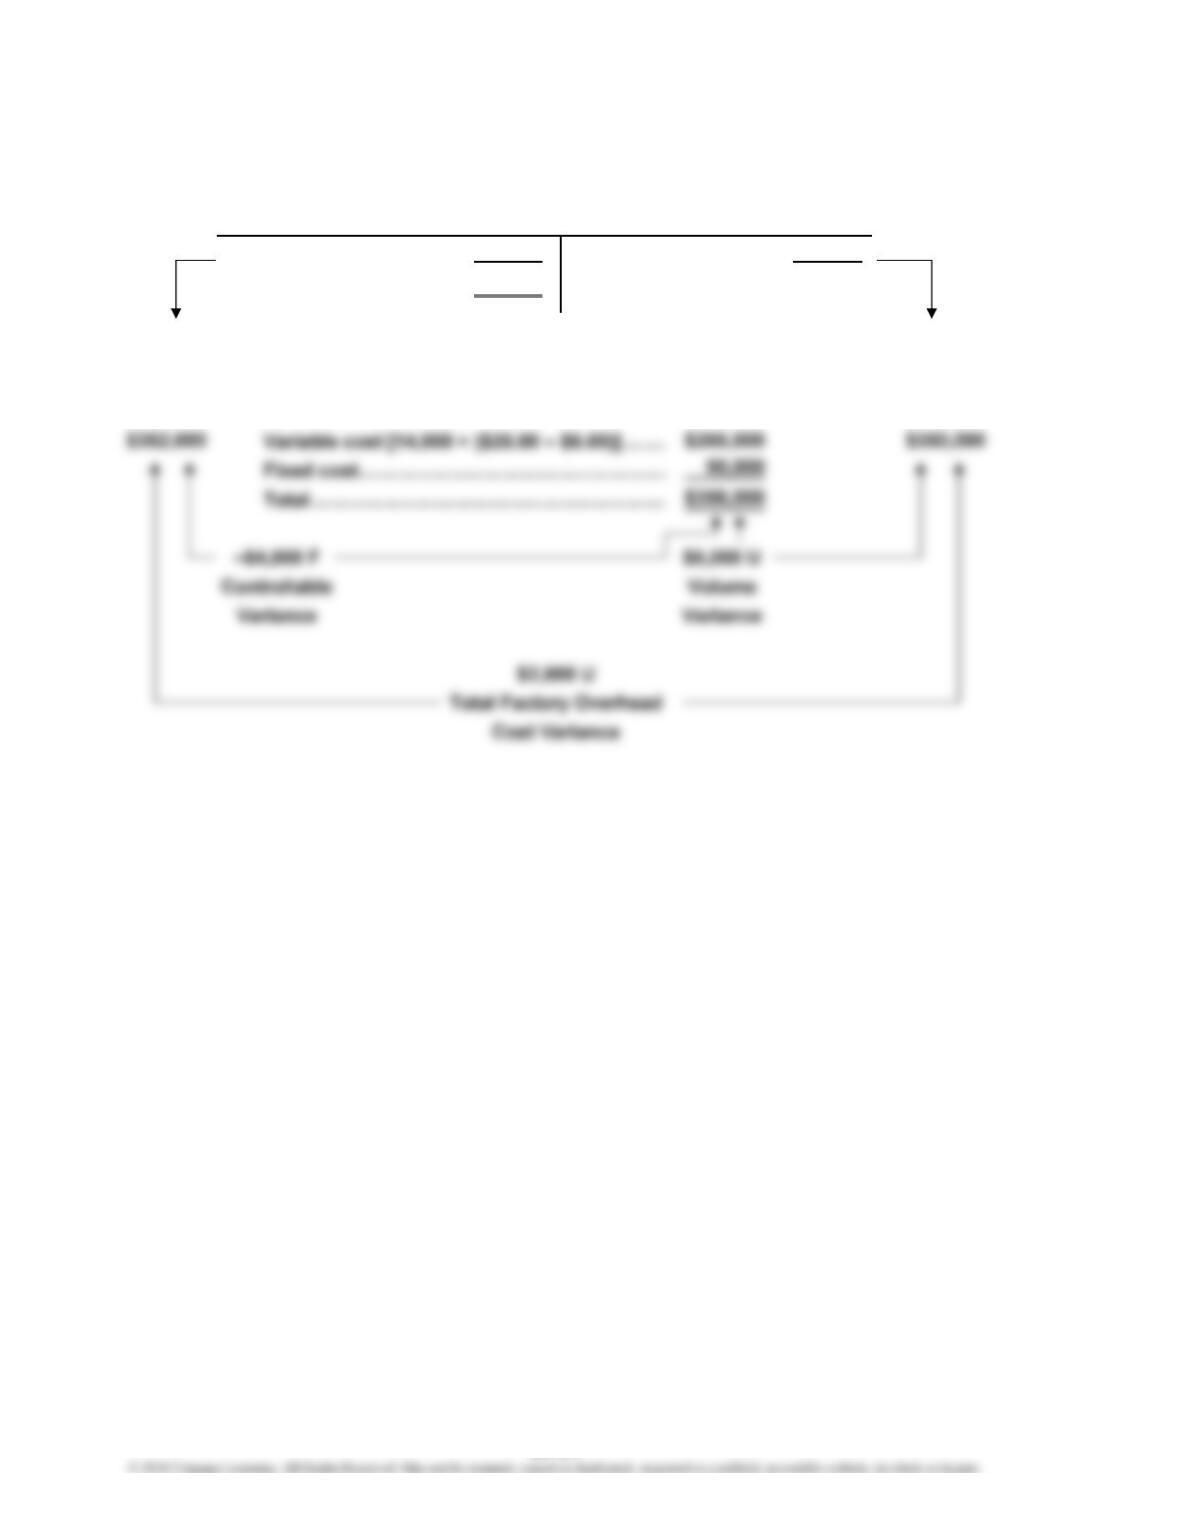
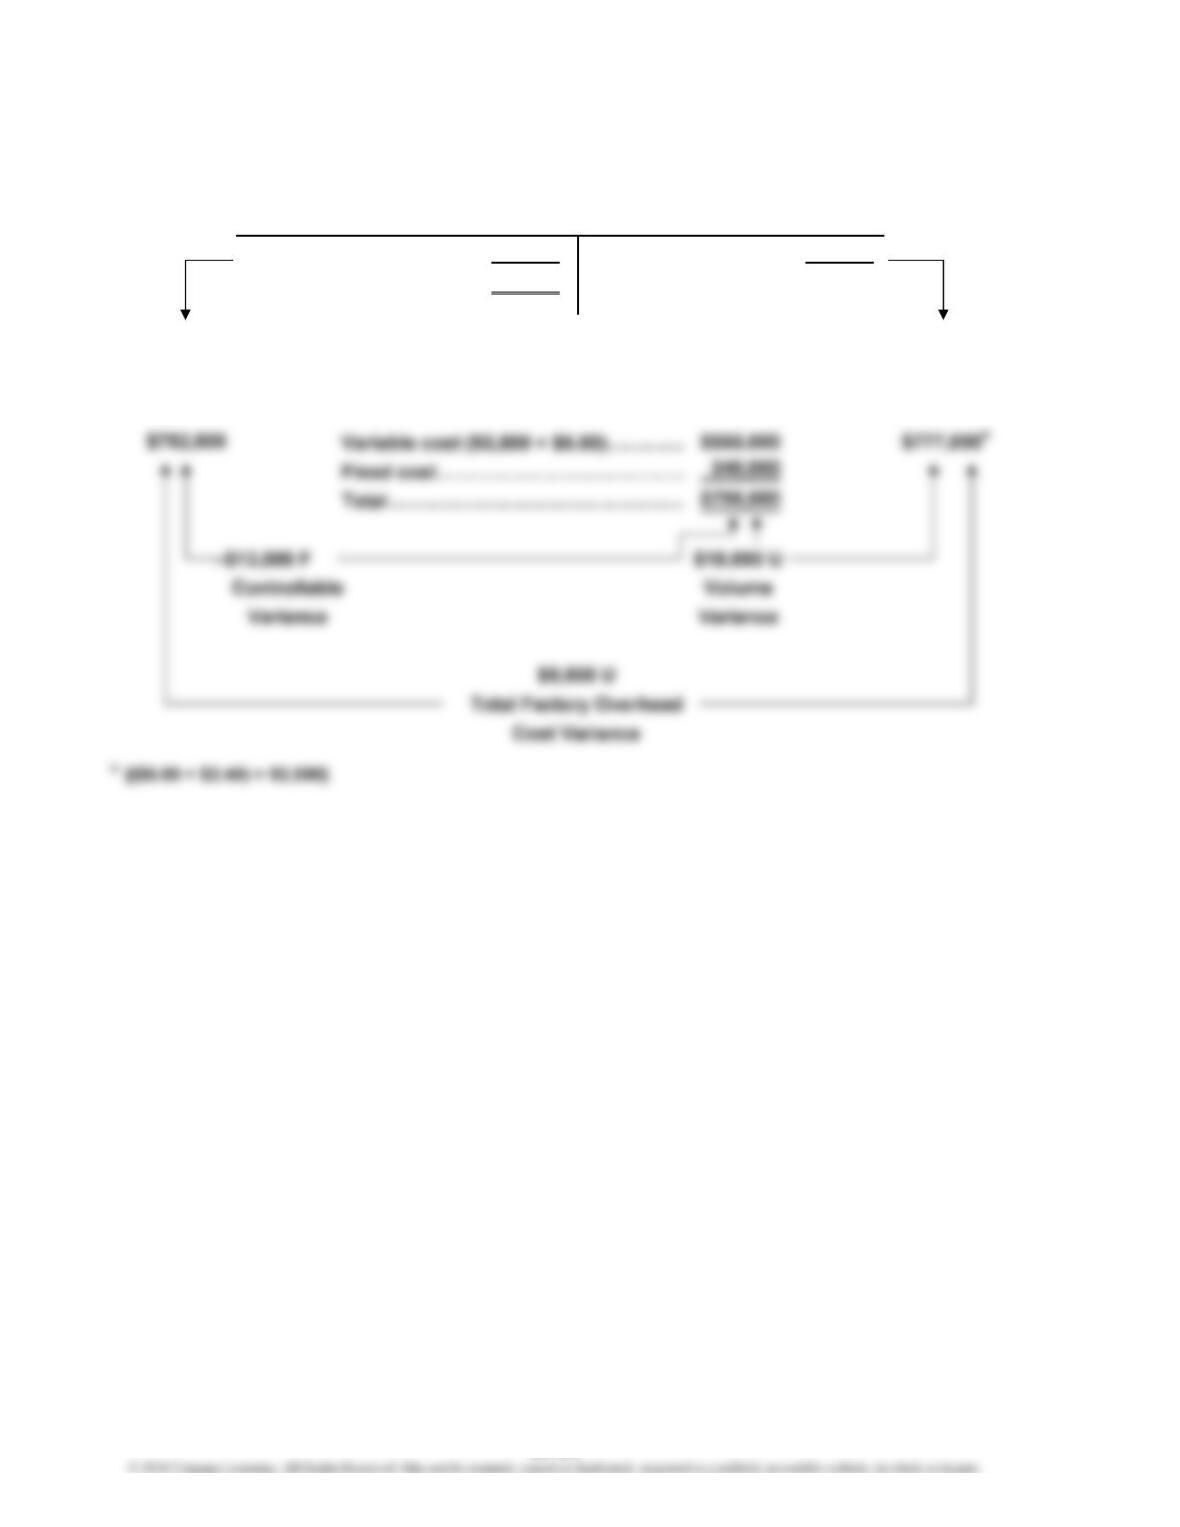
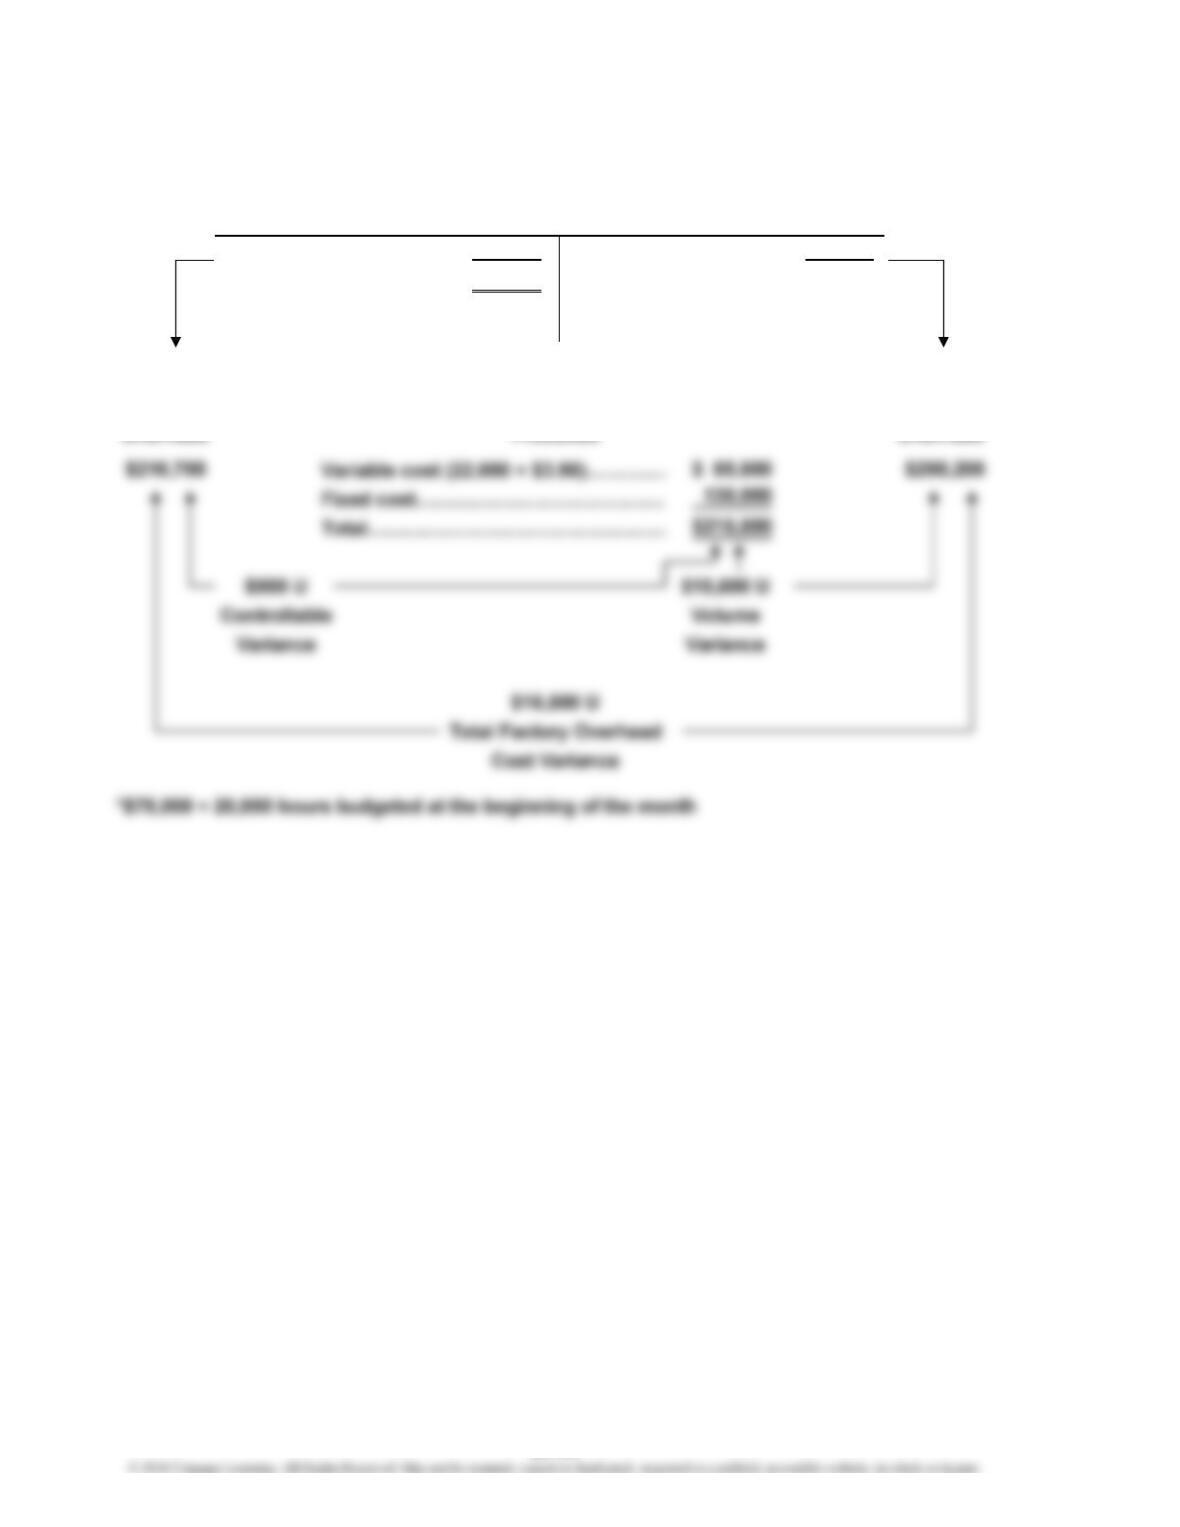
Ex. 23–17 (Concluded)
Actual costs 352,000 Applied costs 350,000
Balance (underapplied) 2,000
Actual Applied
Factory Factory
Overhead Overhead
Produced
Overhead for Amount
Alternative Computation of Overhead Variances
Factory Overhead
Budgeted Factory
23-24
CHAPTER 23 Performance Evaluation Using Variances from Standard Costs
Ex. 23–18
a. Controllable variance:
Actual variable factory overhead
($782,000 – $240,000)…………………………
…
$542,000
b. Volume variance:
V
olume at 100% of normal capacity…………………………
…
100,000
Less standard hours…………………………………………… 92,500
Idle capacity……………………………………………………
…
7,500
V
23-25
CHAPTER 23 Performance Evaluation Using Variances from Standard Costs
Ex. 23–18 (Concluded)
Actual costs 782,000 Applied costs 777,000
Balance (underapplied) 5,000
Applied
Factory
Overhead
Overhead for Amount
Alternative Computation of Overhead Variances
Factory Overhead
Budgeted Factory
Produced
Actual
Factory
Overhead
*
23-26
CHAPTER 23 Performance Evaluation Using Variances from Standard Costs
Ex. 23–19
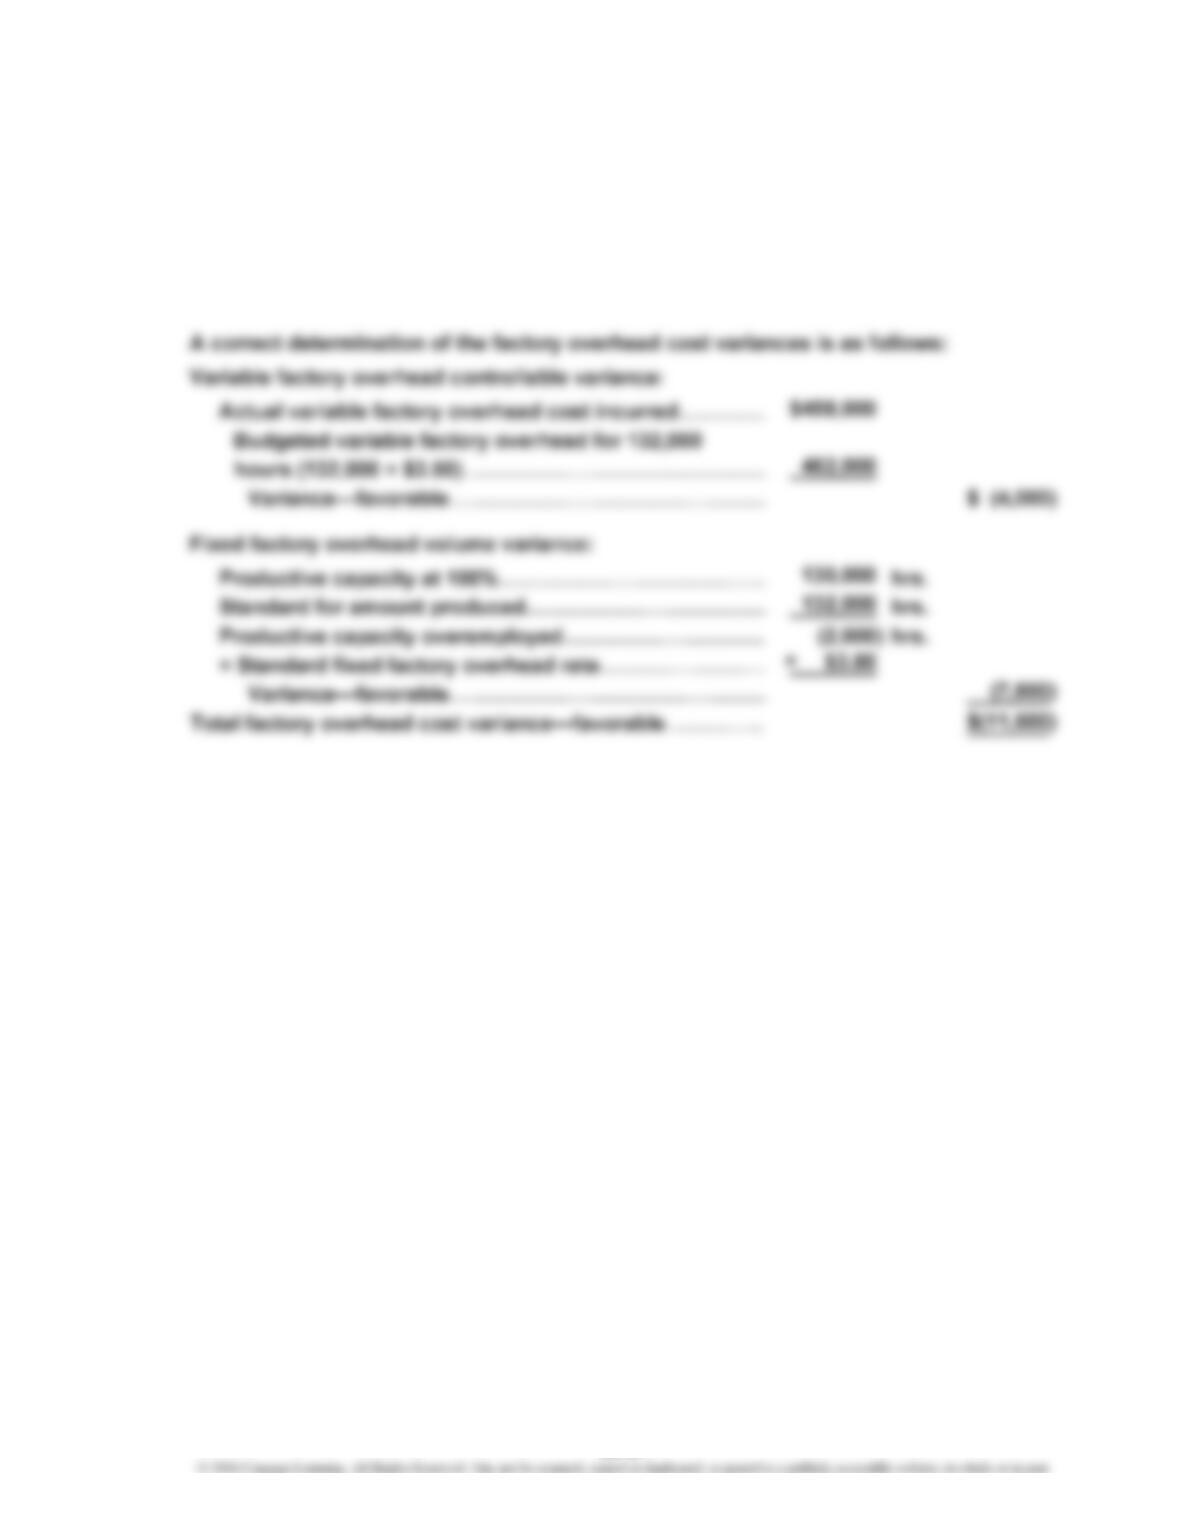
In determining the volume variance, the productive capacity overemployed (2,000
hours) should be multiplied by the standard fixed factory overhead rate of $3.80
($7.30 – $3.50) to yield a favorable variance of $7,600. The variance analysis
provided by the chief cost accountant incorrectly multiplied the 2,000 hours by
the total factory overhead rate of $7.30 per hour and reported it as unfavorable.
23-27
CHAPTER 23 Performance Evaluation Using Variances from Standard Costs
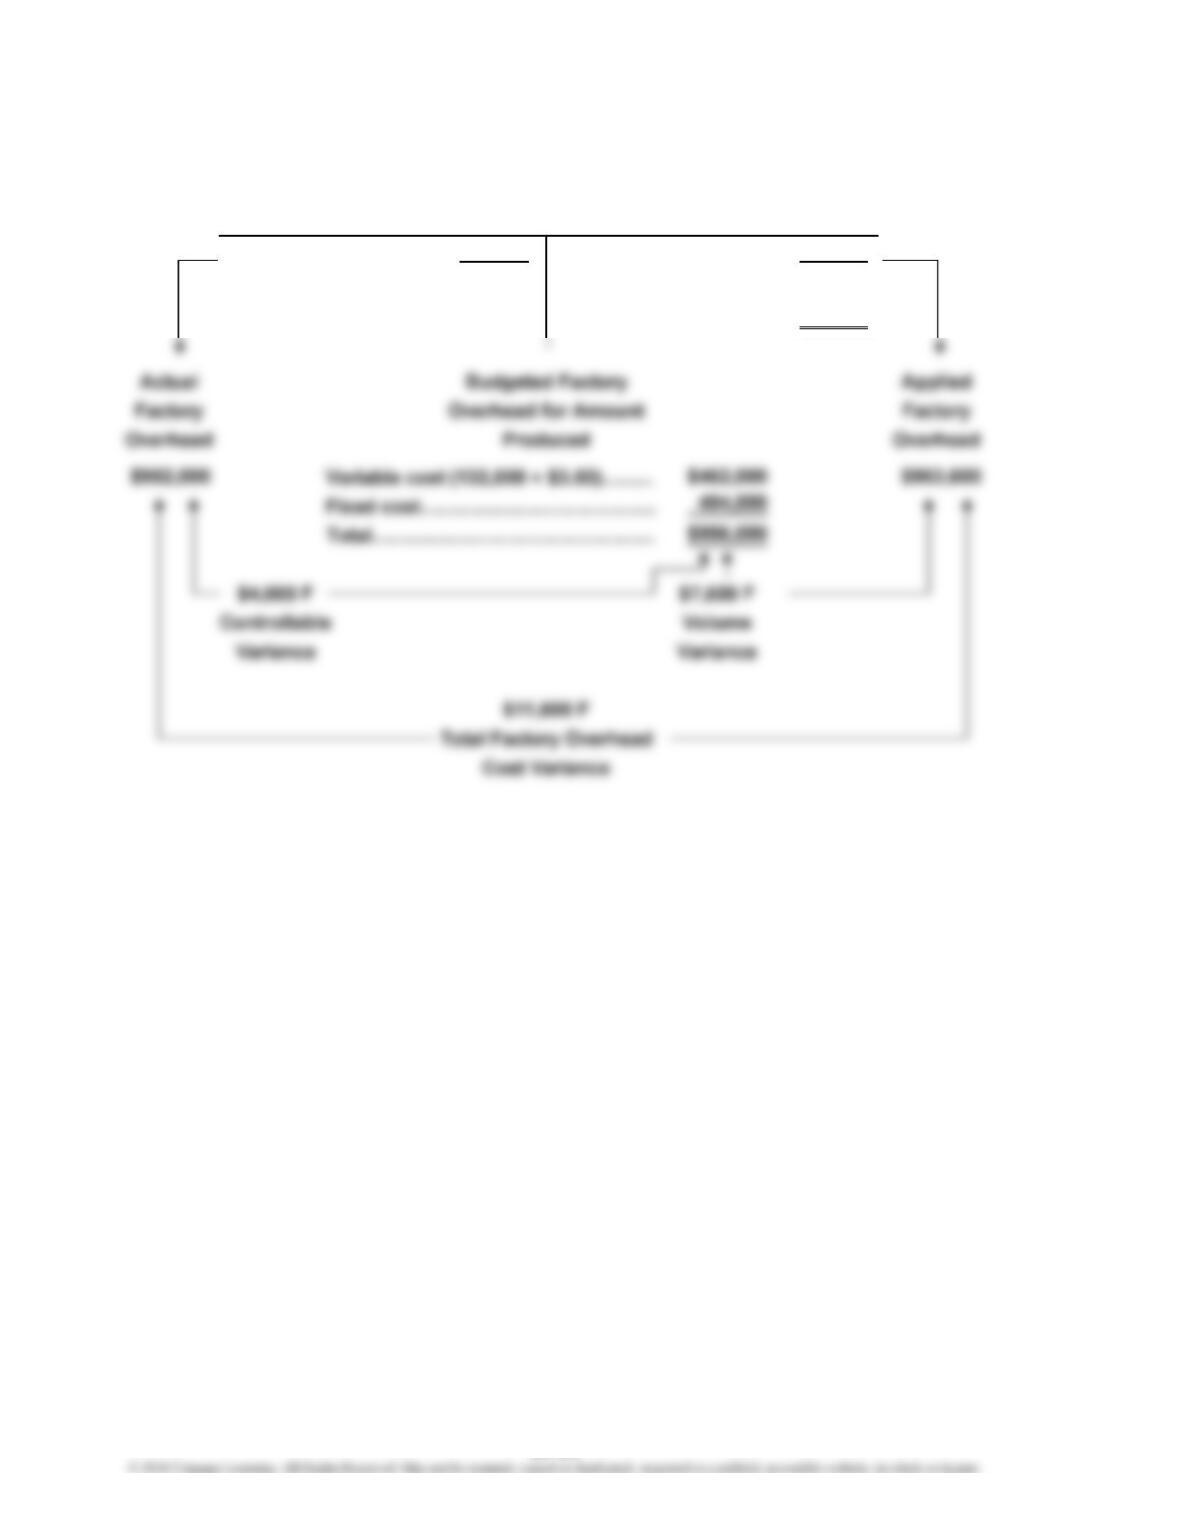
Ex. 23–19 (Concluded)
Actual costs 952,000 Applied costs 963,600
($458,000 + $494,000) [($3.50 + $3.80) × 132,000]
Balance (overapplied) 11,600
Alternative Computation of Overhead Variances
Factory Overhead
23-28
CHAPTER 23 Performance Evaluation Using Variances from Standard Costs
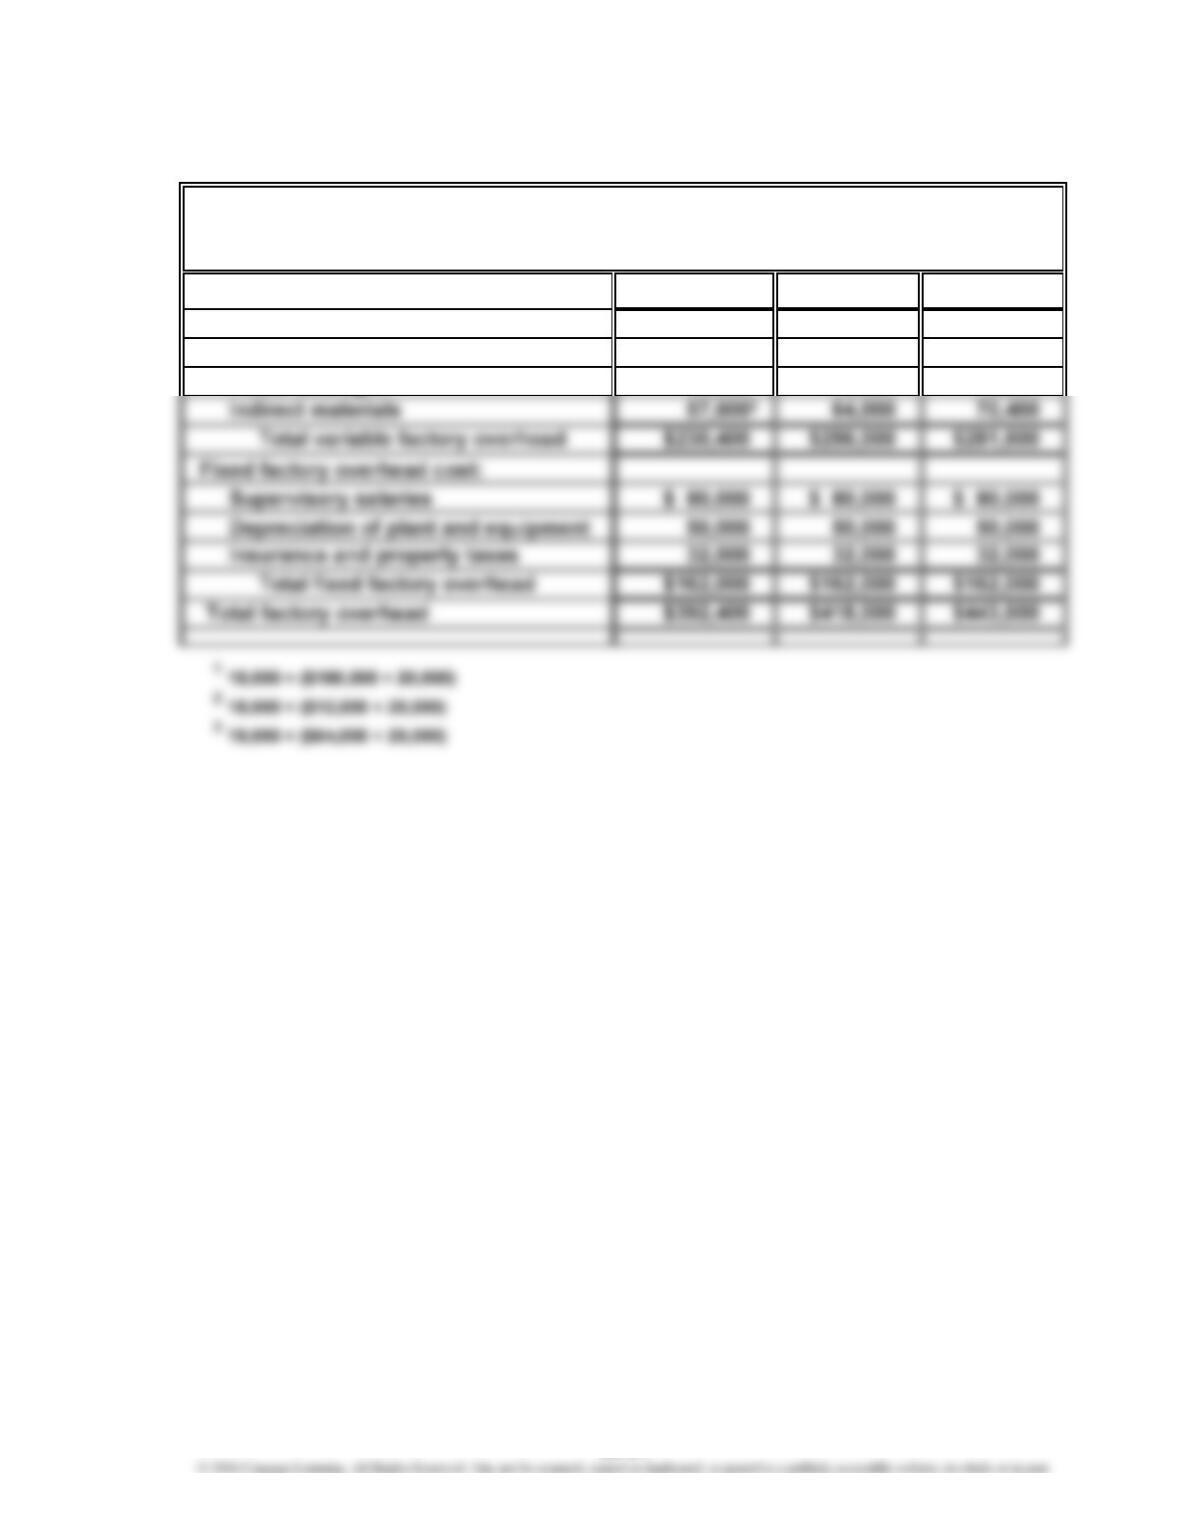
Ex. 23–20
Productive capacity for the month 25,000 hrs.
Actual productive capacity used for the month 22,000 hrs.
Budget
(at actual
production) Actual Favorable Unfavorable
Variable factory overhead costs:
1
Indirect factory labor $ 50,600 $ 49,700 $ (900)
Total variable factory
overhead cost $ 85,800 $ 86,700
Fixed factory overhead costs:
Supervisory salaries $ 54,500 $ 54,500
Depreciation of plant and
equipment 40,000 40,000
Insurance and property taxes 35,500 35,500
1
The budgeted variable factory overhead costs are determined by multiplying
22,000 hours by the variable factory overhead cost rate for each variable cost
category. These rates are determined by dividing each budgeted amount
(estimated at the beginning of the month) by the planned (budgeted) volume
of 20,000 hours. Thus, for example:
TANNIN PRODUCTS INC.
Factory Overhead Cost Variance Report—Trim Department
For the Month Ended July 31
Variances
23-29
CHAPTER 23 Performance Evaluation Using Variances from Standard Costs
Ex. 23–20 (Concluded)
Actual costs 216,700 Applied costs 200,200
Balance (underapplied) 16,500 [22,000 × ($3.90* + $5.20)]
Actual Applied
Factory Factory
Overhead Overhead
Produced
Overhead for Amount
Alternative Computation of Overhead Variances
Factory Overhead
Budgeted Factory
23-30
CHAPTER 23 Performance Evaluation Using Variances from Standard Costs
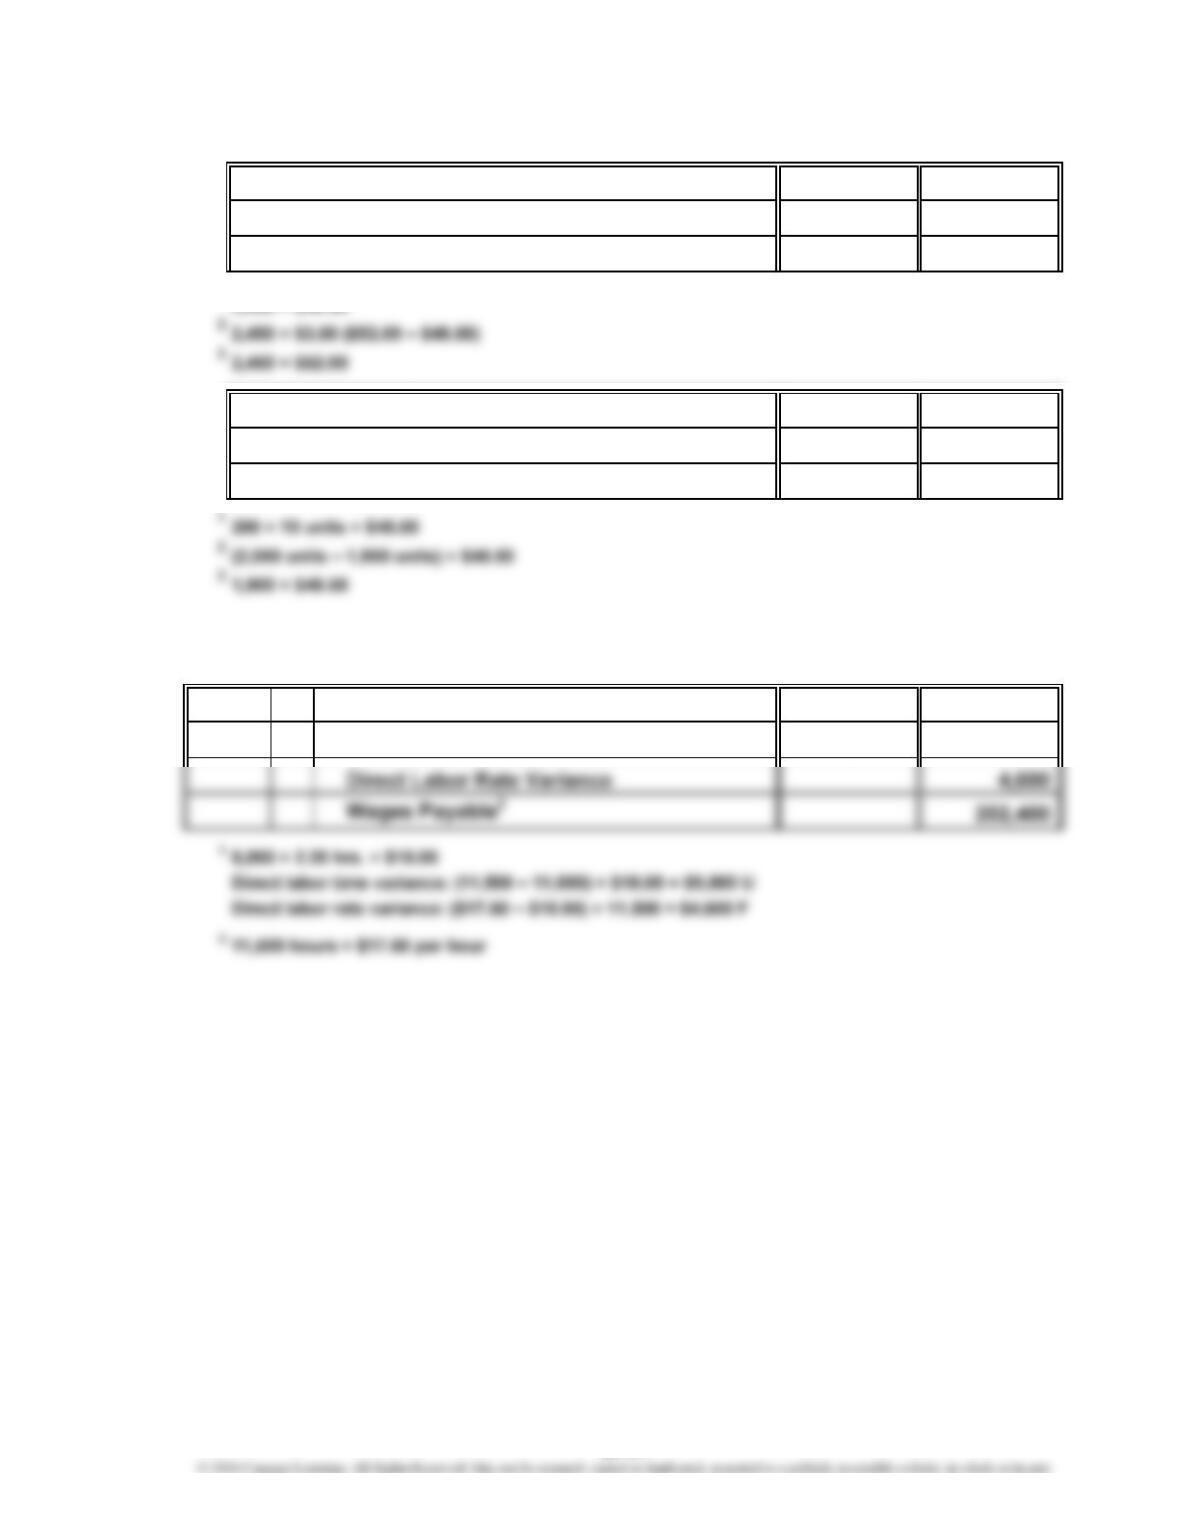
Ex. 23–21
a. Materials1118,825
Direct Materials Price Variance28,575
Accounts Payable3127,400
12,450 × $48.50
b. Work in Process197,000
Direct Materials Quantity Variance24,850
Materials392,150
Ex. 23–22
31 Work in Process1198,000
Direct Labor Time Variance 9,000
Mar.
23-31
CHAPTER 23 Performance Evaluation Using Variances from Standard Costs
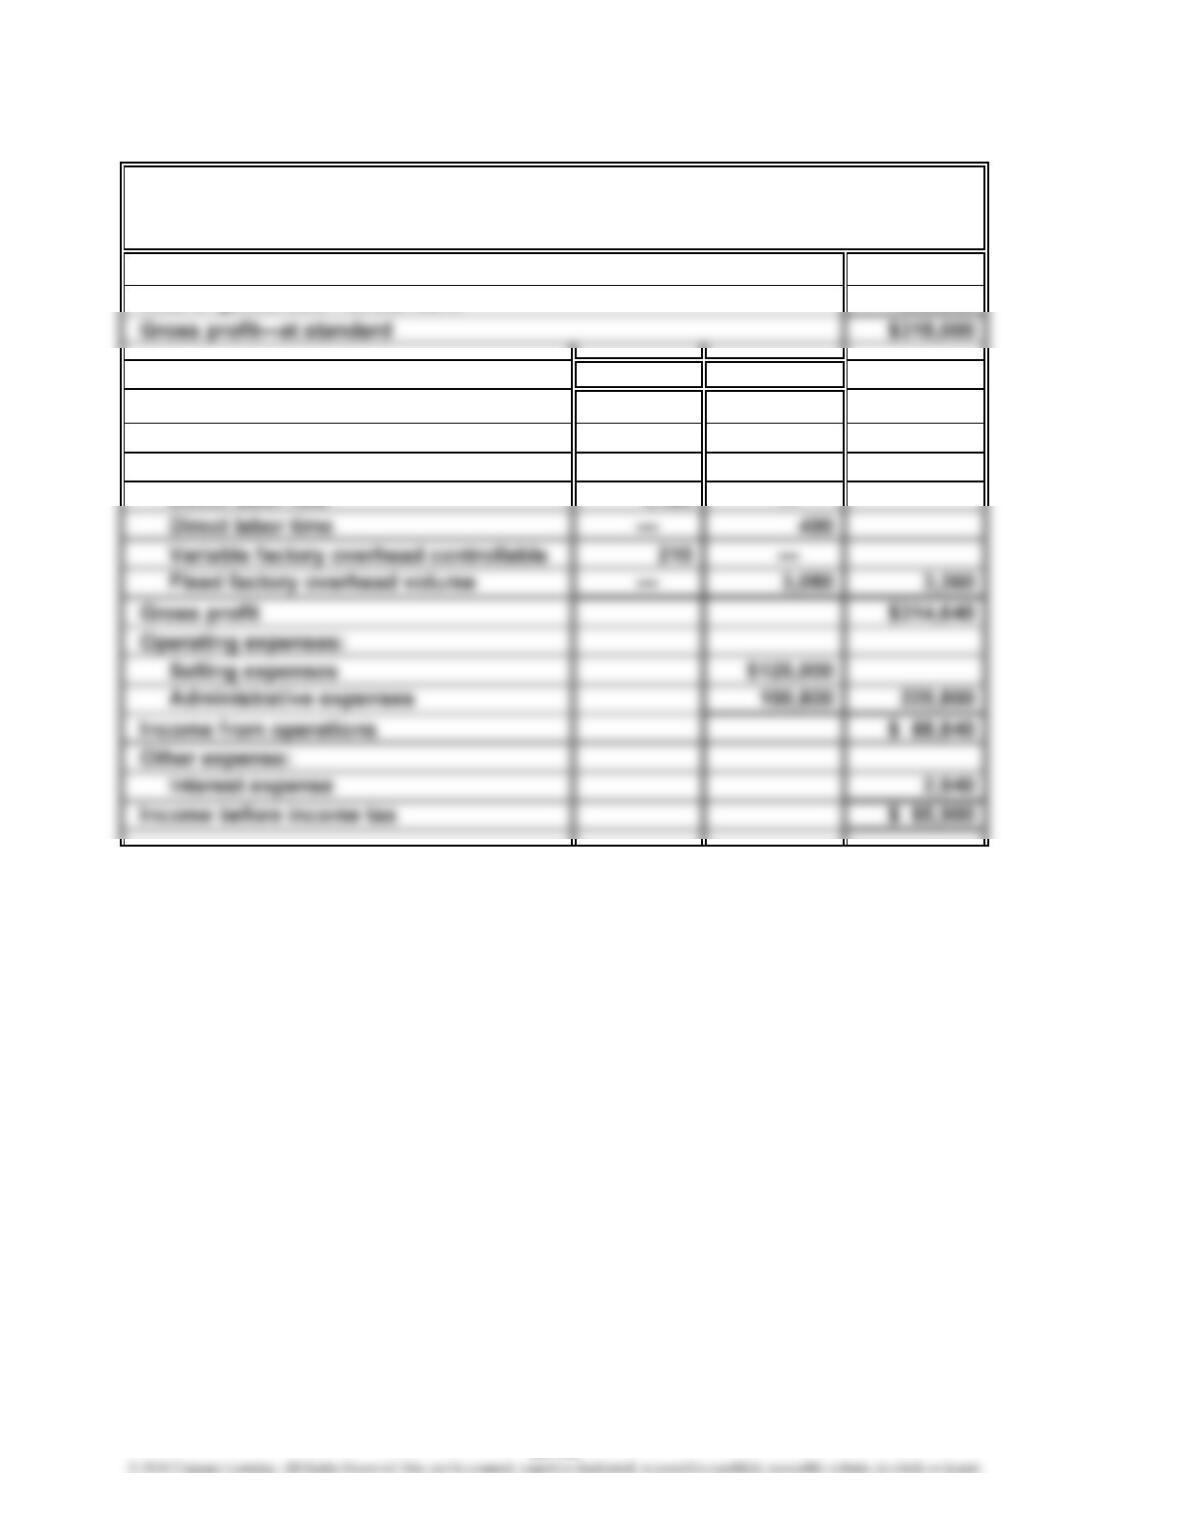
Ex. 23–23
Sales $868,000
Cost of goods sold—at standard 550,000
Favorable Unfavorable
Less variances from standard cost:
Direct materials price $ — $ 1,680
Direct materials quantity 560 —
Direct labor rate 1,120 —
GRIGGS COMPANY
Income Statement
For the Month Ended December 31, 2016
23-32
CHAPTER 23 Performance Evaluation Using Variances from Standard Costs
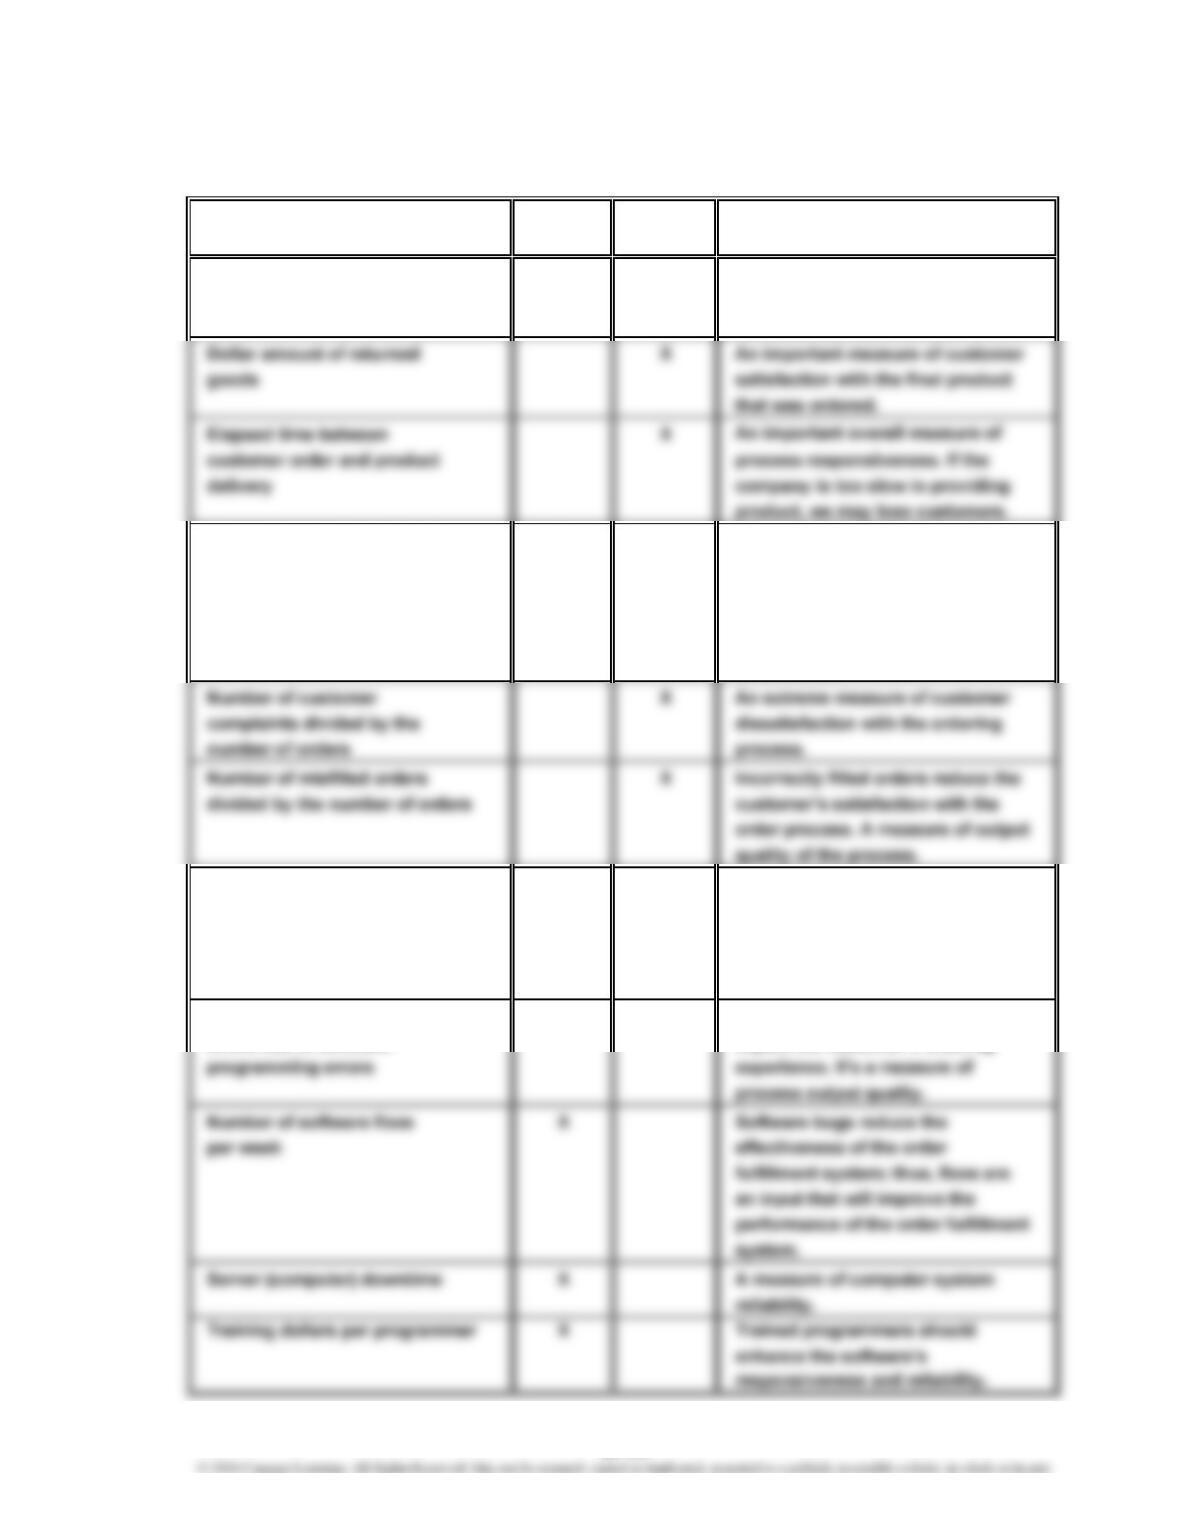
Ex. 23–24
a. and b.
Average computer response X A measure of the speed of the
time to customer “clicks” ordering process. If the speed is
too slow, we may lose customers.
Maintenance dollars divided X A driver of the ordering system’s
by hardware investment reliability and downtime. The
maintenance dollars should be
divided by the amount of hardware
in order to facilitate comparison
across time.
Number of orders per X This measure is related to the
warehouse employee capacity of the warehouse relative
to the demands placed upon it.
This relationship will impact the
delivery cycle time.
Number of page faults or X The page errors will negatively
errors due to software impact the customer’s ordering
Explanation
Input
Measure
Output
Measure
23-33
CHAPTER 23 Performance Evaluation Using Variances from Standard Costs
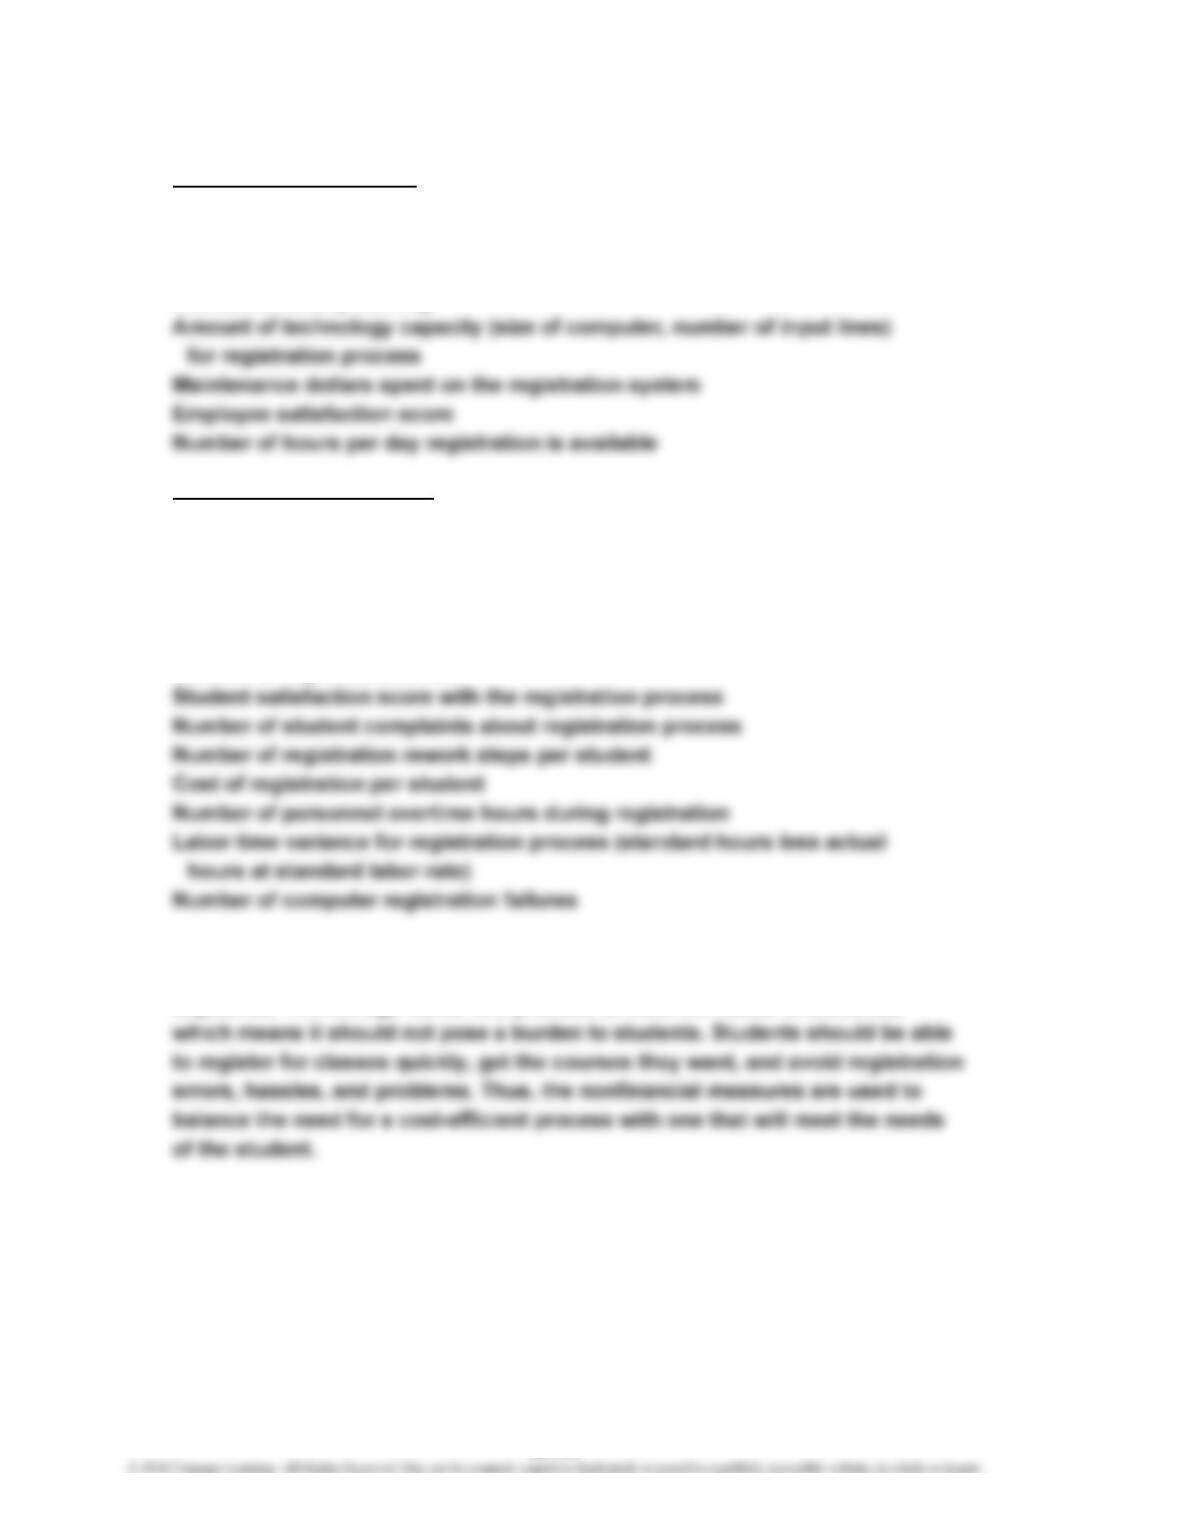
Ex. 23–25
a. Possible Input Measures
Registration staffing per student
Technology investment per period for registration process
Training hours per registration personnel
Amount of faculty staffing
Possible Output Measures
Cycle time for a student to register for classes
Number of times a course is unavailable
Number of separate registration events or steps (log-ons or line waits)
per student
Number of times a replacement course was used by a student
Number of registration errors
b. Alpha University is interested in not only the efficiency of the process but
also the quality of the process. This means that the process must meet multiple
objectives. The college wants this process to meet the needs of students,
23-34
CHAPTER 23 Performance Evaluation Using Variances from Standard Costs
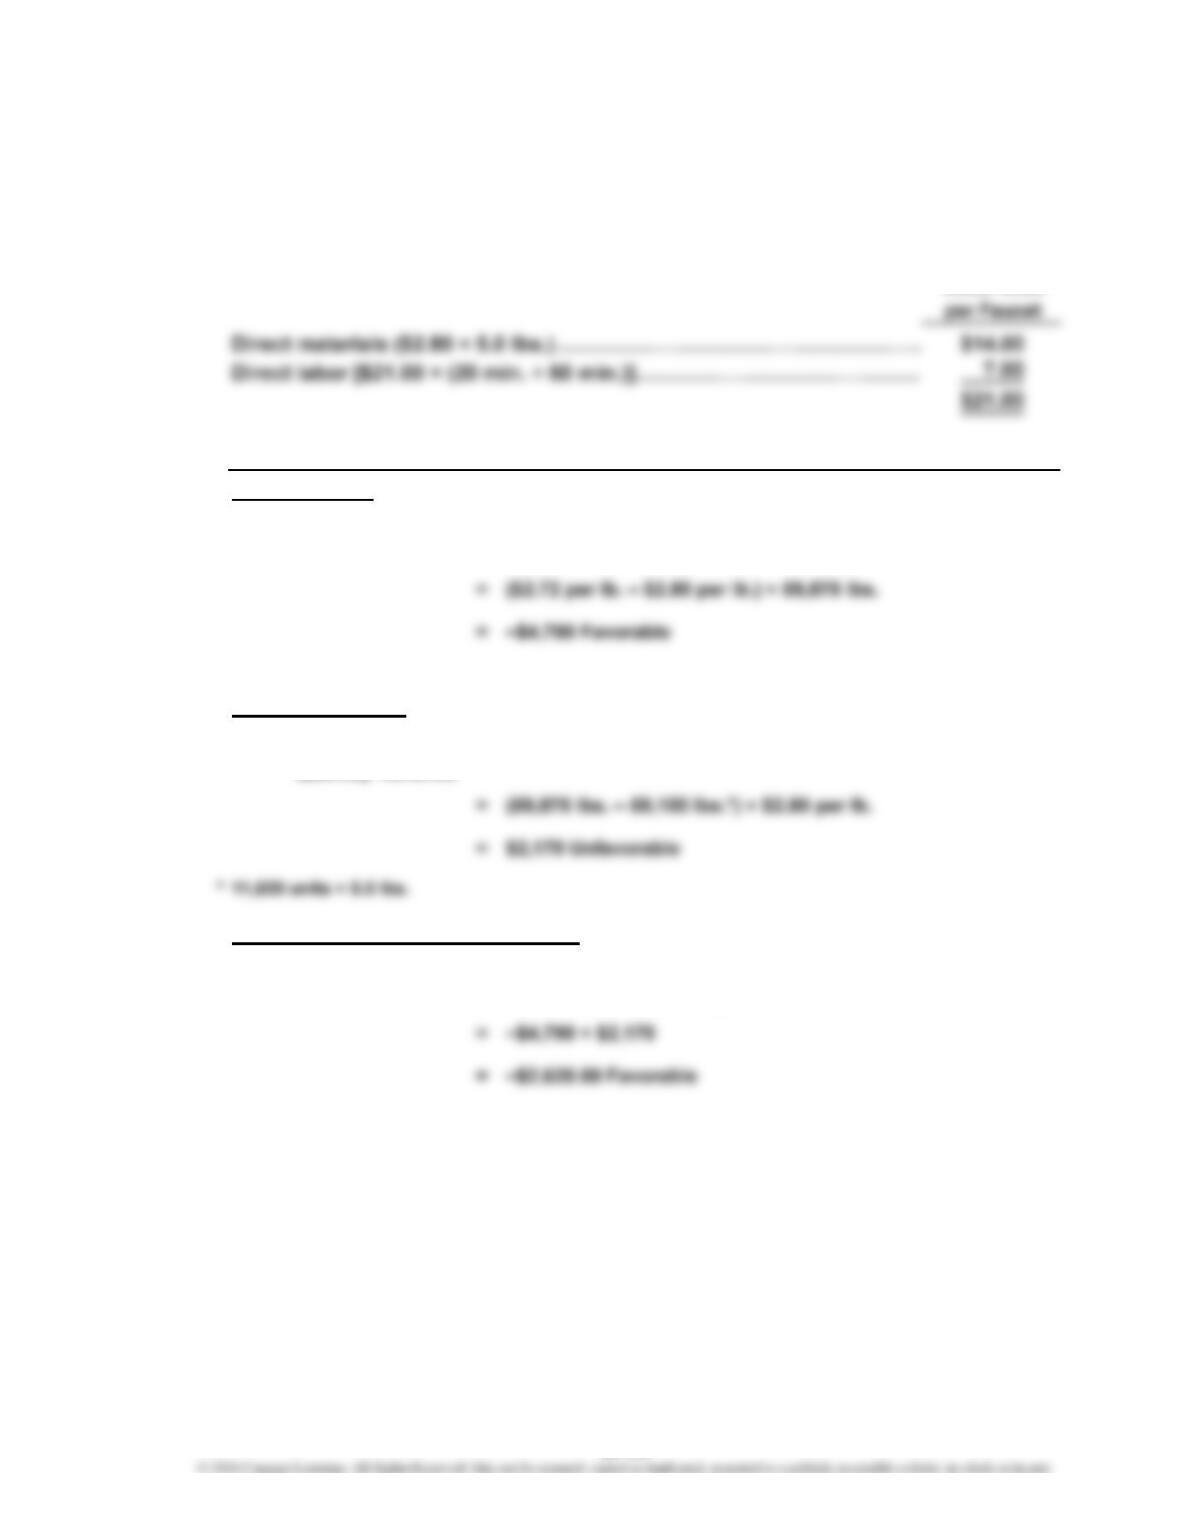
Prob. 23–1A
a. Standard
Materials and
Labor Cost
b.
Price variance:
Quantity variance:
Total direct materials cost variance:
= (Actual Quantity – Standard Quantity) × Standard Price
Direct Materials
Quantity Variance
PROBLEMS
Direct Materials Cost Variance
Direct Materials
Price Variance = (Actual Price – Standard Price) × Actual Quantity
Direct Materials
Cost Variance =Direct Materials Price Variance +
Direct Materials Quantity Variance
23-35
CHAPTER 23 Performance Evaluation Using Variances from Standard Costs
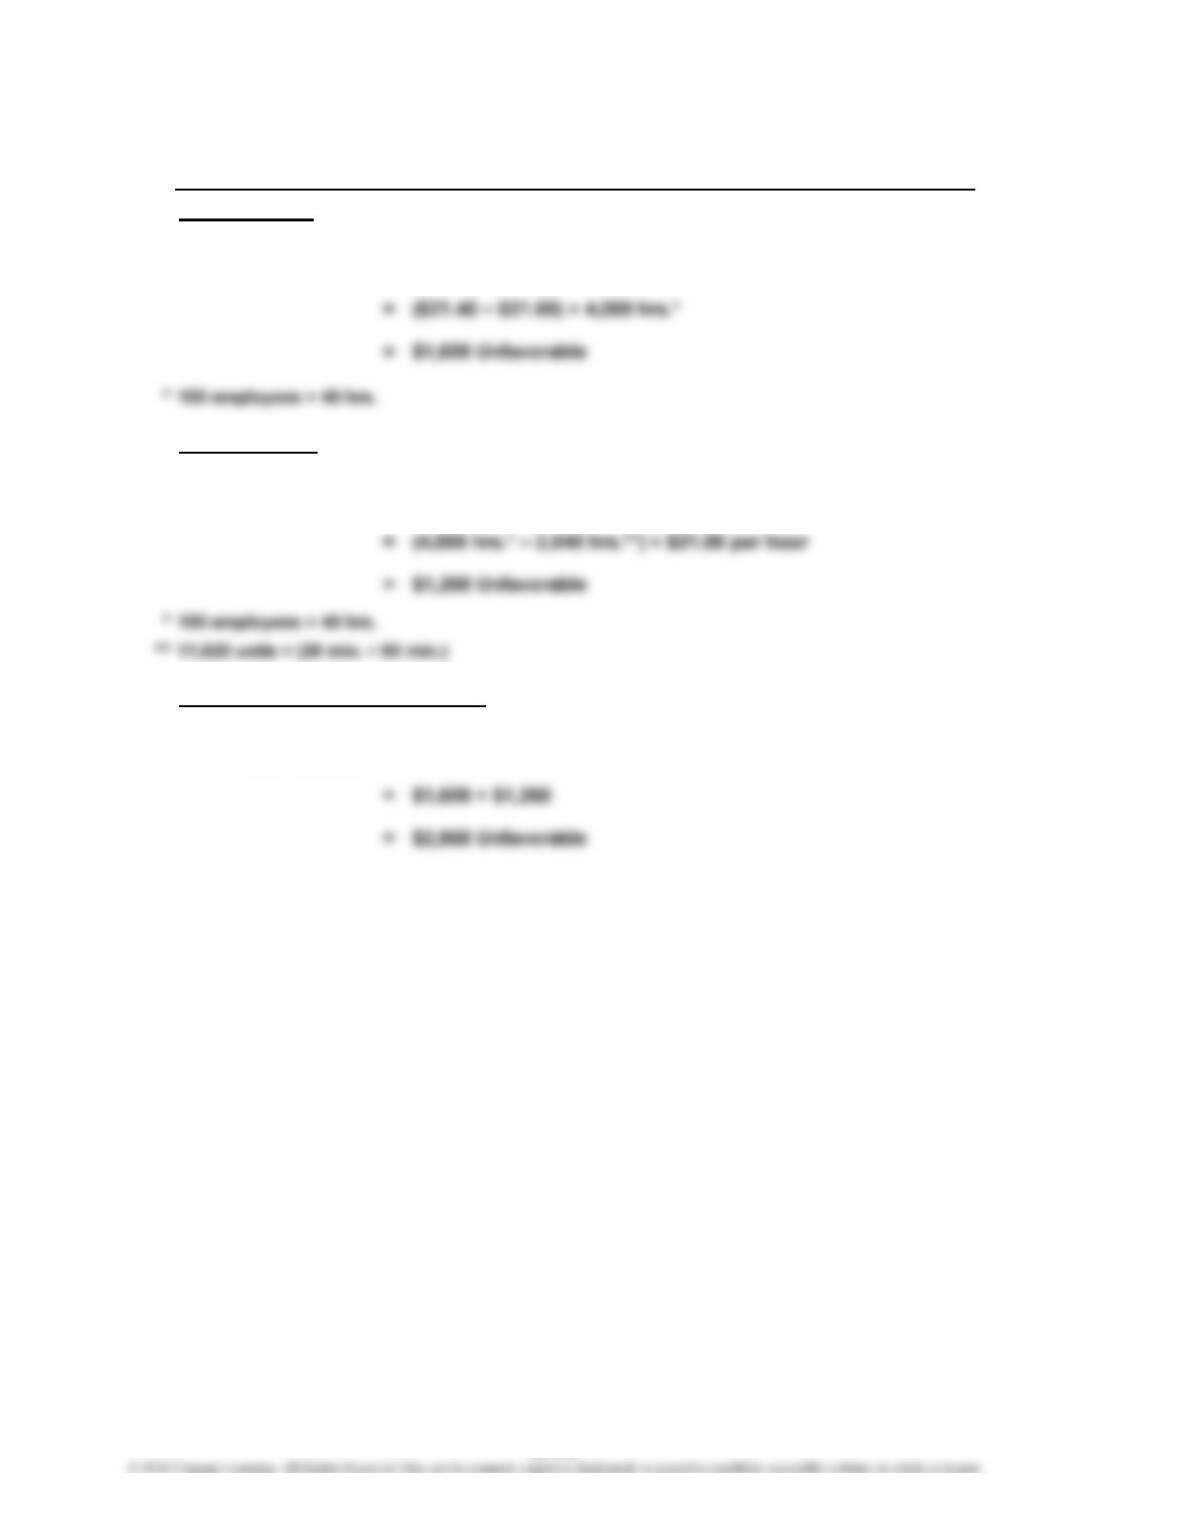
Prob. 23–1A (Concluded)
c.
Rate variance:
Time variance:
Total direct labor cost variance:
Direct Labor Cost Variance
Direct Labor
Rate Variance
Direct Labor
Time Variance
=(Actual Rate per Hour – Standard Rate per Hour)
× Actual Hours
=(Actual Direct Labor Hours – Standard Direct Labor Hours)
× Standard Rate per Hour
Direct Labor
Cost Variance = Direct Labor Rate Variance + Direct Labor Time Variance
23-36
CHAPTER 23 Performance Evaluation Using Variances from Standard Costs
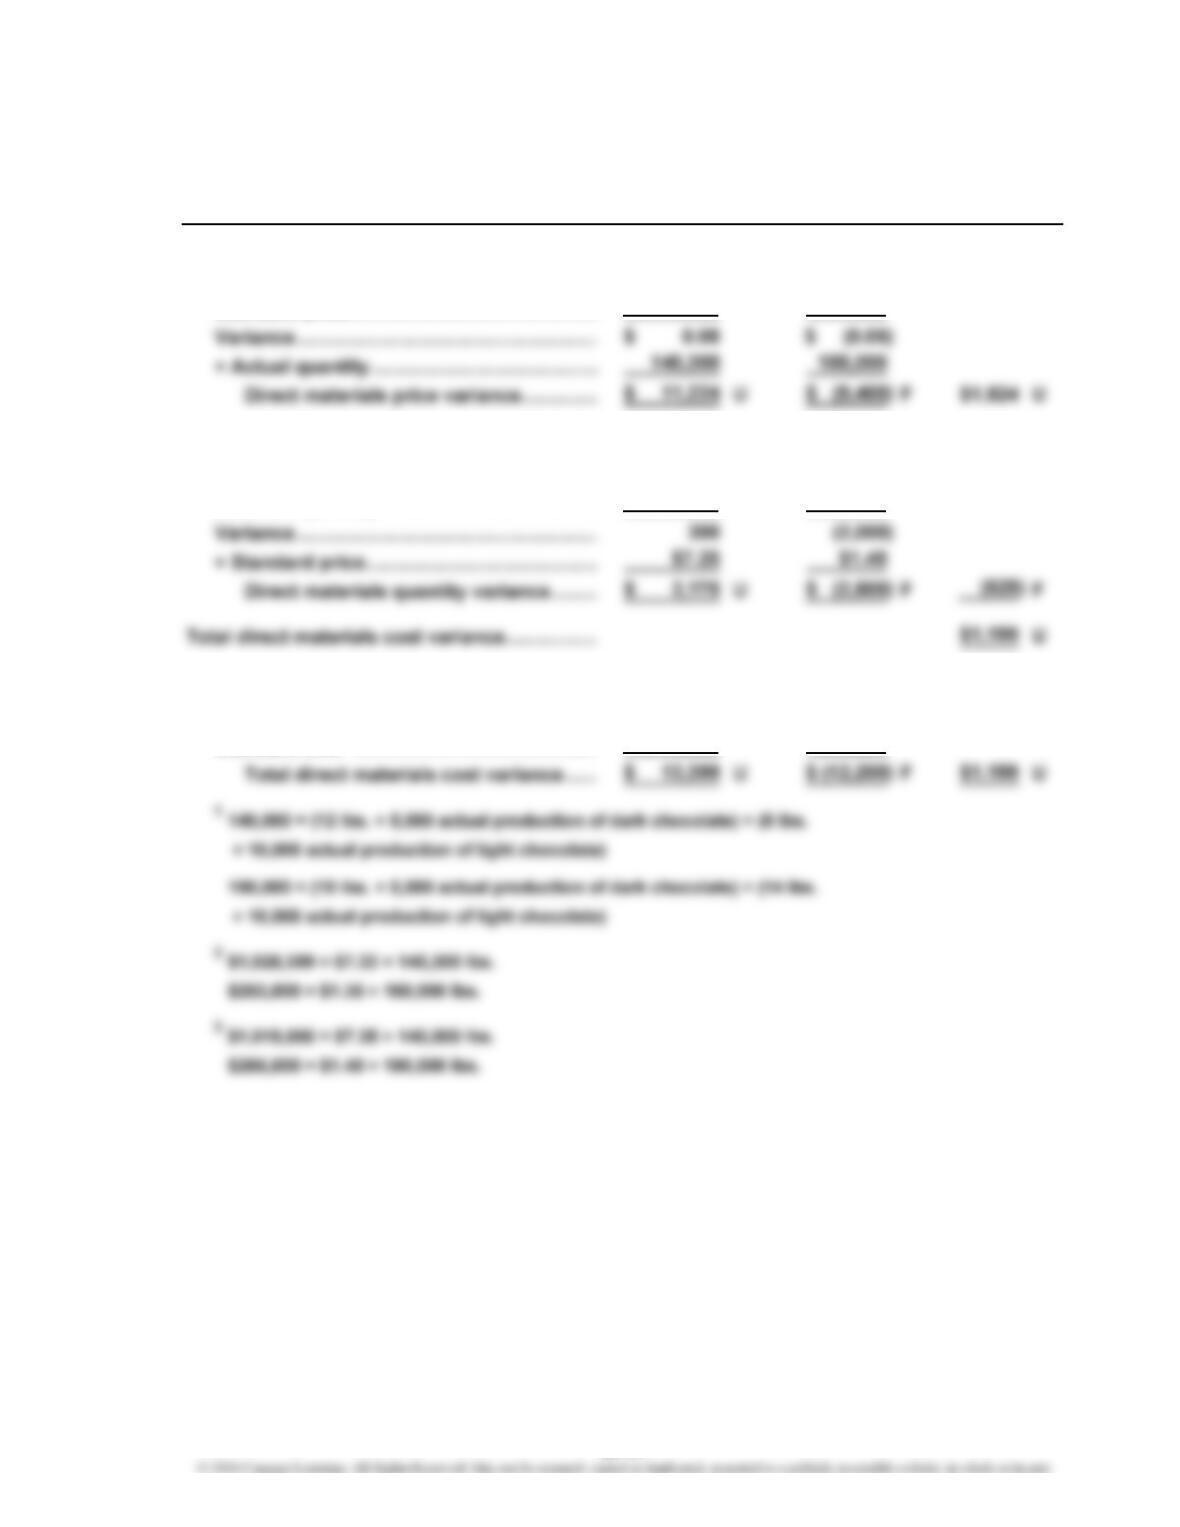
Prob. 23–2A
1. a.
Direct Materials Variance
Price variance:
Actual price……………………………………
…
$ 7.33 $ 1.35
Standard price………………………………… 7.25 1.40
Quantity variance:
Actual quantity used…………………………
…
140,300 188,000
Standard quantity1……………………………
…
140,000 190,000
…
Alternatively, total direct materials cost variance:
Actual cost 2…………………………………… $1,028,399 $253,800
Standard cost 3………………………………
…
1,015,000 266,000
Cocoa Sugar Total
23-37
CHAPTER 23 Performance Evaluation Using Variances from Standard Costs
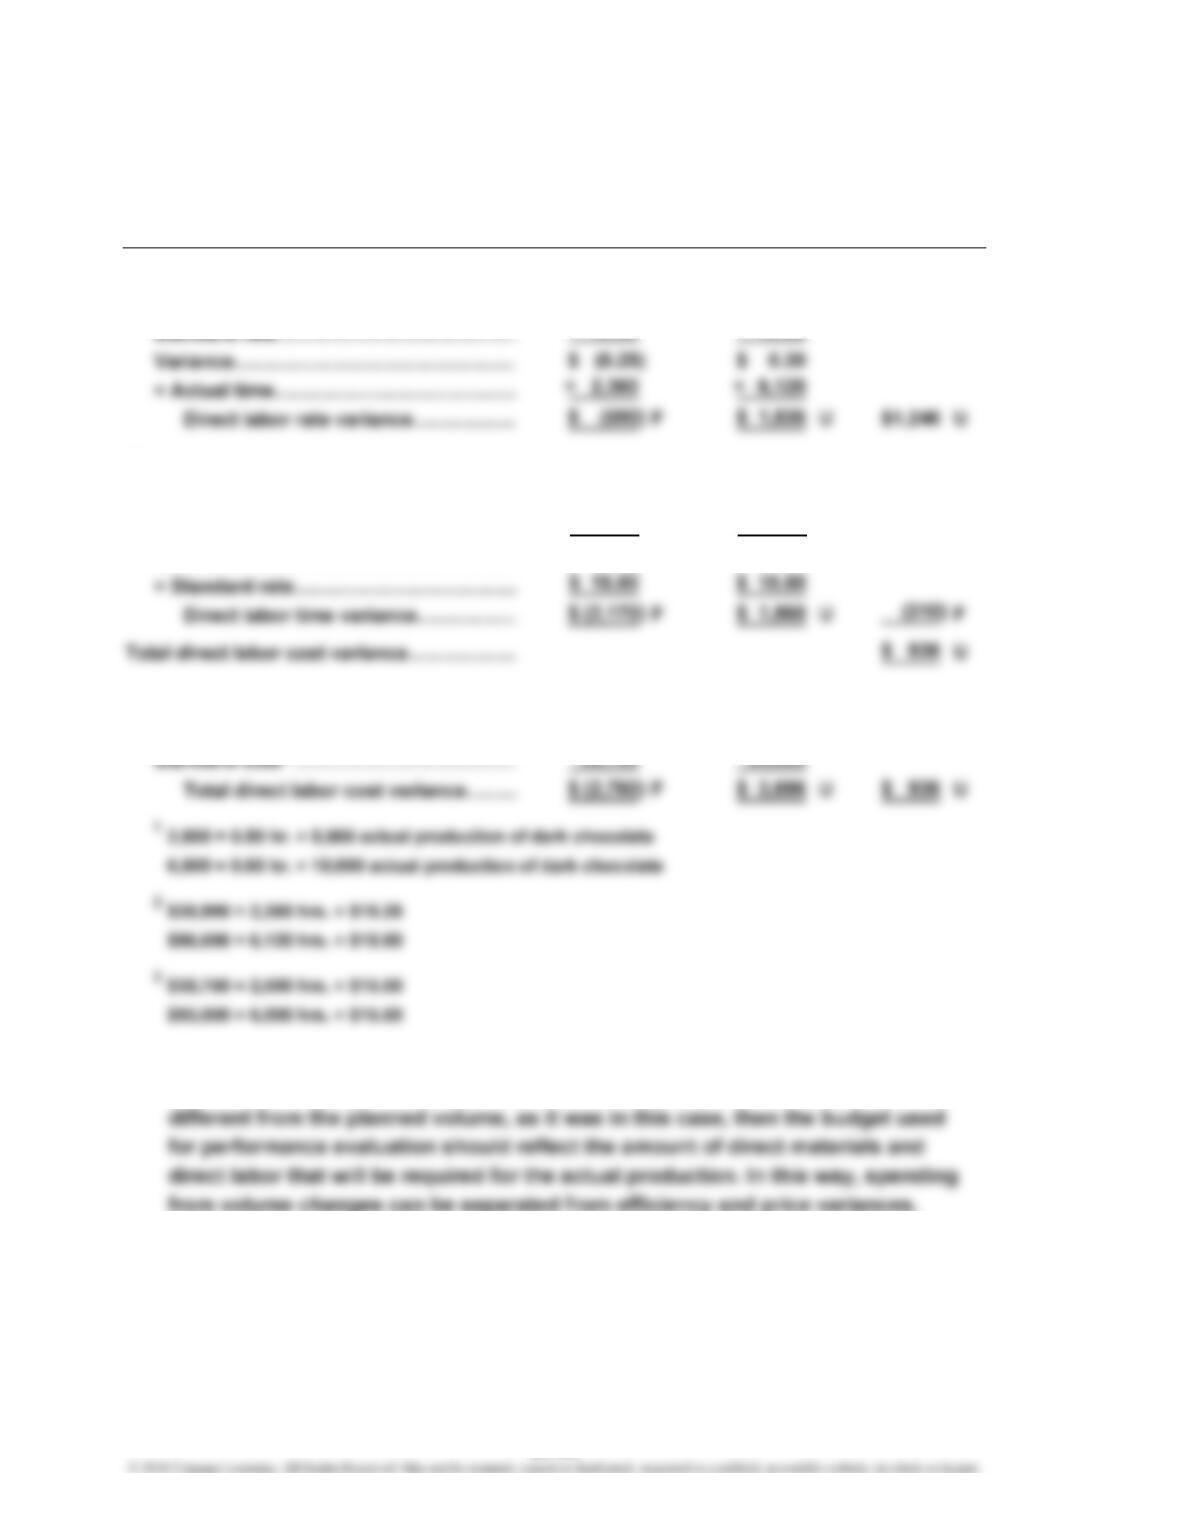
Prob. 23–2A (Concluded)
1. b.
Direct Labor Variance
Rate variance:
Actual rate…………………………………
…
$ 15.25 $ 15.80
15.50 15.50
Time variance:
Actual time…………………………………
…
2,360 6,120
Standard time
1
……………………………
…
2,500 6,000
V
ariance……………………………………
…
(140) 120
Alternatively, total direct labor cost variance:
Actual cost
2
………………………………… $35,990 $96,696
…
3
2. The variance analyses should be based on the standard amounts at actual
volumes. The budget must flex with the volume changes. If the actual volume is
Chocolate Chocolate Total
Dark Light
23-38
V
…
CHAPTER 23 Performance Evaluation Using Variances from Standard Costs
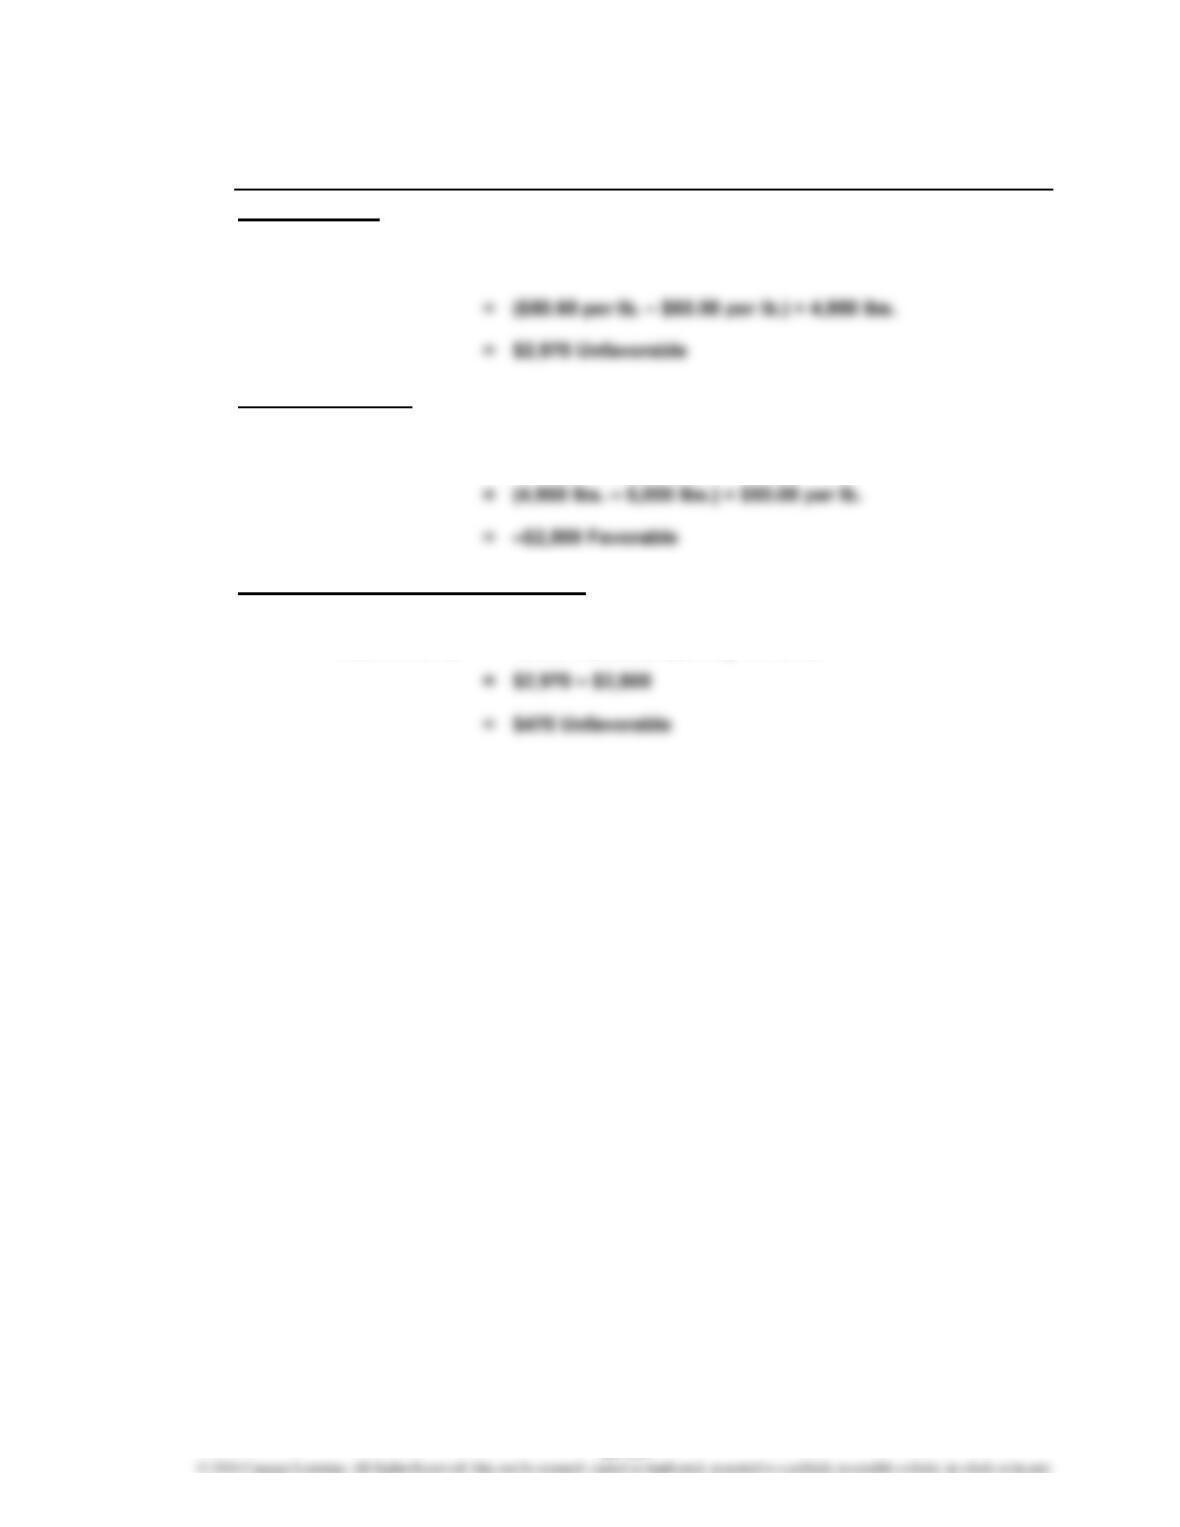
Prob. 23–3A
a.
Price variance:
Quantity variance:
Total direct materials cost variance:
Direct Materials Cost Variance
Direct Materials
Cost Variance =
Direct Materials
Price Variance
Direct Materials
Quantity Variance (Actual Quantity – Standard Quantity) × Standard Price
Direct Materials Price Variance +
Direct Materials Quantity Variance
= (Actual Price – Standard Price) × Actual Quantity
=
23-39
CHAPTER 23 Performance Evaluation Using Variances from Standard Costs
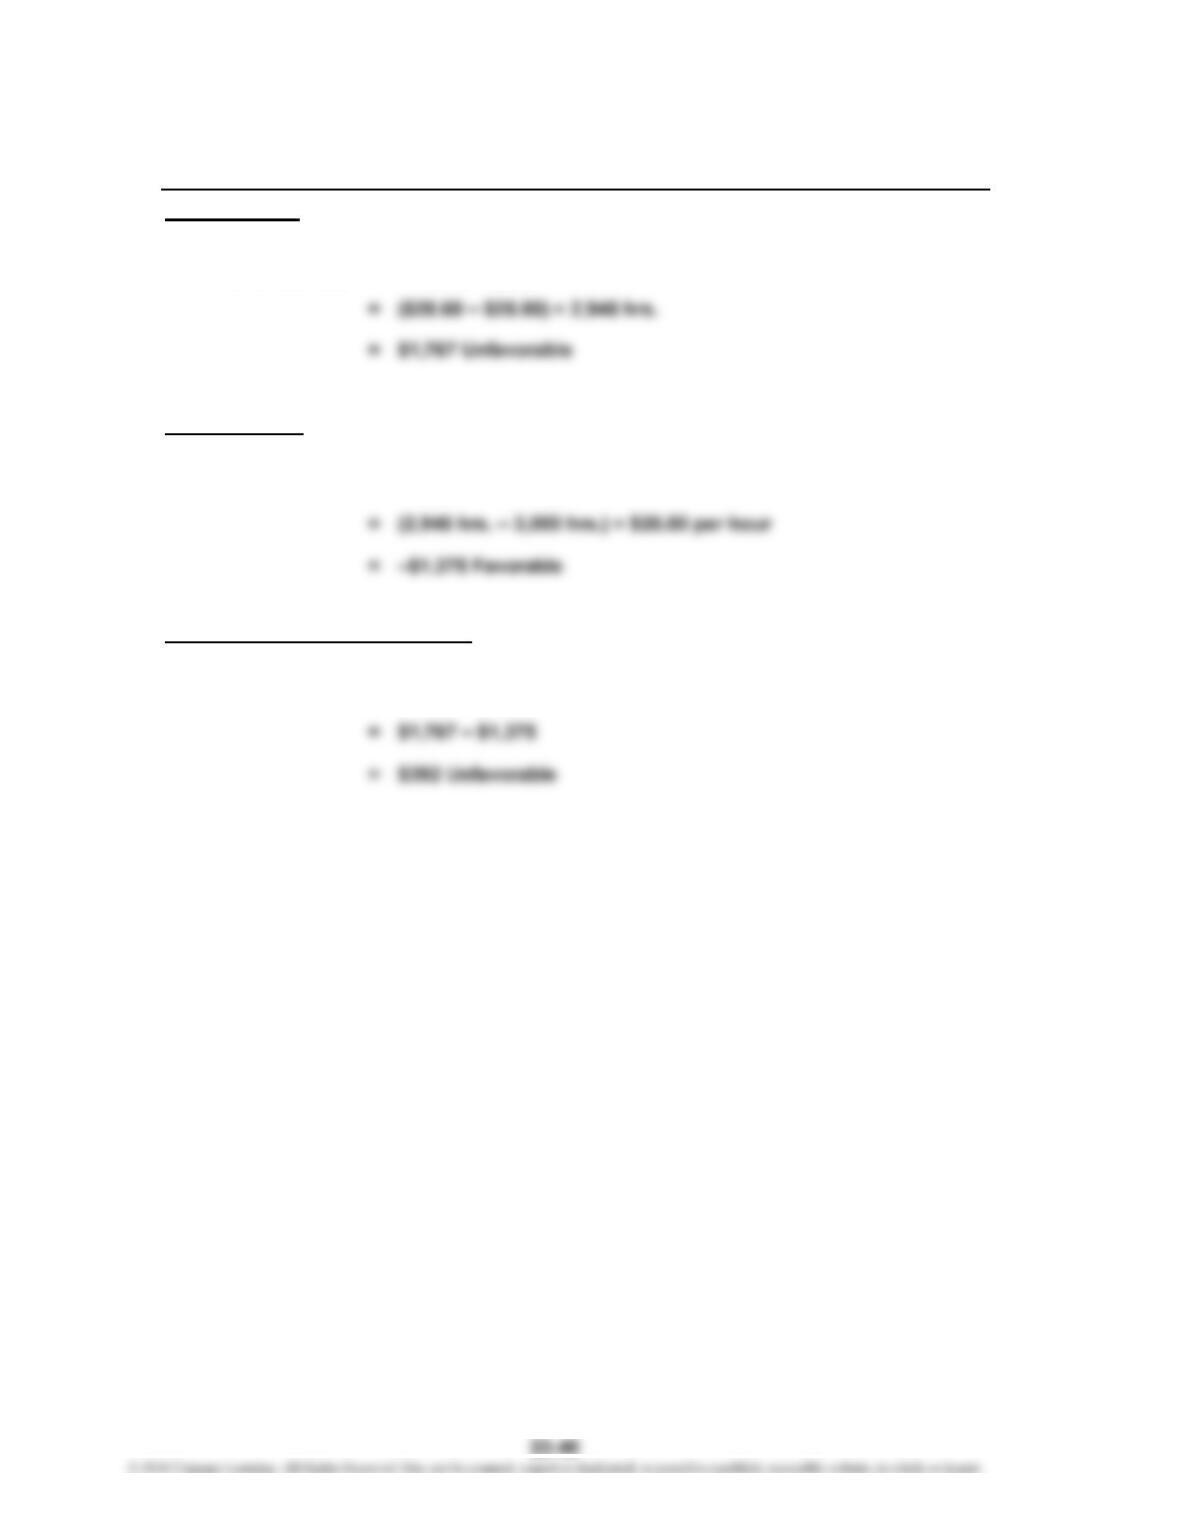
Prob. 23–3A (Continued)
b.
Rate variance:
Time variance:
Total direct labor cost variance:
Direct Labor
Cost Variance =
Direct Labor Cost Variance
Direct Labor
Rate Variance
Direct Labor
Time Variance
=
Direct Labor Time Variance + Direct Labor Rate Variance
(Actual Rate per Hour – Standard Rate per Hour)
× Actual Hours
=(Actual Direct Labor Hours – Standard Direct Labor Hours)
× Standard Rate per Hour