CHAPTER 23 Performance Evaluation Using Variances from Standard Costs
Prob. 23–5B
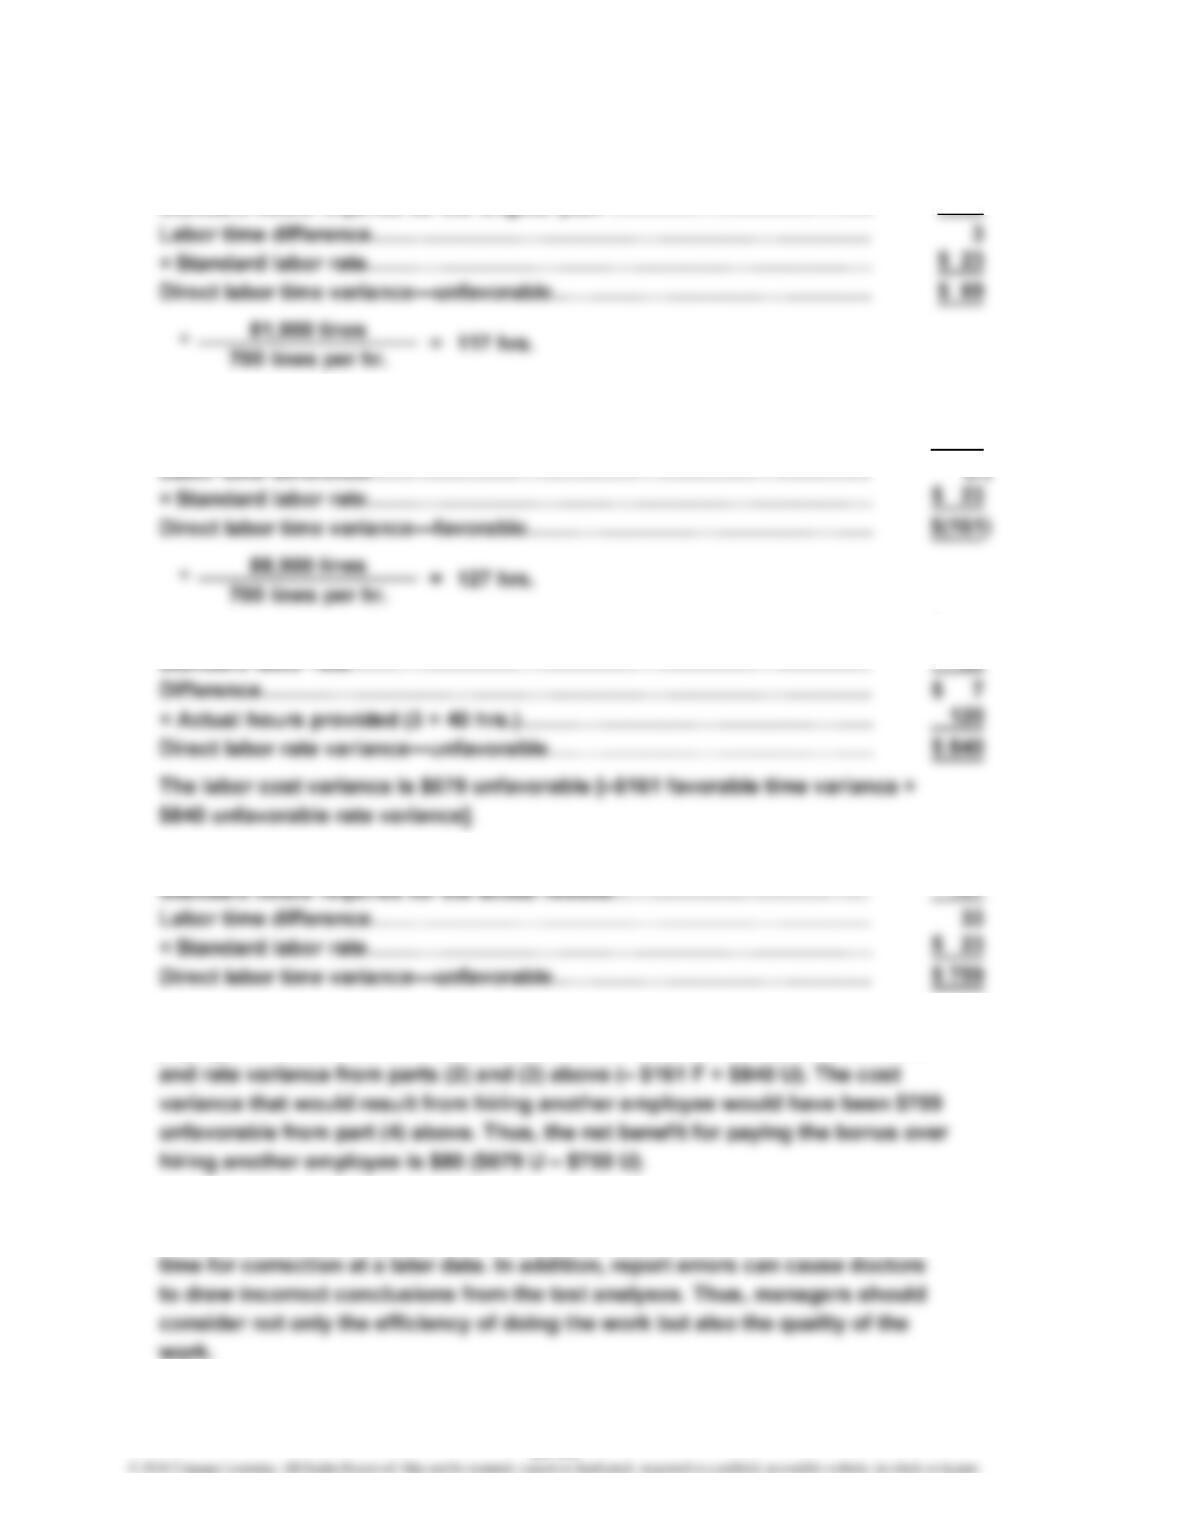
1. Actual hours provided (3 × 40 hrs.)……………………………………………
…
120
Standard hours required for the original plan*………………………………
…
117
2. Actual hours provided (3 × 40 hrs.)……………………………………………
…
120
Standard hours required for the actual results*……………………………… 127
…
3. Actual labor rate……………………………………………………………………
…
$30
Standard labor rate………………………………………………………………… 23
…
…
4. Actual hours provided (4 × 40 hrs.)……………………………………………
…
160
…
127
5. The bonus is the better approach by $80. The direct labor cost variance for
paying the bonus was $679 unfavorable which is the sum of the time variance
6. The labor rate and time variances fail to consider the number of errors in the
report from typist fatigue. A report that has many errors will require significant
23-56
…
CHAPTER 23 Performance Evaluation Using Variances from Standard Costs
Part A
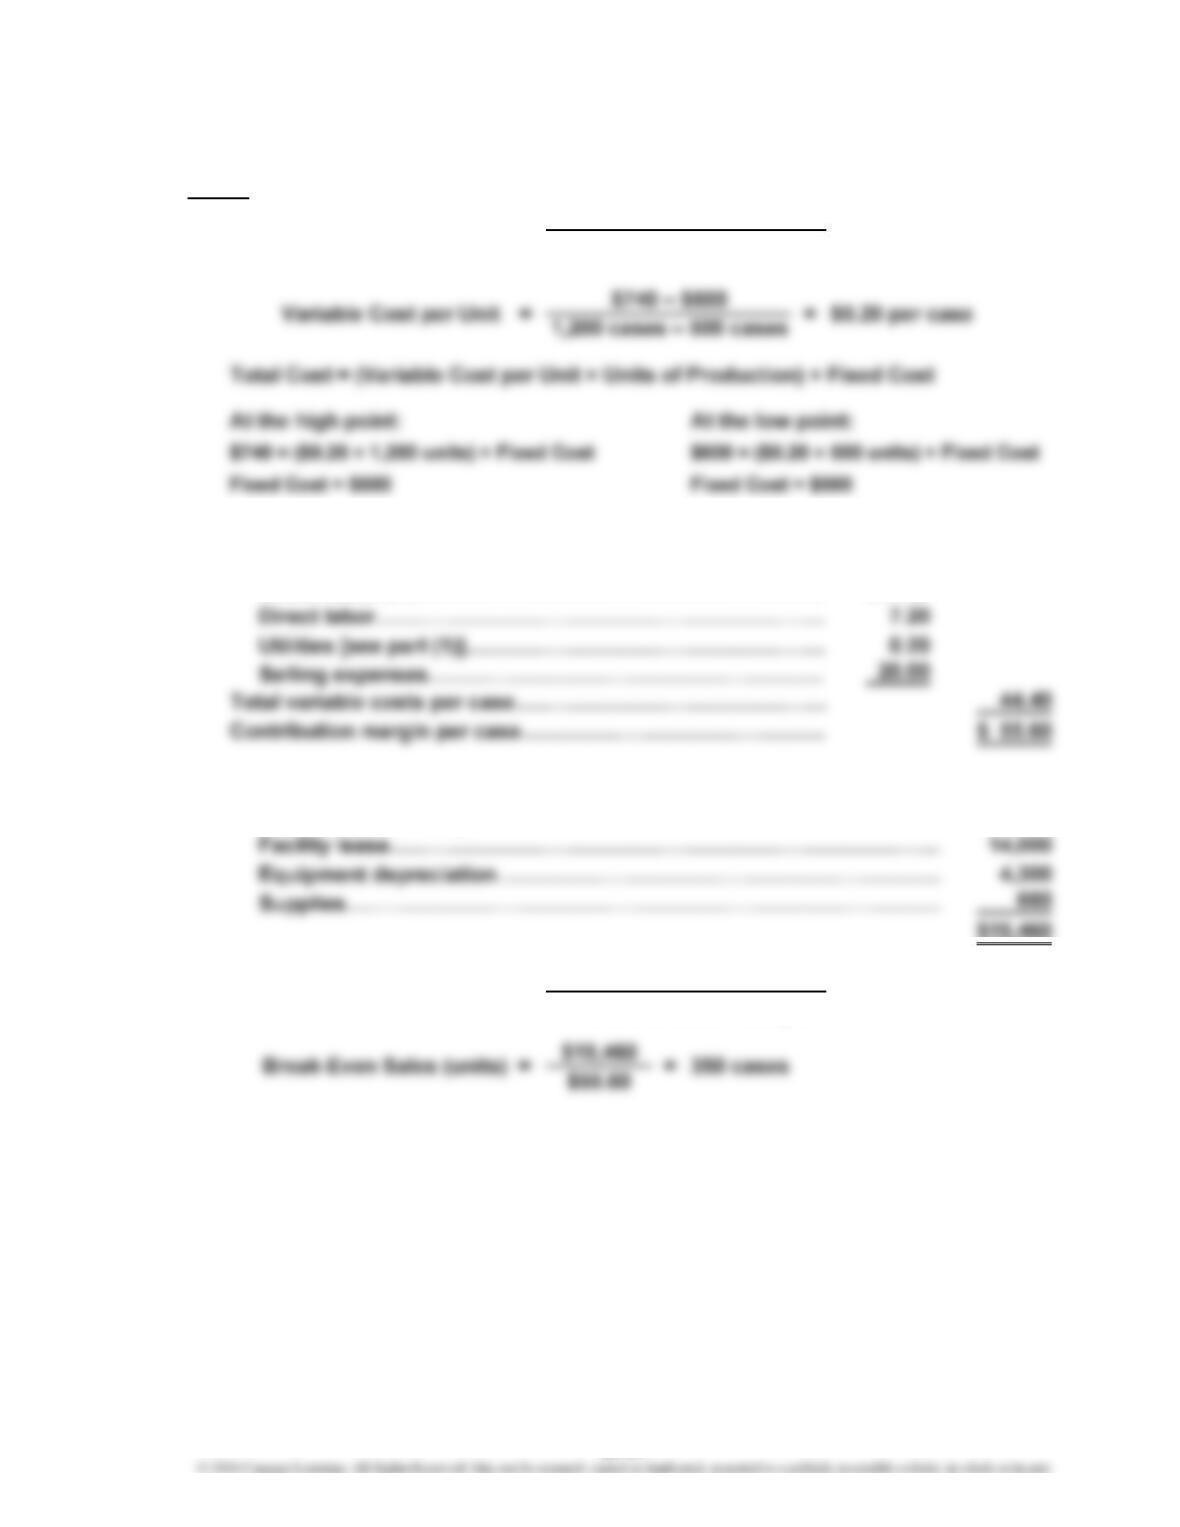
2. Selling price…………………………………………………………
…
$100.00
Less variable costs per case:
Direct materials…………………………………………………
…
$17.00
…
3. Total fixed costs:
Utilities [see part (1)]…………………………………………………………
…
$ 500
4.
COMPREHENSIVE PROBLEM 5
Variable Cost per Unit1. = Difference in Total Cost
Difference in Production
Break-Even Sales (units) =
Fixed Costs
Unit Contribution Margin
23-57
CHAPTER 23 Performance Evaluation Using Variances from Standard Costs
COMPREHENSIVE PROBLEM 5 (Continued)
Part B
5.
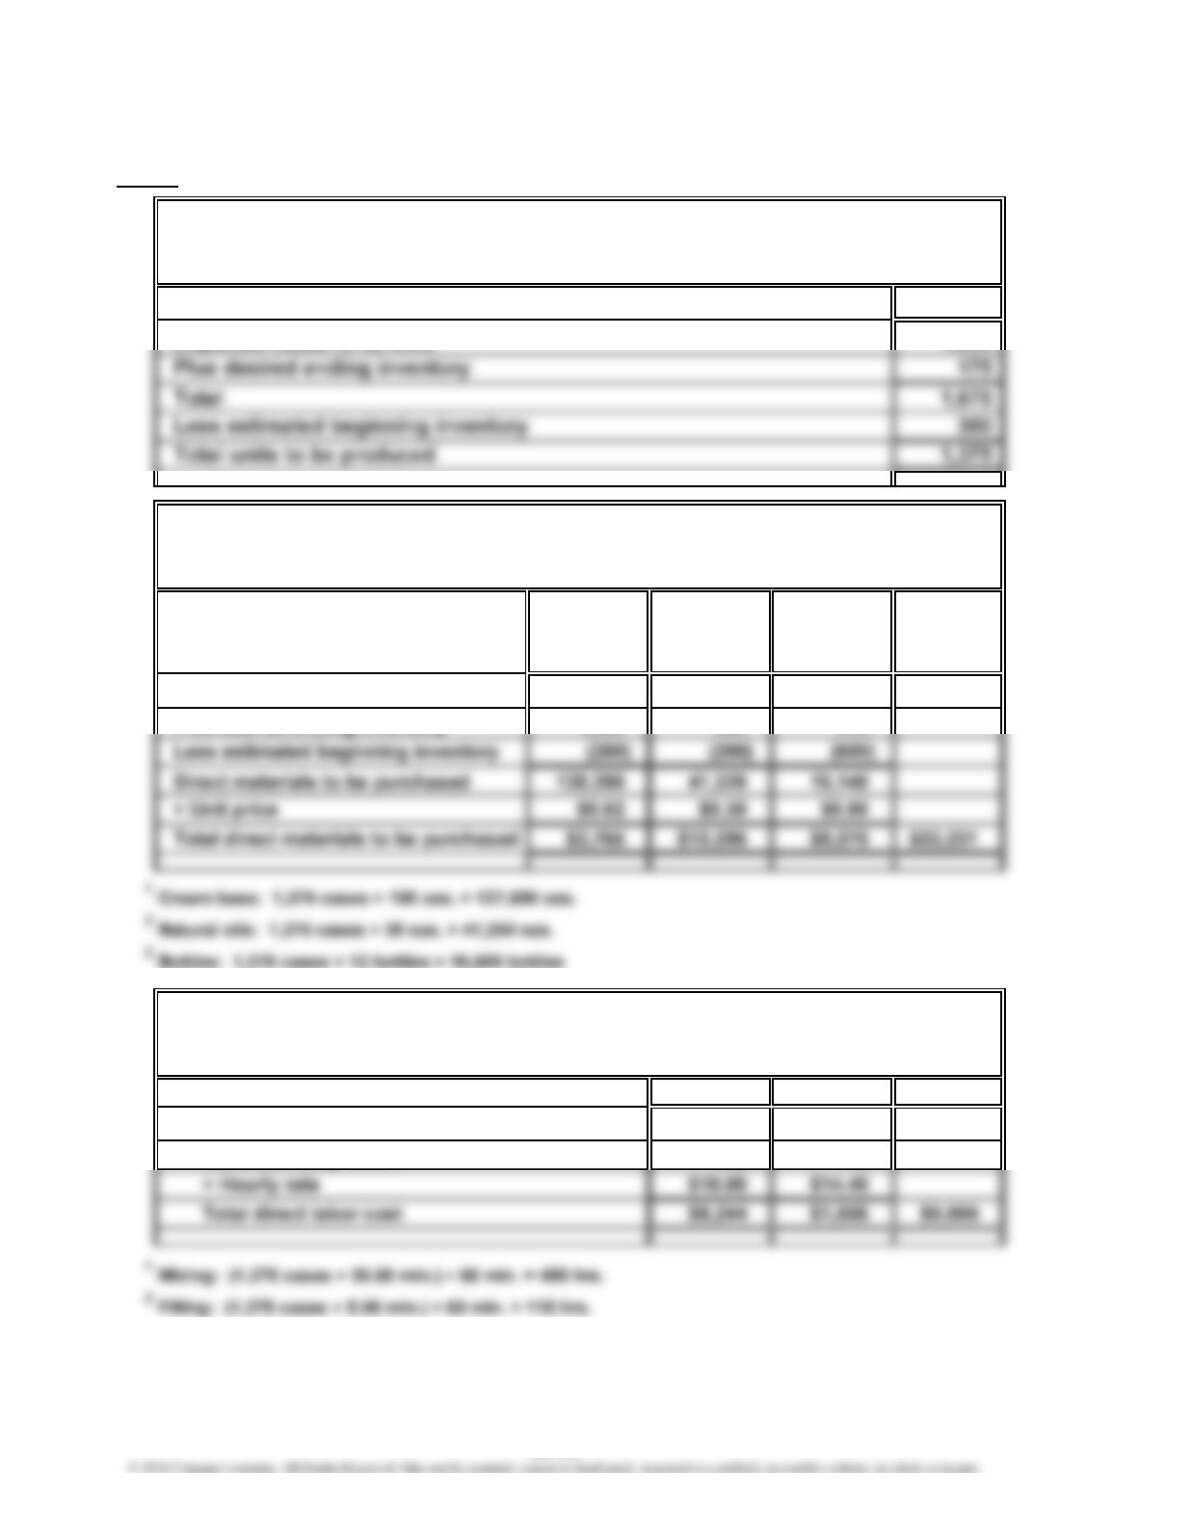
Cases
Expected cases to be sold 1,500
6.
Cream Natural
Base Oils Bottles Total
(ozs.) (ozs.) (bottles)
Units required for production 137,500 41,250 16,500
Plus desired ending inventory 1,000 360 240
7.
Mixing Filling Total
Hours required for production of:
Hand and body lotion 458 115
For the Month Ended August 31, 2016
Production Budget
GENUINE SPICE INC.
Direct Labor Budget
For the Month Ended August 31, 2016
GENUINE SPICE INC.
Direct Materials Purchases Budget
For the Month Ended August 31, 2016
GENUINE SPICE INC.
231
21
23-58
CHAPTER 23 Performance Evaluation Using Variances from Standard Costs
COMPREHENSIVE PROBLEM 5 (Continued)
8.
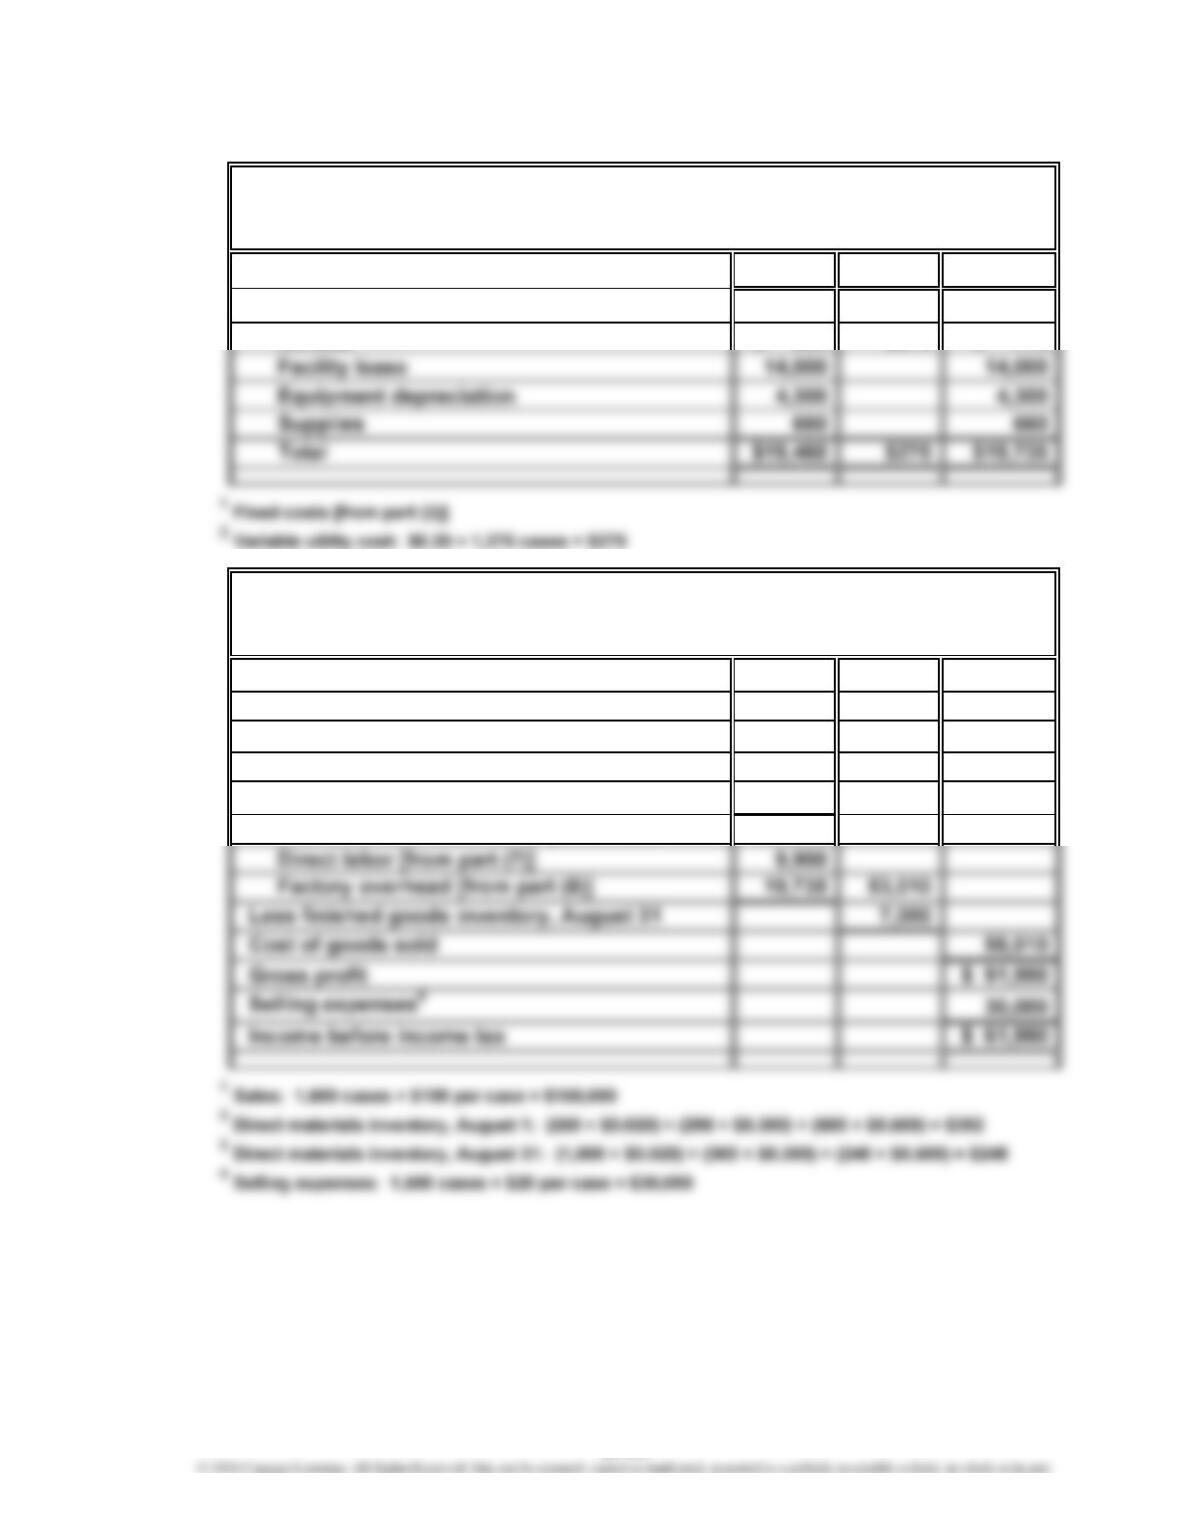
Fixed1Variable2Total
Factory overhead:
Utilities $ 500 $275 $ 775
9.
Sales1$150,000
Finished goods inventory, August 1 $12,000
Direct materials inventory, August 12$ 392
Direct materials purchases [from part (6)] 23,231
Less direct materials inventory, August 313248
Cost of direct materials for production $23,375
For the Month Ended August 31, 2016
GENUINE SPICE INC.
GENUINE SPICE INC.
Factory Overhead Budget
For the Month Ended August 31, 2016
Budgeted Income Statement
23-59
CHAPTER 23 Performance Evaluation Using Variances from Standard Costs
COMPREHENSIVE PROBLEM 5 (Continued)
Part C
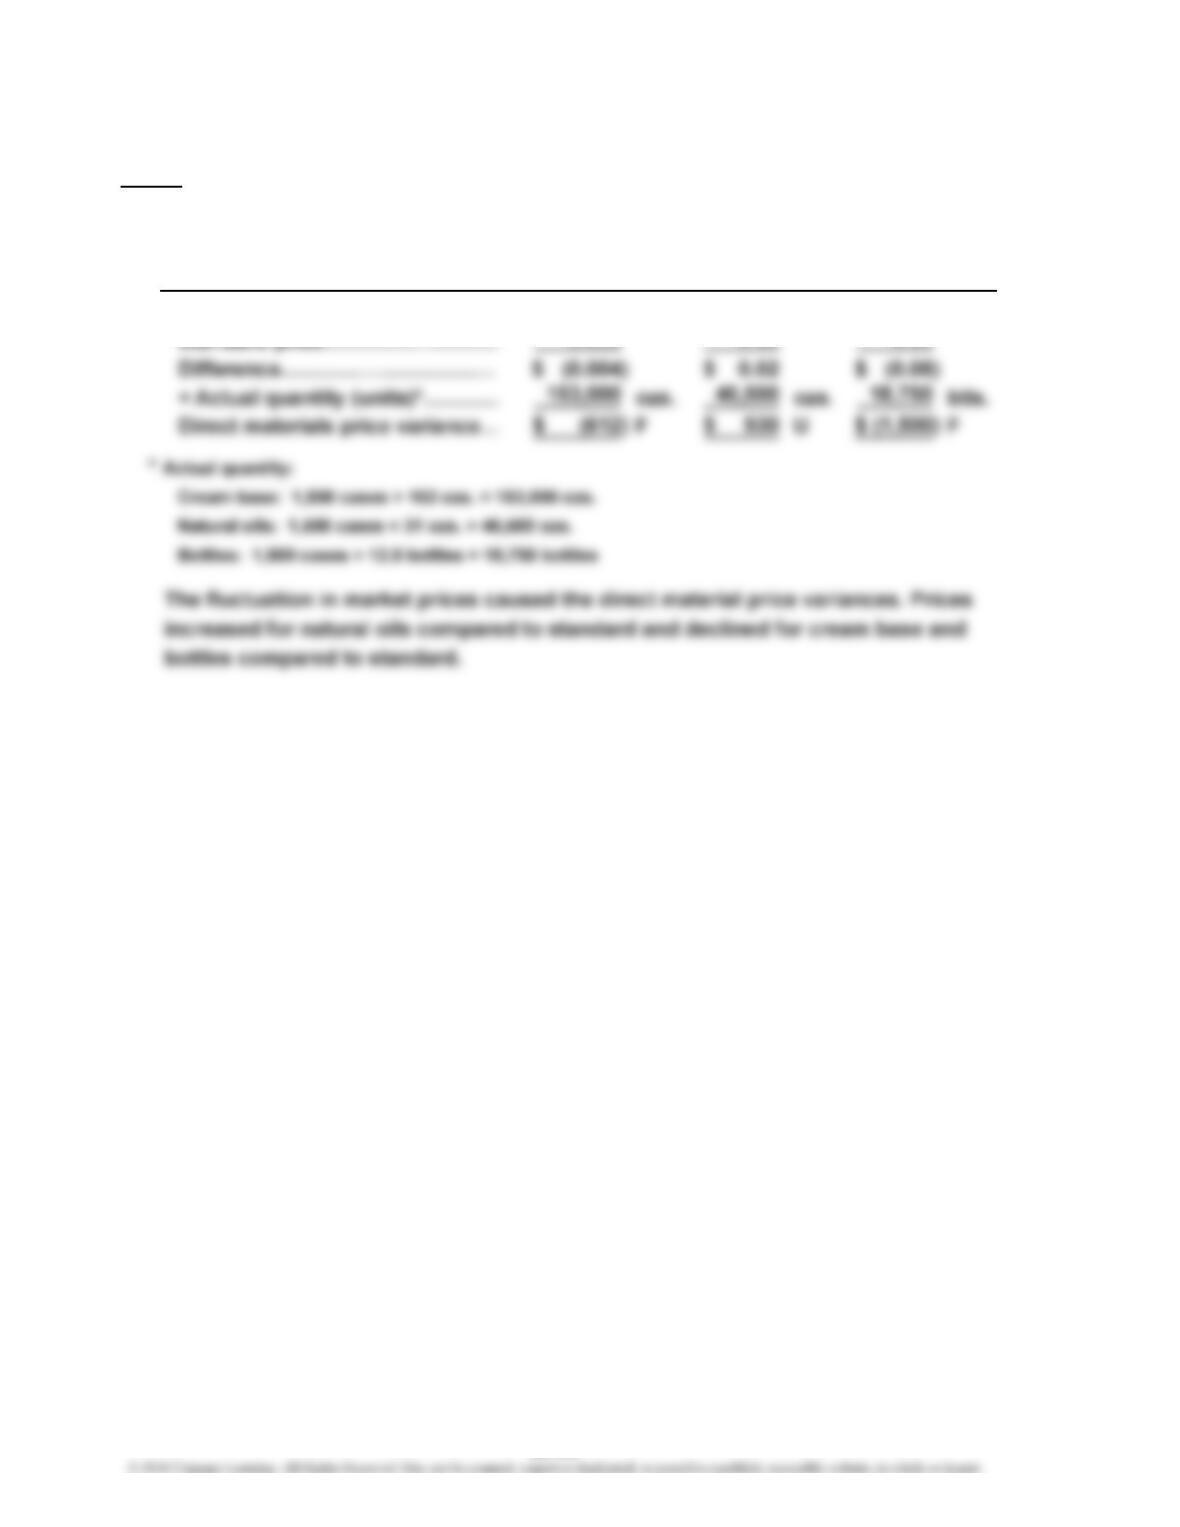
10. Direct Materials Price Variance:
Actual price………………………
…
$ 0.016 $ 0.32 $ 0.42
0.020 0.30 0.50
Base
Cream Natural
BottlesOils
23-60
CHAPTER 23 Performance Evaluation Using Variances from Standard Costs
COMPREHENSIVE PROBLEM 5 (Continued)
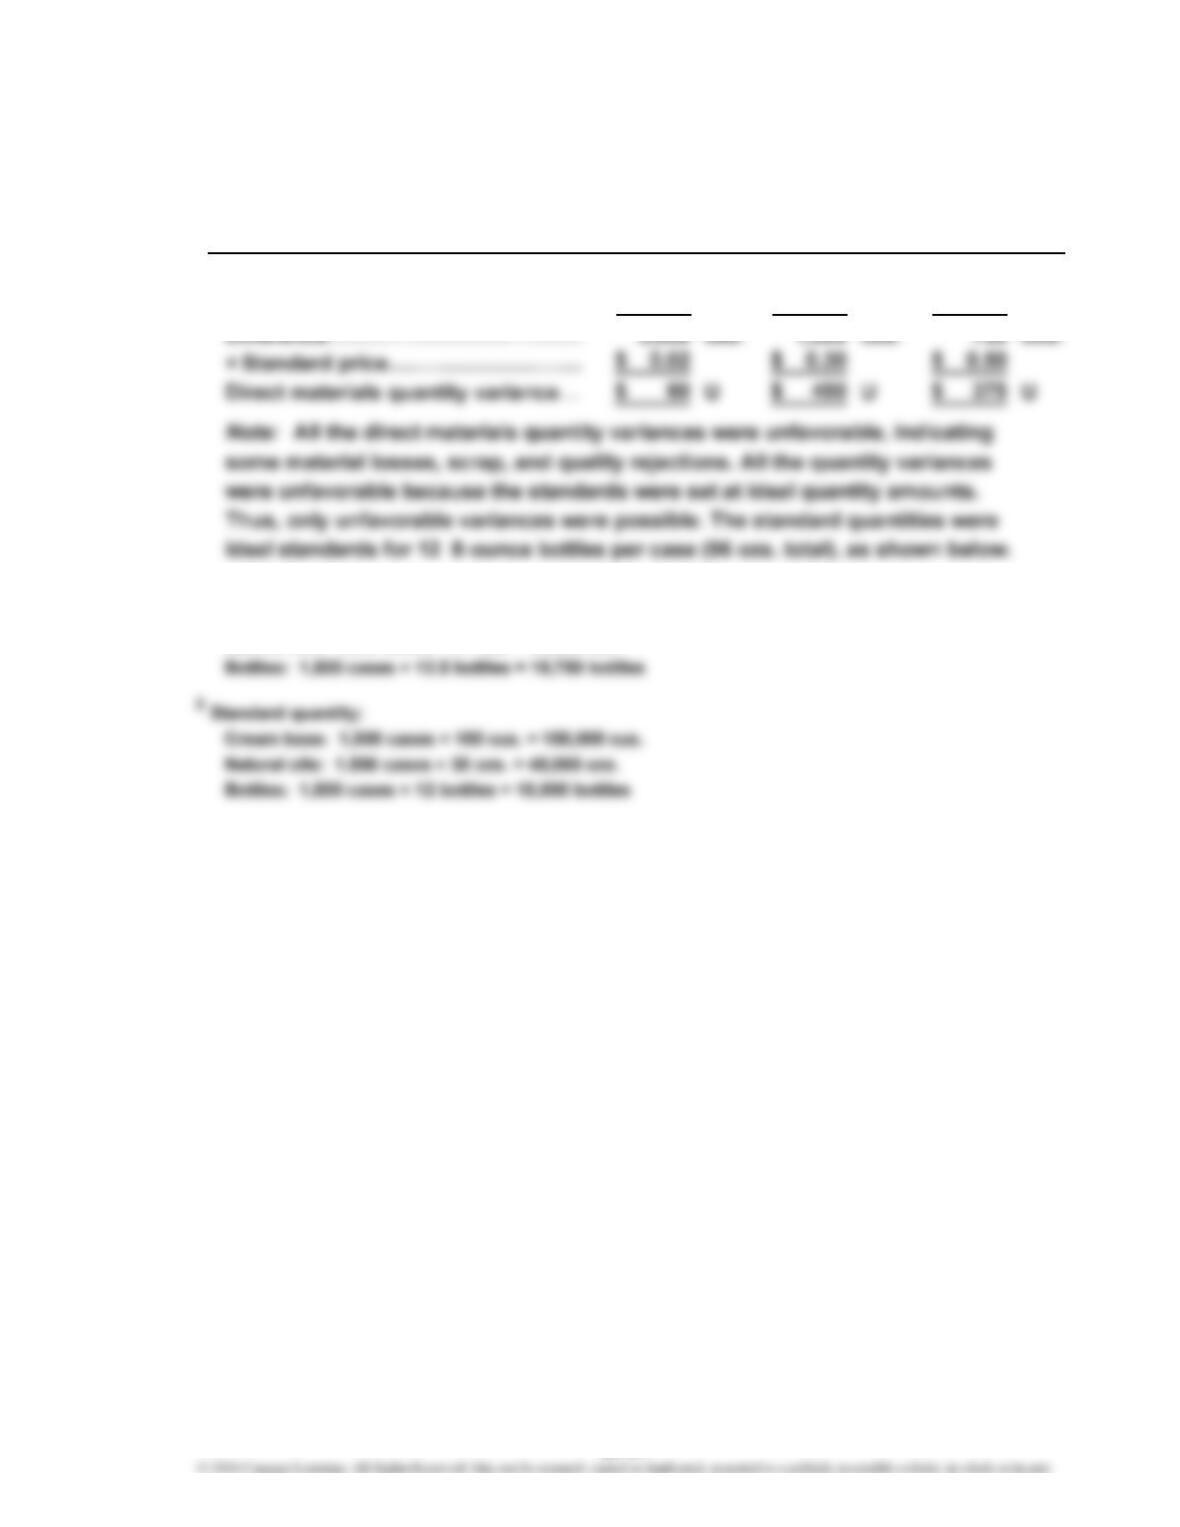
Direct Materials Quantity Variance:
Actual quantity1………………………
…
153,000 ozs. 46,500 ozs. 18,750 btls.
Standard
q
uantit
y
2……………………
…
150,000 45,000 18,000
1Actual quantity:
Cream base: 1,500 cases × 102 ozs. = 153,000 ozs.
Natural oils: 1,500 cases × 31 ozs. = 46,500 ozs.
BottlesOilsBase
Cream Natural
23-61
CHAPTER 23 Performance Evaluation Using Variances from Standard Costs
COMPREHENSIVE PROBLEM 5 (Continued)
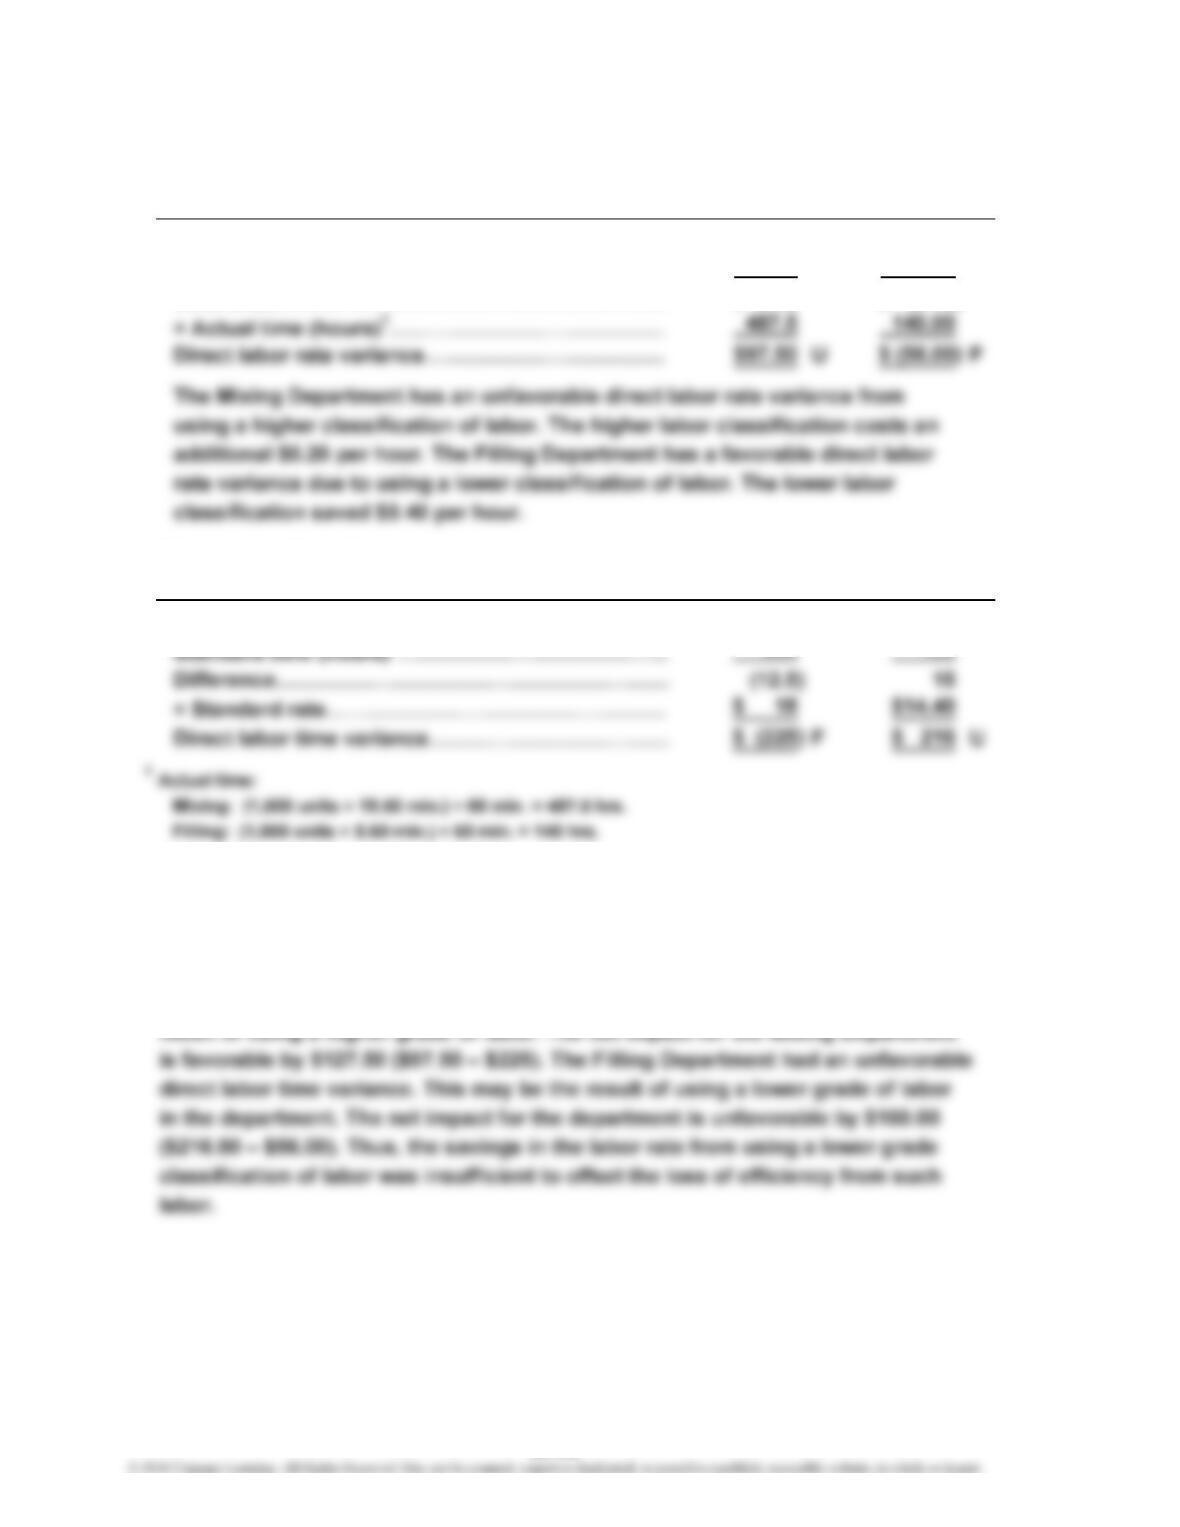
11. Direct Labor Rate Variance:
Actual rate………………………………………………
…
$18.20 $ 14.00
Standard rate……………………………………………
…
18.00 14.40
Difference………………………………………………
…
$ 0.20 $ (0.40)
Direct Labor Time Variance:
Actual time (hours)1……………………………………
…
487.5 140
…
2………………………………… 500 125
2Standard time:
Mixing: (1,500 units × 20.00 min.) ÷ 60 min. = 500 hrs.
Filling: (1,500 units × 5.00 min.) ÷ 60 min. = 125 hrs.
The Mixing Department is producing at a labor time that is slightly better than
standard, thus producing a favorable direct labor time variance. This may be the
Mixing Filling
Department Department
Filling
DepartmentDepartment
Mixing
23-62
CHAPTER 23 Performance Evaluation Using Variances from Standard Costs
COMPREHENSIVE PROBLEM 5 (Continued)
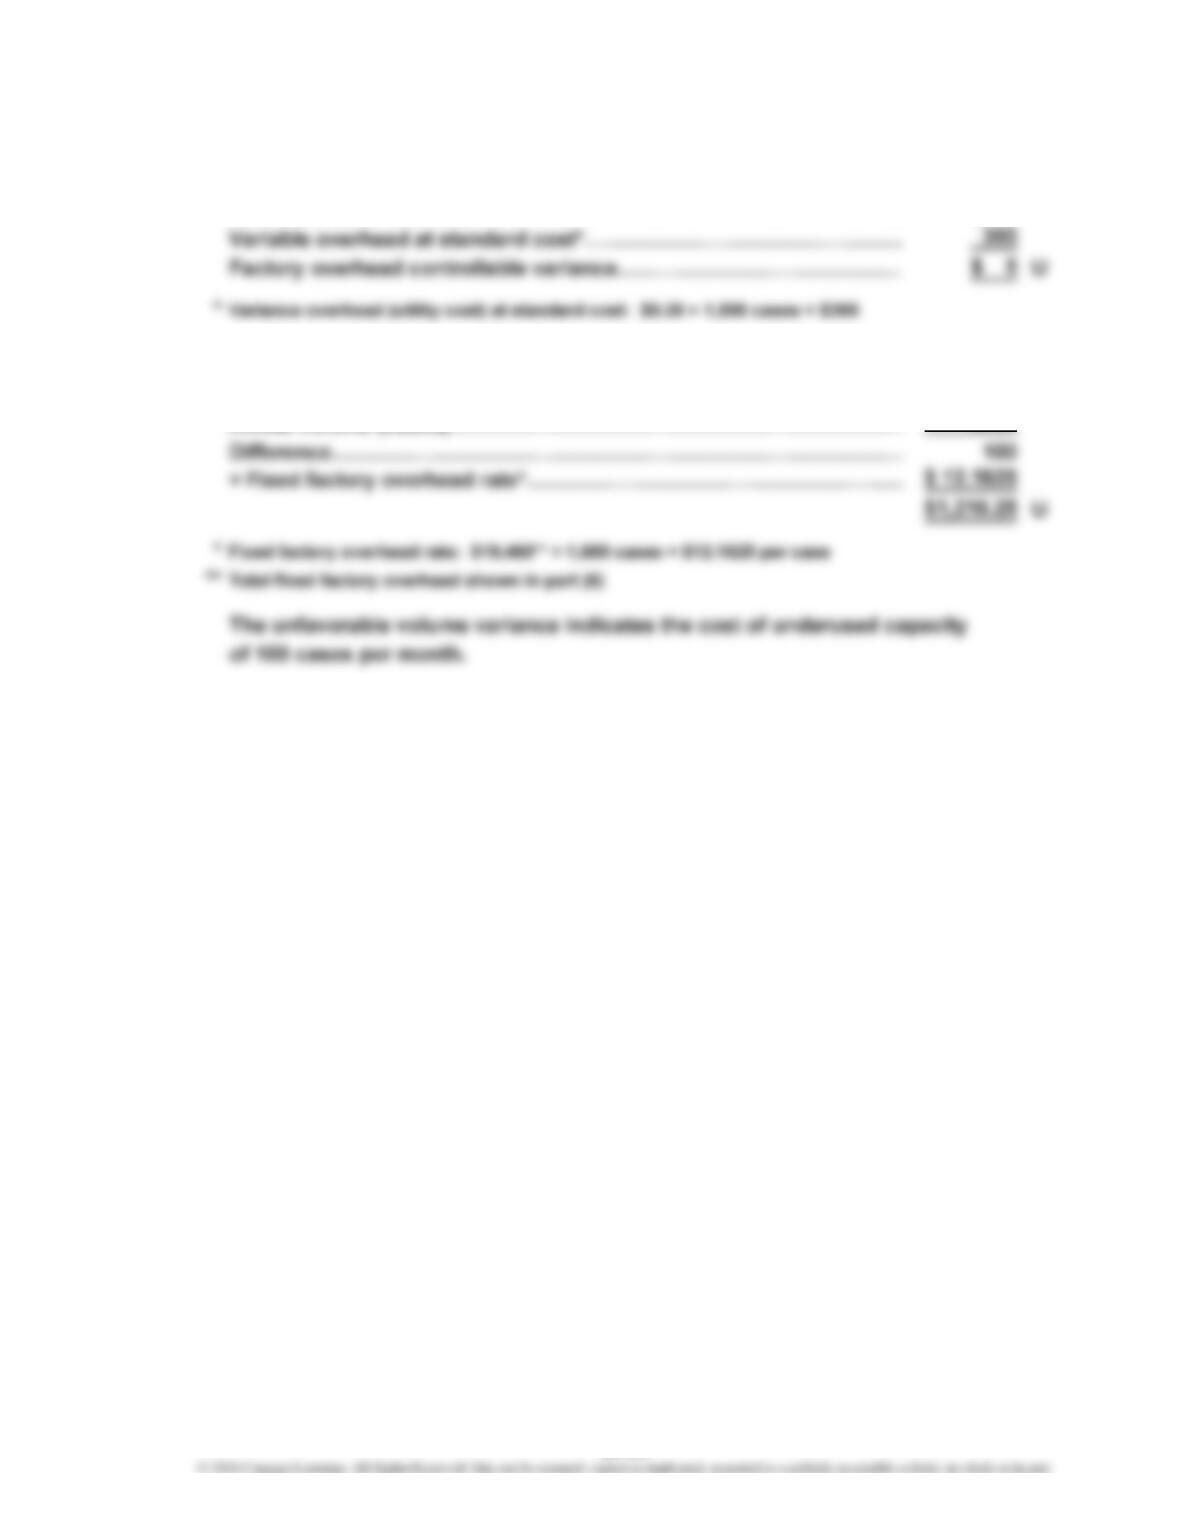
12. Factory Overhead Controllable Variance:
Actual variable overhead……………………………………………………
…
$305
13. Factory Overhead Volume Variance:
Normal volume (cases)………………………………………………………
…
1,600
Actual volume (cases)………………………………………………………
…
1,500
23-63
CHAPTER 23 Performance Evaluation Using Variances from Standard Costs
COMPREHENSIVE PROBLEM 5 (Concluded)
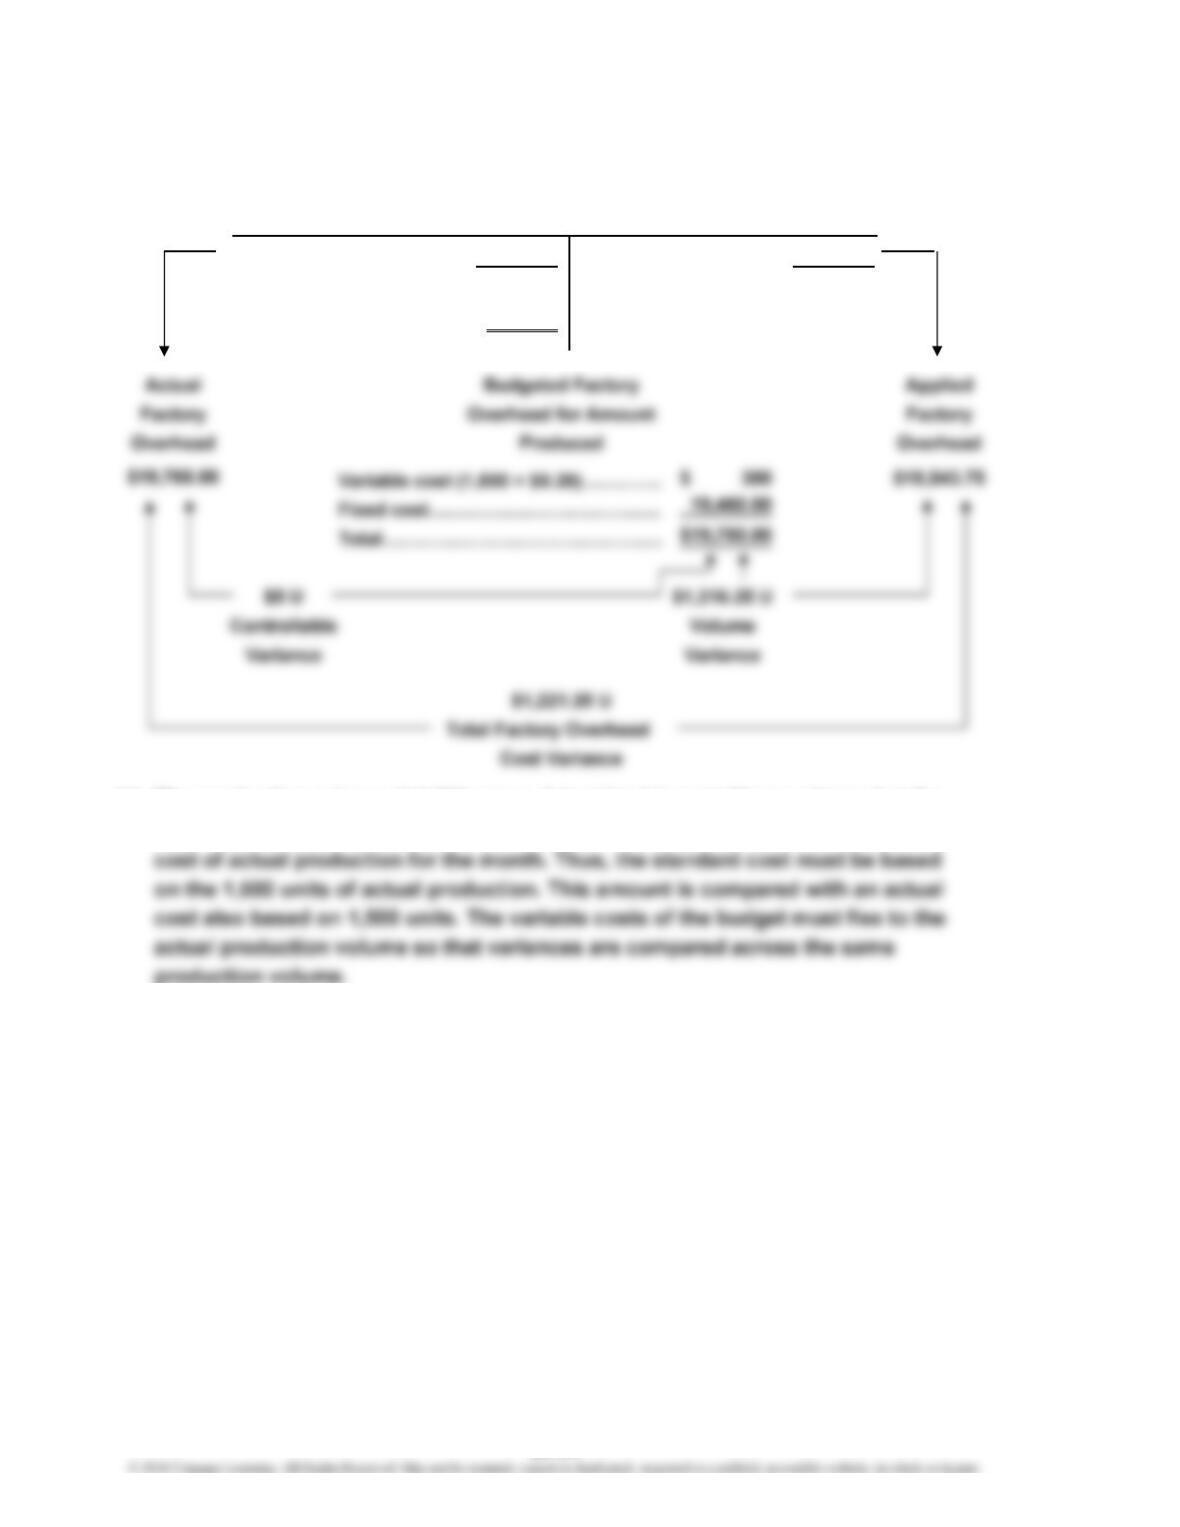
Actual costs 19,765.00 Applied costs 18,543.75
($19,460 + $305) [1,500 × ($12.1625 + $0.20)]
Balance (underapplied) 1,221.25
14. The production volume of 1,375 cases determined in part (5) was planned at the
beginning of August. The variances compare the actual cost and the standard
Alternative Computation of Overhead Variances
Factory Overhead
23-64
CHAPTER 23 Performance Evaluation Using Variances from Standard Costs
CP 23–1
The use of ideal standards is a legitimate concern for Henry. It is likely that such
standards are too tight and do not include the necessary fatigue factors that are
likely in this type of operation. It seems as though Henry is arguing for practical
standards that can be attained if the operation is running well. Maybe some standard
in between is warranted, but that is not the issue. The issue is Dash’s method of
CP 23–2
Although the Tungston Company performance measurement system uses both
financial and nonfinancial measures, there may still be some serious performance
omissions. The financial measures are good measures of financial performance.
Likewise, employee satisfaction should be measured because satisfied employees may
CASES & PROJECTS
23-65
CHAPTER 23 Performance Evaluation Using Variances from Standard Costs
CP 23–3
This is a case where there is strong evidence that the poor performance that is
occurring inside the Assembly Department may be the result of behaviors outside
of the department. This is one of the classic problems with variance analysis. Often,
the variances reflect causes outside of the responsibility center manager’s control.
That is what appears to be happening here. The Assembly supervisor complains that
both the purchased parts and incoming material from the Fabrication Department
have been giving them trouble. A review of performance reports reveals the following:
CHAPTER 23 Performance Evaluation Using Variances from Standard Costs
CP 23–4
The plant manager is placing pressure on the controller because the controllable
variance is very unfavorable. The claim is that these costs are not really variable at
all. This is a very difficult claim to accept. This is a small company, so it purchases
its power from the outside. The power and light bill is variable to the amount of
23-67
CHAPTER 23 Performance Evaluation Using Variances from Standard Costs
CP 23–5
Use this activity to compare performance measures from different groups and their
selected cities.
The following are examples of performance measures from Worcester,
Massachusetts:
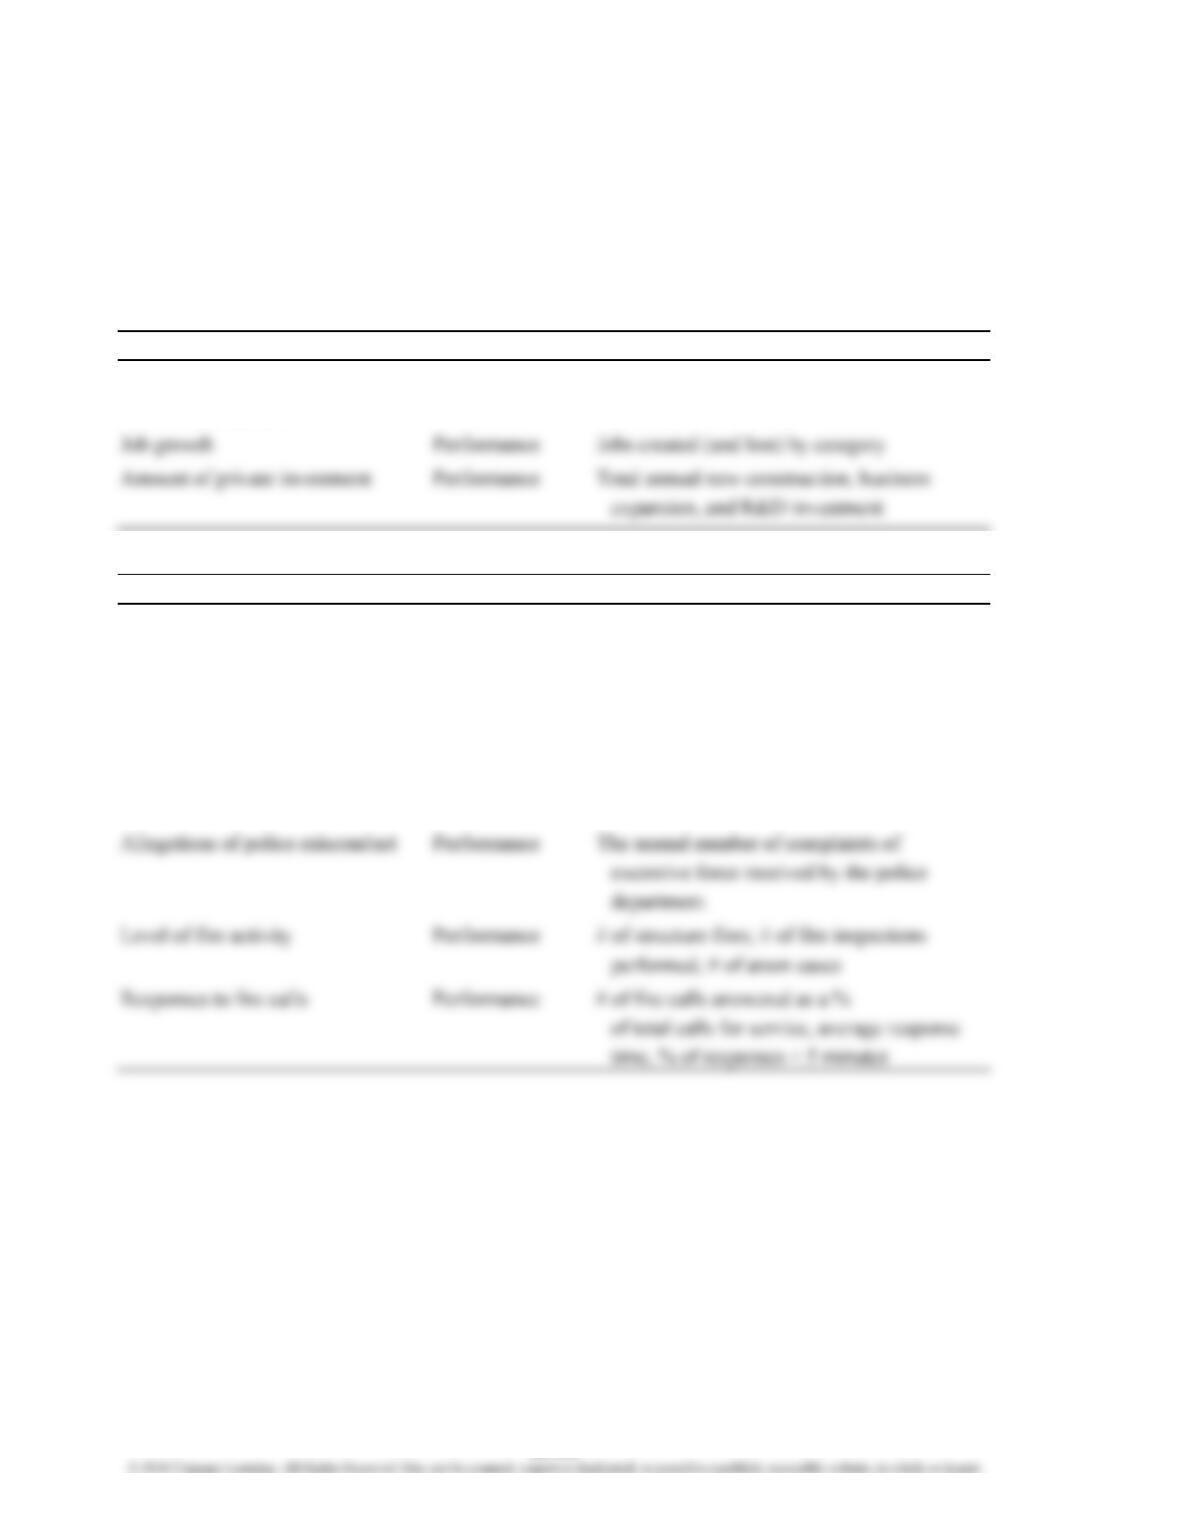
ECONOMIC DEVELOPMENT
Indicator Outcome Type Measured As
Growth of commercial and Performance Change in total assessed value
residential tax base over time
PUBLIC SAFETY
Indicator Outcome Type Measured As
Level of crime Performance Crime rate and clearance rate by type
of crime
Police community relations Performance Responses to annual citizen survey
questions, performance of personnel
on tests of courtesy, professionalism,
and respect
All measured both citywide and by neighborhood
23-68
CP 23–5 (Continued)
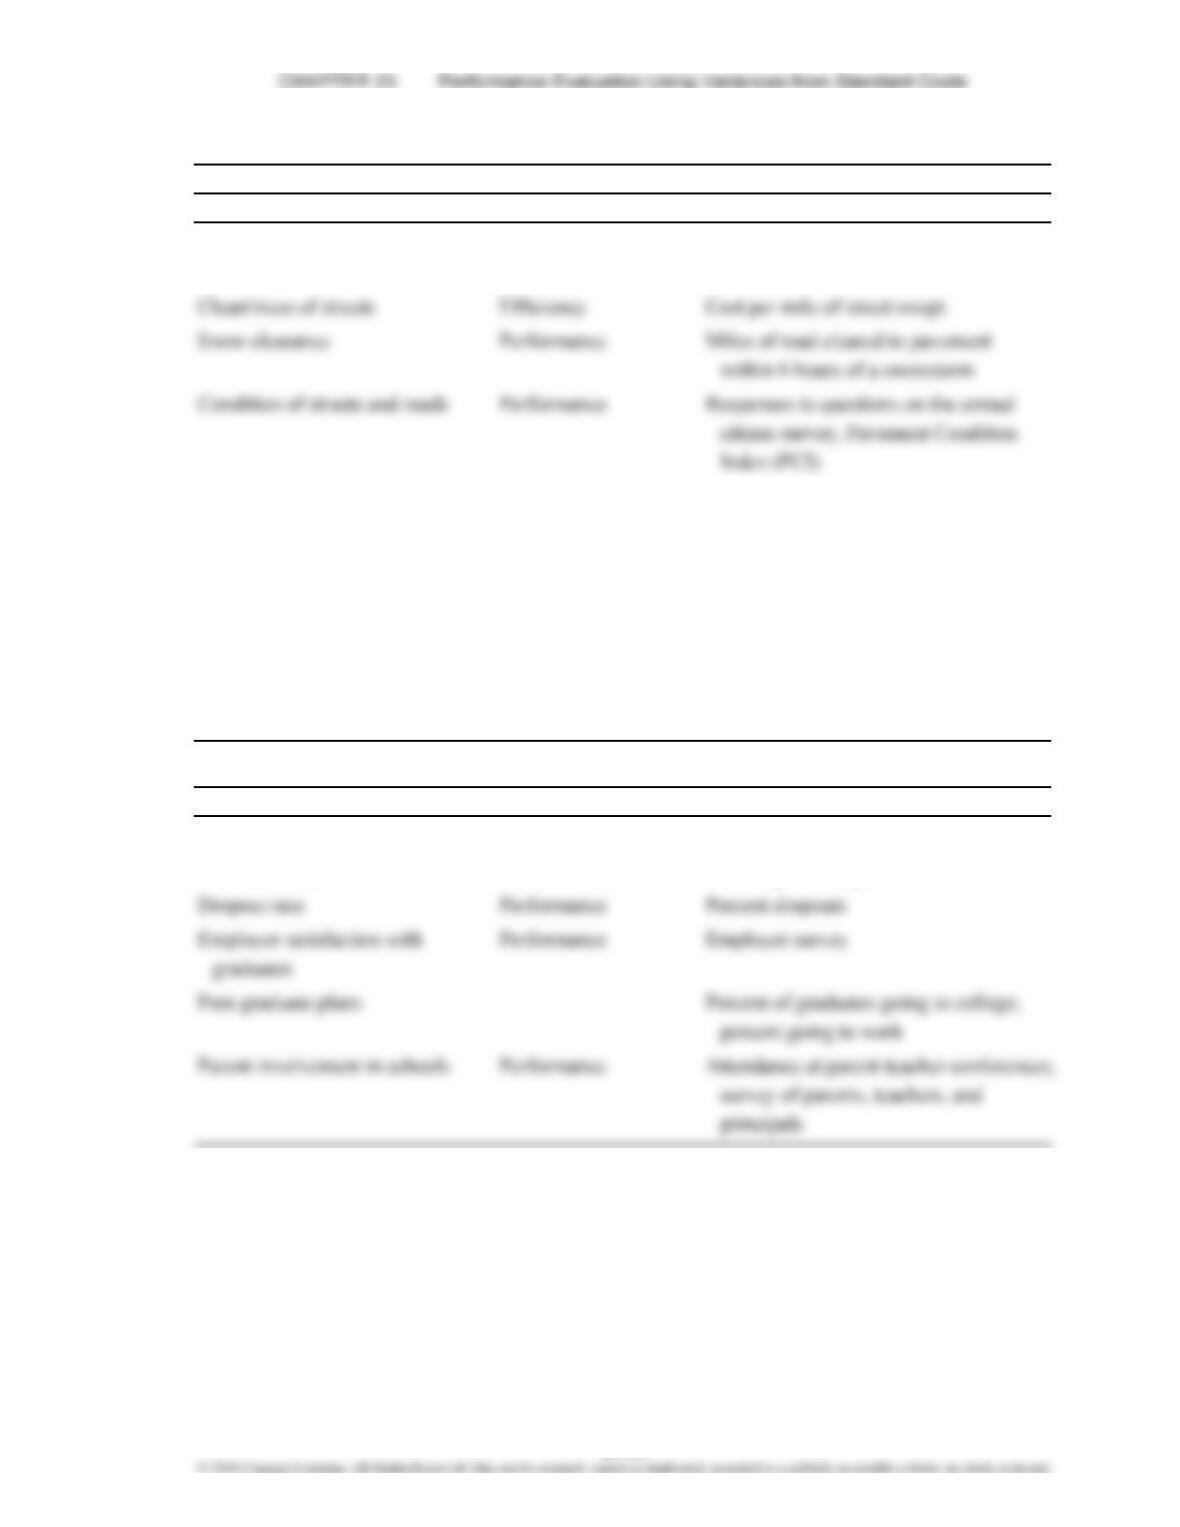
IMPROVED MUNICIPAL SERVICES
Indicator Outcome Type Measured As
Cleanliness of streets Performance Responses to questions on the annual
citizen survey, objective resident ratings
Effectiveness of recycling program Performance % of trash recycled
Effectiveness of anti-graffiti Performance # of graffiti incident responses, response
program time from call for service to cleanup
Cost effectiveness of solid Efficiency Cost per ton of waste collected
waste collection
Library usage Performance Circulation per capita
Citizen involvement (citywide Performance % of eligible voters registered;
and by neighborhood) % of registered voters voting
EDUCATION
Indicator Outcome Type Measured As
Student and school achievement Performance MCAS test scores
Graduation rate Performance Percent graduating
23-69
CHAPTER 23 Performance Evaluation Using Variances from Standard Costs
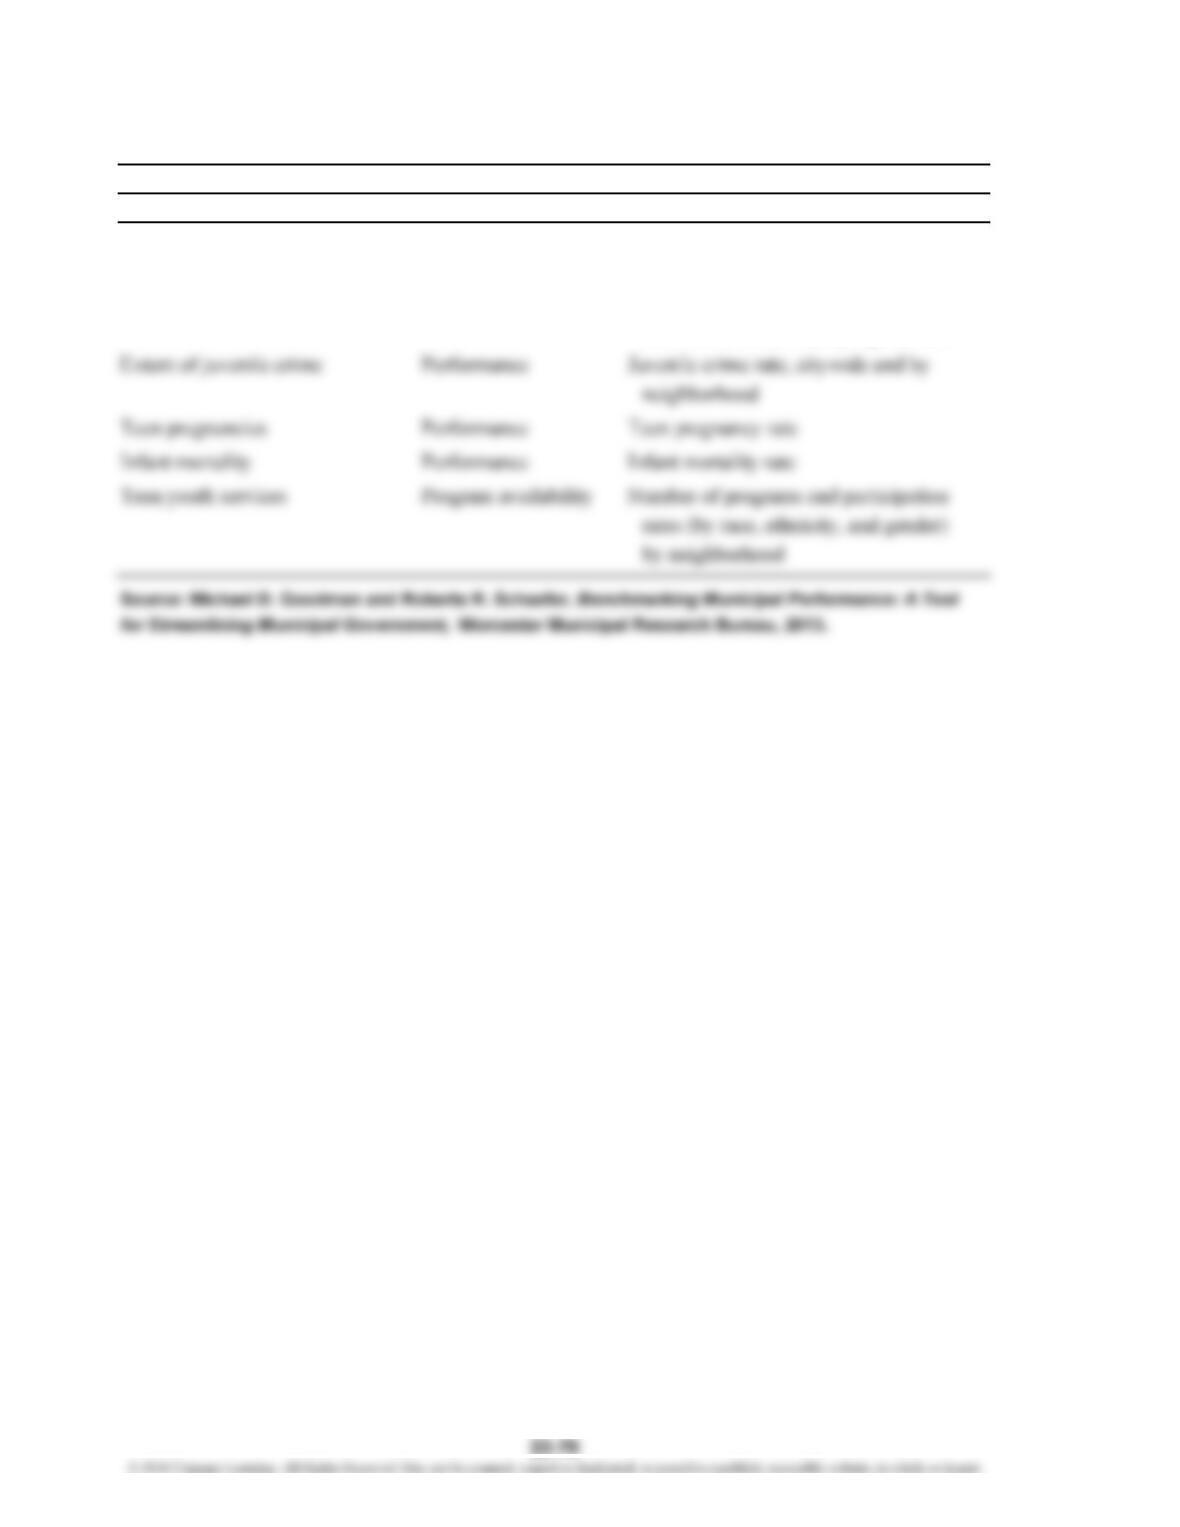
CP 23–5 (Concluded)
IMPROVED YOUTH SERVICES
Indicator Outcome Type Measured As
Presence of “at risk youth” Performance Responses to questions from the Youth
Risk Behavior Survey (includes
questions on drug and alcohol use
and violent behavior) by high school