Financial and Managerial Accounting, 9th Edition
22-1
CHAPTER 22
PERFORMANCE MEASUREMENT AND
RESPONSIBILITY ACCOUNTING
Related Assignment Materials
Student Learning Objectives
Discussion
Questions
Quick Studies*
Exercises*
Problems*
AA, DA and
BTN
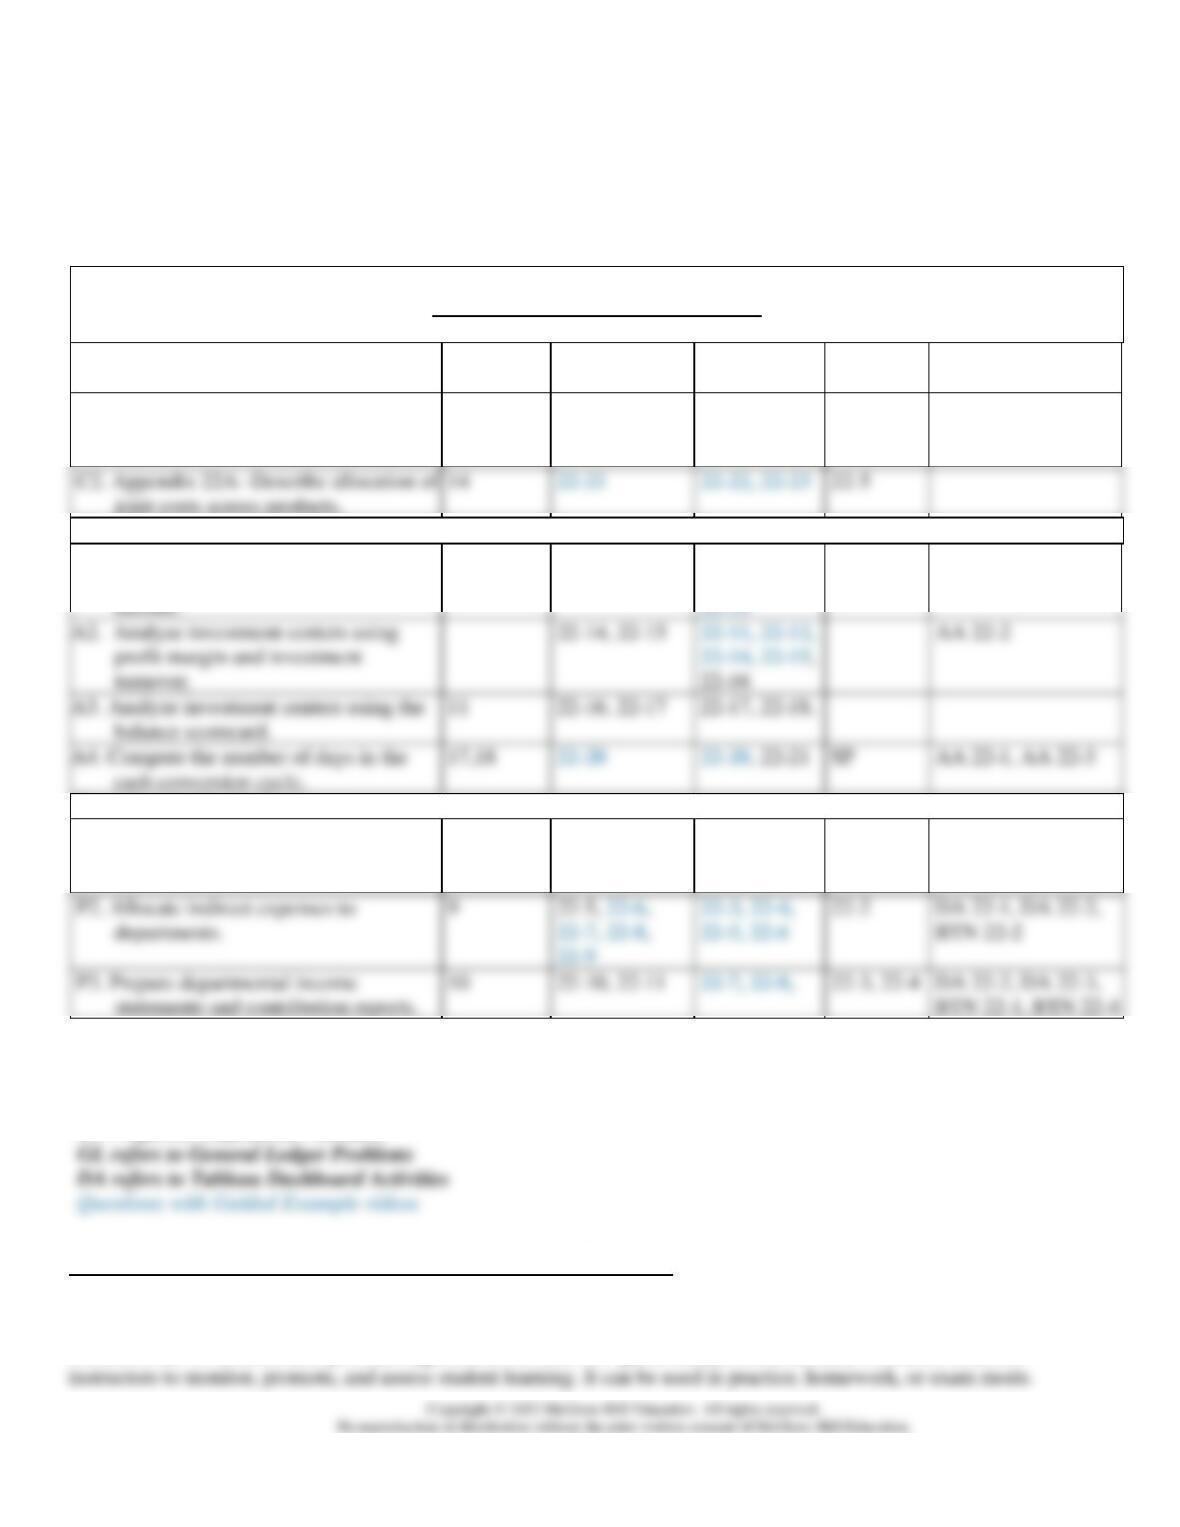
C1. Explain transfer pricing and methods
to set transfer prices.
12, 13
22-7, 22-18,
22-19
C2. Appendix 22A—Describe allocation of
14
22-5
Analytical objectives:
A2. Analyze investment centers using
profit margin and investment
22-14, 22-15
22-11, 22-12,
22-16
AA 22-2
A3. Analyze investment centers using the
11
22-16, 22-17
22-17, 22-18,
A4. Compute the number of days in the
17,18
SP
AA 22-1, AA 22-3
A1. Analyze investment centers using
return on investment and residual
22-12, 22-12,
22-13, 22-14
22-9, 22-10,
22-12, 22-13,
Procedural objectives:
P1. Prepare a responsibility accounting
report using controllable costs.
1,2,3,4,5,6,
7,8,15,16
22-1, 22-2,
22-3, 22-4
22-1, 22-2
22-1
BTN 22-3
departments.
BTN 22-2
P3. Prepare departmental income
10
22-10, 22-11
22-3, 22-4
DA 22-2, DA 22-3,
BTN 22-1, BTN 22-4
*See additional information on next page that pertains to these quick studies, exercises, and problems.
SP refers to the Serial Problem
AA refers to Accounting Analysis
BTN refers to Beyond the Numbers
Additional Information on Related Assignment Material
Connect
Available on the instructor’s course-specific website, Connect repeats all numerical Quick Studies, all Exercises and
Problems Set A. Connect also provides algorithmic versions for Quick Study, Exercises, and Problems. It allows
Financial and Managerial Accounting, 9th Edition
22-2
Prebuilt Assignments and Turnkey courses are available.
The Connect Orientation Videos provide an introduction for your students for using Connect to complete assignments to
help get your students up and running in the system. There are videos covering:
End-of-Chapter Assignments
Hints/Guided Examples
Please note that the Guided Examples are labeled as “Hints” in Connect assignments. The animated PowerPoints without
Need-to-Know Videos
LO
Need–to-Know
Title
Time
P1
22-1
Responsibility Accounting
2:37
P2
22-2
Cost Allocations
1:02
Investment
22-4
Balanced Scorecard
Concept Overview Videos
LO
Title
Time
C1
Explain transfer pricing and methods to set transfer prices.
Transfer Prices
0:37
Transfer Prices — Illustration
1:54
C2
Describe allocation of joint costs across products. Appendix 24
Allocation of Joint Costs
0:53
Value Basis Allocation Method
0:57
Analyze investment centers using return on investment and residual income.
Return on Investment
0:45
Residual Income
0:56
Analyze investment centers using profit margin and investment turnover.
Profit Margin and Investment Turnover
1:02
Analyze investment centers using the balance scorecard.
Balanced Scorecard
0:40
Applying the Four Perspectives
1:36
Compute the number of days in the cash conversion cycle.
Cash Conversion Cycle
0:56
Financial and Managerial Accounting, 9th Edition
22-3
Cash Conversion Cycle — Illustration
1:56
P1
Prepare a responsibility accounting report using controllable costs.
Decentralization and Performance Evaluation
0:29
Performance Measurement
1:12
Controllable versus Uncontrollable Costs
0:20
Responsibility Accounting Performance Report
1:08
Direct and Indirect Expenses
1:49
Expense Allocations
0:17
0:10
0:30
0:45
1:09
1:13
1:00
1:09
Synopsis of Chapter Revisions
NEW opener – Teysha and entrepreneurial assignment.
Streamlined conceptual learning objectives.
Removed Appendix A; cost allocations simplified and moved into chapter.
Removed Appendix B; transfer pricing is streamlined and moved into chapter.
NEW demo company, All Outdoor, with new department examples beginning with Exhibit 22.8.
Reduced five departments to three departments in Departmental Income Statement to simplify demonstration.
Financial and Managerial Accounting, 9th Edition
22-4
Chapter Outline
I. Responsibility Accounting
A. Performance Evaluation
1. Large companies are easier to manage if divided into smaller units called divisions, segments, or
departments.
3. Responsibility accounting evaluates unit managers only on activities they can control.
4. The methods of performance evaluation vary for cost centers, profit centers and investment
centers.
5. Basis for evaluating performance:
a. Cost center managers are evaluated on their success in controlling actual costs compared to
II. Controllable versus Uncontrollable Costs
A. Controllable Costs –
1. Costs a manager can determine or influence.
B. Uncontrollable costs –
1. Costs not within the manager’s control or influence.
C. Responsibility Accounting Performance Report
1. Reports actual costs that a manager is responsible for and their budgeted amounts.
a. Analysis of differences between actual and budgeted amounts often results in corrective or
strategic managerial actions.
Financial and Managerial Accounting, 9th Edition
22-5
III. Profit Centers
A. The responsibility accounting focuses on how well each department-controlled costs and generated
revenues.
B. Departmental income statements are used to report profit center performance.
C. When computing department income, we make two decisions for allocating expenses:
D. Expenses
1. Direct expenses are readily traced to a department.
a. Incurred for sole benefit of that one department; no allocation required.
E. Expense Allocations – indirect expenses and service department expenses are allocated to
departments that benefit from them.
1. Allocated Cost = Total cost to allocate x Percentage of allocation base used.
F. Allocating Indirect Expenses – no standard rule for “best” allocation bases exists. Commonly used
allocation bases for allocating indirect expenses include:
1. Wages and salaries –hours worked in each department.
G. Service Department expenses –operating departments use services such as personnel, payroll and
purchasing. Commonly used allocation bases for service expenses:
1. Office — number of employees or sales in each department.
H. Departmental Income Statements
1. Departmental income is computed using the following formula: Departmental income = Dept.
sales – Dept. direct expenses – Allocated indirect expenses – Allocated service dept. expenses.
2. Three steps for allocating costs and preparing departmental income statements:
Financial and Managerial Accounting, 9th Edition
22-6
3. Prepare departmental income statements using the departmental expense allocation spreadsheet.
i. Actual service department expenses are compared with budgeted amounts to help assess
I. Departmental Contribution to Overhead (see Exhibit 22.12)
1. Departmental income statements not always best for evaluating each profit center’s performance
especially when indirect expenses are a large portion of total expenses.
IV. Investment Centers
A. Financial Performance Evaluation Measures include:
1. Return-on-investment (return on assets), computed as income divided by average assets.
3. Profit margin and investment turnover – split return on investment into two measures – profit
margin and investment turnover.
4. Evaluating performance solely on financial measures has limitations. Companies can also use
nonfinancial measures.
5. Balanced scorecard: system of performance measures, including nonfinancial measures used to
assess company and division manager performance. Requires managers to think of their company
from four perspectives:
1. Customer: What do customers think of us?
V. Transfer Pricing
The price used to record transfers across divisions within a company is called a transfer price. Can be
used in cost, profit and investment centers.
A. Low transfer price – transfer price cannot be less than variable manufacturing cost.
Financial and Managerial Accounting, 9th Edition
VI. Decision Analysis Cash Conversion Cycle
A. Effectively managing working capital is important for survival and profit.
1. Accounts receivable, accounts payable, and inventory ratios are used to evaluate performance on
working capital dimensions.
2. The cash conversion (or cash-to-cash) cycle measures the average time it takes to convert cash
outflows into cash inflows.
Cycle conversion cycle =
Days’ sales in accounts receivable plus Days’ sales in inventory minus Days’sales in accounts
payable.
VII. Appendix 22A – Joint Costs
A. Joint Costs⎯the costs incurred to produce or purchase two or more products at the same time.
2. Financial statements prepared according to GAAP also must assign joint costs to products.
4. Split-off point is the point at which separate products can be identified.
5. Value basis of allocation of joint costs:
A. Shown in Exhibit 22A.2.

22-8
Financial and Managerial Accounting, 9th Edition
22-9
Chapter 22 Alternate Demo Problem
Jack and Susan Roberts own a farm that produces potatoes. Based on a review of the
income statement shown below, Jack remarked that they should have fed the No. 3
potatoes to the pigs; then they would have avoided the loss from the sale of the those
potatoes.
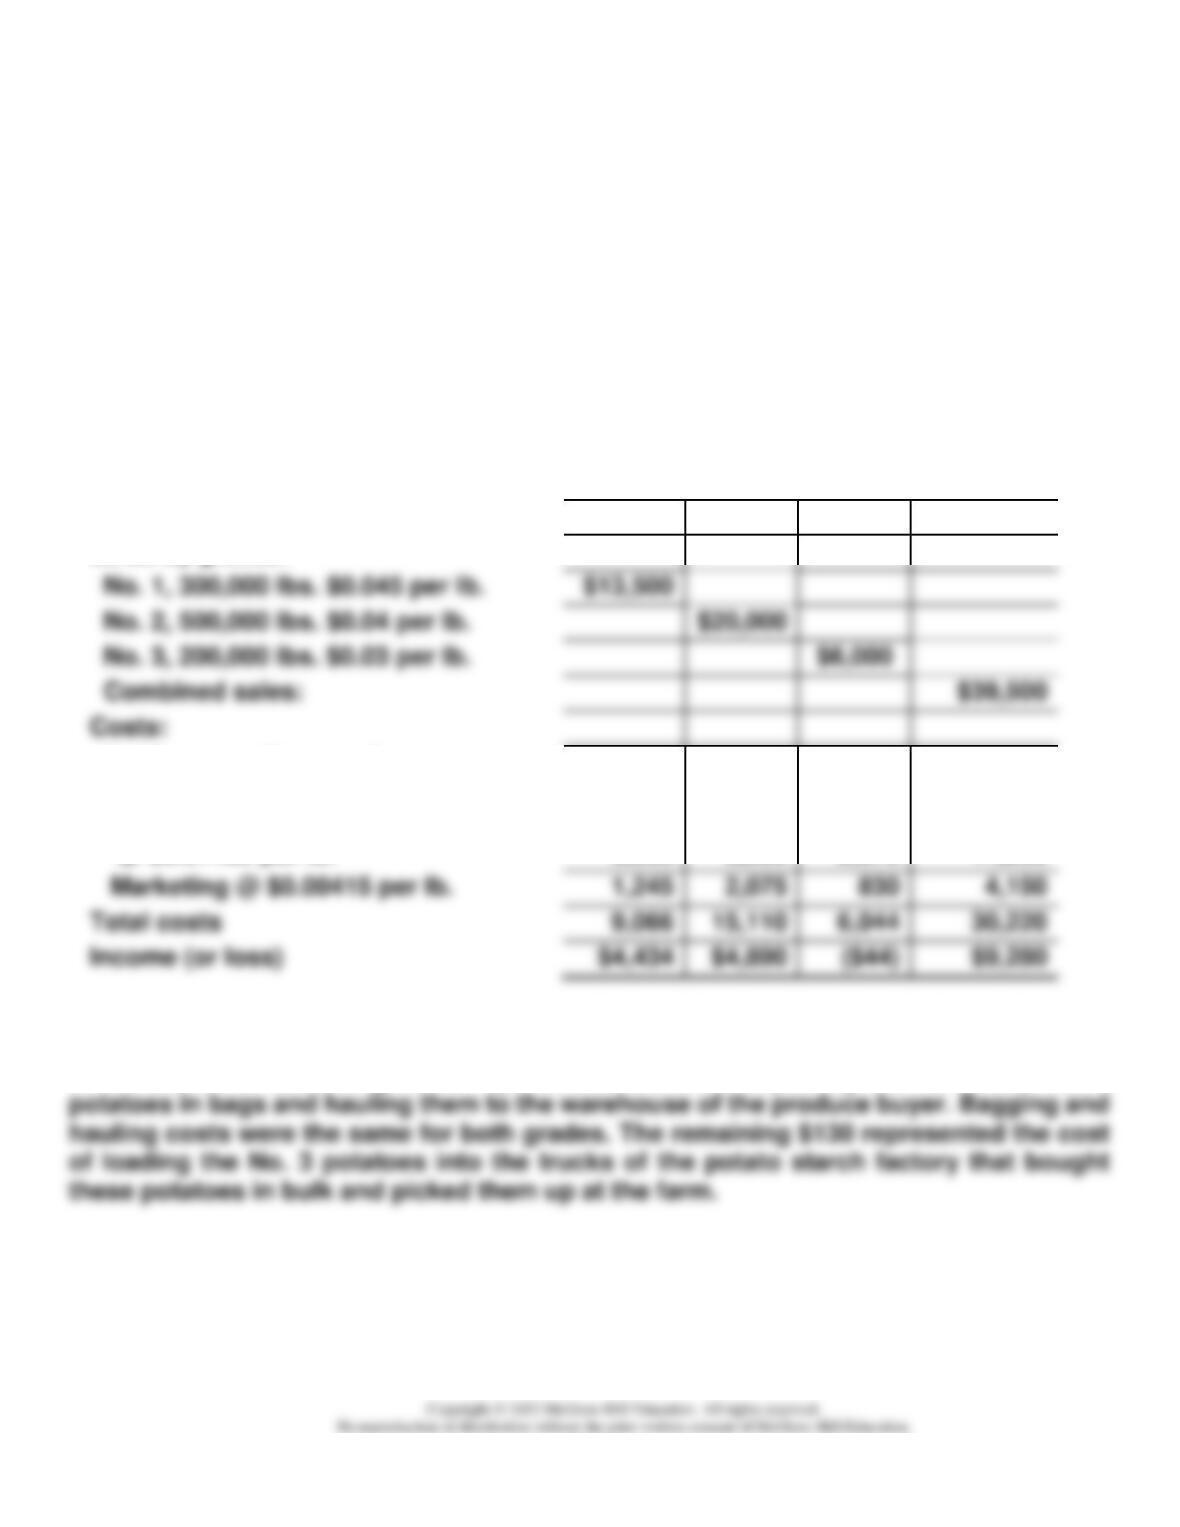
JACK AND SUSAN ROBERTS
Income from the Production and Sale of Potatoes
For Year Ended December 31, 20xx
Results by Grade
No. 1
No. 2
No. 3
Combined
Sales by grades:
No. 1, 300,000 lbs. $0.045 per lb.
No. 2, 500,000 lbs. $0.04 per lb.
No. 3, 200,000 lbs. $0.03 per lb.
Combined sales:
Land preparation, seed,
planting, cultivating @ $0.01422/lb.
4,266
7,110
2,844
14,220
Harvesting, sorting, grading
@ $0.01185 per lb.
3,555
5,925
2,370
11,850
Marketing @ $0.00415 per lb.
1,245
2,075
830
Total costs
9,066
6,044
30,220
Income (or loss)
Jack and Susan divided their costs among the grades on a per pound basis, because
their records do not show cost per grade. However, their records did show that $4,020
of the $4,150 of marketing costs represented the cost of placing the No. 1 and No. 2
Required:
Prepare a departmental income statement to show the results of producing and
marketing each of the potatoe grades.
Financial and Managerial Accounting, 9th Edition
22–10
Chapter 22 Alternate Demo Problem: Solution
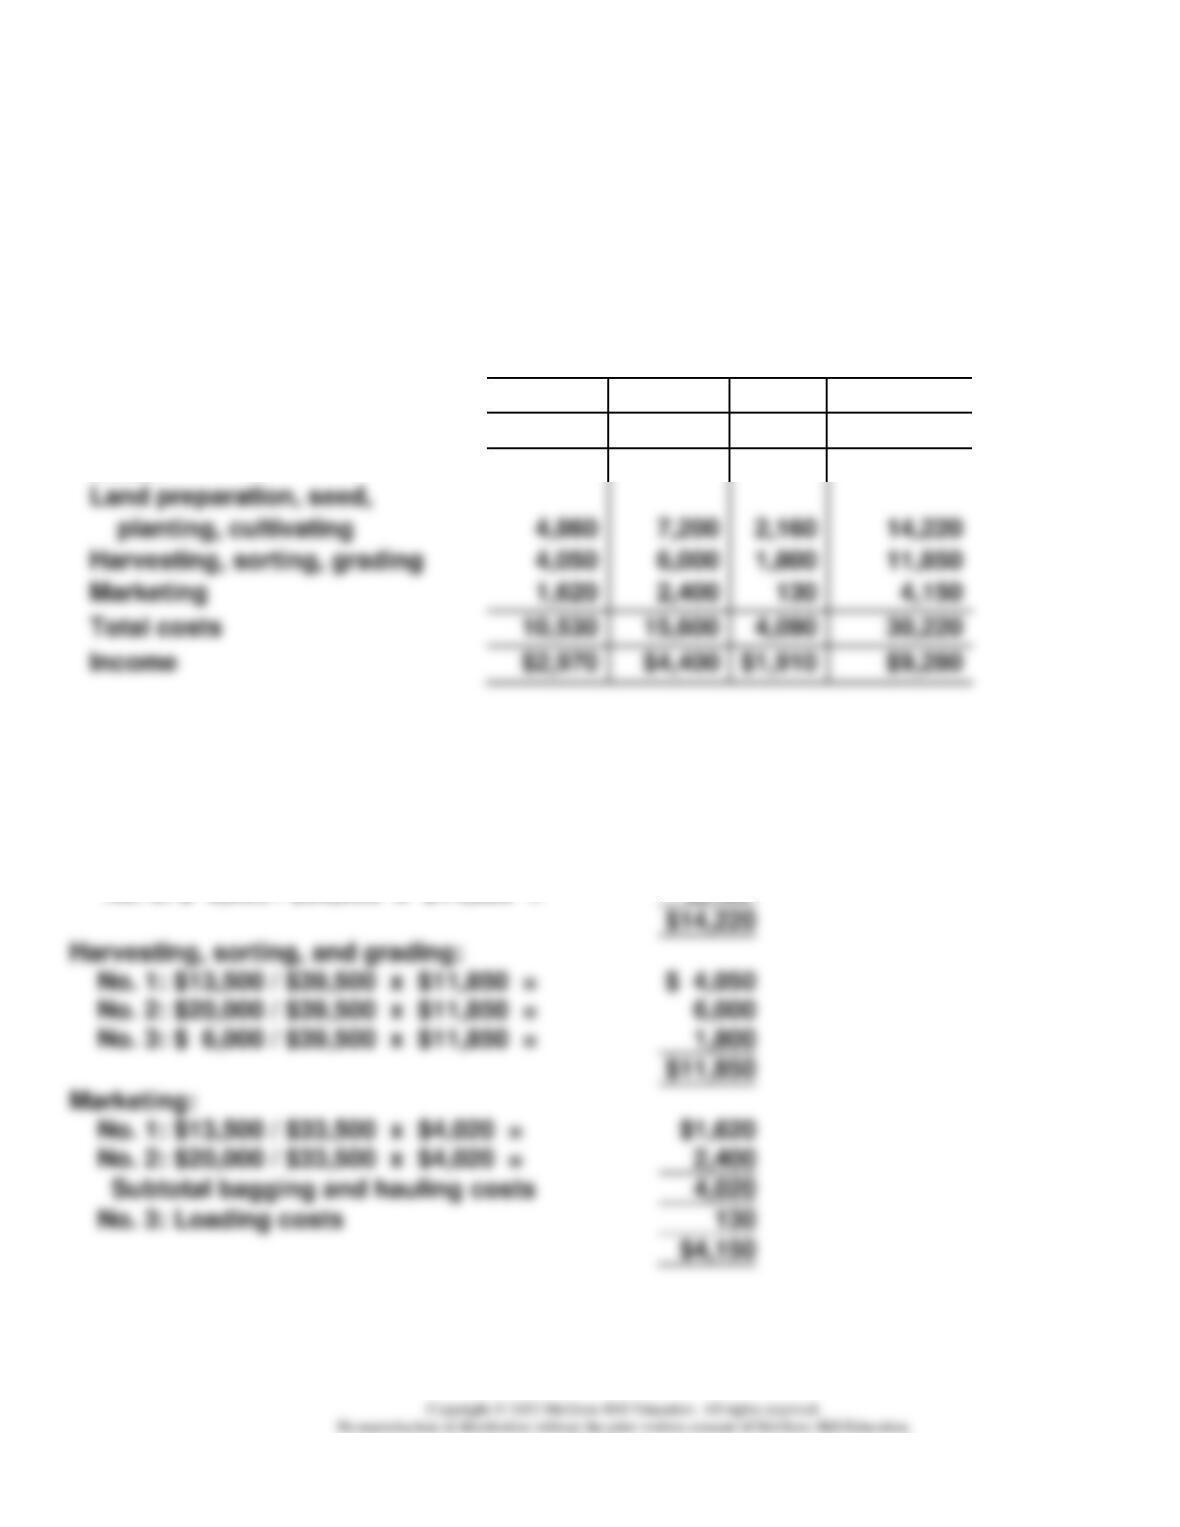
JACK AND SUSAN ROBERTS
Income from the Production and Sale of Potatoes
For Year Ended December 31, 20xx
Results by Grade
No. 1
No. 2
No. 3
Combined
Revenue from sales:
$13,500
$20,000
$6,000
$39,500
Costs:
Marketing
Total costs
$1,910
COST ALLOCATIONS
Land preparation, seed, planting, and cultivating:
No. 1: $13,500 / $39,500 x $14,220 =
No. 2: $20,000 / $39,500 x $14,220 =
No. 3: $ 6,000 / $39,500 x $14,220 =
$ 4,860
7,200
2,160
No. 3: $ 6,000 / $39,500 x $11,850 =
No. 1: $13,500 / $33,500 x $4,020 =
No. 2: $20,000 / $33,500 x $4,020 =
Subtotal bagging and hauling costs
No. 3: Loading costs