22-1
CHAPTER 22
PERFORMANCE MEASUREMENT AND
RESPONSIBILITY ACCOUNTING
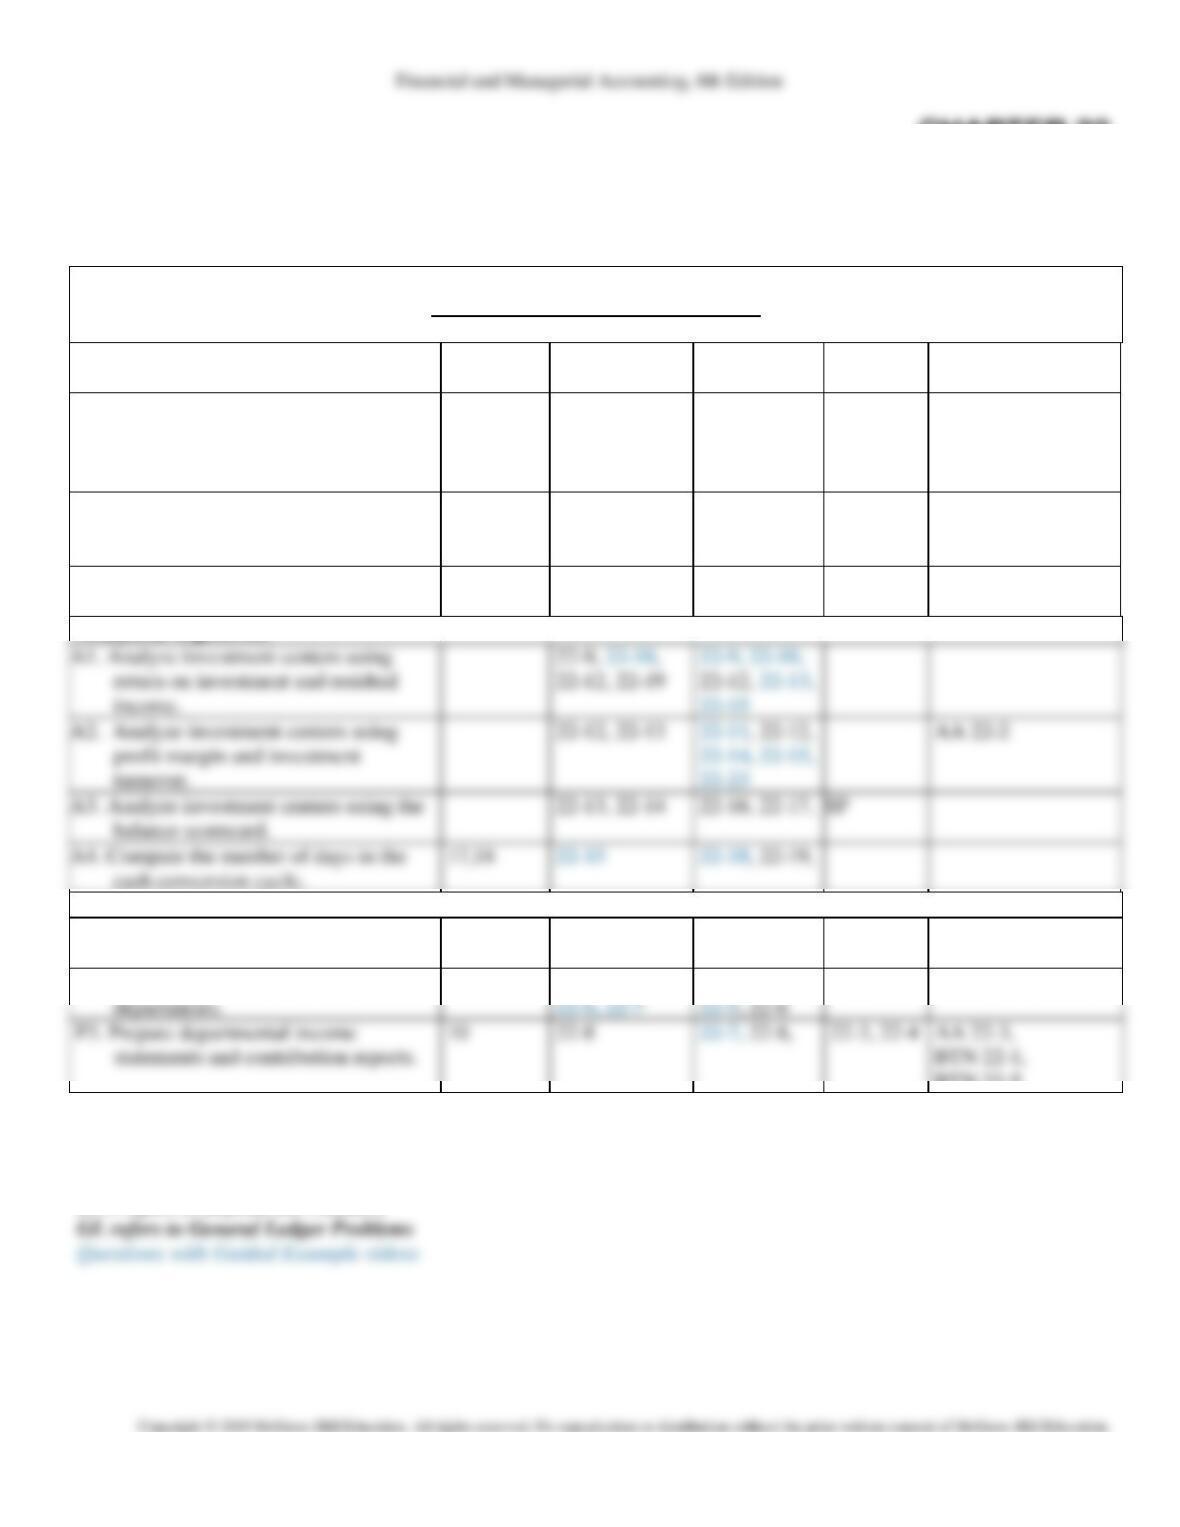
Related Assignment Materials
Student Learning Objectives
Discussion
Questions
Quick Studies*
Exercises*
Problems*
AA and BTN
C1. Distinguish between direct and
indirect expenses and identify bases
for allocating indirect
expenses to departments.
1,2,3,4,5,
6,7,8,9,11,
15,16
22-1, 22-2
AA 22-1,
BTN 22-6
C2. Explain transfer pricing and methods
to set transfer prices.
12, 13
22-7, 22-16,
22-17
22-20
C3. Appendix 22C—Describe allocation of
joint costs across products.
14
22-18
22-21, 22-22
22-5
A1. Analyze investment centers using
return on investment and residual
income.
22-9, 22-10,
22-12, 22-19
22-12, 22-13,
profit margin and investment
turnover.
22-14, 22-15,
A3. Analyze investment centers using the
balance scorecard.
22-13, 22-14
22-16, 22-17,
A4. Compute the number of days in the
cash conversion cycle.
17,18
22-15
22-18, 22-19,
Procedural objectives:
P1. Prepare a responsibility accounting
report using controllable costs.
22-3
22-1, 22-2
22-1
BTN 22-4, BTN 22-6
P2. Allocate indirect expenses to
departments.
P3. Prepare departmental income
statements and contribution reports.
10
22-8
22-7, 22-8,
22-3, 22-4
AA 22-3,
BTN 22-1,
22-4, 22-5
22-3, 22-4,
22-2
BTN 22-2, BTN 22-3
BTN 22-5
*See additional information on next page that pertains to these quick studies, exercises, and problems.
SP refers to the Serial Problem
AA refers to Accounting Analysis
C3
Appendix 22C—Describe allocation of joint costs across products.
Allocation Methods
1:50
Analyze investment centers using return on investment and residual income.
Return on Investment
1:24
Residual Income
1:38
Issues in Computing These Measures
1:08
Analyze investment centers using profit margin and investment turnover.
1:50
Analyze investment centers using the balance scorecard.
Balanced Scorecard
0:40
Additional Information on Related Assignment Material
See Chapter 1 of the Instructor’s Resource Manual for more information on materials for this text available in
Connect.
Connect
Available on the instructor’s course-specific website, Connect:
• All numerical Quick Studies, all Exercises and Problems Set A.
o Connect also provides algorithmic versions for Quick Study, Exercises, and Problems.
• General Ledger Problems
• Excel Simulations
• LearnSmart/SmartBook
Hints/Guided Examples
Please note that the Guided Examples are labeled as “Hints” in Connect assignments. The animated PowerPoints without
the video and audio functions for the Guided Examples are also available in the Connect Instructor Library and Exercise
Presentations. These are indicated in the Related Assignment Materials grid on page 1 in blue bold font.
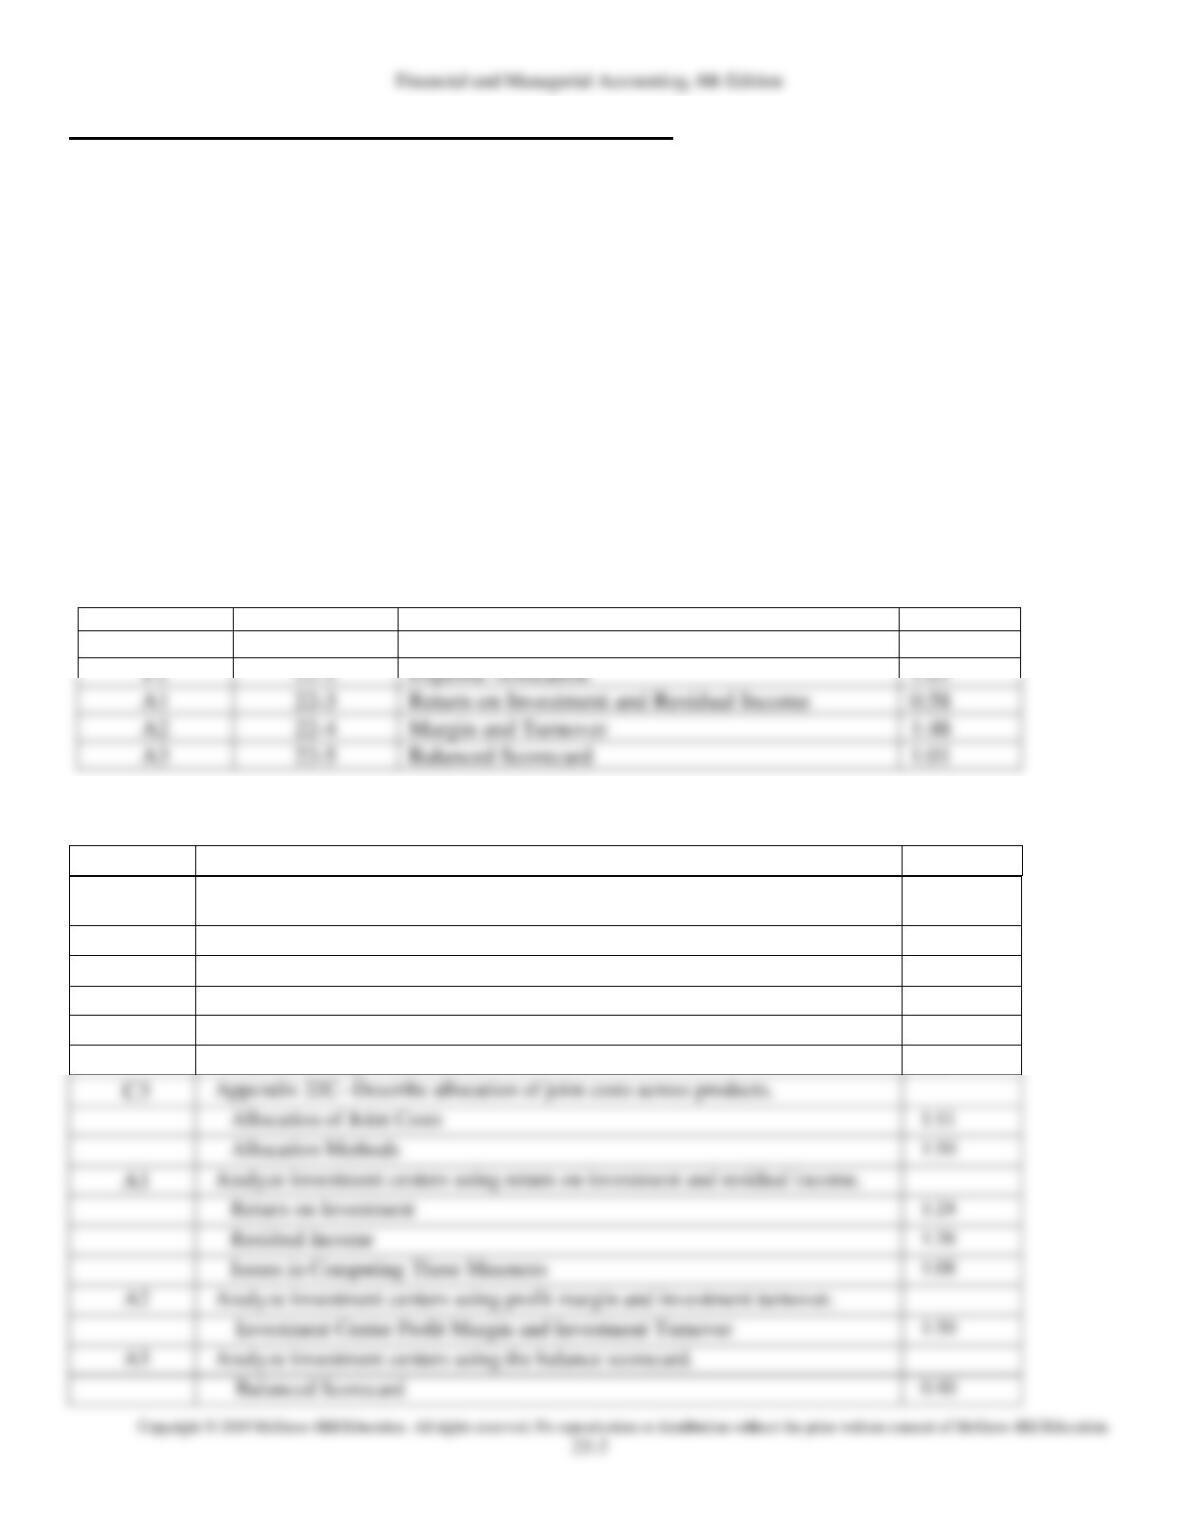
Need-to-Know Videos
LO
Need–to-Know
Title
Time
P1
22-1
Responsibility Accounting for cost centers
2:44
P2
22-2
Expense Allocation
1:01
22-3
Return on Investment and Residual Income
0:58
22-4
Margin and Turnover
1:48
22-5
Balanced Scorecard
1:01
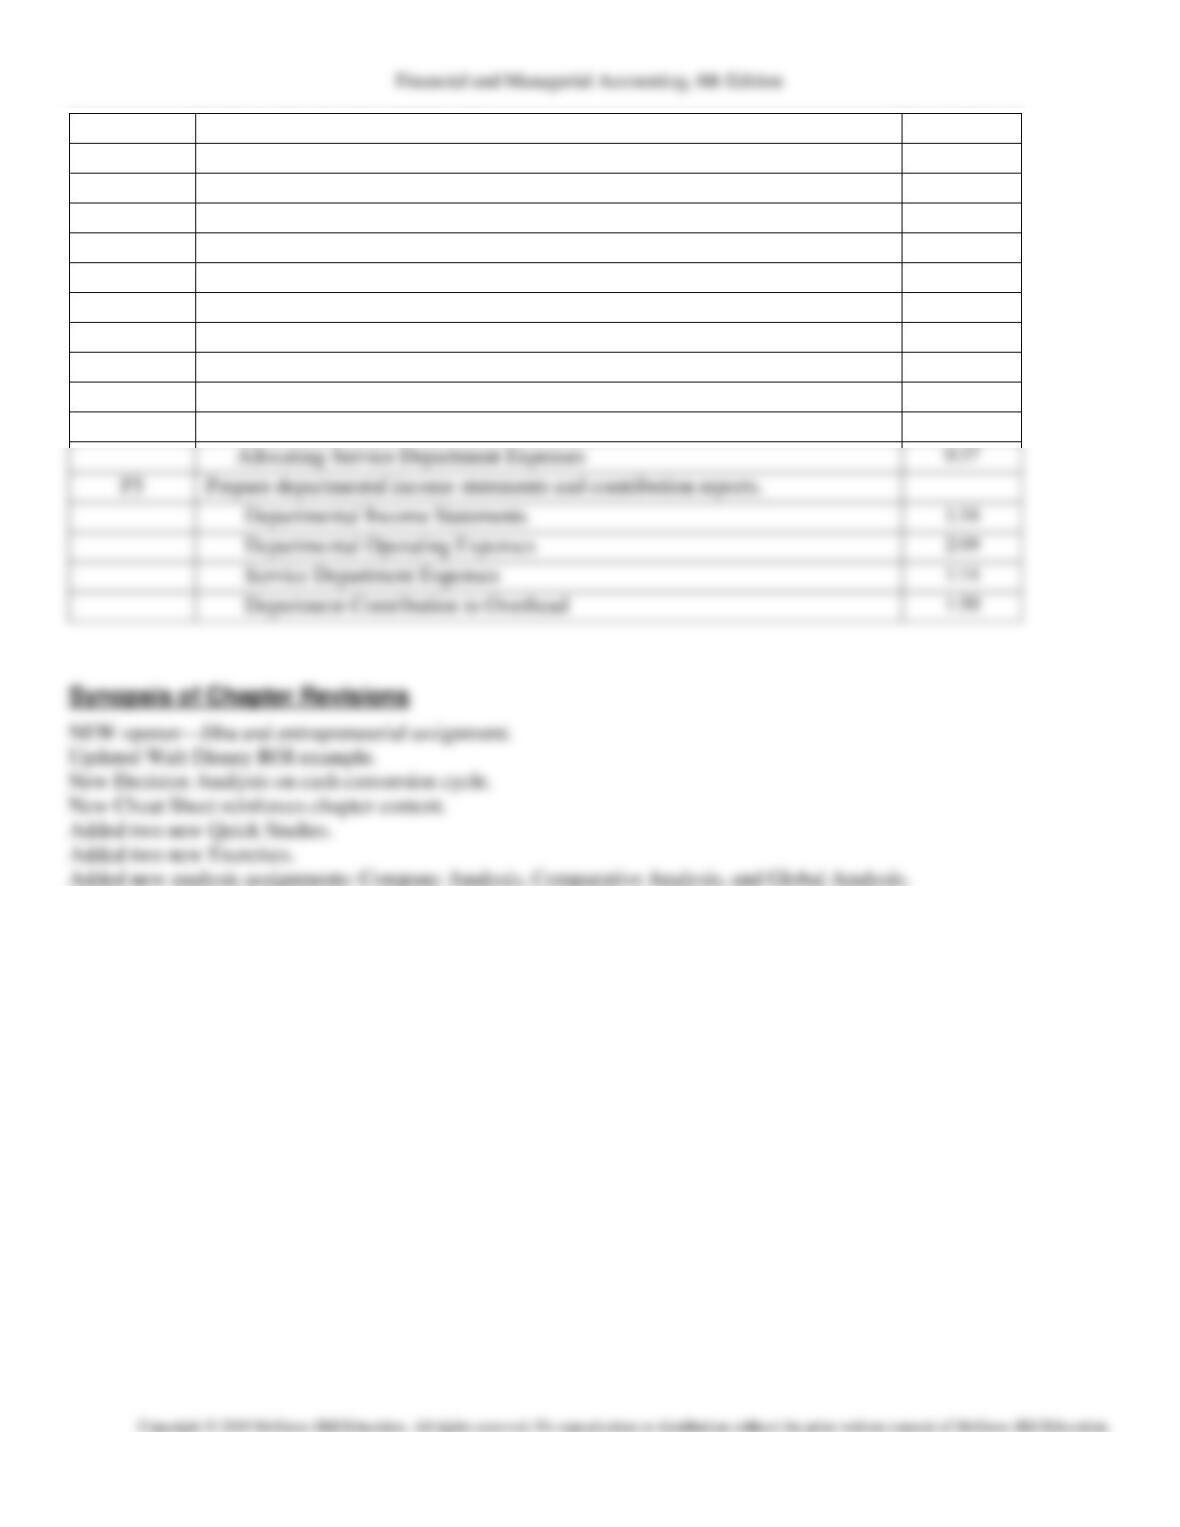
Concept Overview Videos
LO
Title
Time
C1
Distinguish between direct and indirect expenses and identify bases for
allocating indirect expenses to departments.
Direct and Indirect Expenses
1:32
Illustration of Indirect Expense Allocation
1:08
C2
Explain transfer pricing and methods to set transfer prices.
Transfer Pricing
0:41
Transfer Pricing — Illustration
3:57
22-3
Applying the Four Perspectives
1:27
A4
Compute the number of days in the cash conversion cycle.
Cash Conversion Cycle
0:58
Cash Conversion Cycle — Illustration
2:00
P1
Prepare a responsibility accounting report using controllable costs.
Decentralization and Performance Evaluation
0:27
Performance Measurement
1:05
Controllable versus Uncontrollable Costs
0:20
Responsibility Accounting Performance Report
1:05
P2
Allocate indirect expenses to departments.
Allocating Indirect Expenses
2:24
Allocating Service Department Expenses
P3
Prepare departmental income statements and contribution reports.
1:34
2:09
1:14
1:50
22-4
Chapter Outline
I. Responsibility Accounting
A. Performance Evaluation
1. Large companies are easier to manage if divided into smaller units called divisions, segments, or
departments.
2. In decentralized organizations, decisions are made by unit managers rather than top
management.
3. In responsibility accounting, unit managers are evaluated only on what they can control.
4. The methods of performance evaluation vary for cost centers, profit centers and investment
5. Basis for evaluating performance:
a. Cost center managers are evaluated on their success in controlling costs compared to
budgeted costs. Profit center: ability to generate more revenue than expenses.
b. Profit center managers are evaluated on their success in generating income.
c. Investment center managers are evaluated on their use of investment-center assets to
generate income.
II. Controllable versus Uncontrollable Costs
A. Controllable Costs –
1. Those which a manager has the power to determine or at least significantly affect the amount
incurred.
B. Uncontrollable costs –
1. Are not within the manager’s control.
2. A manager’s performance is evaluated using responsibility reports that describe the department’s
activities in terms of controllable costs
3. Distinguishing between controllable and uncontrollable costs depends on the particular manager
and the time period under analysis.
4. All costs are controllable at some level of management if the time period is sufficiently long;
5. Good judgment is required when identifying controllable costs.
C. Responsibility Accounting Performance Report
1. Reports actual expenses that a manager is responsible for and their budgeted amounts.
22-5
III. Profit Centers
A. The responsibility report focuses on how well each department controlled costs and generated
revenues.
B. The departmental income statement is a common way to report profit center performance.
C. When computing department profits, two key accounting challenges involve allocating expenses:
1. How to allocate indirect expenses, such as rent and utilities which benefit several departments.
2. How to allocate service department expenses, such as payroll or purchasing, that perform
services that benefit several departments.
D. Direct and Indirect Expenses
E. General Model—indirect and service department expenses are allocated across departments
benefiting from them. Allocated using a cause-effect relation. Sometimes hard to identify.
1. Allocated Cost = Total Cost to Allocate x Percentage of Allocation Base Used.
F. Allocating Indirect Expenses – allocation bases vary across departments and organizations. Managers
must use careful judgment in developing allocation bases. Commonly used allocation bases:
1. Wages and salaries⎯allocated using relative amount of hours worked in each department.
2. Rent and Utilities⎯allocated based on portion of floor space occupied. More valuable location
may charge department higher rate.
3. Advertising⎯allocated using a percentage of total sales.
4. Depreciation⎯allocated using hours of depreciable asset used.
H. Departmental Income Statements
1. Departmental income is computed using the following formula: Departmental income = Dept.
sales – Dept. direct expenses – Allocated indirect expenses – Allocated service dept. expenses.
2. Four Steps for allocating costs and preparing departmental income statements:
a. Step one – accumulate revenues, direct and indirect expenses by department. Involves
collecting the necessary data from general company and departmental accounts.
I. Departmental Contribution to Overhead (see Exhibit 22.12)
1. Departmental income statements are not always best for evaluating each profit center’s
performance especially when indirect expenses are a large portion of total expenses.
2. Evaluate using departmental contributions to overhead⎯a report of the amount of sales less
direct expenses.
3. Behavioral Aspects of Departmental Performance Reports –
a. Indirect expenses are typically uncontrollable, so a better way to evaluate is using
departmental contribution to overhead.
b. Including indirect expenses in department manager’s performance evaluation can lead to the
manager being more careful in using service departments.
c. Some companies allocate budgeted service department costs so operating departments are not
held responsible for excessive costs from service departments.
IV. Investment Center
A. Return-on-Investment and Residual Income
1. Return on investment, return on assets, computed as investment center income / by investment
center average invested assets.
22-7
assets. Expressed as the number of times assets were converted into sales.
4. Nonfinancial Performance Evaluation Measures – using solely financial measures has limitations.
Companies can consider nonfinancial measures to help in evaluating division manager’s
performance.
5. Balanced Scorecard: system of performance measures, including nonfinancial measures used to
assess company and division manager performance. Requires managers to think of their company
from four perspectives.
a. What do customers think of us?
b. Which operations are crucial to customer needs?
c. How can we improve?
d. What do our owners think of us?
V. Decision Analysis Cash Conversion Cycle
A. Effectively managing working capital is important for survival and profit.
1. Accounts receivable, accounts payable, and inventory ratios are used to evaluate performance on
working capital dimensions.
a. Combining these ratios summarize how effectively a company manages its working capital.
2. The cash conversion (or cash-to-cash) cycle measures the average time it takes to convert cash
outflows into cash inflows from customers.
Financial and Managerial Accounting, 8th Edition
22-8
VII. Appendix 22B – Transfer Pricing
The price used to record transfers between divisions in the same company is called a transfer price.
Can be used in cost, profit and investment centers.
A. If there is no excess capacity, the internal supplier will not accept a transfer price less than the
market price. This is called market-based transfer pricing.
B. If there is excess capacity, the internal supplier should accept a price between the costs to
manufacturer the part and the market price. This is called cost-based transfer pricing.
C. Other issues to consider in determining transfer prices include:
1. Market price may not exist
2. Cost controls
3. Division managers’ negotiation
4. Nonfinancial factors to consider include: quality control, reduced lead times and impact on
employee morale.
VIII. Appendix 22C – Joint Costs
A. Joint Costs⎯the costs incurred to produce or purchase two or more products at the same time;
similar to indirect expense in that it’s shared across more than one cost object.
22-9
Chapter 22 Alternate Demo Problem
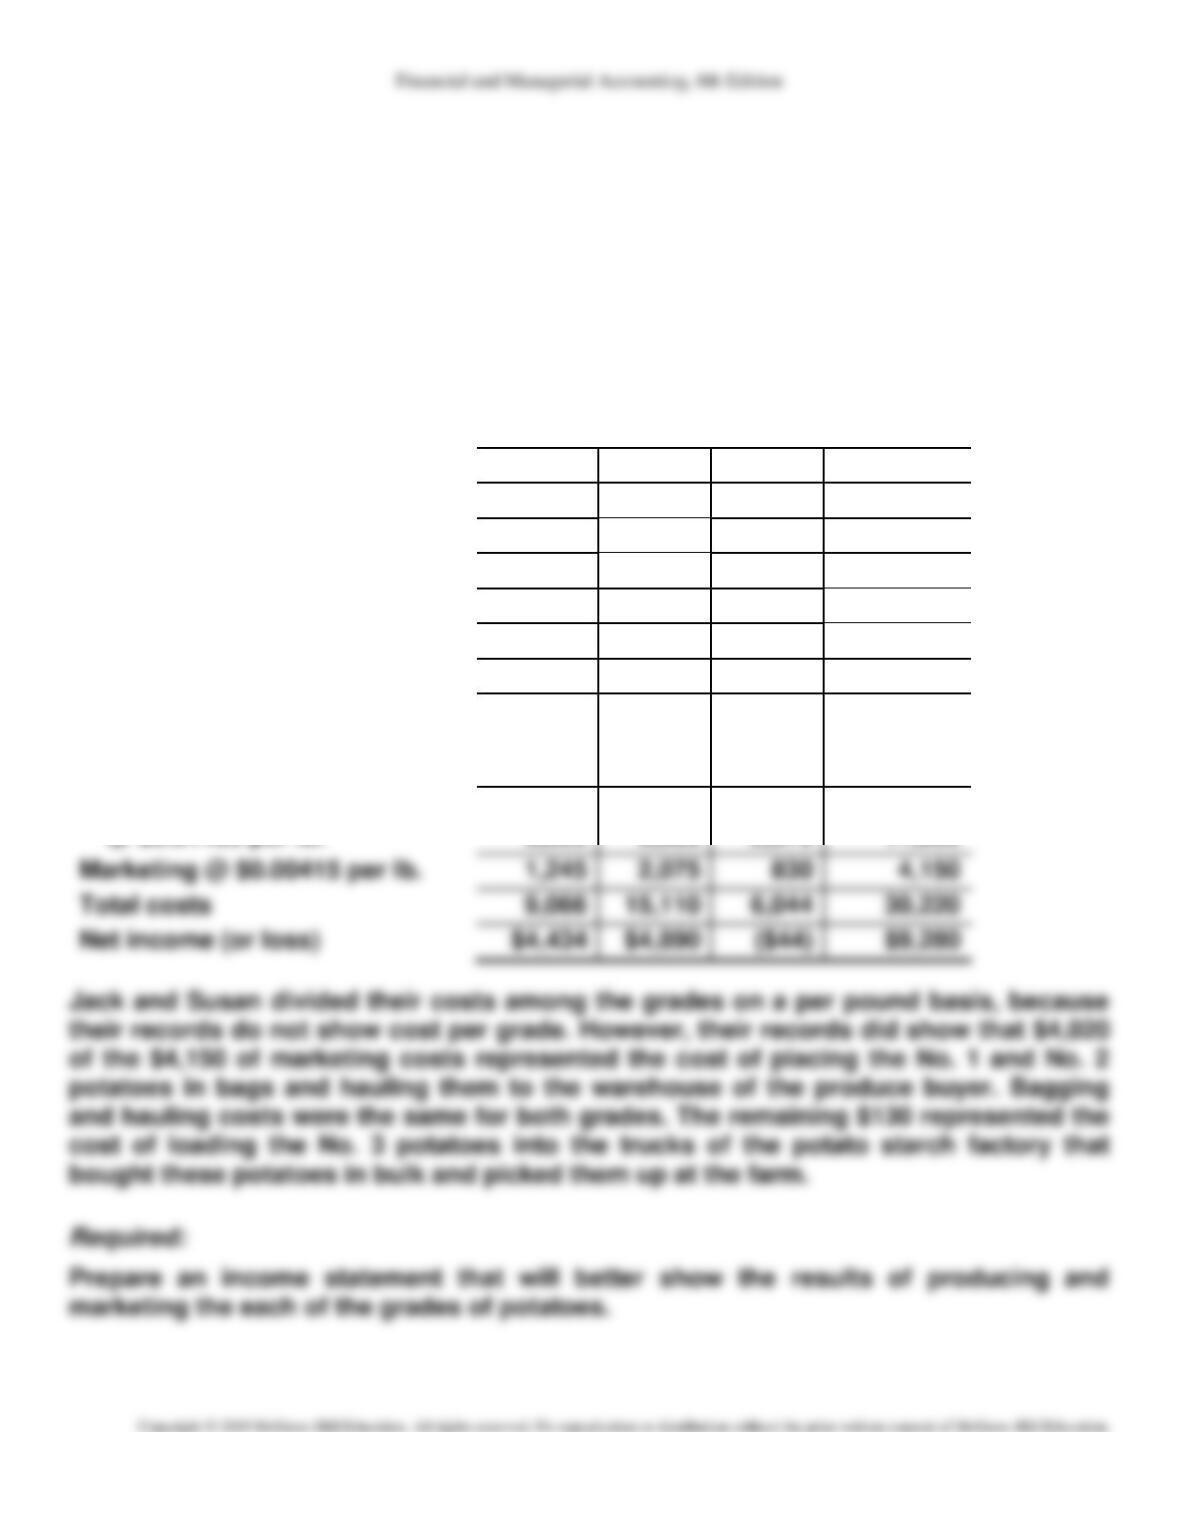
Jack and Susan Roberts own a farm that produces potatoes. Based on a review of the
income statement shown below, Jack remarked that they should have fed the No. 3
potatoes to the pigs; then they would have avoided the loss from the sale of the those
potatoes.
JACK AND SUSAN ROBERTS
Income from the Production and Sale of Potatoes
For Year Ended December 31, 20xx
Results by Grade
No. 1
No. 2
No. 3
Combined
Sales by grades:
No. 1, 300,000 lbs. $0.045 per lb.
$13,500
No. 2, 500,000 lbs. $0.04 per lb.
$20,000
No. 3, 200,000 lbs. $0.03 per lb.
$6,000
Combined
$39,500
Costs:
Land preparation, seed,
planting,
cultivating @ $0.01422 per lb.
4,266
7,110
2,844
14,220
Harvesting, sorting, grading
@ $0.01185 per lb.
3,555
5,925
2,370
11,850
Marketing @ $0.00415 per lb.
1,245
2,075
830
Total costs
22–10
Chapter 22 Alternate Demo Problem: Solution
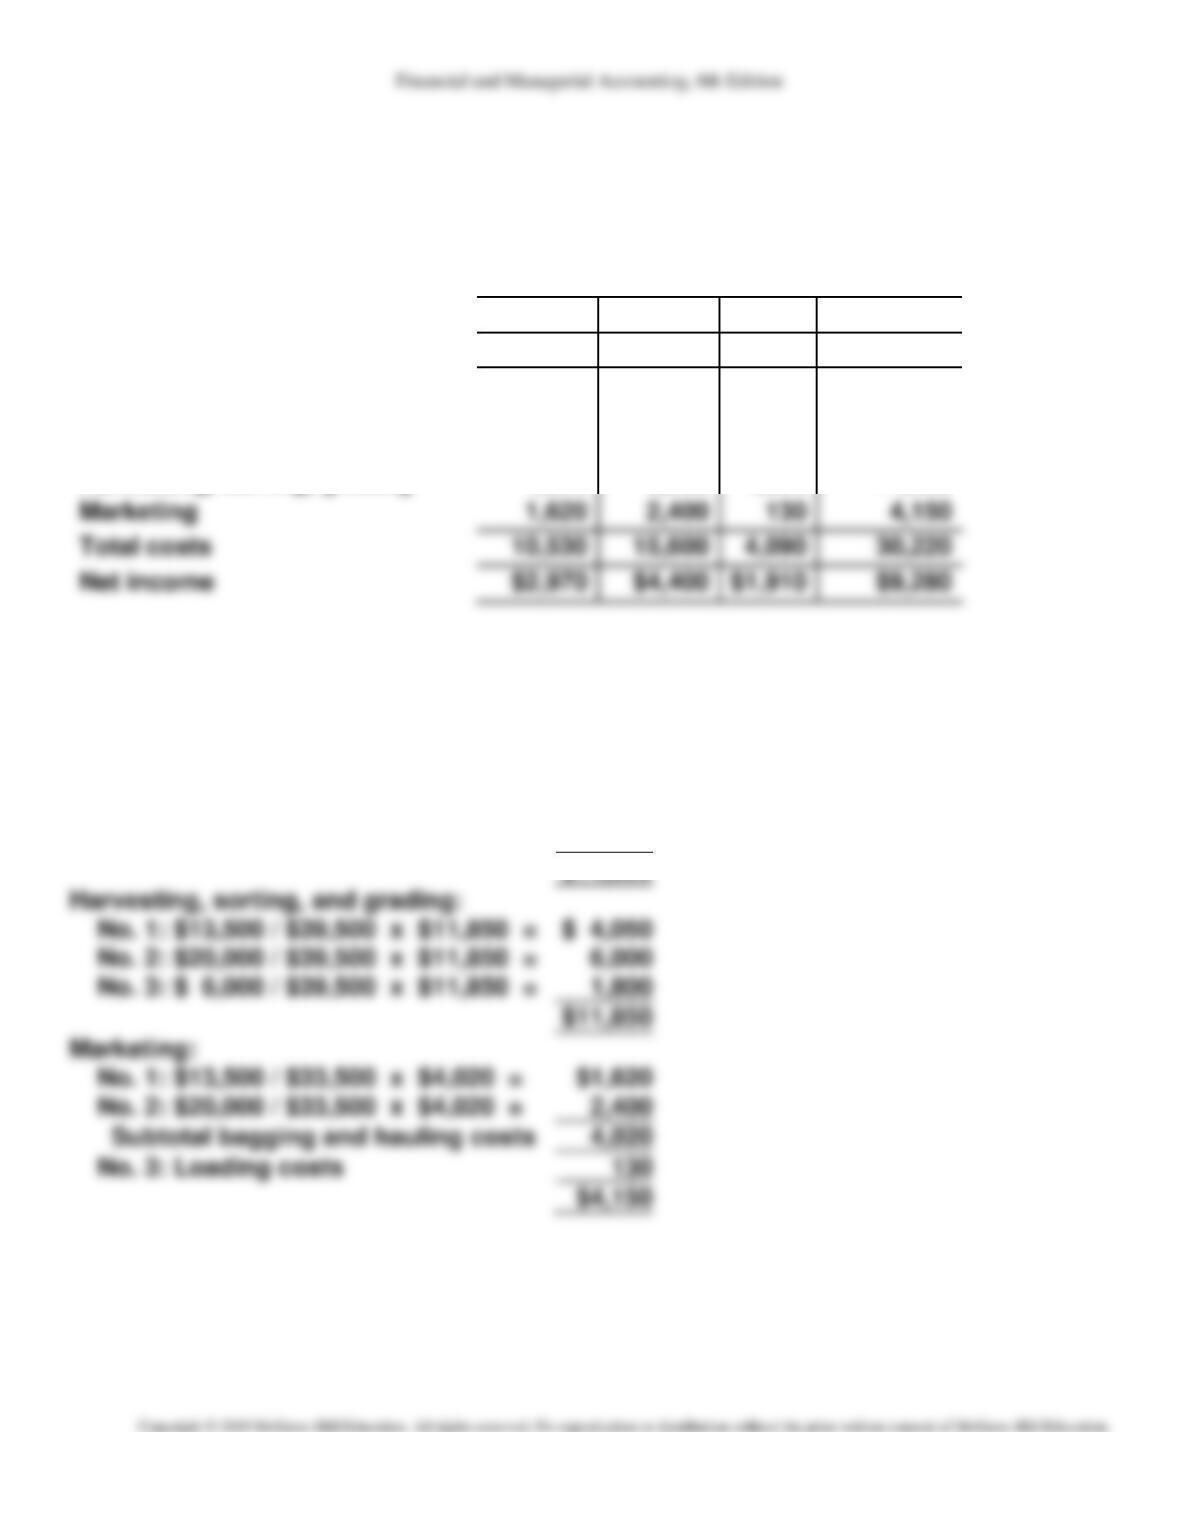
JACK AND SUSAN ROBERTS
Income from the Production and Sale of Potatoes
For Year Ended December 31, 20xx
Results by Grade
No. 1
No. 2
No. 3
Combined
Revenue from sales:
$13,500
$20,000
$6,000
$39,500
Costs:
Land preparation, seed,
planting, cultivating
4,860
7,200
2,160
14,220
Harvesting, sorting, grading
4,050
6,000
1,800
11,850
Marketing
Total costs
$1,910
COST ALLOCATIONS
Land preparation, seed, planting, and
cultivating:
No. 1: $13,500 / $39,500 x $14,220 =
No. 2: $20,000 / $39,500 x $14,220 =
No. 3: $ 6,000 / $39,500 x $14,220 =
$ 4,860
7,200
2,160
No. 3: $ 6,000 / $39,500 x $11,850 =
1,800
No. 1: $13,500 / $33,500 x $4,020 =
No. 2: $20,000 / $33,500 x $4,020 =
2,400
Subtotal bagging and hauling costs
4,020
No. 3: Loading costs