Exercise 22-14 (15 minutes)
Geographic segment
Operating
income
Sales
Profit margin
Americas …………………..
$30,684
$96,600
31.8%
Europe ………………………
16,514
54,938
30.1%
China ………………………..
17,032
44,764
38.0%
Exercise 22-15 (20 minutes)
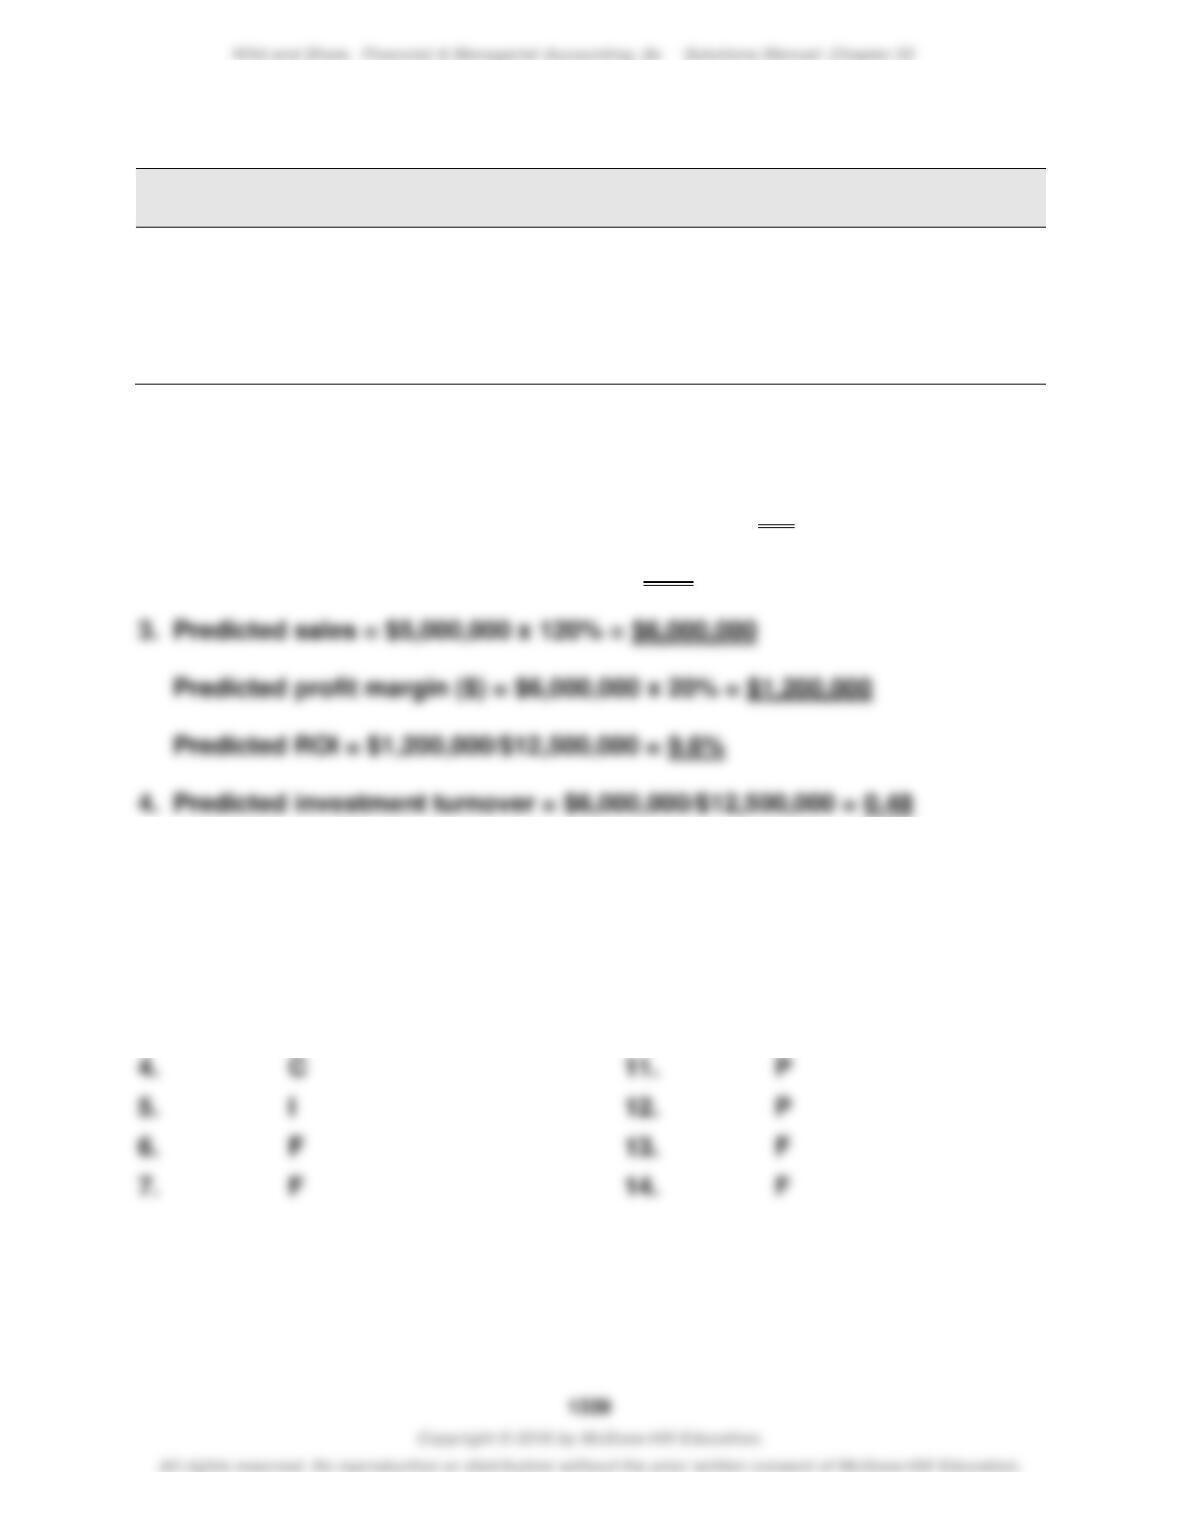
1. Return on investment = $1,000,000/$12,500,000 = 8%
2. Profit margin = $1,000,000/$5,000,000 = 20%
Exercise 22-16 (20 minutes)
1. F 8. P
2. C 9. C
3. C 10. I
Exercise 22-17 (15 minutes)
1. P 6. P
2. P 7. F
Exercise 22-18 (15 minutes)
($ millions)
Current year:
Days’ sales in accounts receivable = $18,685 x 365 = 31 days
$220,000
Days’ sales in inventory = $6,904 x 365 = 18 days
$140,000
Days’ payable outstanding = $4,603 x 365 = 12 days
$140,000
Cash conversion cycle = 31 + 18 – 12 = 37 days
Exercise 22-19 (10 minutes)
($ millions)
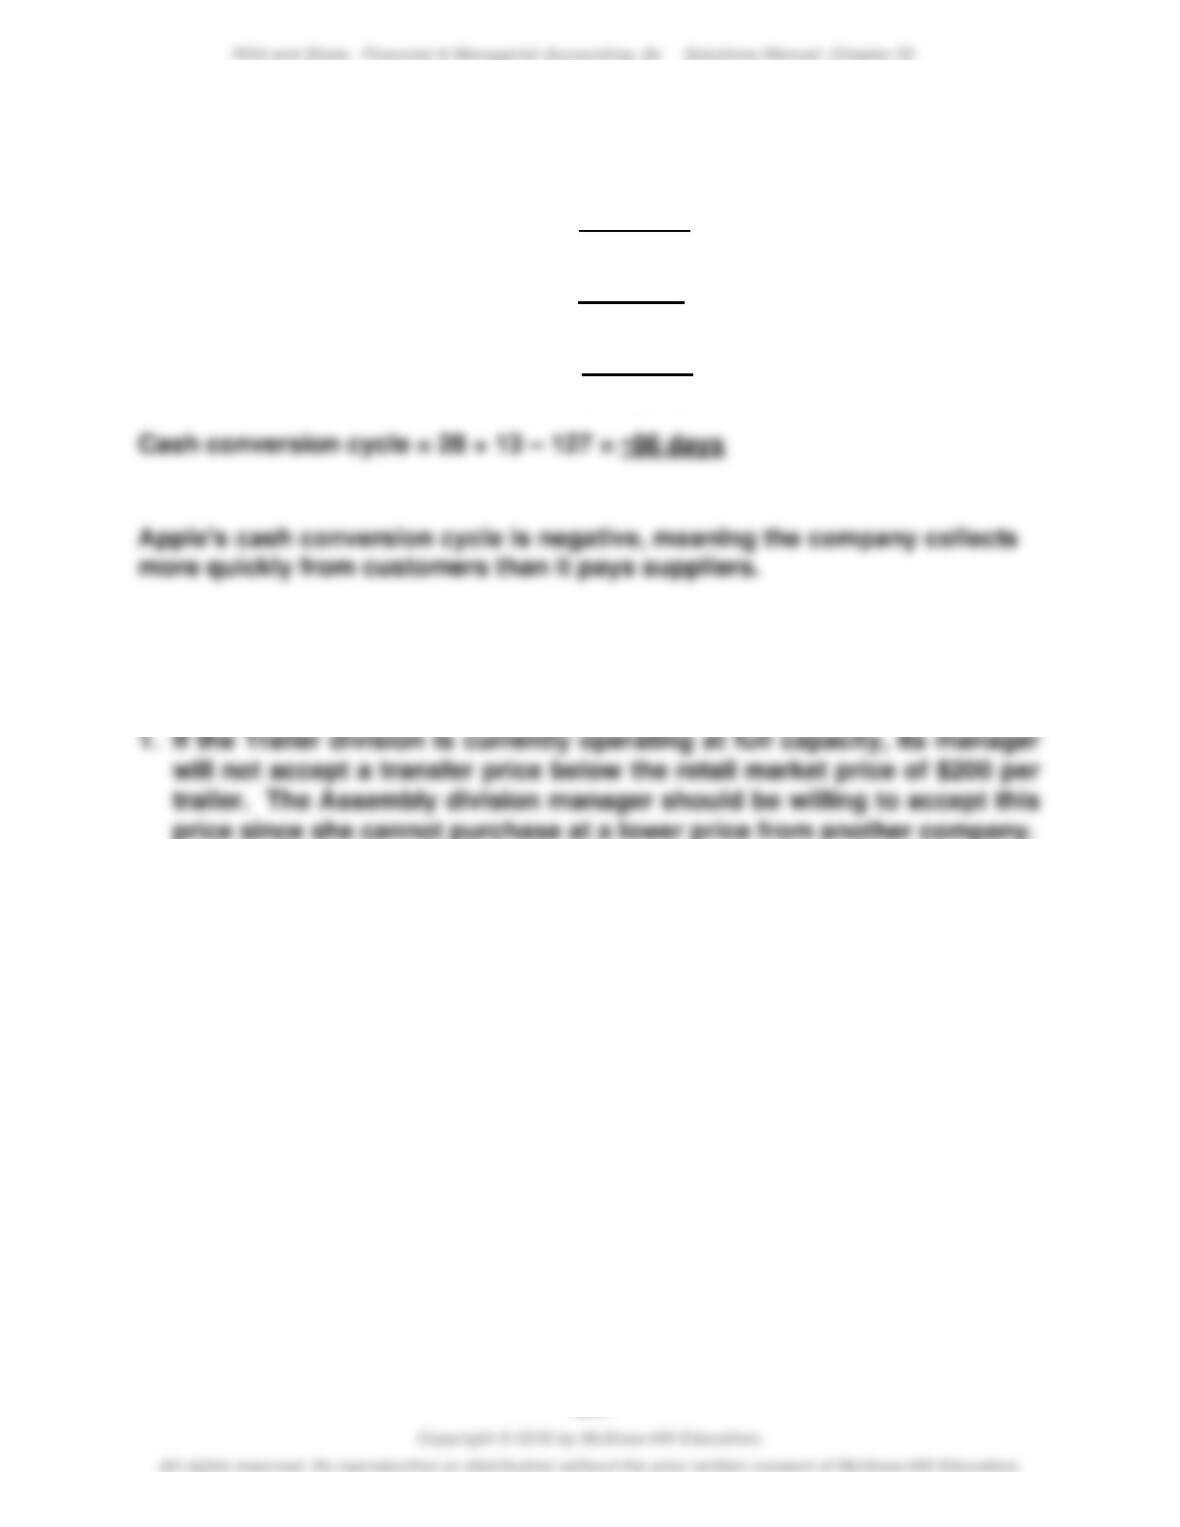
Days’ sales in accounts receivable = $17,874 x 365 = 28 days
$229,234
Days’ sales in inventory = $4,855 x 365 = 13 days
$141,048
Days’ payable outstanding = $49,049 x 365 = 127 days
$141,048
Exercise 22–20B (15 minutes)
2. If the Trailer division is currently producing 20,000 trailers and the
Assembly division will order 15,000 more trailers, the Trailer division will
have excess capacity. In this case the range of acceptable transfer
prices will be from the $80 variable manufacturing cost through the $200
market price per trailer. The Trailer division manager will not accept
less than $80 per trailer and the Assembly division manager will not pay
more than $200 per trailer.
Exercise 22–21C (20 minutes)
Preliminary calculations
Land cost ……………………………………………………….
$4,000,000
Improvements ……………………………………………………….
3,500,000
Total cost of lots ……………………………………………………
$7,500,000
Lots
Quantity
Price
Total
Canyon …………………………………..
450
$ 55,000
$24,750,000
Hilltop …………………………………….
150
110,000
16,500,000
Total market value ………………….
$41,250,000
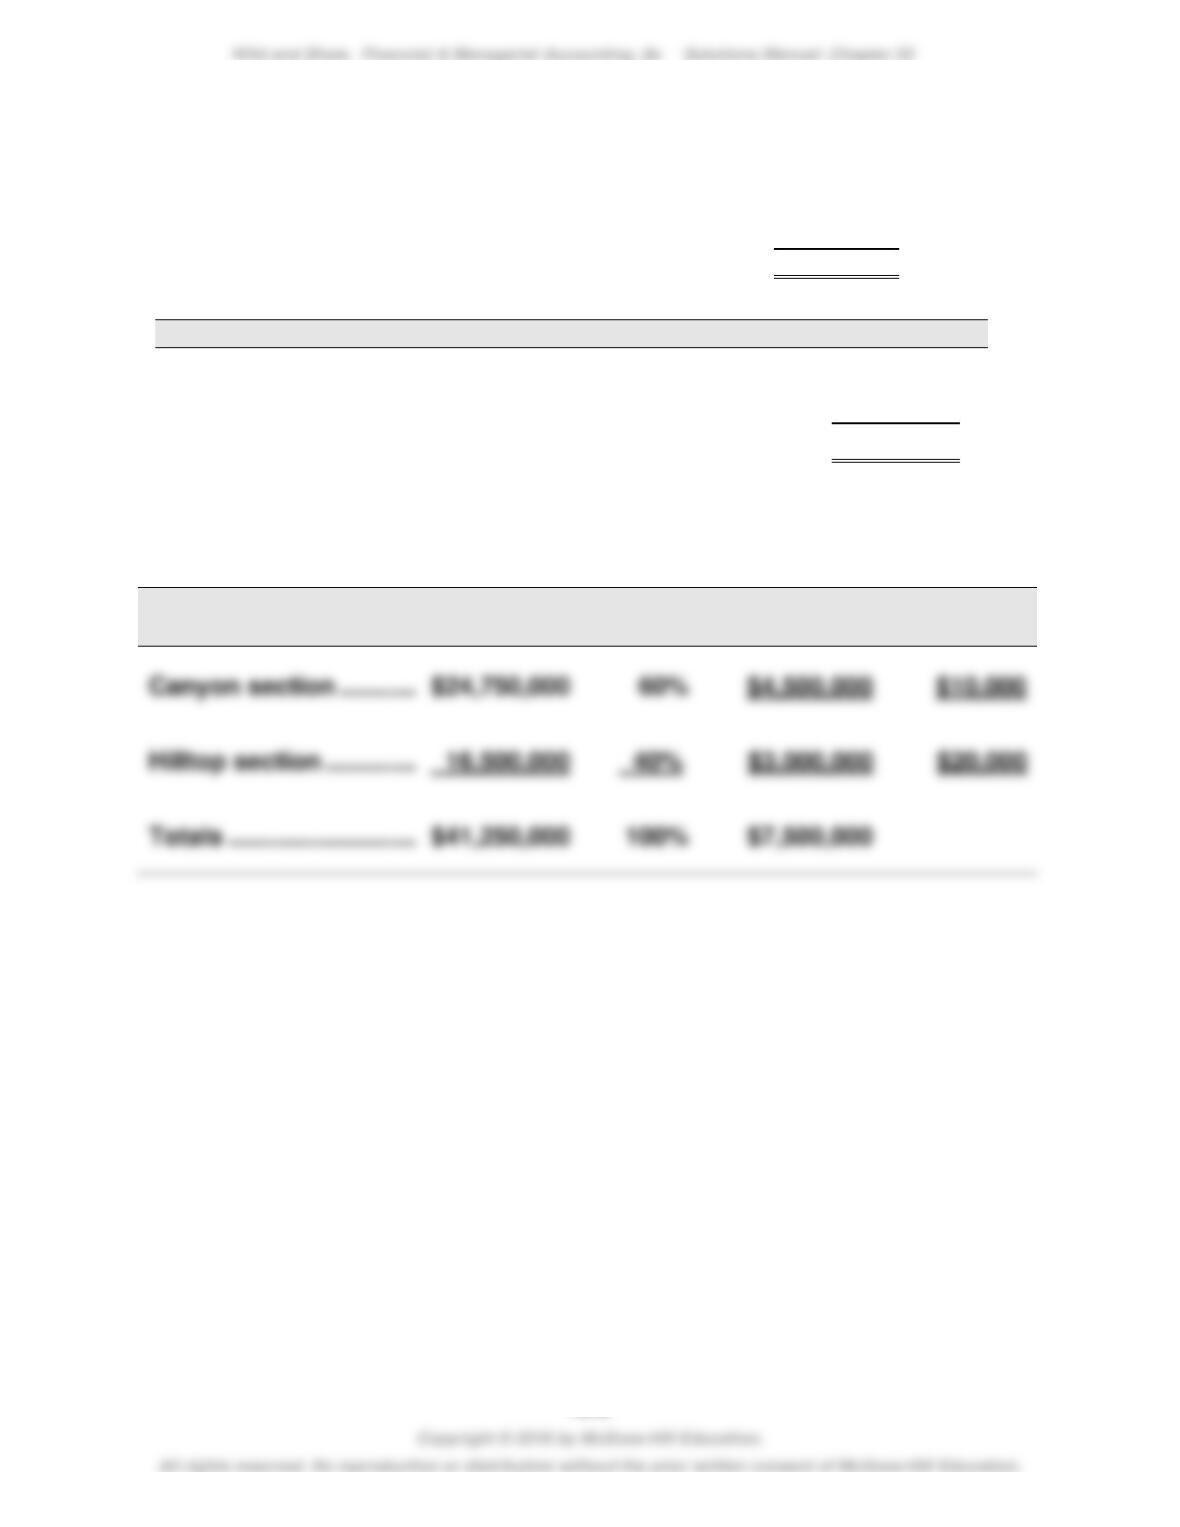
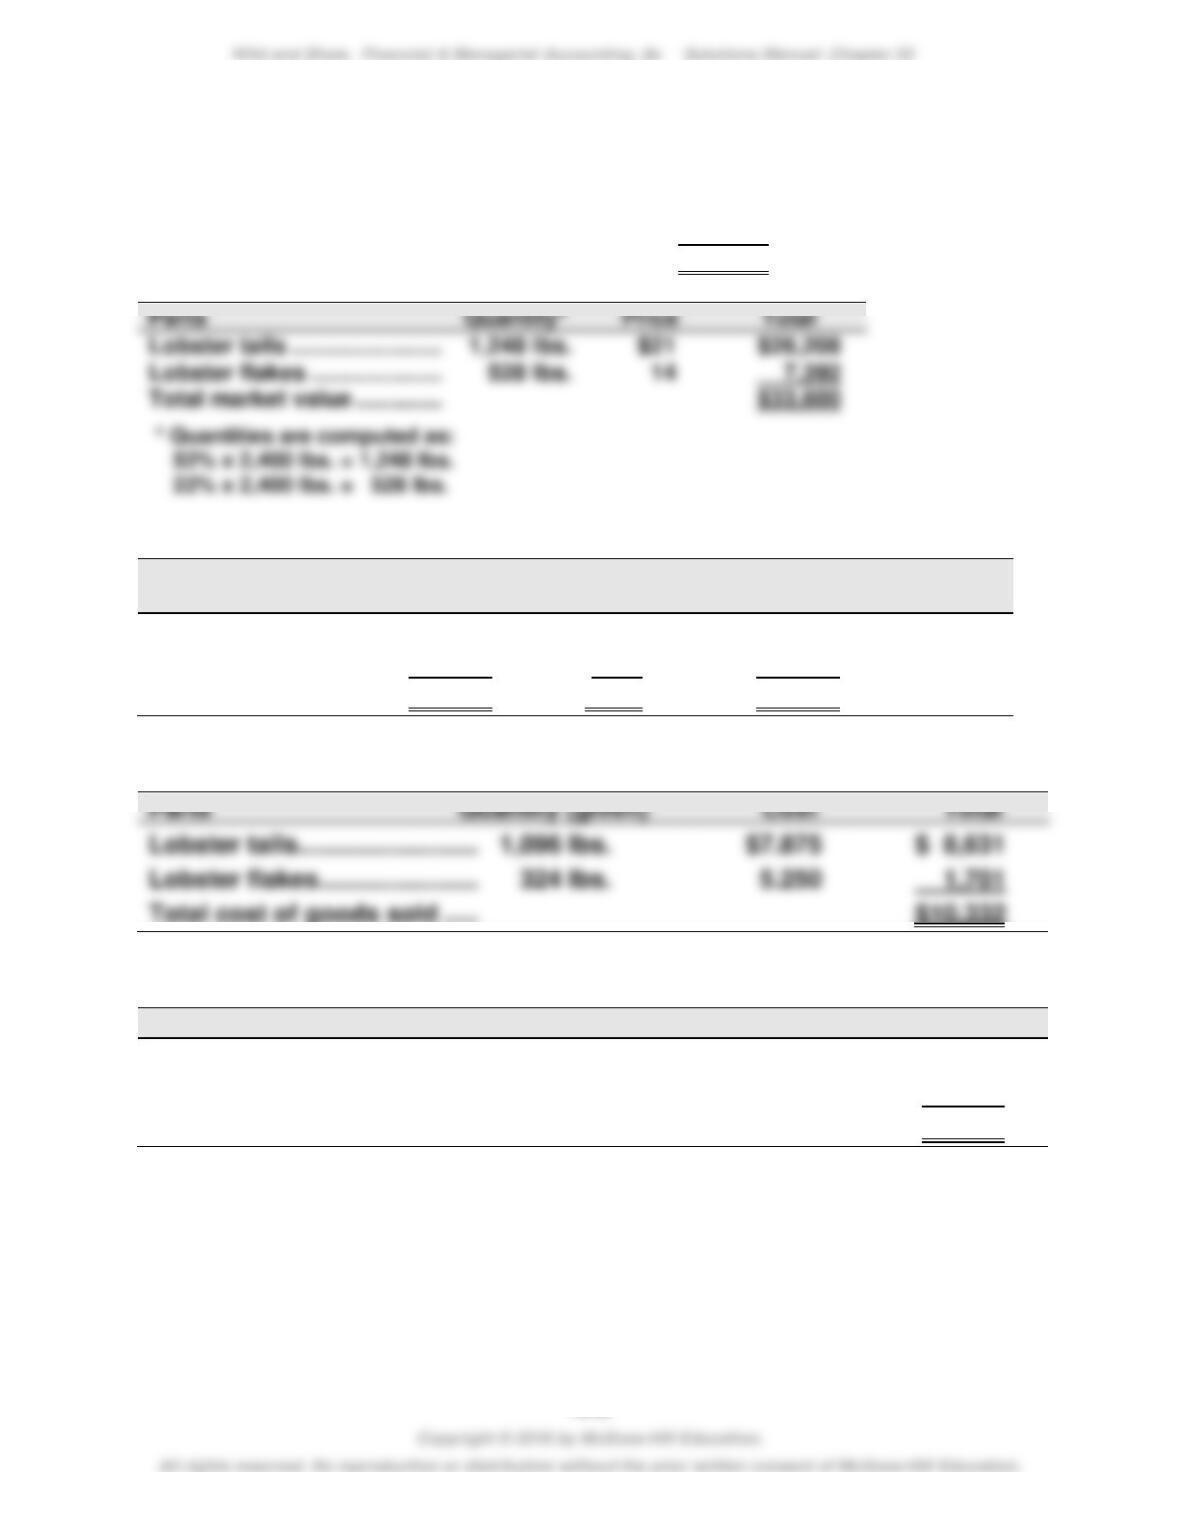
Allocated cost—value basis of allocation: $7,500,000
Market
% of
Allocated
Average
Value
Total
Cost
Lot Cost
Exercise 22–22C (25 minutes)
Preliminary calculations
Lobster cost (2,400 lbs. x $4.50) ………………….
$10,800
Labor cost ………………………………………………….
1,800
Total cost of processed lobsters ………………..
$12,600
Parts
Lobster tails ……………………..
1,248 lbs.
$26,208
Lobster flakes …………………..
7,392
Total market value …………….
$33,600
Allocated cost—value basis allocation: $12,600
Market
% of
Allocated
Cost
Parts
Value
Total
Cost
per lb.
Lobster tails ………………..
$26,208
78.0%
$9,828
$7.875
Lobster flakes ……………..
7,392
22.0
2,772
5.250
Total …………………………..
$33,600
100.0%
$12,600
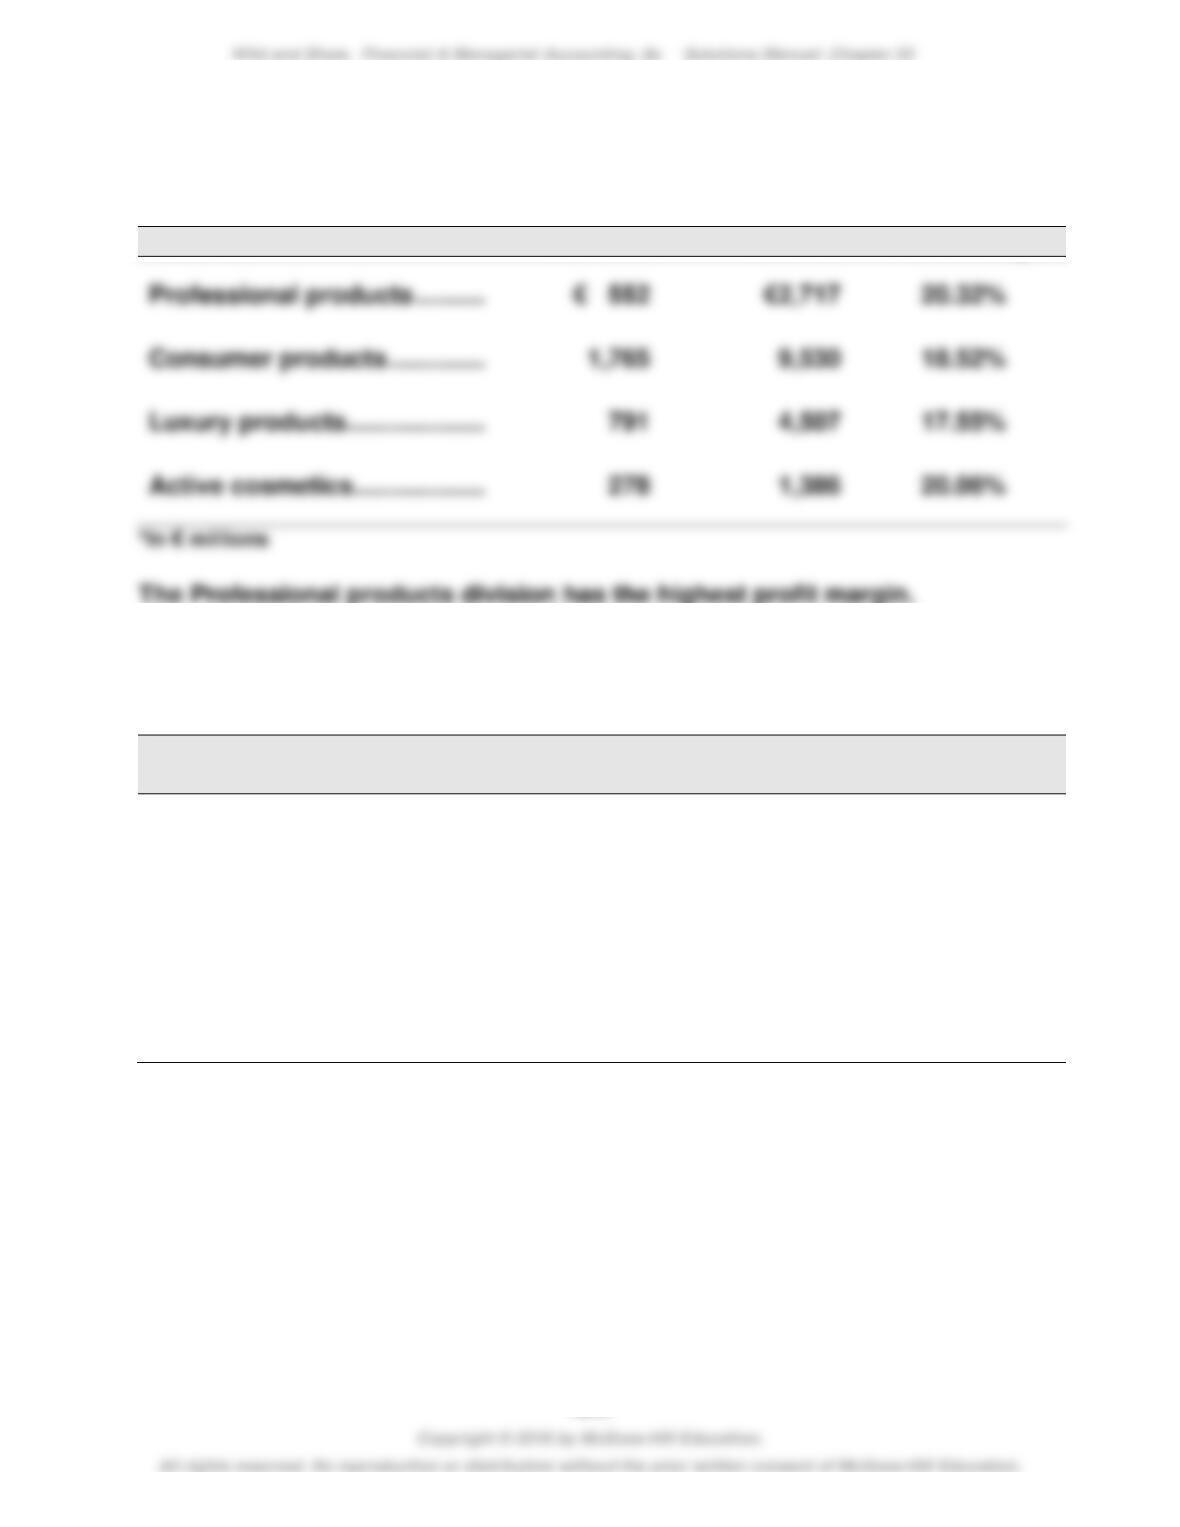
(1) Cost of goods sold
Parts
Total
Lobster tails ……………………….
$7.875
Lobster flakes…………………….
Total cost of goods sold …….
(2) Cost of ending inventory
Parts
Quantity
Cost
Total
Lobster tails ……………………….
152 lbs.*
$7.875
$ 1,197
Lobster flakes…………………….
204 lbs.**
5.250
1,071
Total inventory cost ……………
$ 2,268
* 1,248 lbs. – 1,096 lbs. sold = 152 lbs.
** 528 lbs. – 324 lbs. sold = 204 lbs.
Note: Cost of goods sold ($10,332) plus cost of ending inventory
($2,268) equals the total cost of $12,600.
Exercise 22-23 (20 minutes)
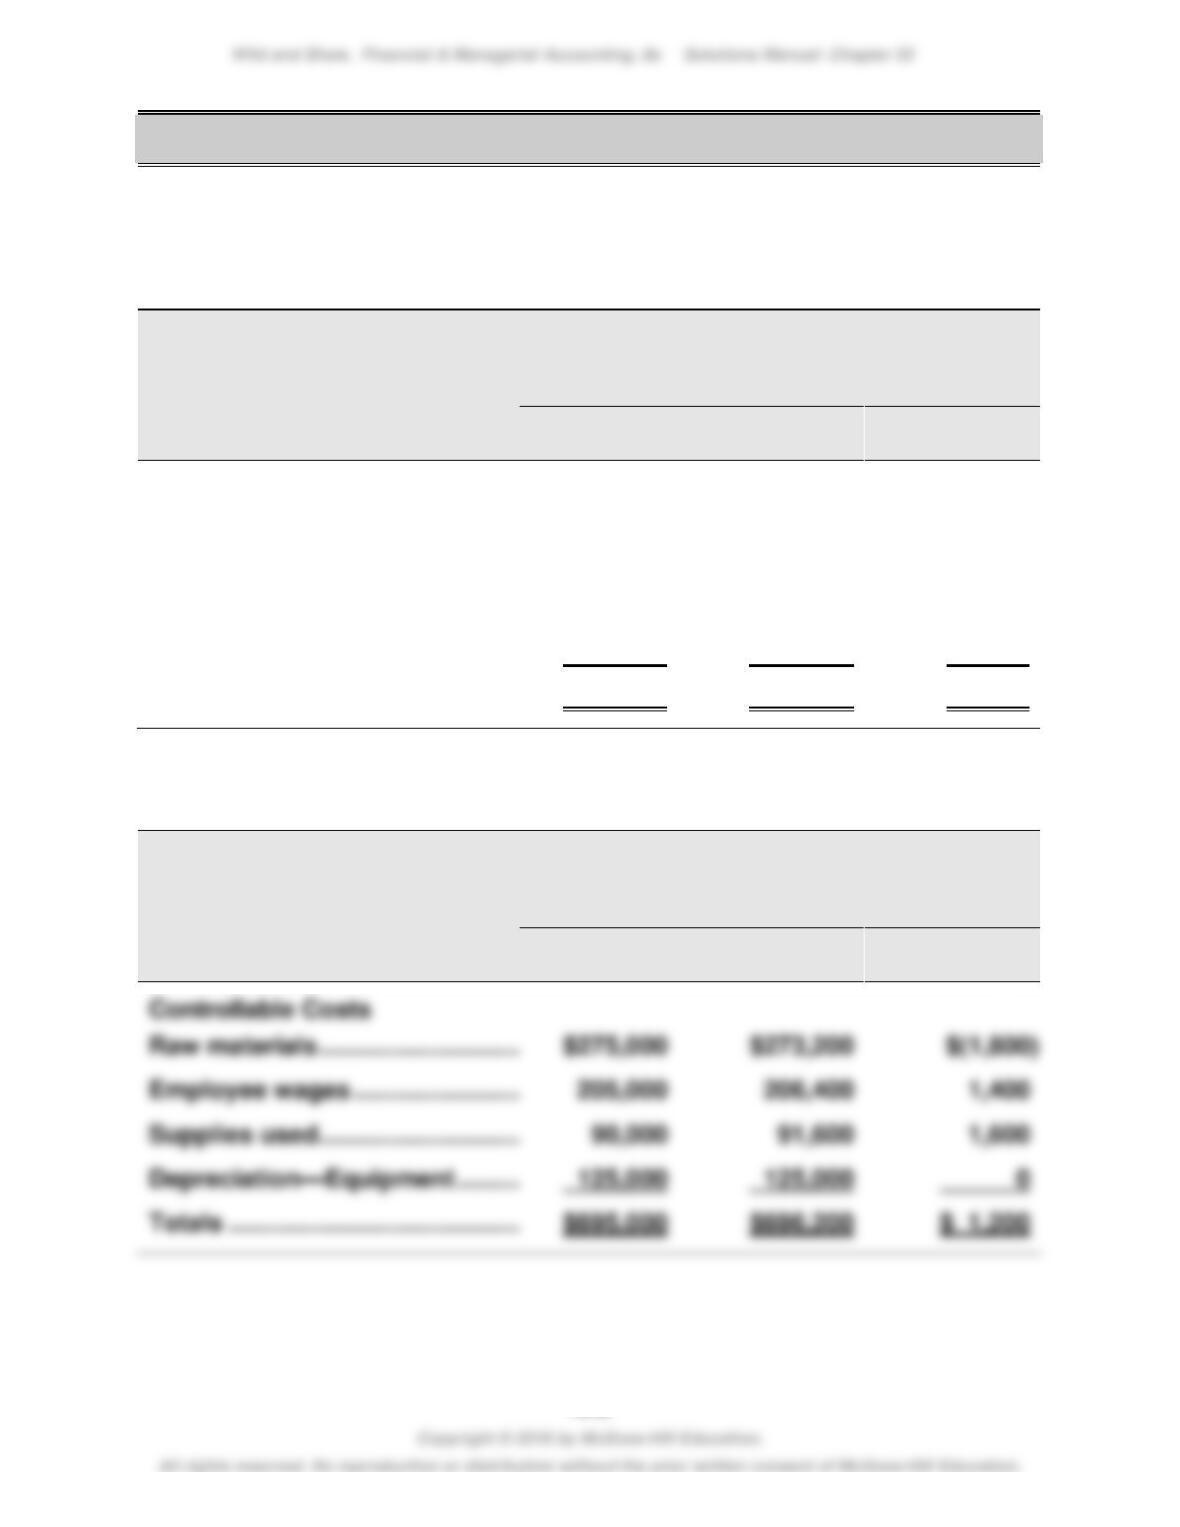
(1) Profit margin = Income/Sales
Division
Income*
Sales*
Profit margin
Professional products ……….
€2,717
Consumer products …………..
1,765
9,530
Luxury products………………..
4,507
Active cosmetics……………….
(2) Investment turnover = Sales/Average invested assets
Investment center
Sales*
Avg. assets*
Investment
turnover
Professional products ……….
€2,717
€2,570
1.06
Consumer products …………..
9,530
5,745
1.66
Luxury products………………..
4,507
3,855
1.17
Active cosmetics……………….
1,386
824
1.68
*In € millions. Avg. assets = Beginning assets plus ending assets, divided by two.
Note: Profit margin and investment turnover amounts are rounded to two decimal places.
The Active cosmetics division has the highest investment turnover.
PROBLEM SET A
Problem 22-1A (50 minutes)
Part 1
a.
Responsibility Accounting Performance Report
Dept. Manager, Camper Department
For the Year
Budgeted
Actual
Over (Under)
Amount
Amount
Budget
Controllable Costs
Raw materials …………………………..
$195,000
$194,200
$ (800)
Employee wages …………………………
104,000
106,600
2,600
Supplies used …………………………..
33,000
31,700
(1,300)
Depreciation—Equipment ……………
60,000
60,000
0
Totals …………………………………………
$392,000
$392,500
$ 500
b.
Responsibility Accounting Performance Report
Dept. Manager, Trailer Department
For the Year
Budgeted
Actual
Over (Under)
Amount
Amount
Budget
Controllable Costs
Raw materials …………………………..
$275,000
$273,200
$(1,800)
Employee wages ………………………..
205,000
206,400
Supplies used …………………………..
90,000
91,600
Depreciation—Equipment …………..
125,000
125,000
Totals ………………………………………..
$695,000
$696,200
Problem 22-1A (Continued)
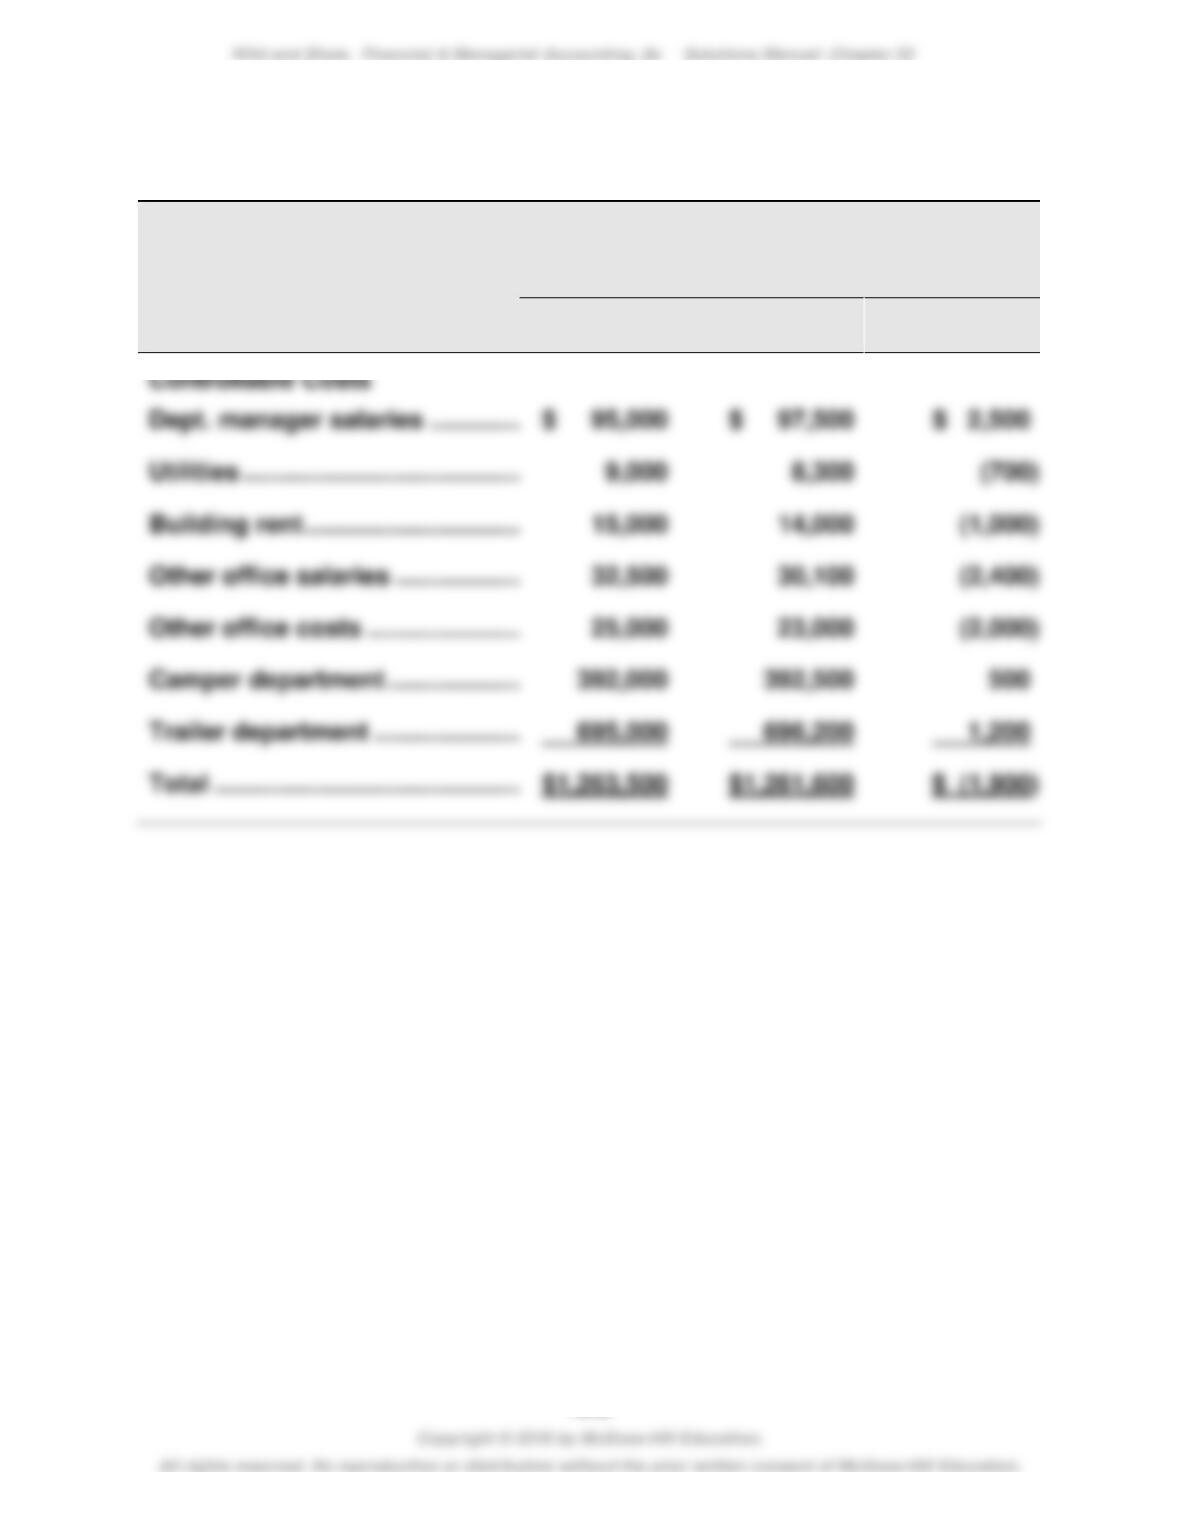
c.
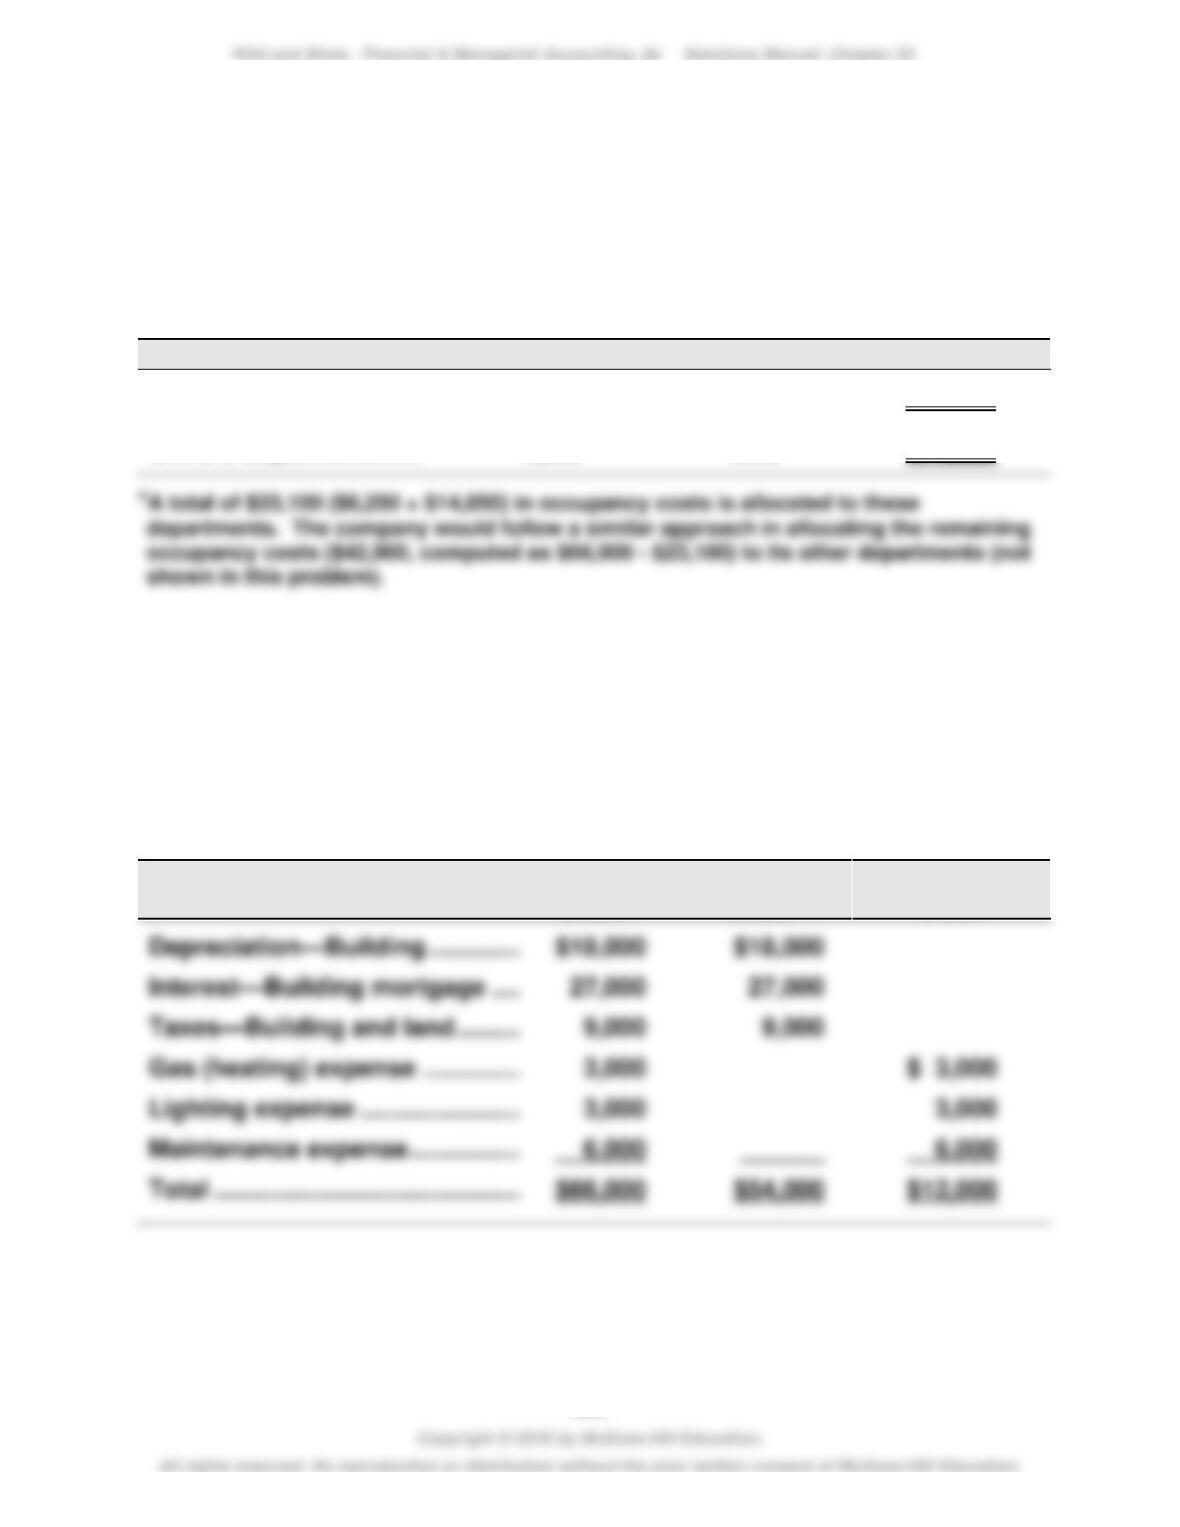
Responsibility Accounting Performance Report
Plant Manager, Indiana Plant
For the Year
Budgeted
Actual
Over (Under)
Amount
Amount
Budget
Part 2
The plant manager did a better job of controlling costs and meeting the
budget. She came in under budget for the plant even though she paid the
department managers more than budgeted and had to absorb the amounts
over budget in their departments. This is because she spent less than the
budget amount on utilities, building rent, other office salaries, and other
office costs. Each of the department managers came in over budget.
Problem 22-2A (60 minutes)
Part 1
Average occupancy cost = $66,000 / 8,000 sq. ft. = $8.25 per sq. ft.
These costs are assigned to the two departments as follows
Department
Square Footage
Rate
Total
Linder’s Dept. ……………
1,000
$8.25
$ 8,250
Chiro’s Dept. ……………..
1,800
8.25
$14,850
Part 2
Market rates are used to allocate occupancy costs for depreciation,
interest, and taxes. Heating, lighting, and maintenance costs are allocated
to the departments on both floors at the average rate per square foot.
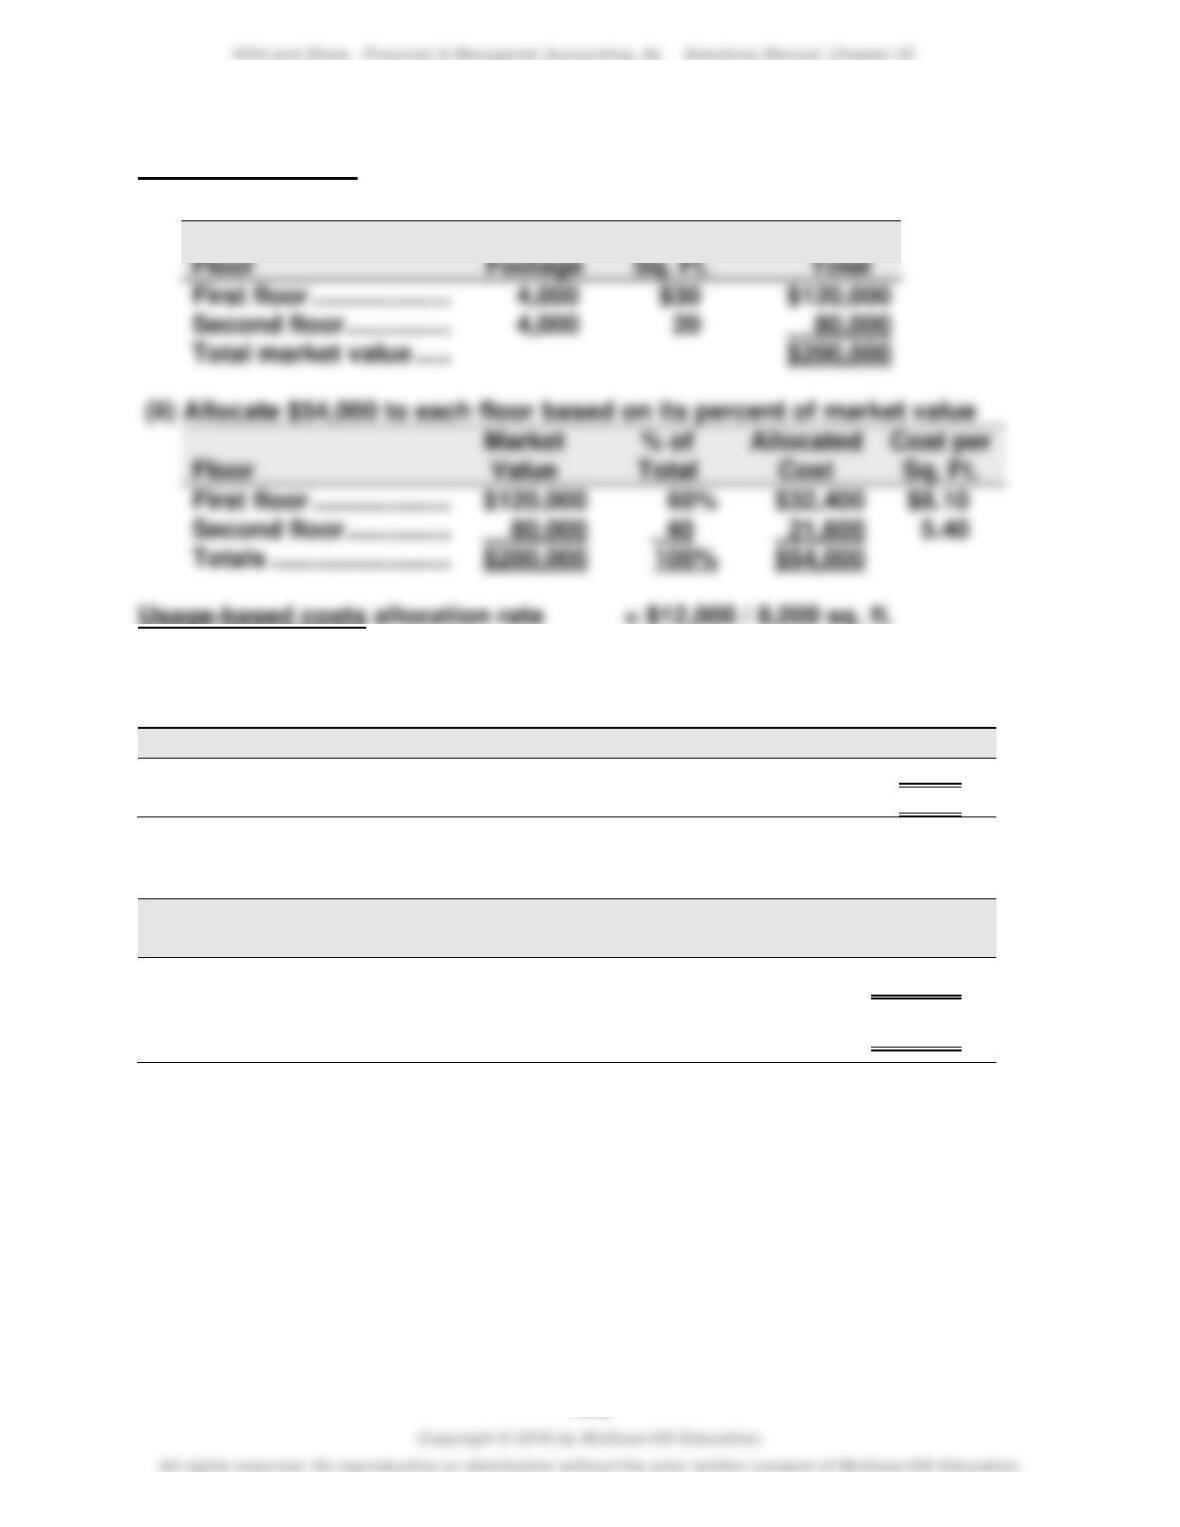
These costs are separately assigned to each class as follows:
Total
Costs
Value-Based
Costs
Usage–Based
Costs
Problem 22-2A (Continued)
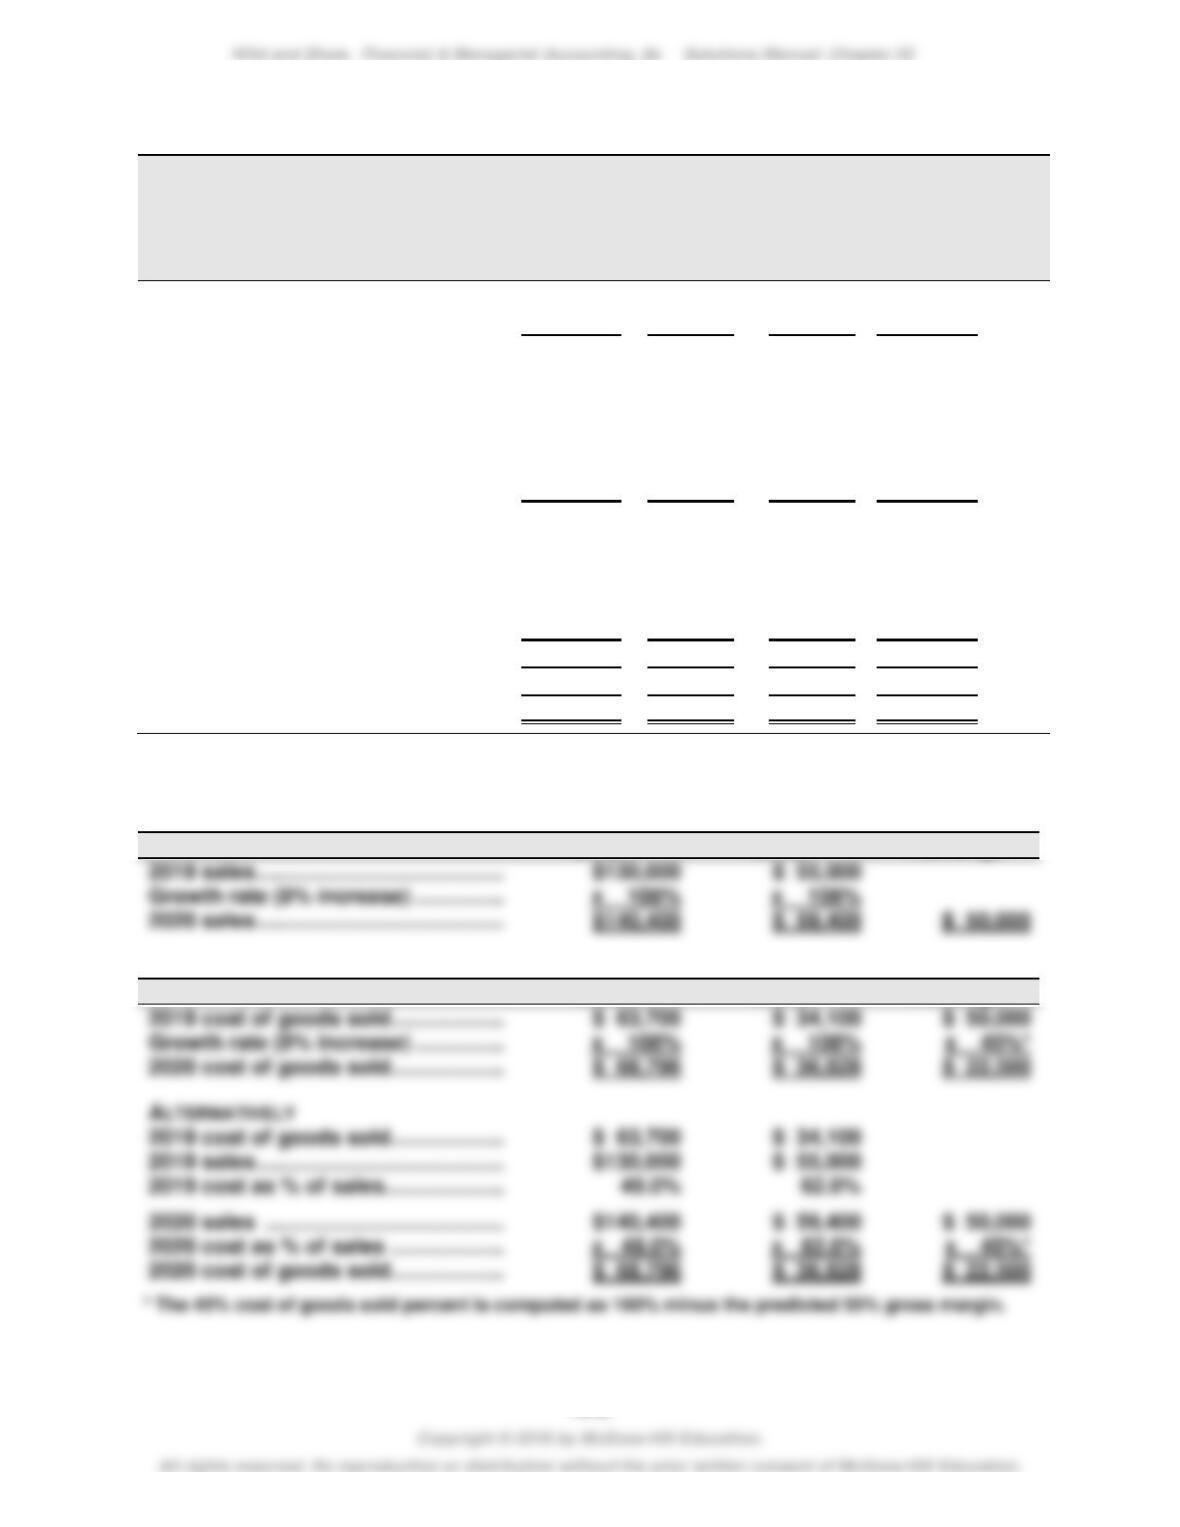
Value-based costs are allocated to departments in two steps
(i) Compute market value of each floor
Floor
First floor …………………………..
4,000
Second floor ………………………
4,000
Total market value ……………..
First floor …………………………..
$32,400
Second floor ………………………
Totals …………………………..
$54,000
Square
Value per
= $1.50 per sq. ft.
We can then compute total allocation rates for the floors
Floor
Value
Usage
Total
First floor …………………………..
$8.10
$1.50
$9.60
Second floor ………………………
5.40
1.50
$6.90
These rates are applied to allocate occupancy costs to departments
Department
Square
Footage
Rate
Total
Linder’s Department ……………………
1,000
$9.60
$ 9,600
Chiro’s Department……………………..
1,800
6.90
$12,420
Part 3
A second-floor manager would prefer allocation based on market value. This is a
reasonable and logical approach to allocation of occupancy costs. The current
method implies all square footage has equal value. This is not logical for this
type of occupancy. It also means the second-floor space would be allocated a
larger portion of costs under the current method, but less using an allocation
based on market value.
Problem 22-3A (70 minutes)
Williams Company
Forecasted Departmental Income Statements
For Year Ended December 31, 2020
Clock
Mirror
Paintings
Combined
Sales ………………………………………..
$140,400
$59,400
$50,000
$249,800
(1)
Cost of goods sold ……………………
68,796
36,828
22,500
128,124
(2)
Gross profit ………………………………
71,604
22,572
27,500
121,676
Direct expenses
Sales salaries ………………………….
20,000
7,000
8,000
35,000
Advertising ……………………………..
1,200
500
800
2,500
Store supplies used …………………
972
432
500
1,904
(3)
Depreciation of equipment ………
1,500
300
200
2,000
Total direct expenses ………………
23,672
8,232
9,500
41,404
Allocated expenses
Rent expense ………………………….
5,616
2,835
2,349
10,800
(4)
Utilities expense ……………………..
2,080
1,048
872
4,000
(4)
Share of office dept. expenses …
12,364
5,236
4,400
22,000
(5)
Total allocated expenses …………
20,060
9,119
7,621
36,800
Total expenses ………………………….
43,732
17,351
17,121
78,204
Net income ……………………………….
$ 27,872
$ 5,221
$10,379
$ 43,472
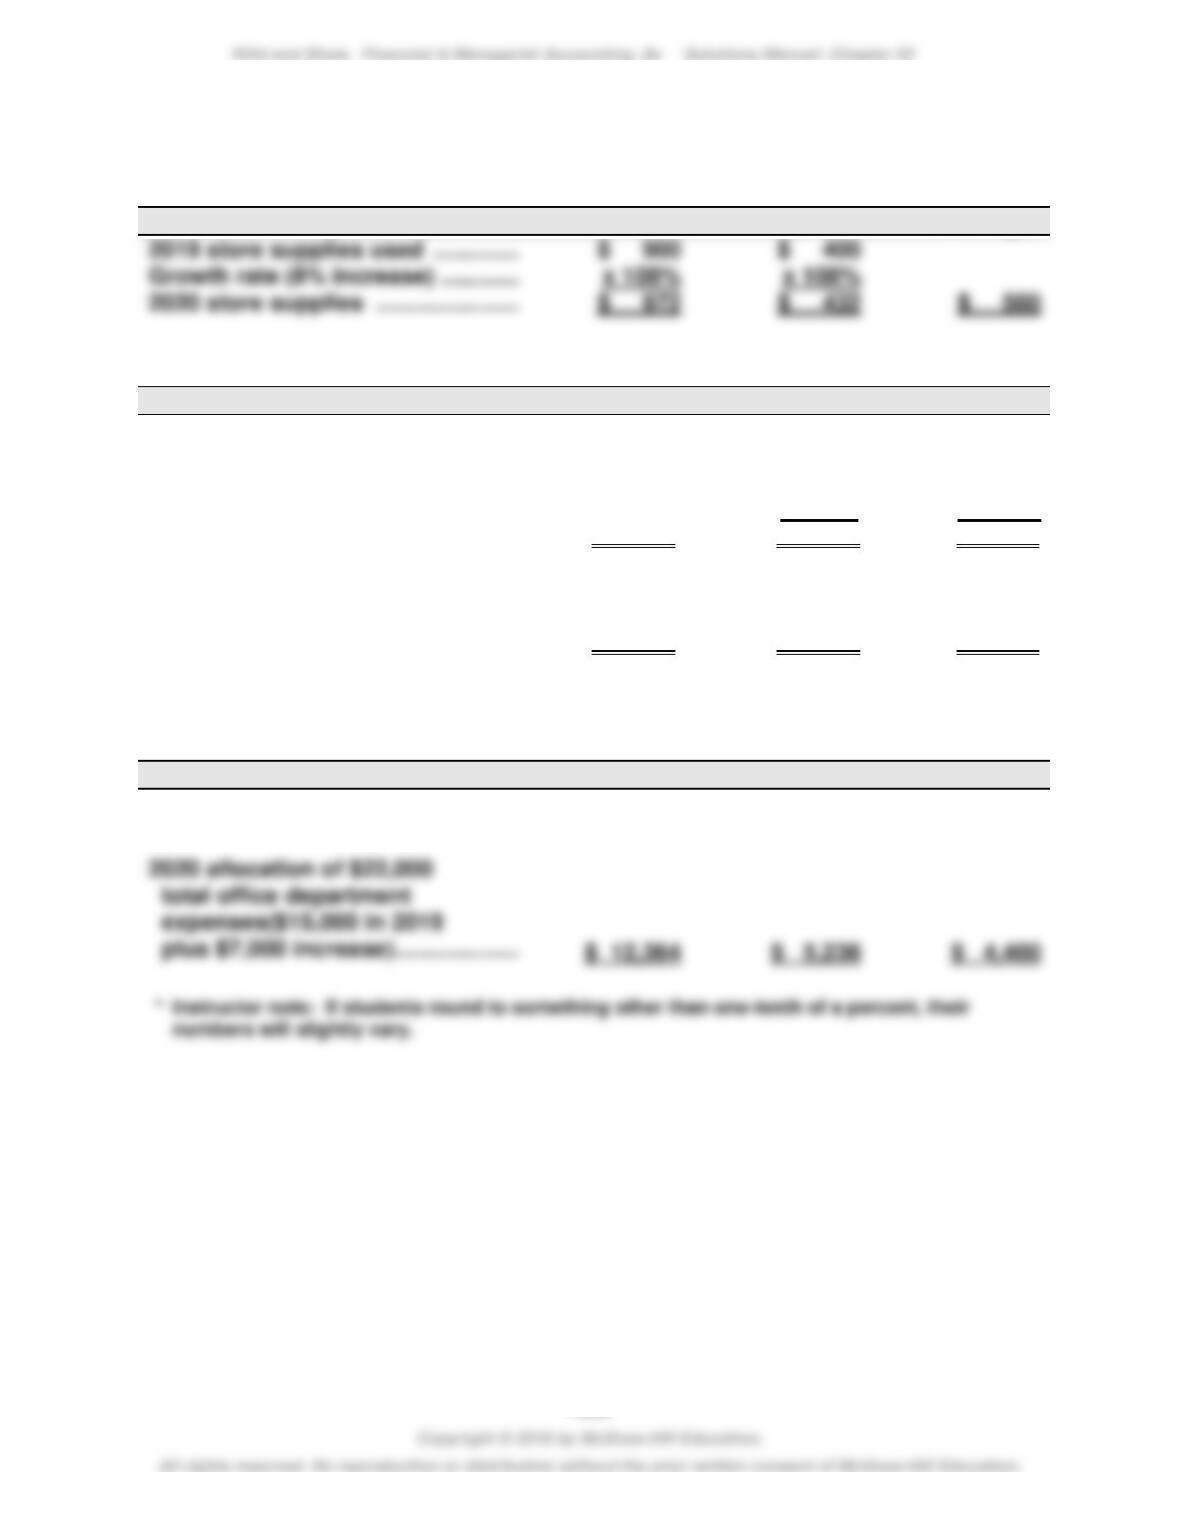
Supporting Computations—coded (1) through (5) in statement above
Note 1 (Sales)
Clock
Mirror
Paintings
Note 2 (Cost of Goods Sold)
Clock
Mirror
Paintings
Problem 22-3A (Continued)
Note 3 (Store Supplies Used)
Clock
Mirror
Paintings
2019 store supplies used ………………..
$ 400
Growth rate (8% increase) ……………….
x 108%
x 108%
$ 432
$ 500
Note 4 (Rent and Utilities)
Clock
Mirror
Paintings
2019 rent ………………………………………..
$ 7,020
$ 3,780
One-fifth from clock to paintings ……..
(1,404)
$ 1,404
One-fourth from mirror to
paintings …………………………………………
______
(945)
945
2020 allocation of $10,800 rent …………
$ 5,616
$ 2,835
$ 2,349
Percent of total * …………………………..
52.0%
26.2%†
21.8%†
2020 allocation of $4,000
total utilities …………………………………
$ 2,080
$ 1,048
$ 872
† Adjusted to eliminate rounding difference.
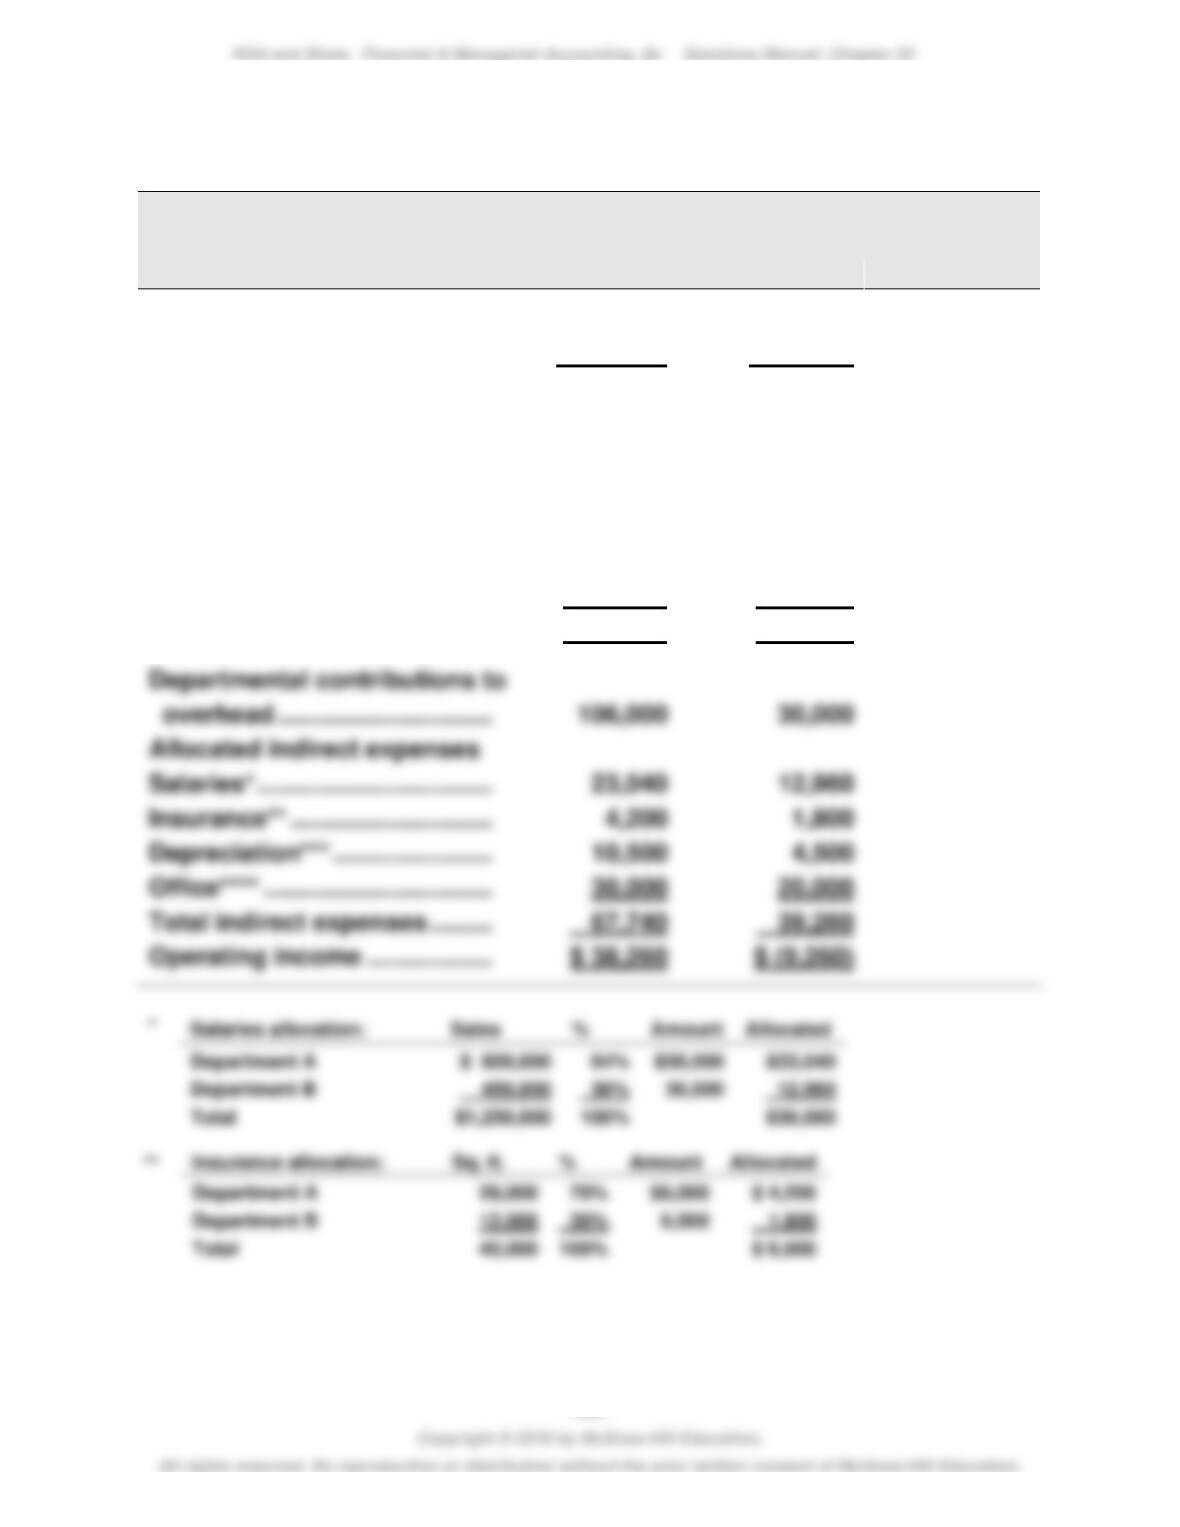
Note 5 (Office Department Expenses)
Clock
Mirror
Paintings
2019 sales ………………………………………
$140,400
$ 59,400
$ 50,000
Percent of total sales * …………………….
56.2%
23.8%
20.0%
Problem 22-4A (45 minutes)
Part 1
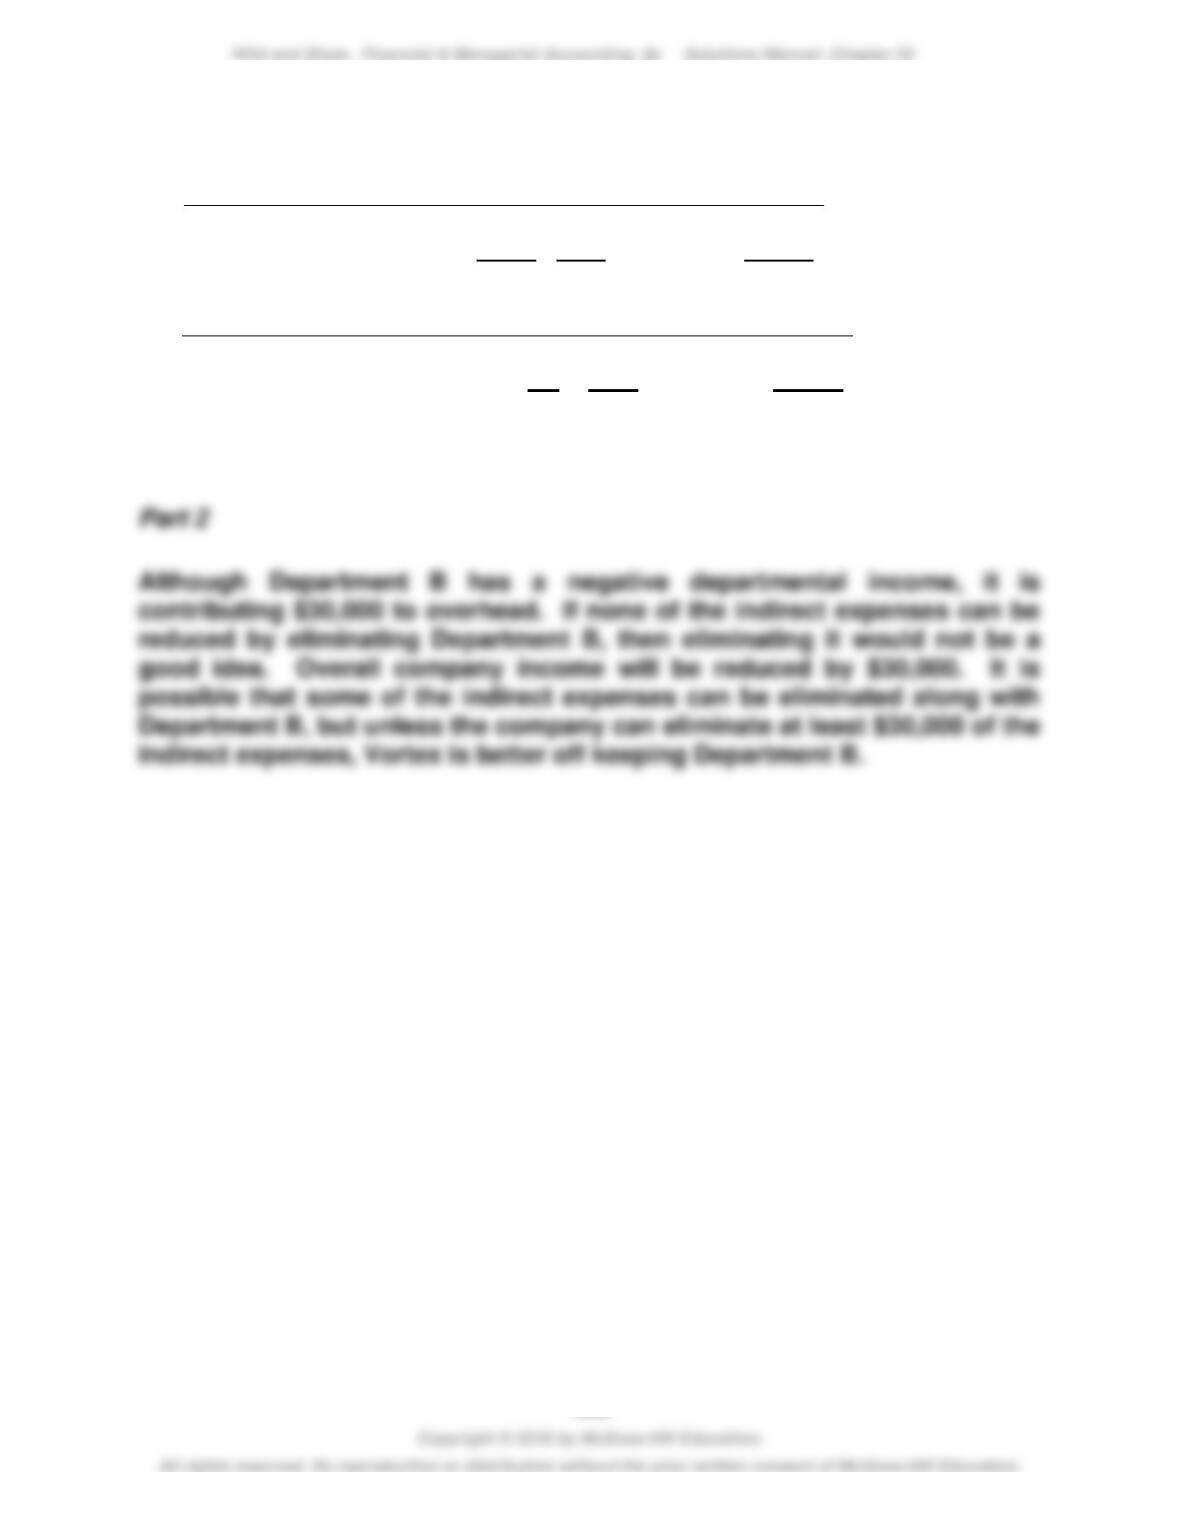
VORTEX COMPANY
Departmental Contribution Statements
Dept. A
Dept. B
Sales ………………………………….
$800,000
$450,000
Cost of goods sold …………….
497,000
291,000
Gross profit ……………………….
303,000
159,000
Direct expenses
Salaries ……………………………..
125,000
88,000
Insurance …………………………..
Utilities ………………………………
Depreciation. ……………………..
20,000
24,000
21,000
10,000
14,000
12,000
Maintenance ………………………
7,000
5,000
Total direct expenses …………
197,000
129,000
Salaries* …………………………….
23,040
12,960
Insurance** ………………………..
Depreciation*** …………………..
10,500
Total indirect expenses ………
30,000
20,000
Problem 22-4A (Concluded)
***
Depreciation allocation:
Sq. ft.
%
Amount
Allocated
Department A
28,000
70%
$15,000
$10,500
Department B
12,000
30%
15,000
4,500
Total
40,000
100%
$15,000
****
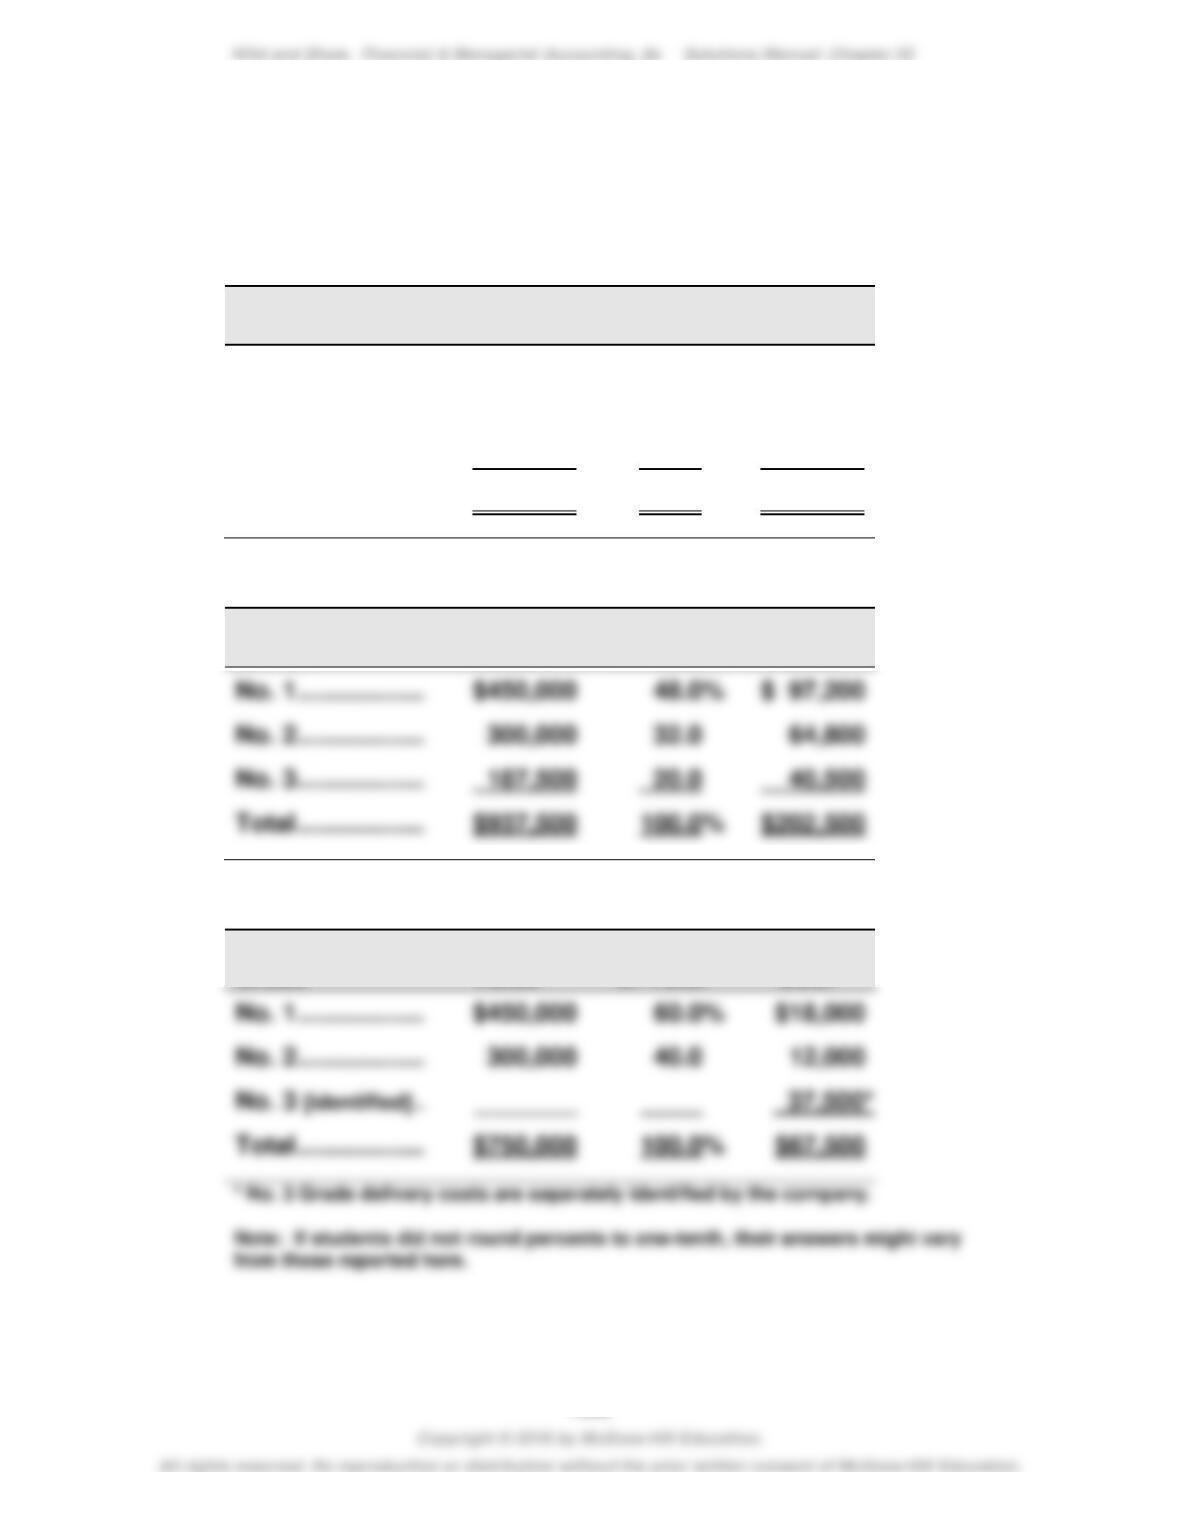
Office expense allocation:
Employees
%
Amount
Allocated
Department A
75
60%
$50,000
$30,000
Department B
50
40%
50,000
20,000
Total
125
100%
$50,000
P
Problem 22-5AC (60 minutes)
Part 1
Allocations of joint costs on the basis of sales values
Tree pruning and care: $405,000
Grade
Sales
Value
Percent
of Total
Allocated
Cost
No. 1 ………………………….
$450,000
48.0%
$194,400
No. 2 ………………………….
300,000
32.0
129,600
No. 3 ………………………….
187,500
20.0
81,000
Total ………………………….
$937,500
100.0%
$405,000
Picking, sorting, and grading: $202,500
Grade
Sales
Value
Percent
of Total
Allocated
Cost
No. 1 ………………………….
$450,000
48.0%
$ 97,200
No. 2 ………………………….
300,000
32.0
No. 3 ………………………….
187,500
20.0
40,500
$937,500
$202,500
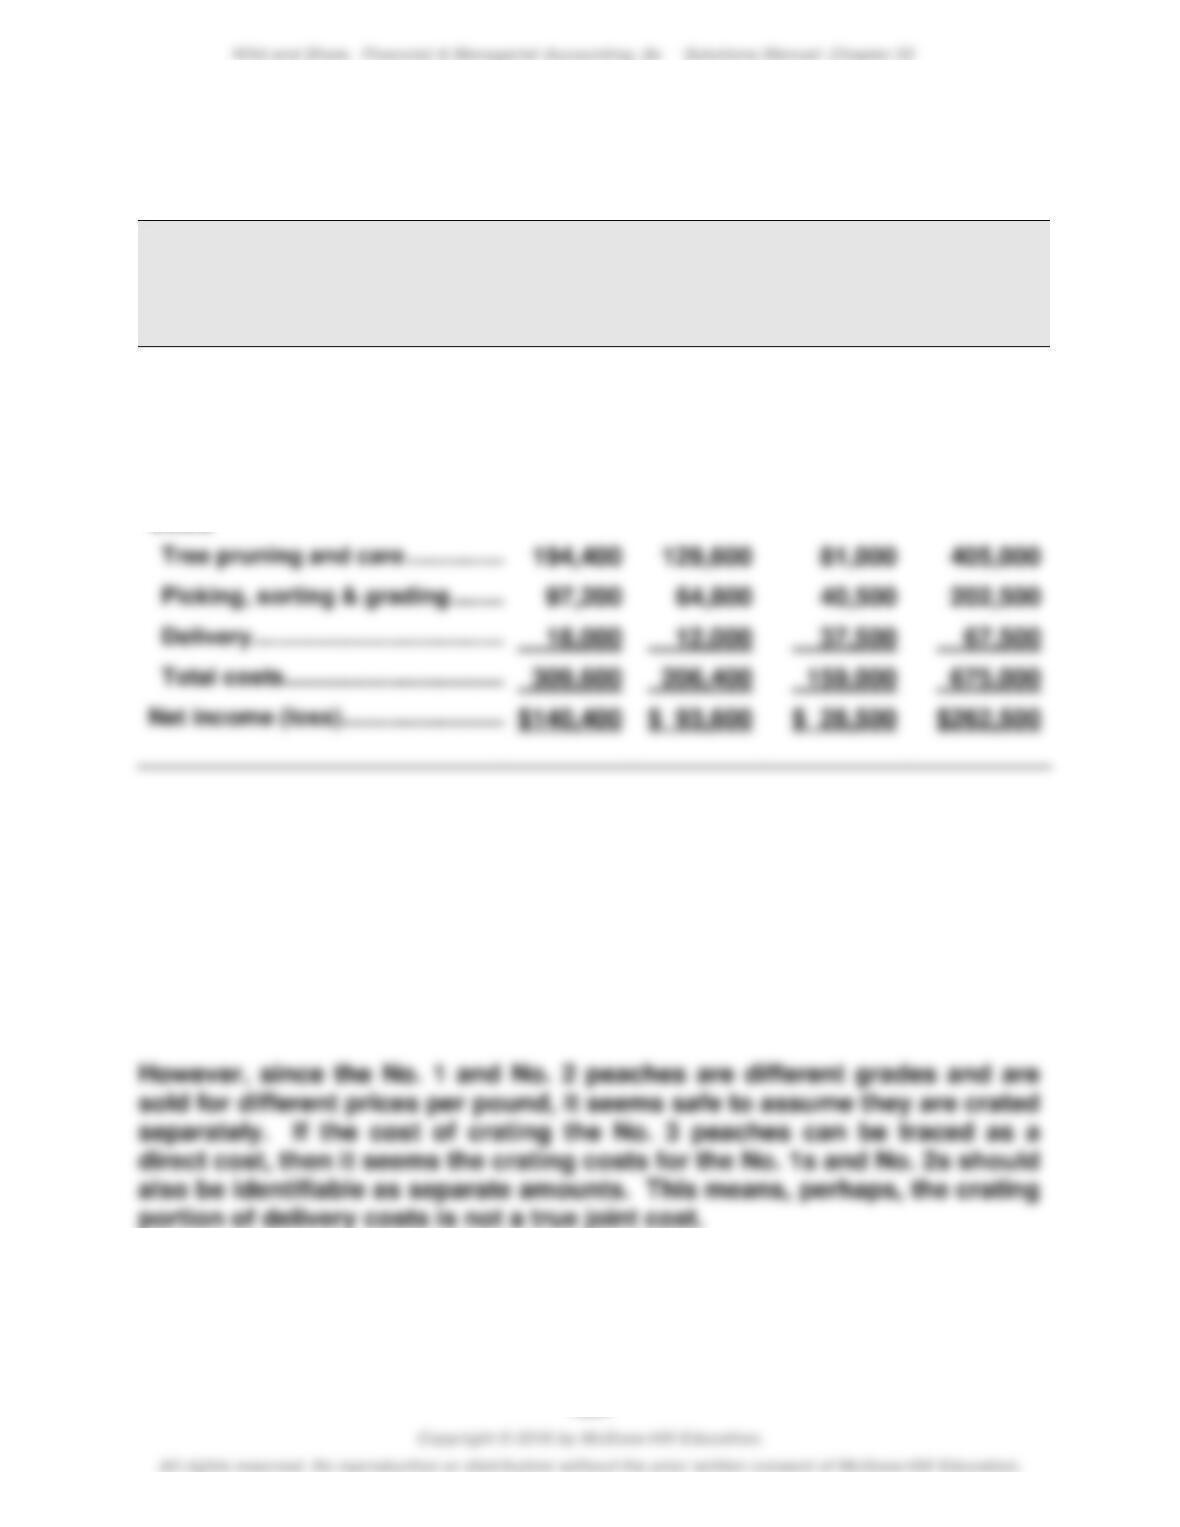
Delivery: $30,000 to Grade Nos. 1 & 2
Grade
Value
of Total
Cost
No. 1 ………………………….
$450,000
60.0%
No. 2 ………………………….
300,000
40.0
No. 3 [identified] …………..
$750,000
Sales
Percent
Allocated
Problem 22-5AC (Continued)
Part 2
GEORGIA ORCHARDS
Income Statement
For Year Ended December 31, 2019
No. 1
No. 2
No. 3
Combined
Sales (by grade)
No. 1: 300,000 lbs. @ $1.50 …………
$450,000
No. 2: 300,000 lbs. @ $1.00 …………
$300,000
No. 3: 750,000 lbs. @ $0.25 …………
$187,500
Total sales …………………………………
$937,500
Part 3
Delivery costs include both crating and hauling costs. Georgia is able to
identify the portion of the cost directly related to the No. 3 peaches,
presumably because the No. 3s are going to a different destination than the
No. 1 and No. 2 peaches. If the No. 1s and No. 2s are going to the same
place, then the hauling portion of the delivery cost may truly be a joint cost,
at least for the No. 1 and No. 2 peaches.
PROBLEM SET B
Problem 22-1B (50 minutes)
Part 1
a.
Responsibility Accounting Performance Report
Dept. Manager, Refrigerator Department
For the Month of April
Budgeted
Actual
Over (Under)
Amount
Amount
Budget
Controllable Costs
Raw materials …………………………..
$400,000
$385,000
$(15,000)
Employee wages ………………………
170,000
174,700
4,700
Supplies used …………………………..
15,000
14,000
(1,000)
Depreciation—Equipment …………
53,000
53,000
0
Totals ………………………………………
$638,000
$626,700
$(11,300)
b.
Responsibility Accounting Performance Report
Dept. Manager, Dishwasher Department
For the Month of April
Budgeted
Actual
Over (Under)
Amount
Amount
Budget
Raw materials …………………………..
Employee wages …………………………
80,000
81,500
Supplies used …………………………..
Totals …………………………………………
$326,000
$330,200