chapter
22(7)
Performance Evaluation
Using Variances from
Standard Costs
______________________________________________
OPENING COMMENTS
Standard cost systems set budgets for the materials, labor, and factory overhead used by a manufacturer to
produce its product. Deviations from these standards are reported as variances.
After studying the chapter, your students should be able to:
2. Describe and illustrate how standards are used in budgeting.
4. Compute and interpret factory overhead controllable and volume variances.
6. Describe and provide examples of nonfinancial performance measures.
KEY TERMS
budget performance report
budgeted variable factory overhead
controllable variance
cost variance
currently attainable standards
402 Chapter 22(7) Performance Evaluation Using Variances from Standard Costs
direct labor rate variance
direct labor time variance
direct materials price variance
direct materials quantity variance
factory overhead cost variance report
favorable cost variance
ideal standards
STUDENT FAQS
• Do we need to know all these variance formulas? If so, is there a shortcut method we can use to
calculate the six formulas?
• What is a standard, and why can it vary from company to company?
• How often should a standard change?
• Why does management need to evaluate variances and make adjustments?
• Factory overhead is divided into fixed and variable costs. Why not call volume, fixed and
controllable, variable? It is easier to remember.
• Remind me again, what’s the difference between “applied” and “budgeted”?
• What do volume and controllable variances really mean?
OBJECTIVE 1
Describe the types of standards and how they are established.
SYNOPSIS
Manufacturing companies usually use standard costs for direct materials, direct labor, and factory
overhead. Accounting systems use standard cost systems to determine how much a product should cost
and how much it does cost. The differences are reported as cost variances. It requires the efforts of
Chapter 22(7) Performance Evaluation Using Variances from Standard Costs 403
Key Terms and Definition
• Currently Attainable Standards – Standards that represent levels of operation that can be
attained with reasonable effort.
SUGGESTED APPROACH
Manufacturing firms set standards for the amount and price of direct materials, direct labor, and overhead
consumed by their products. Standards establish a benchmark to be used in evaluating actual
performance. They allow management to recognize when costs are not in line with the company’s
projections and to take corrective action.
This objective also discusses the motivational impact of standards and when they should be revised.
Stress the following points:
1. Unrealistically high standards frustrate employees and stifle motivation. As a result, most companies
do not use theoretical standards, which can be achieved only under perfect operating conditions.
3. Standards should be changed when they no longer reflect operating conditions. They should not be
revised simply because workers fail to meet standards.
CLASS DISCUSSION—Motivational Impact of Standards
Ask your students to discuss whether they view the grading standards of this course, or other college
courses, as ideal (theoretical standards) or normal (currently attainable standards). Ask them to comment
404 Chapter 22(7) Performance Evaluation Using Variances from Standard Costs
OBJECTIVE 2
Describe and illustrate how standards are used in budgeting.
SYNOPSIS
Budgeting assists managers in their control function or budgetary performance evaluation. Manufacturing
standard costs are split into two components: standard price and standard quantity. The standard cost per
unit is computed as: standard cost per unit = standard price × standard quantity. The differences between
Key Terms and Definitions
• Budget Performance Report – A report comparing actual results with budget figures.
• Cost Variance – The difference between actual cost and the flexible budget at actual volumes.
Relevant Example Exercises and Exhibits
• Exhibit 1 – Standard Cost for XL Jeans
• Exhibit 2 – Cost Variances
• Exhibit 3 – Budget Performance Report
• Exhibit 4 – Manufacturing Cost Variances
SUGGESTED APPROACH
Budgets exist to help companies plan, direct, and control operations. The budget performance report is a
tool that compares actual costs to budgeted costs.
Chapter 22(7) Performance Evaluation Using Variances from Standard Costs 405
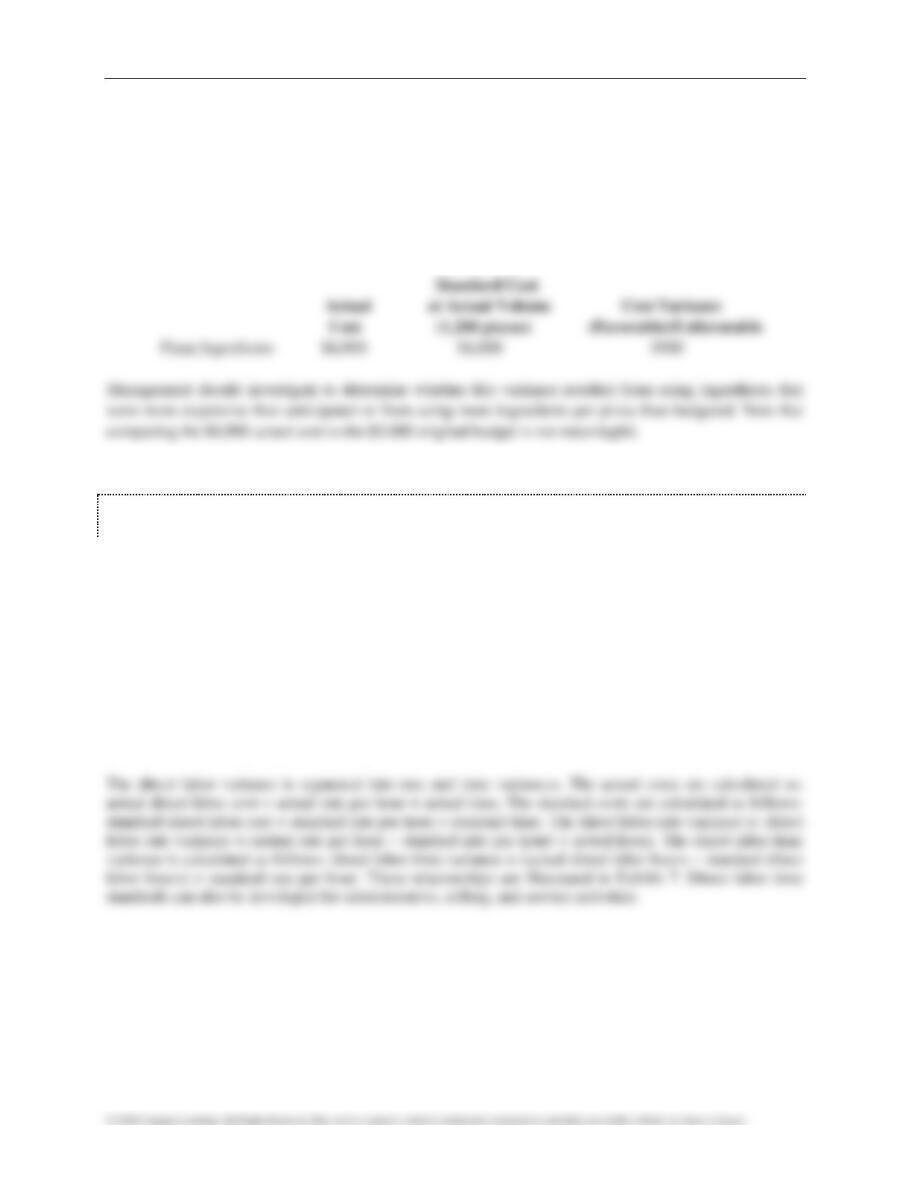
Now, assume the actual number of pizzas sold during the week was 1,200. The standard cost for
ingredients to make 1,200 pizzas is $6,000. If the pizza parlor actually used $6,900 in ingredients during
the week, there is a $900 variance from standard. This is an unfavorable variance since actual costs
exceeded the standard cost for 1,200 pizzas.
This information would be presented on a budget performance report as follows:
OBJECTIVE 3
Compute and interpret direct materials and direct labor variances.
SYNOPSIS
As demonstrated in the prior objective, direct materials and direct labor variances are separated. The direct
materials variance is separated into price and quantity variances. The actual cost is calculated as follows:
actual direct materials cost = actual price × actual quantity. The standard materials cost is calculated as
follows: standard direct materials cost = standard price × standard quantity. The direct materials price
variance is calculated as follows: direct materials price variance = (actual price – standard price) × actual
quantity. The direct materials quantity variance is calculated as: direct materials quantity variance = (actual
quantity – standard quantity) × standard price. These relationships are shown in Exhibit 6.
Key Terms and Definitions
• Direct Labor Rate Variance – The cost associated with the difference between the standard rate
and the actual rate paid for direct labor used in producing a commodity.
• Direct Labor Time Variance – The cost associated with the difference between the standard
hours and the actual hours of direct labor spent producing a commodity.
406 Chapter 22(7) Performance Evaluation Using Variances from Standard Costs
• Direct Materials Price Variance – The cost associated with the difference between the standard
price and the actual price of direct materials used in producing a commodity.
• Direct Materials Quantity Variance – The cost associated with the difference between the
standard quantity and the actual quantity of direct materials used in producing a commodity.
Relevant Example Exercises and Exhibits
SUGGESTED APPROACH—Direct Material
Variances are a perplexing topic for many students. As a result, you will probably need to dedicate
significant class time to this topic. For materials variances, demonstrate how each variance is calculated
and give your students the opportunity to practice these calculations using group learning activities.
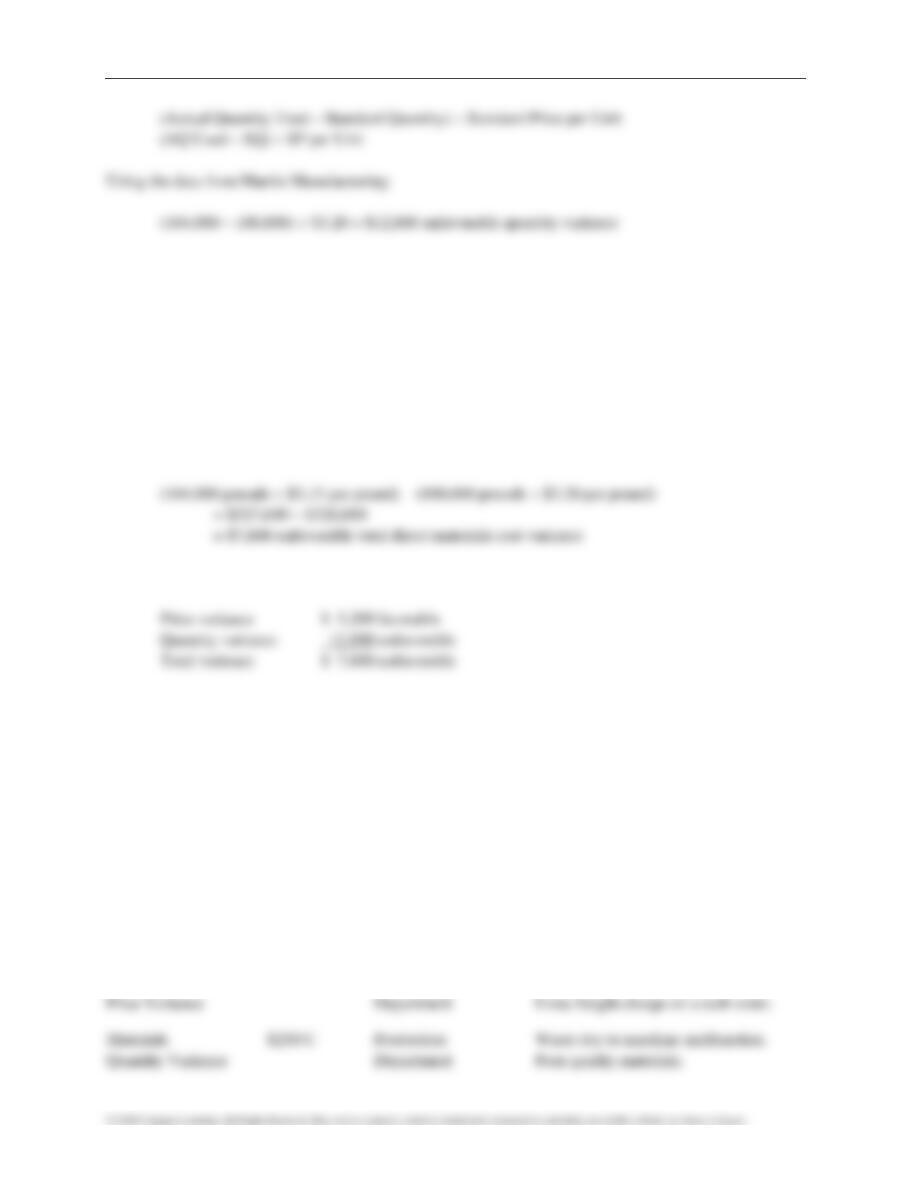
DEMONSTRATION PROBLEM—Direct Materials Variances
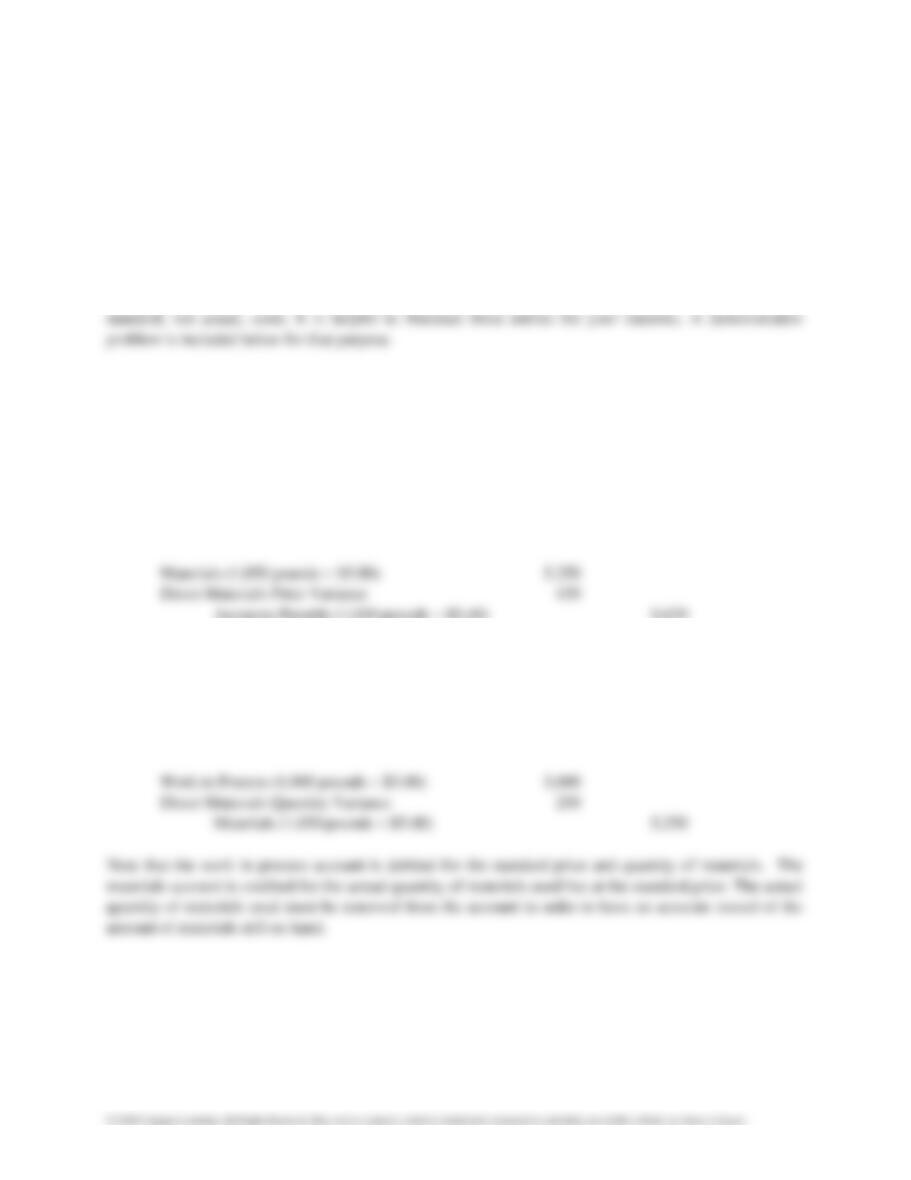
To demonstrate materials variances, use the following data for Martin Manufacturing during the month of
November.
Price Variance: Emphasize that a direct materials price variance shows the difference between the actual
and standard price for the actual quantity of materials used. The formula for this calculation is:
Using the data from Martin Manufacturing:
($3.15 – $3.20) 104,000 = $5,200 favorable price variance
This variance is favorable because the materials cost $0.05 less per pound than standard.
Chapter 22(7) Performance Evaluation Using Variances from Standard Costs 407
Note that the standard quantity is 100,000 (5 lbs. per unit 20,000 units actually produced).
This variance is unfavorable because Martin used 4,000 more pounds than standard.
Total Variance: The total materials variance is the difference between the actual and standard cost of
materials. It may be computed as follows:
(Actual Quantity Actual Price per Unit) – (Standard Quantity Standard Price per Unit)
(AQ AP per Unit) – (SQ SP per Unit)
Using the data from Martin Manufacturing:
The total variance may also be computed as follows:
GROUP LEARNING ACTIVITY—Direct Materials Variances
TM 22(7)-1 presents standard and actual cost data for direct materials used by Brass Works, Inc., a
manufacturer of brass lamps and gift products. Instruct your students to compute materials price and
quantity variances for Brass Works, Inc. The solution to this activity is on TM 22(7)-2.
CLASS DISCUSSION—Interpreting Materials Variances
As you review the solution to the group learning activity above [TM 22(7)-2], ask your students to
identify which department of Brass Works, Inc. should be held accountable for each variance. Also ask
them to brainstorm possible reasons for the variance. Some examples follow:
Amount Responsibility Possible Reason(s) for Variance
Materials $420 U Purchasing Price increase from supplier.
408 Chapter 22(7) Performance Evaluation Using Variances from Standard Costs
SUGGESTED APPROACH—Direct Labor
LECTURE AID—Direct Labor Variances
Differences between actual and standard labor costs are analyzed by computing a rate and a time
variance. The labor rate variance essentially performs the same analysis as the materials price variance. It
computes the cost difference due to a change in labor rate. The formula for the rate variance is:
(Actual Rate per Hour – Standard Rate per Hour) Actual Hours Worked
(AR per Hour – SR per Hour) AH Worked
The labor time variance computes the labor cost difference due to using more or less labor time than
standard. This variance parallels the materials quantity variance. The formula is:
(Actual Hours Worked – Standard Hours) Standard Rate per Hour
(AH Worked – SH) SR per Hour
GROUP LEARNING ACTIVITY—Direct Labor Variances
TM 22(7)-3 presents labor data for Brass Works, Inc. Ask your students to work in groups to calculate
labor rate and time variances using the above formulas. The solution is shown on TM 22(7)-4.
CLASS DISCUSSION—Interpreting Materials Variances
As you review the solution on TM 22(7)-4, ask your students to identify which department of Brass
Works, Inc. should be held accountable for each labor variance. Also ask them to brainstorm possible
reasons for the variance. Some examples follow:
Amount Responsibility Possible Reason(s) for Variance
Chapter 22(7) Performance Evaluation Using Variances from Standard Costs 409
SUGGESTED APPROACH—Nonmanufacturing Businesses
Standards can be applied to nonmanufacturing businesses, provided that they use repetitive activities to
produce a common product or service. For example, businesses that specialize in fast, no-appointment-
needed oil changes provide a standard service comprised of repetitive activities. A standard cost to
WRITING EXERCISE—Standards in a Nonmanufacturing Environment
Ask your students to answer the following in writing [TM 22(7)-8].
Describe a nonmanufacturing business that could benefit from the use of standards. Also
explain how standards would help that business control its operations.
OBJECTIVE 4
Compute and interpret factory overhead controllable and volume variances.
SYNOPSIS
The factory overhead costs are analyzed differently than materials and labor due to fixed and variable
components. Factory overhead is first separated to allow its components to be analyzed. The factory
overhead rate is figured as: factory overhead rate = budgeted factory overhead at normal capacity/normal
productive capacity. The formula to analyze the variable component is: variable factory overhead rate =
410 Chapter 22(7) Performance Evaluation Using Variances from Standard Costs
hours for 100% of normal capacity – standard hours for actual units produced) × fixed factory overhead
rate. The volume variance measures the use of fixed overhead resources. Management should determine
the causes of the unfavorable variance and consider taking corrective action. The total factory overhead
cost variance can also be determined as the sum of the variable factory overhead costs. The factory
Key Terms and Definitions
• Budgeted Variable Factory Overhead – The standard variable overhead for the actual units
produced.
• Controllable Variance – The difference between the actual amounts of variable factory overhead
cost incurred and the amount of variable factory overhead budgeted for the standard product.
Relevant Example Exercises and Exhibits
• Example Exercise 22(7)-3 Factory Overhead Controllable Variance
• Example Exercise 22(7)-4 Factory Overhead Volume Variance
SUGGESTED APPROACH
Consider spending extra time covering factory overhead variances, since students seem to have the most
difficulty with these variances. One of the major reasons for this is that, while direct materials and direct
DEMONSTRATION PROBLEM—Overhead Variances
In most cases, factory overhead costs are applied to production, using a predetermined factory overhead
rate, calculated as follows:
Chapter 22(7) Performance Evaluation Using Variances from Standard Costs 411
Factory overhead variances result when factory overhead applied to products does not equal actual
overhead. Therefore, factory overhead variances occur whenever:
1. Factory overhead costs were greater or less than estimated.
2. The company operated above or below the capacity anticipated when estimating the activity driver.
Use the following data to illustrate factory overhead variances.
Martin Manufacturing applies factory overhead to products using direct labor hours. To calculate a
predetermined overhead rate, Martin developed the following estimates for one month of production.
Martin’s labor standards allow 0.5 direct labor hours for each unit produced. During November, 20,000
units were produced. Actual fixed factory overhead costs were $120,000. Actual variable factory
overhead costs were $88,000.
Variable Factory Overhead Controllable Variance: The text defines this variance as the difference
between actual variable overhead costs and variable overhead budgeted for the amount of product actually
produced. (Note that the text is essentially presenting a two-way overhead analysis.) This can be
Fixed Factory Overhead Volume Variance: This variance measures the difference between the budgeted
fixed overhead at 100 percent of normal capacity and the standard fixed overhead for the amount of
product actually produced. In essence, it measures the impact of spreading fixed overhead over the wrong
number of units, whenever actual production does not equal the amount anticipated by the predetermined
fixed overhead rate. This can be expressed in the following formula:
412 Chapter 22(7) Performance Evaluation Using Variances from Standard Costs
Remind students that the term “Hrs. at 100% of normal capacity” is the hours used in computing the
predetermined overhead rate.
Using the data from Martin Manufacturing:
Therefore, Martin’s total overhead variance is as follows:
Controllable variance $ 18,000 unfavorable
Volume variance 20,000 unfavorable
Total overhead variance $ 38,000 unfavorable
GROUP LEARNING ACTIVITY—Overhead Variances
TM 22(7)-5 presents data for your students to use in calculating overhead variances. The solution to the
exercise is provided on TM 22(7)-6.
OBJECTIVE 5
Journalize the entries for recording standards in the accounts and prepare an income
statement that includes variances from standard.
SYNOPSIS
Standard costs may be used as a management tool to control costs separately from the accounts in the
general journal in the general ledger. However, many companies include standard costs in their accounts.
To do so, when purchasing materials, Materials would be debited at the standard price, Accounts Payable
would be credited for the actual price, and the variance would be debited or credited depending on the
difference between the prices. The variance for quantity would be journalized in a similar manner. Work
in Process would be debited, Direct Materials Quantity Variance would be either debited or credited
Chapter 22(7) Performance Evaluation Using Variances from Standard Costs 413
Relevant Example Exercises and Exhibits
• Example Exercise 22(7)-5 Standard Cost Journal Entries
• Example Exercise 22(7)-6 Income Statement with Variances
• Exhibit 12 – Variance from Standards in Income Statement
SUGGESTED APPROACH
Some companies choose to integrate standards and variances into their accounting records. When this
occurs, entries to the materials, work in process, and finished goods inventory accounts are recorded at
DEMONSTRATION PROBLEM—Journal Entries at Standard
The group learning activities under Objectives 3 and 4 asked your students to compute materials and labor
variances. Use these calculations to illustrate the following journal entries.
Purchase of Materials: Brass Works used 1,050 pounds of direct materials that cost $5.40 per pound. The
effect of paying $0.40 more per pound than standard was a $420 unfavorable price variance. The purchase
of these materials would be recorded as follows:
Accounts Payable (1,050 pounds $5.40) 5,670
Note that the Materials account is debited for the standard cost of materials purchased.
Requisition of Materials: Brass Works used 1,050 pounds of direct materials for production when the
standard materials quantity was only 1,000 pounds. The effect of using more materials than standard is
recorded when the materials are transferred to Work in Process.
414 Chapter 22(7) Performance Evaluation Using Variances from Standard Costs
Payment of Direct Labor Costs: Brass Works incurred 2,380 direct labor hours at a cost of $9 per hour.
The standard was 2,000 hours at $10 per hour. The payroll entry to record direct labor wages is:
Work in Process (2,000 hours $10) 20,000
Direct Labor Time Variance 3,800
Direct Labor Rate Variance 2,380
Wages Payable 21,420
LECTURE AID—Reporting Variances on the Income Statement
Variances are not usually reported on financial statements prepared for stockholders, creditors, or other
parties outside company management. However, they may be included on income statements prepared for
management use. Exhibit 9 in the text provides an example of an income statement that reports variances.
The key to this exhibit is understanding how the variances affect gross profit. Use the chart on TM 22(7)-
7 to explain the impact of favorable and unfavorable variances on gross profit.
OBJECTIVE 6
Describe and provide examples of nonfinancial performance measures.
SYNOPSIS
Key Terms and Definitions
• Nonfinancial Performance Measure – A performance measure expressed in units rather than
dollars.
• Process – A sequence of activities linked together for performing a particular task.
Chapter 22(7) Performance Evaluation Using Variances from Standard Costs 415
Relevant Example Exercises and Exhibits
• Example Exercise 22(7)-7 Activity Inputs and Outputs
• Exhibit 13 – Nonfinancial Performance Measures
• Exhibit 14 – Relationship Between a Process and Its Inputs and Outputs
• Exhibit 15 – Inputs/Outputs for a Fast-Food Restaurant
SUGGESTED APPROACH
Measurements encourage improving the actions that are being measured. This is true both in the business
world and in the classroom. Use the writing exercise below to stimulate your students to think about the
benefits and difficulties of nonfinancial performance measures.
WRITING EXERCISE—Nonfinancial Performance Measures
Ask your students to write their opinion on the following questions [TM 22(7)-9]:
CLASS DISCUSSION—Nonfinancial Performance Measures
Ask your students to share examples of any nonfinancial measures used by their employers to evaluate
their work. Question your students on why these measures are used. In other words, what behavior is the
employer trying to encourage with these nonfinancial measures?
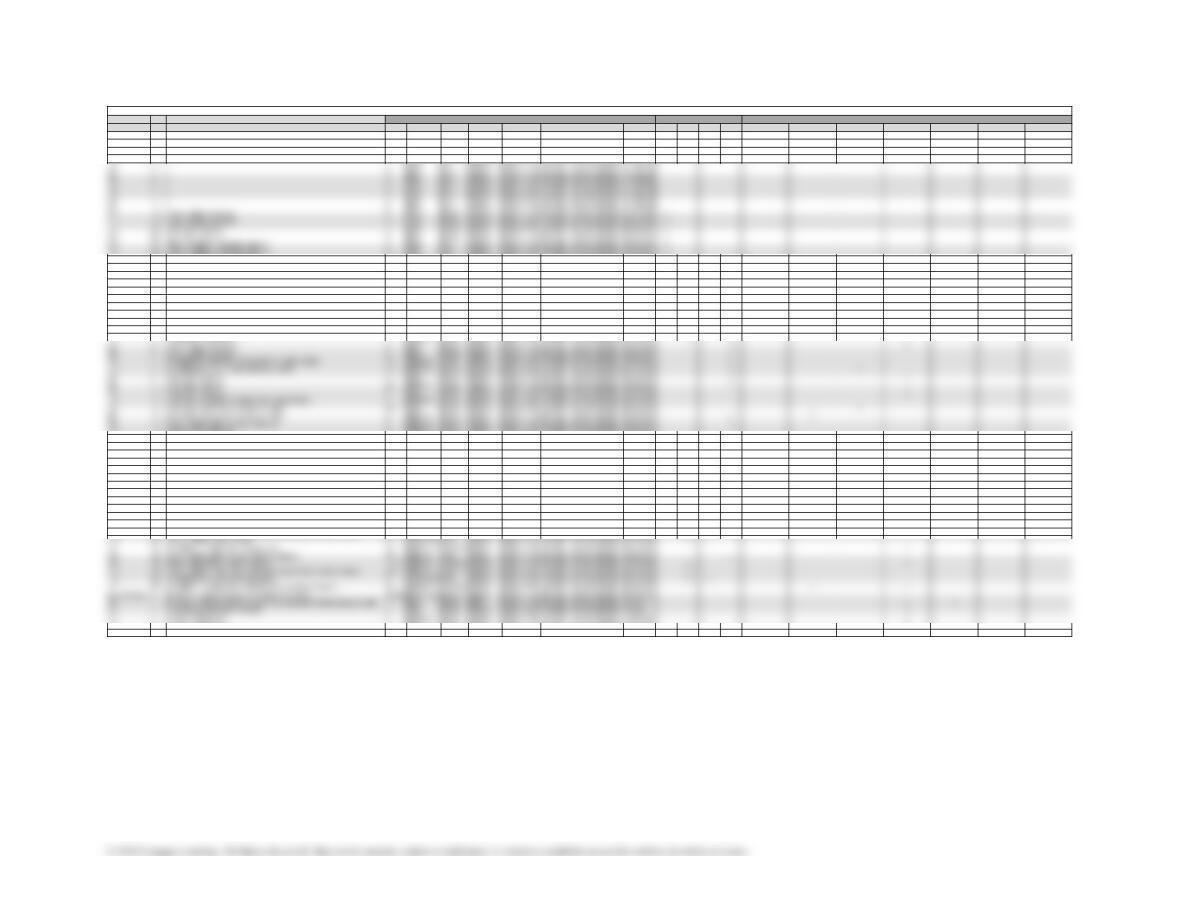
Type Item Description LO(s) Difficulty Time Est BUSPROG AICPA ACBSP – APC Bloom‘s EE Excel GL SMH FAI Service Real World Writing Ethics Internet Group
DQ 1 1 Easy 5 min. Analytic Measurement Budgeting and Responsibility Knowledge
DQ 2 1 Easy 5 min. Analytic Measurement Budgeting and Responsibility Knowledge
DQ 3 3 Easy 5 min. Analytic Measurement Budgeting and Responsibility Knowledge
DQ 4 2 Easy 5 min. Analytic Measurement Budgeting and Responsibility Knowledge
DQ 5 3 Easy 5 min. Analytic Measurement Budgeting and Responsibility Knowledge
DQ 6 3 Easy 5 min. Analytic Measurement Budgeting and Responsibility Knowledge
DQ 8 4 Easy 5 min. Analytic Measurement Budgeting and Responsibility Knowledge
DQ 9 5 Easy 5 min. Analytic Measurement Budgeting and Responsibility Knowledge
DQ 10 6 Easy 5 min. Analytic Measurement Budgeting and Responsibility Knowledge
PE 1A Direct materials variances 3 Easy 10 min. Analytic Measurement Budgeting and Responsibility Application x
PE 1B Direct materials variances 3 Easy 10 min. Analytic Measurement Budgeting and Responsibility Application x
PE 2A Direct labor variances 3 Easy 10 min. Analytic Measurement Budgeting and Responsibility Application x
PE 2B Direct labor variances 3 Easy 10 min. Analytic Measurement Budgeting and Responsibility Application x
PE 3A Factory overhead controllable variance 4 Easy 5 min. Analytic Measurement Budgeting and Responsibility Application x
PE 3B Factory overhead controllable variance 4 Easy 5 min. Analytic Measurement Budgeting and Responsibility Application x
PE 4A Factory overhead volume variance 4 Easy 5 min. Analytic Measurement Budgeting and Responsibility Application x
PE 4B Factory overhead volume variance 4 Easy 5 min. Analytic Measurement Budgeting and Responsibility Application x
PE 5A Standard cost journal entries 5 Easy 5 min. Analytic Measurement Budgeting and Responsibility Application x
PE 5B Standard cost journal entries 5 Easy 5 min. Analytic Measurement Budgeting and Responsibility Application x
PE 6A Income statement with variances 5 Easy 15 min. Analytic Measurement Budgeting and Responsibility Application x
PE 6B Income statement with variances 5 Easy 15 min. Analytic Measurement Budgeting and Responsibility Application x
PE 7A Activity inputs and outputs 6 Easy 5 min. Analytic Measurement Budgeting and Responsibility Knowledge x
PE 7B Activity inputs and outputs 6 Easy 5 min. Analytic Measurement Budgeting and Responsibility Knowledge x
EX 1 Standard direct materials cost per unit 2 Easy 10 min. Analytic Measurement Budgeting and Responsibility Application x
EX 2 Standard product cost 2 Easy 10 min. Analytic Measurement Budgeting and Responsibility Application x x
EX 3 Budget performance report 2 Moderate 20 min. Analytic Measurement Budgeting and Responsibility Application x x x
EX 4 Direct materials variances 3 Easy 10 min. Analytic Measurement Budgeting and Responsibility Application x x
EX 5 Direct materials variances 3 Easy 10 min. Analytic Measurement Budgeting and Responsibility Application x
EX 6 Standard direct materials cost per unit from variance data 2,3 Moderate 15 min. Analytic Measurement Budgeting and Responsibility Application x
EX 7 Standard product cost, direct materials variance 2,3 Moderate 15 min. Analytic Measurement Budgeting and Responsibility Application x x
EX 8 Direct labor variances 3 Easy 10 min. Analytic Measurement Budgeting and Responsibility Application x x
EX 9 Direct labor variances 3,5 Moderate 15 min. Analytic Measurement Budgeting and Responsibility Application x
EX 10 Direct labor variances 3 Easy 10 min. Analytic Measurement Budgeting and Responsibility Application x
EX 11 Direct labor standards for nonmanufacturing expenses 3 Moderate 15 min. Analytic Measurement Budgeting and Responsibility Application
EX 12 Direct labor variances for a service company 2,3 Easy 15 min. Analytic Measurement Budgeting and Responsibility Application x x
EX 13 Direct labor variances for a service company 3 Moderate 15 min. Analytic Measurement Budgeting and Responsibility Application x x
EX 14 Direct materials and direct labor variances 3 Moderate 15 min. Analytic Measurement Budgeting and Responsibility Application x
EX 15 Flexible overhead budget 4 Moderate 30 min. Analytic Measurement Budgeting and Responsibility Application
EX 16 Flexible overhead budget 4 Moderate 30 min. Analytic Measurement Budgeting and Responsibility Application
EX 17 Factory overhead cost variances 4 Moderate 20 min. Analytic Measurement Budgeting and Responsibility Application
EX 18 Factory overhead cost variances 4 Easy 15 min. Analytic Measurement Budgeting and Responsibility Application x
EX 19 Factory overhead variance corrections 4 Moderate 20 min. Analytic Measurement Budgeting and Responsibility Application
EX 20 Factory overhead cost variance report 4 Moderate 30 min. Analytic Measurement Budgeting and Responsibility Application x
EX 21 Recording standards in accounts 5 Easy 10 min. Analytic Measurement Budgeting and Responsibility Application
EX 22 Recording standards in accounts 5 Easy 10 min. Analytic Measurement Budgeting and Responsibility Application
EX 23 Income statement indicating standard cost variances 5 Moderate 20 min. Analytic Measurement Budgeting and Responsibility Application
EX 24 Nonfinancial performance measures 6 Easy 10 min. Analytic Measurement Budgeting and Responsibility Knowledge x
EX 25 Nonfinancial performance measures 6 Easy 10 min. Analytic Measurement Budgeting and Responsibility Knowledge x
PR 1A Direct materials and direct labor variance analysis 2,3 Moderate 1 hour Analytic Measurement Budgeting and Responsibility Application x
PR 2A Flexible budgeting and variance analysis 1,2,3 Moderate 1.5 hours Analytic Measurement Budgeting and Responsibility Application x x
PR 3A Direct materials, direct labor, and factory overhead cost variance analysis 3,4 Moderate 1 hour Analytic Measurement Budgeting and Responsibility Application x
PR 4A Factory overhead variance report 4 Challenging 1 hour Analytic Measurement Budgeting and Responsibility Application x x
PR 5A Standards for nonmanufacturing expenses 3,6 Moderate 1.5 hours Analytic Measurement Budgeting and Responsibility Application x
PR 2B Flexible budgeting and variance analysis 1,2,3 Moderate 1.5 hours Analytic Measurement Budgeting and Responsibility Application x x
PR 3B Direct materials, direct labor, and factory overhead cost variance analysis 3,4 Moderate 1 hour Analytic Measurement Budgeting and Responsibility Application x
PR 4B Standard factory overhead variance report 4 Challenging 1 hour Analytic Measurement Budgeting and Responsibility Application x x
PR 5B Standards for nonmanufacturing expenses for a service company 3,6 Moderate 1.5 hours Analytic Measurement Budgeting and Responsibility Application x x
CP 4 Variance interpretation 4 Moderate 20 min. Analytic Measurement Budgeting and Responsibility Evaluation x
CP 5 Nonmanufacturing performance measures – government 6 Moderate 1 hour Analytic Measurement Budgeting and Responsibility Application x x
HOMEWORK CHART WITH LEARNING OUTCOMES TAGGING
TAGGING
RESOURCES
FOCUS