CHAPTER 22 Budgeting
Ex. 22-19
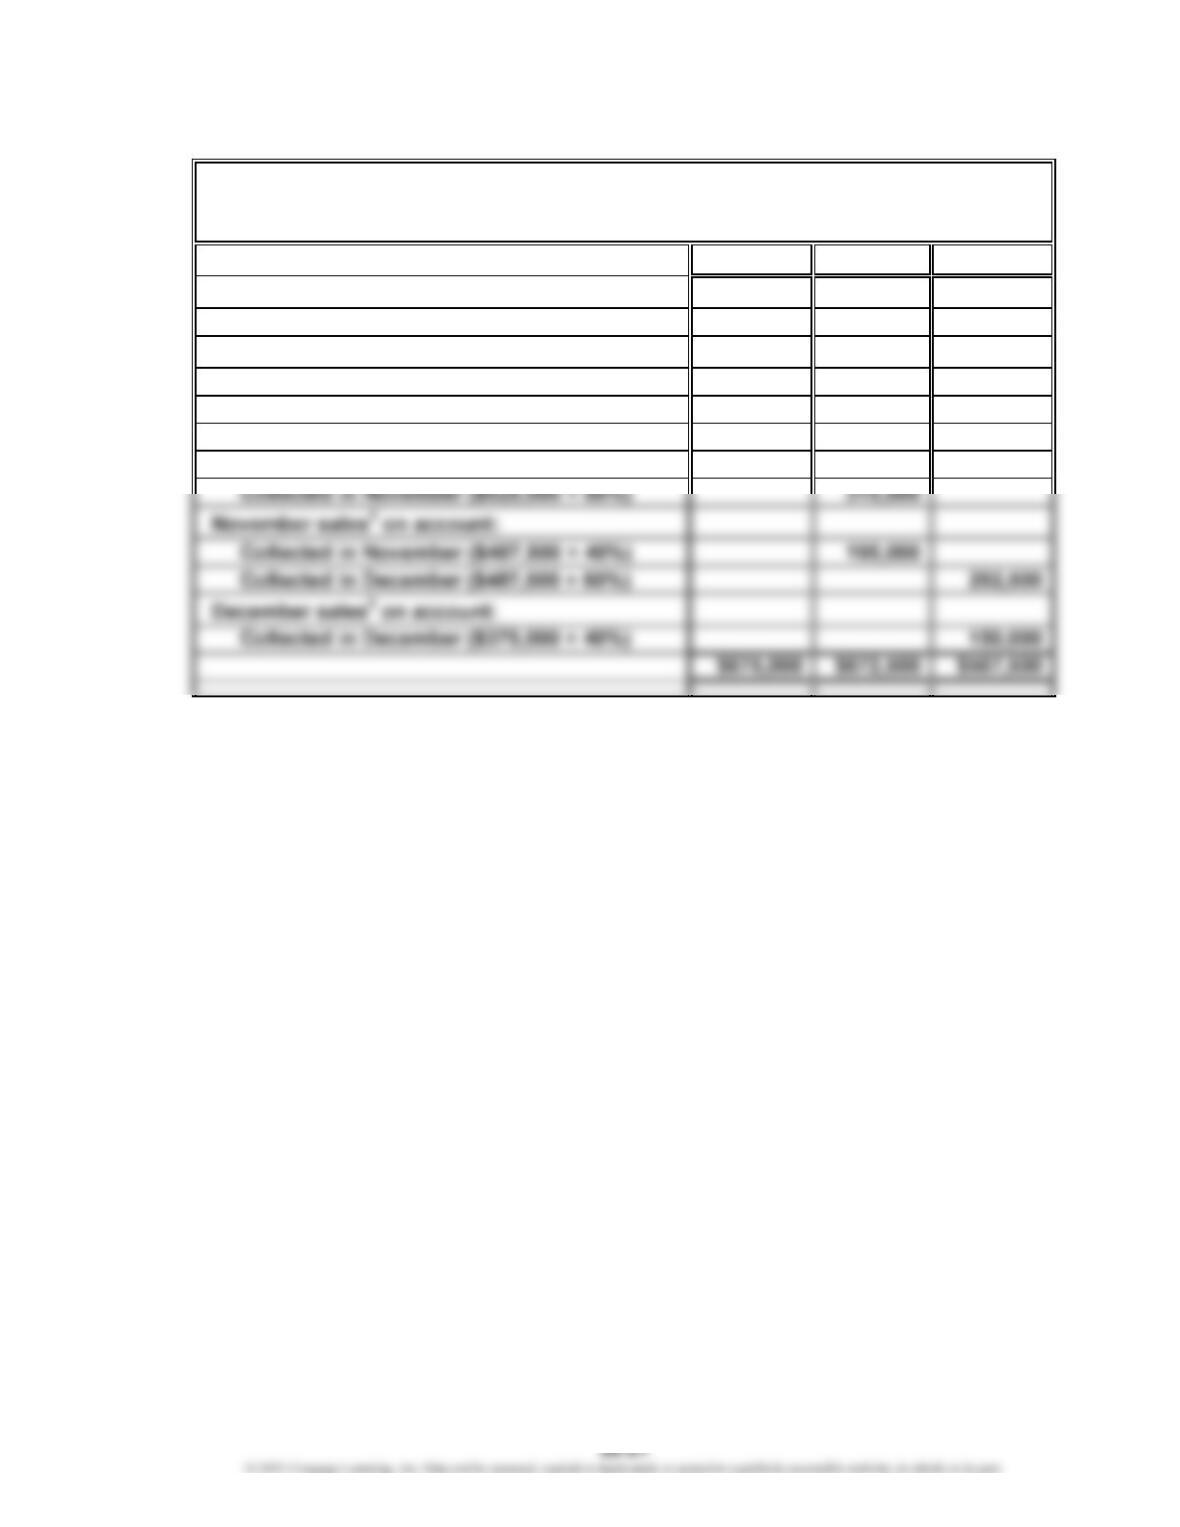
October November December
Receipts from cash sales:
Cash sales (25% × current month’s sales) $175,000 $162,500 $125,000
September sales on account:
Collected in October (Accounts Receivable
balance) 290,000
October sales
1
on account:
Collected in October ($525,000 × 40%) 210,000
1
$700,000 × 75% = $525,000
2
$650,000 × 75% = $487,500
3
$500,000 × 75% = $375,000
Office World Inc.
Schedule of Collections from Sales
For the Three Months Ending December 31
CHAPTER 22 Budgeting
Ex. 22-20
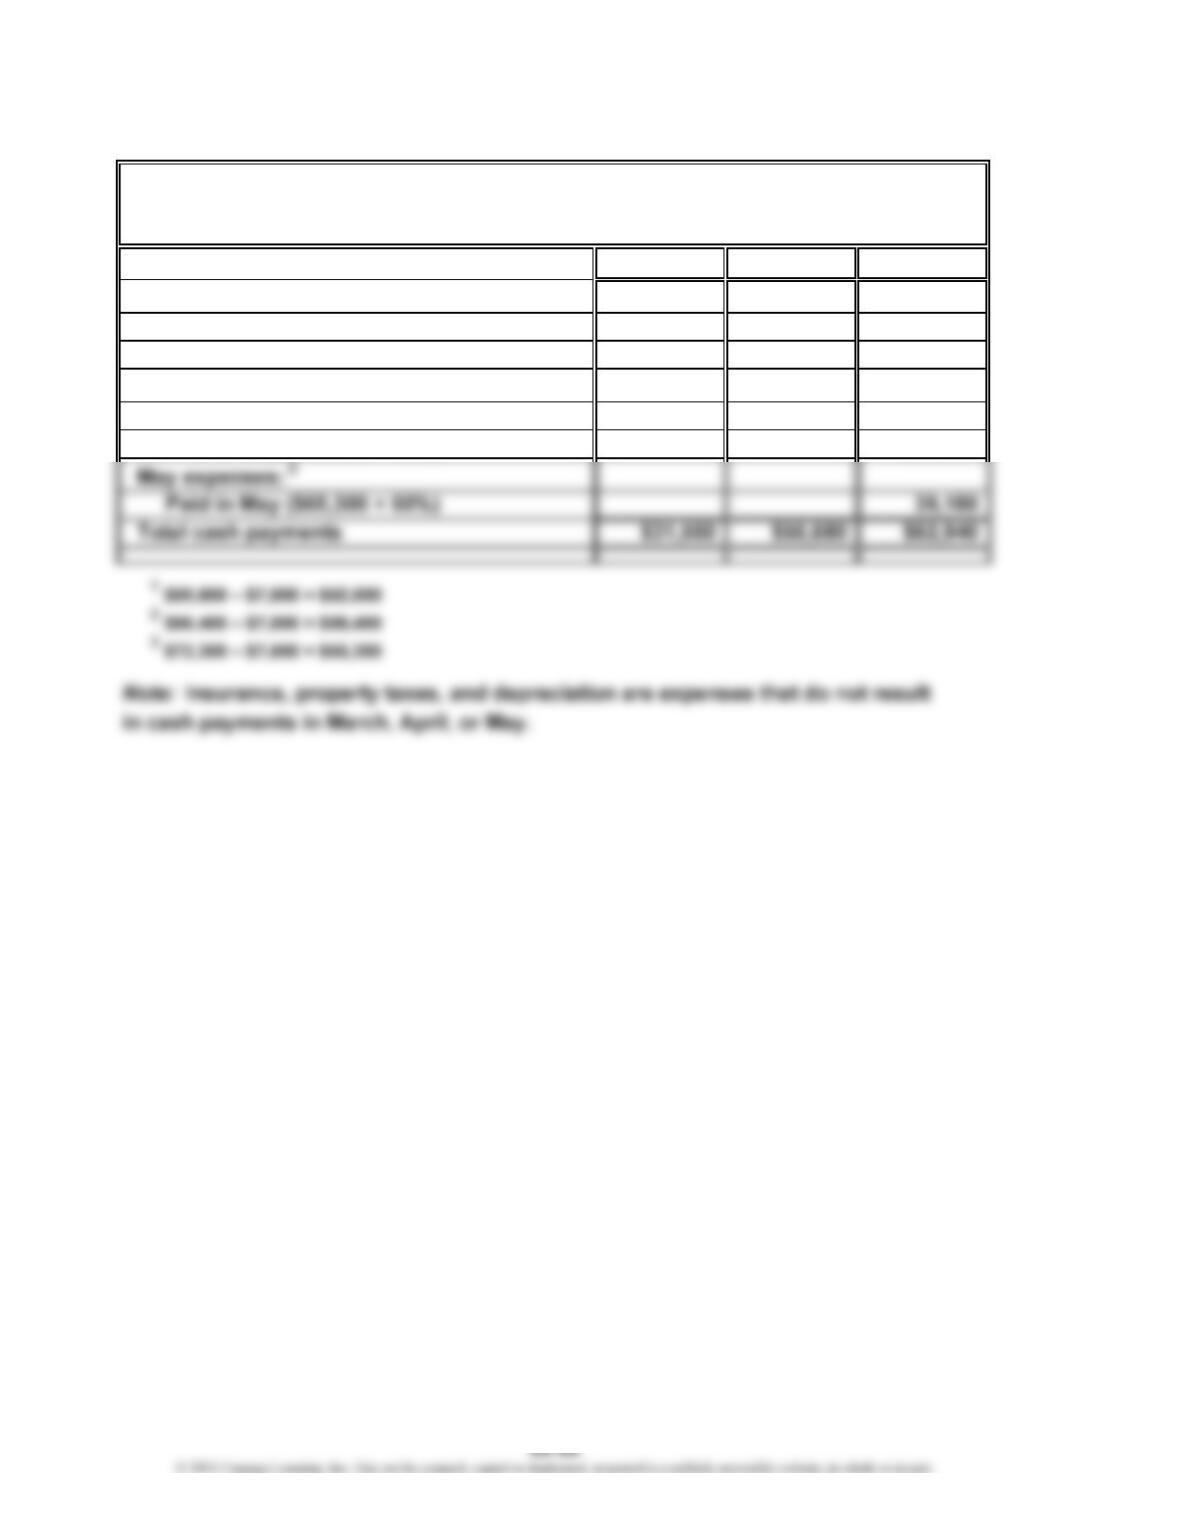
March April May
March expenses:
1
Paid in March ($52,600 × 60%) $31,560
Paid in April ($52,600 × 40%) $21,040
April expenses:
2
Paid in April ($59,400 × 60%) 35,640
Paid in May ($59,400 × 40%) $23,760
Oakwood Financial Inc.
Schedule of Cash Payments for Selling and Administrative Expenses
For the Three Months Ending May 31
CHAPTER 22 Budgeting
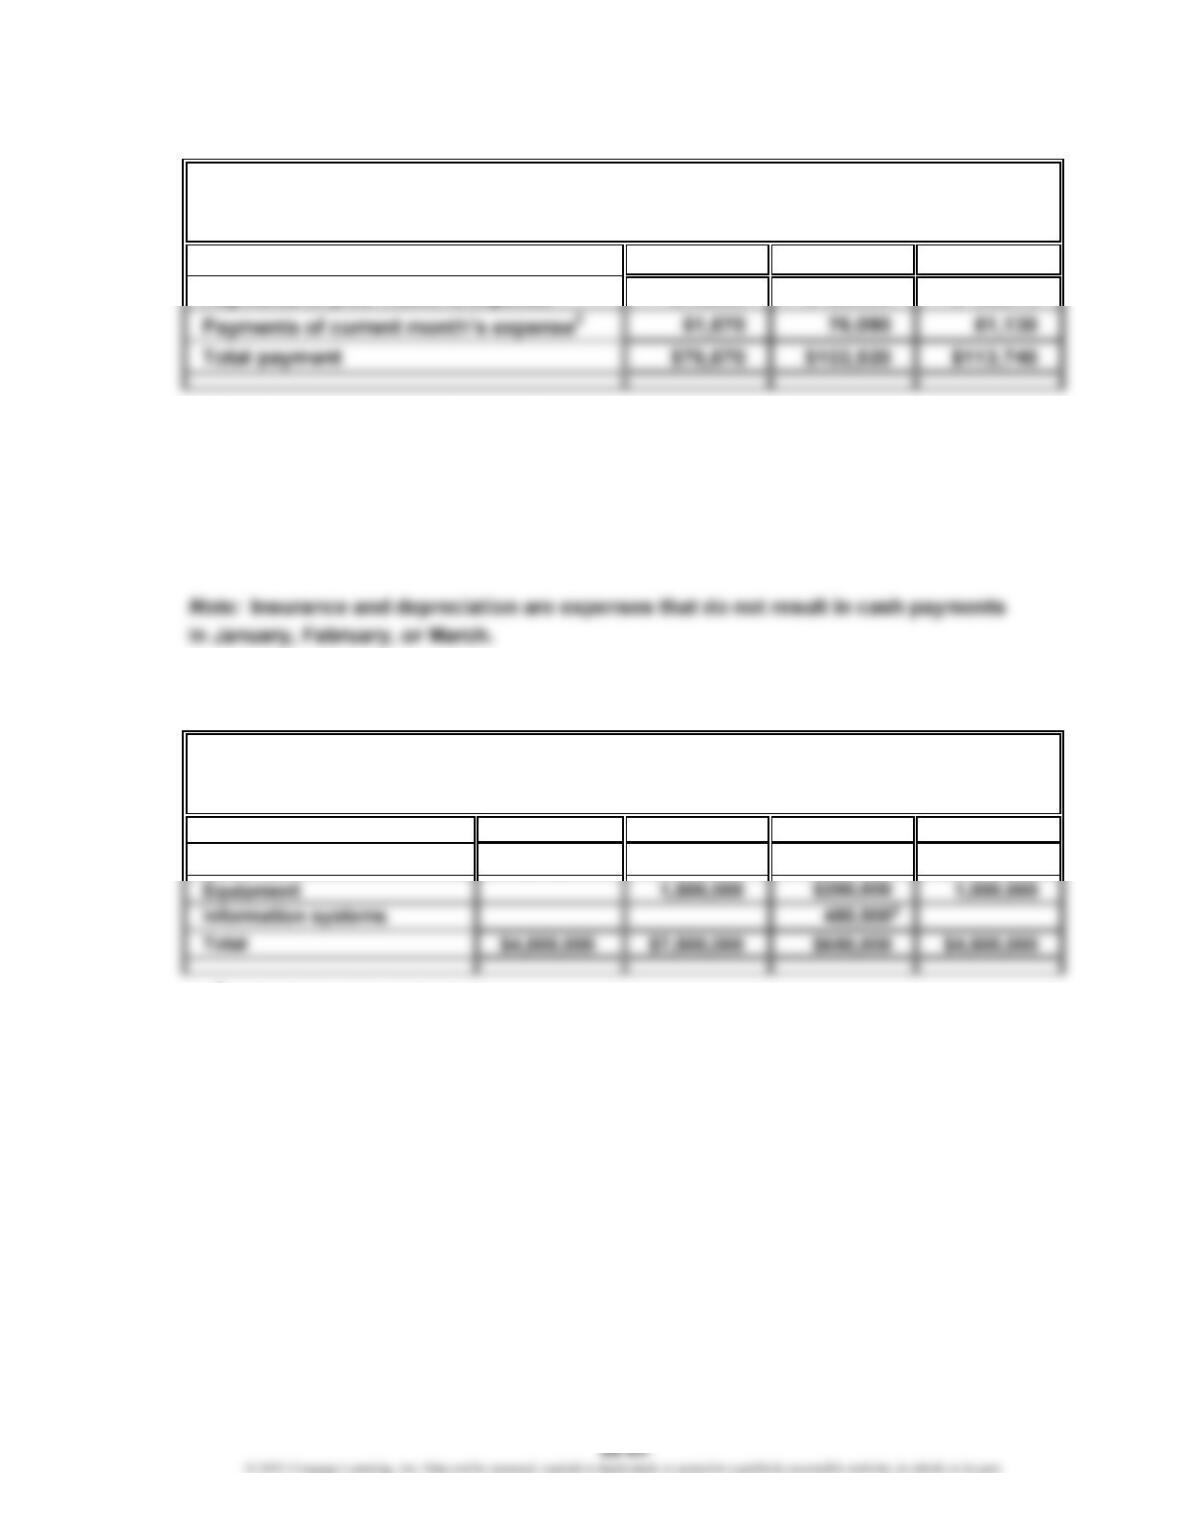
Ex. 22-21
January February March
1
$15,000 $ 26,430 $ 32,610
1
$15,000, given as Accrued Expenses Payable, January 1
$26,430 = ($91,600 – $3,000 – $500) × 30%
$32,610 = ($112,200 – $3,000 – $500) × 30%
2
$61,670 = ($91,600 – $3,000 – $500) × 70%
$76,090 = ($112,200 – $3,000 – $500) × 70%
$81,130 = ($119,400 – $3,000 – $500) × 70%
Ex. 22-22
20Y2 20Y3 20Y4 20Y5
Building $4,000,000 $6,000,000 $3,500,000
1
$10,000,000 × 35% = $3,500,000
2
$800,000 × 75% × 75% = $450,000
Capital Expenditures Budget
For the Four Years Ending December 31, 20Y2−20Y5
EastGate Physical Therapy Inc.
Schedule of Cash Payments for Operations
For the Three Months Ending March 31
Omicron Inc.
1
CHAPTER 22 Budgeting
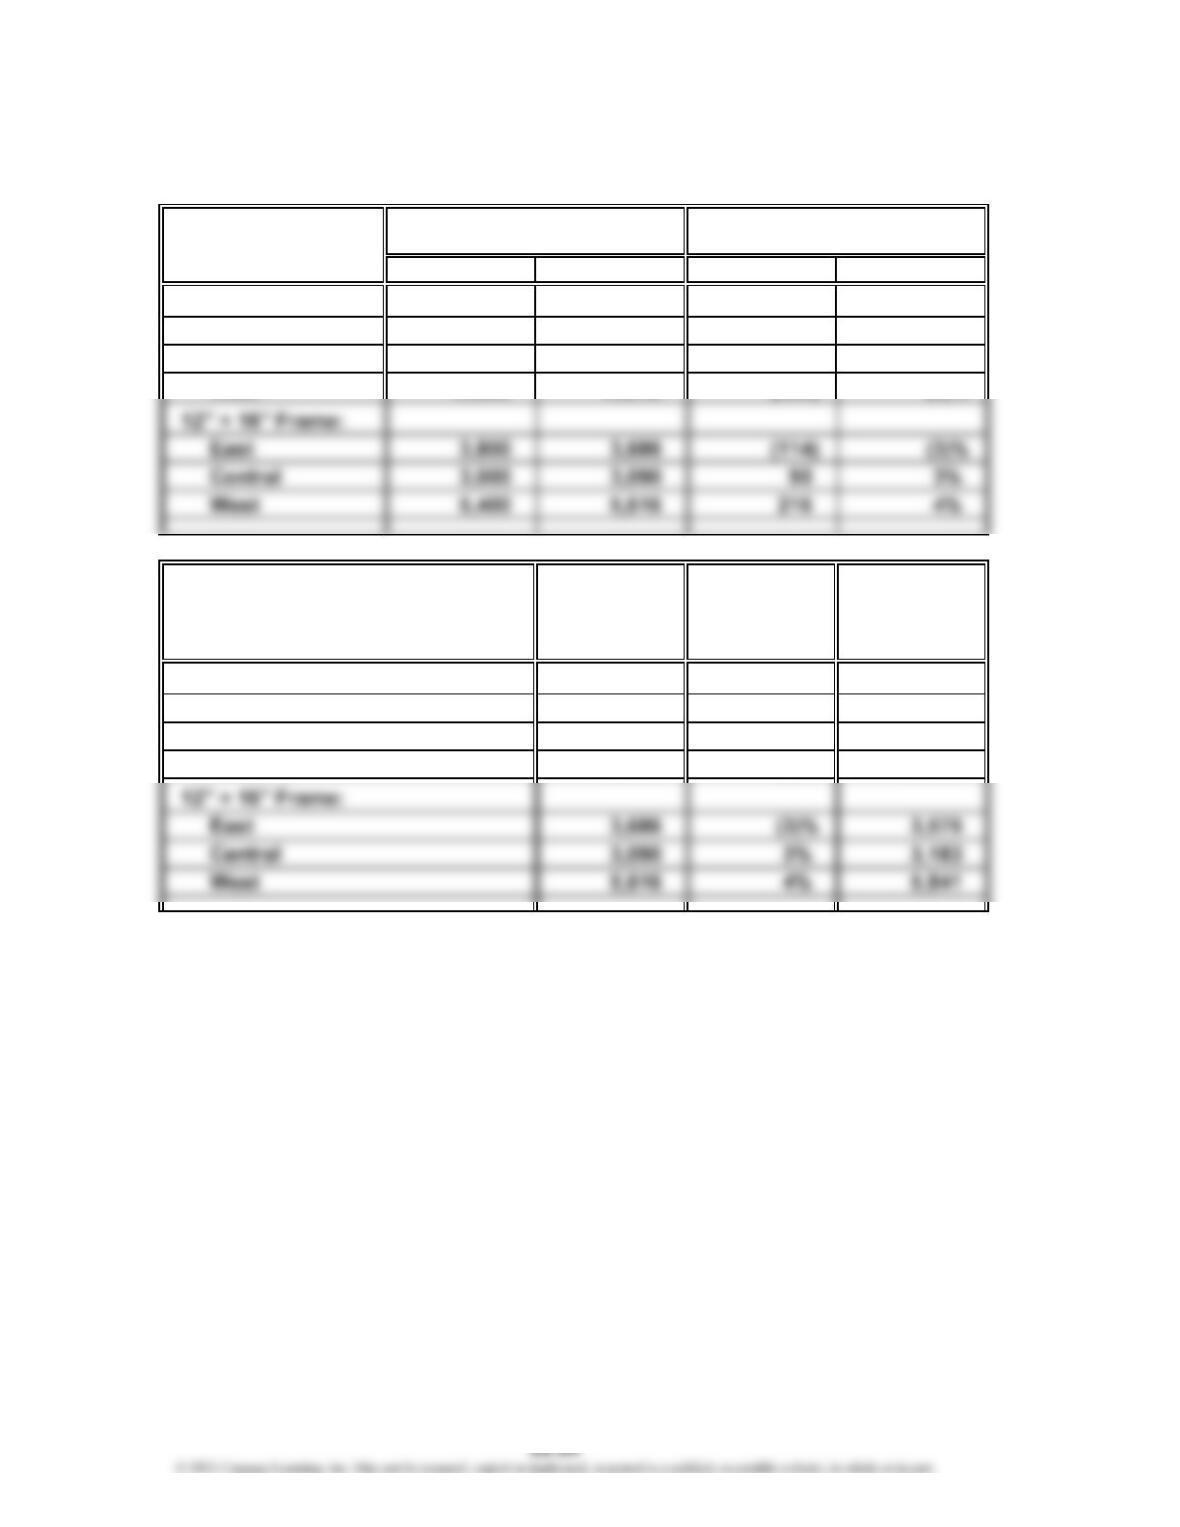
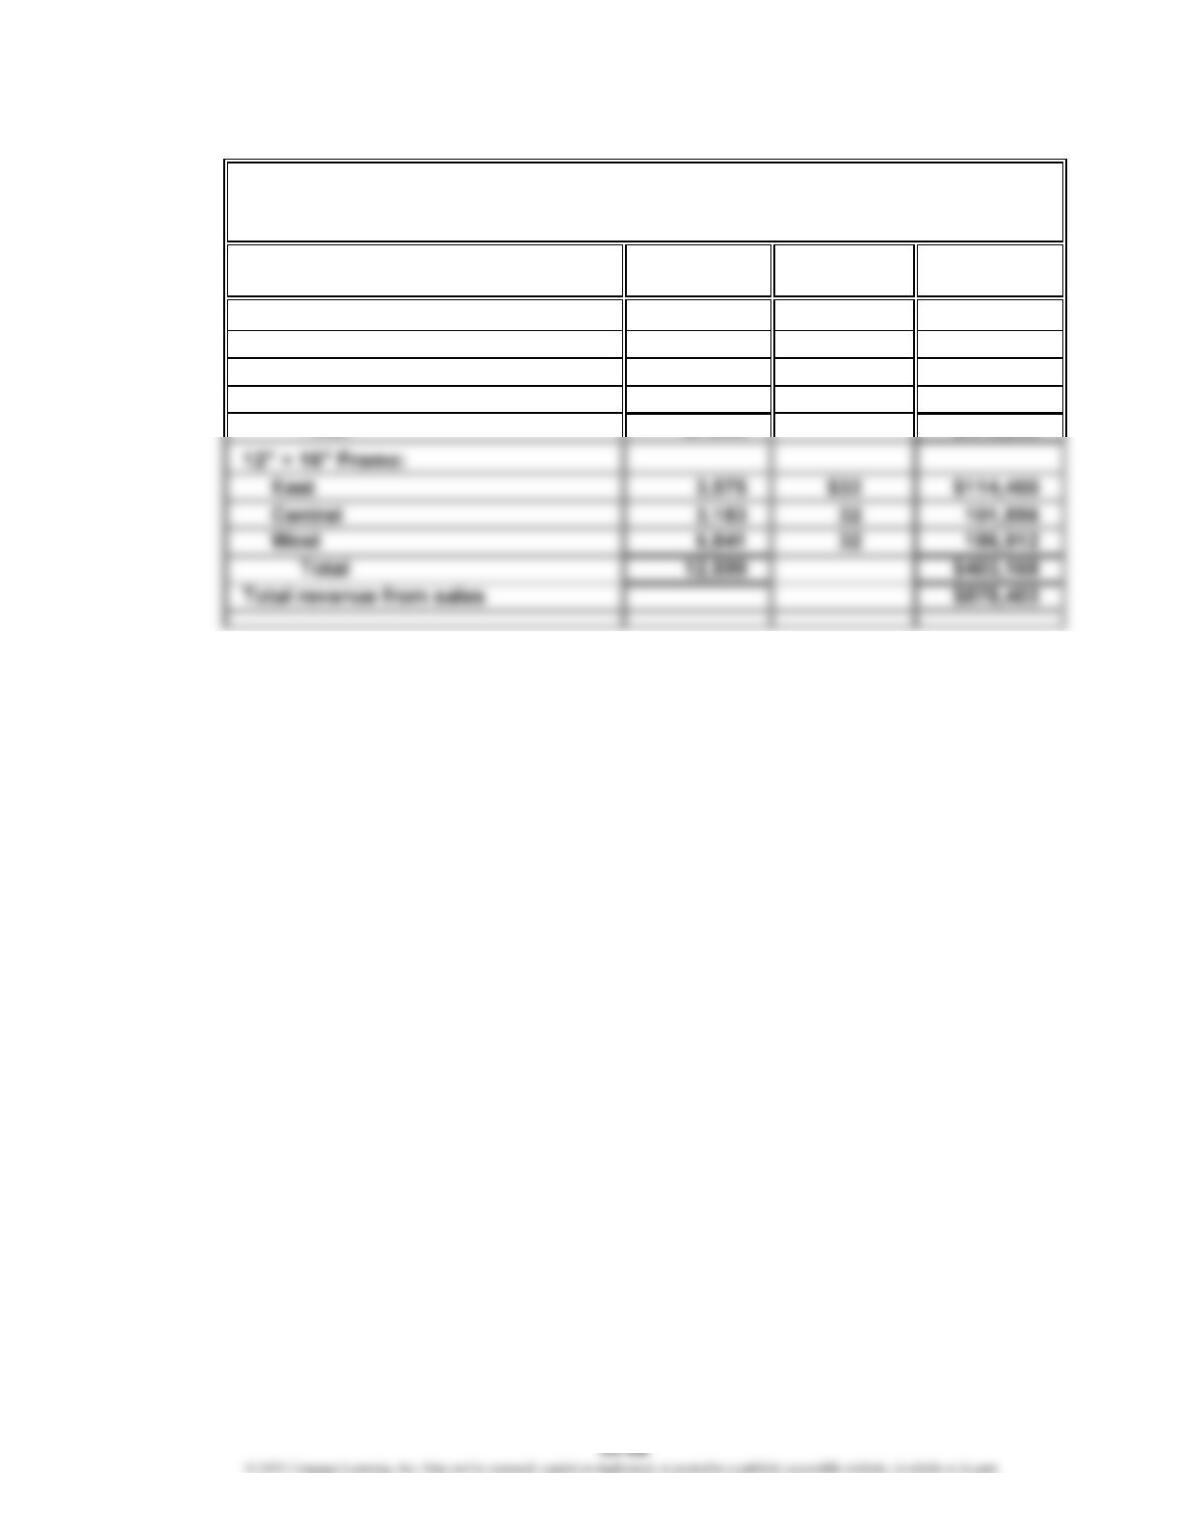
Prob. 22-1A
1.
Budget Actual Sales Amount Percent
8″ × 10″ Frame:
East 8,500 8,755 255 3%
Central 6,200 6,510 310 5%
2. 20Y7
20Y6 Percentage Budgeted
Actual Increase Units
Units (Decrease) (rounded)
8″ × 10″ Frame:
East 8,755 3% 9,018
Central 6,510 5% 6,836
West 12,348 (2)% 12,101
PROBLEMS
Increase (Decrease)
Actual Over BudgetUnit Sales, Year Ended 20Y6
CHAPTER 22 Budgeting
Prob. 22-1A (Concluded)
3.
Unit Sales Unit Selling
Volume Price Total Sales
8″ × 10″ Frame:
East 9,018 $17 $153,306
Central 6,836 17 116,212
West 12,101 17 205,717
Product and Area
Raphael Frame Company
For the Year Ending December 31, 20Y7
Sales Budget
CHAPTER 22 Budgeting
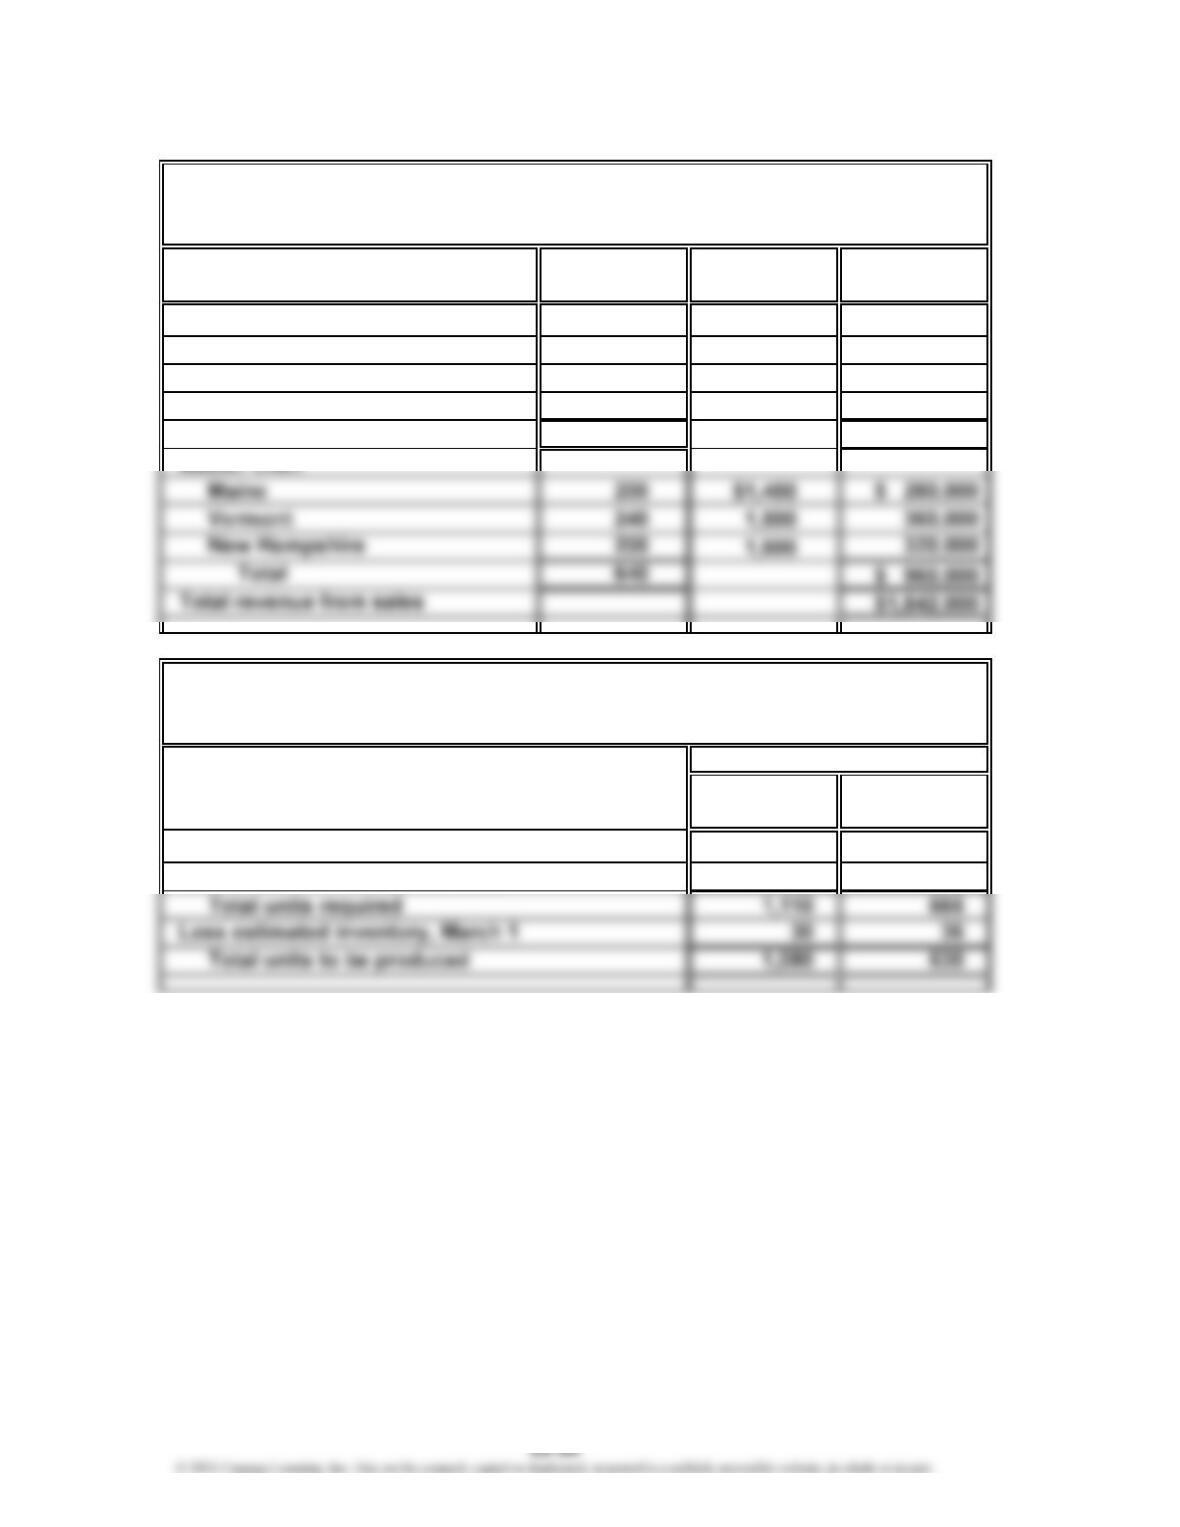
Prob. 22-2A
1.
Unit Sales Unit Selling
Volume Price Total Sales
Backyard Chef:
Maine 350 $ 800 $ 280,000
Vermont 400 825 330,000
New Hampshire 320 850 272,000
Total 1,070 $ 882,000
2.
Backyard Master
Chef Chef
Expected units to be sold 1,070 640
Plus desired inventory, March 31 40 26
For the Month Ending March 31
Units
Product and Area
Gourmet Grill Company
Sales Budget
For the Month Ending March 31
Gourmet Grill Company
Production Budget
CHAPTER 22 Budgeting
Prob. 22-2A (Continued)
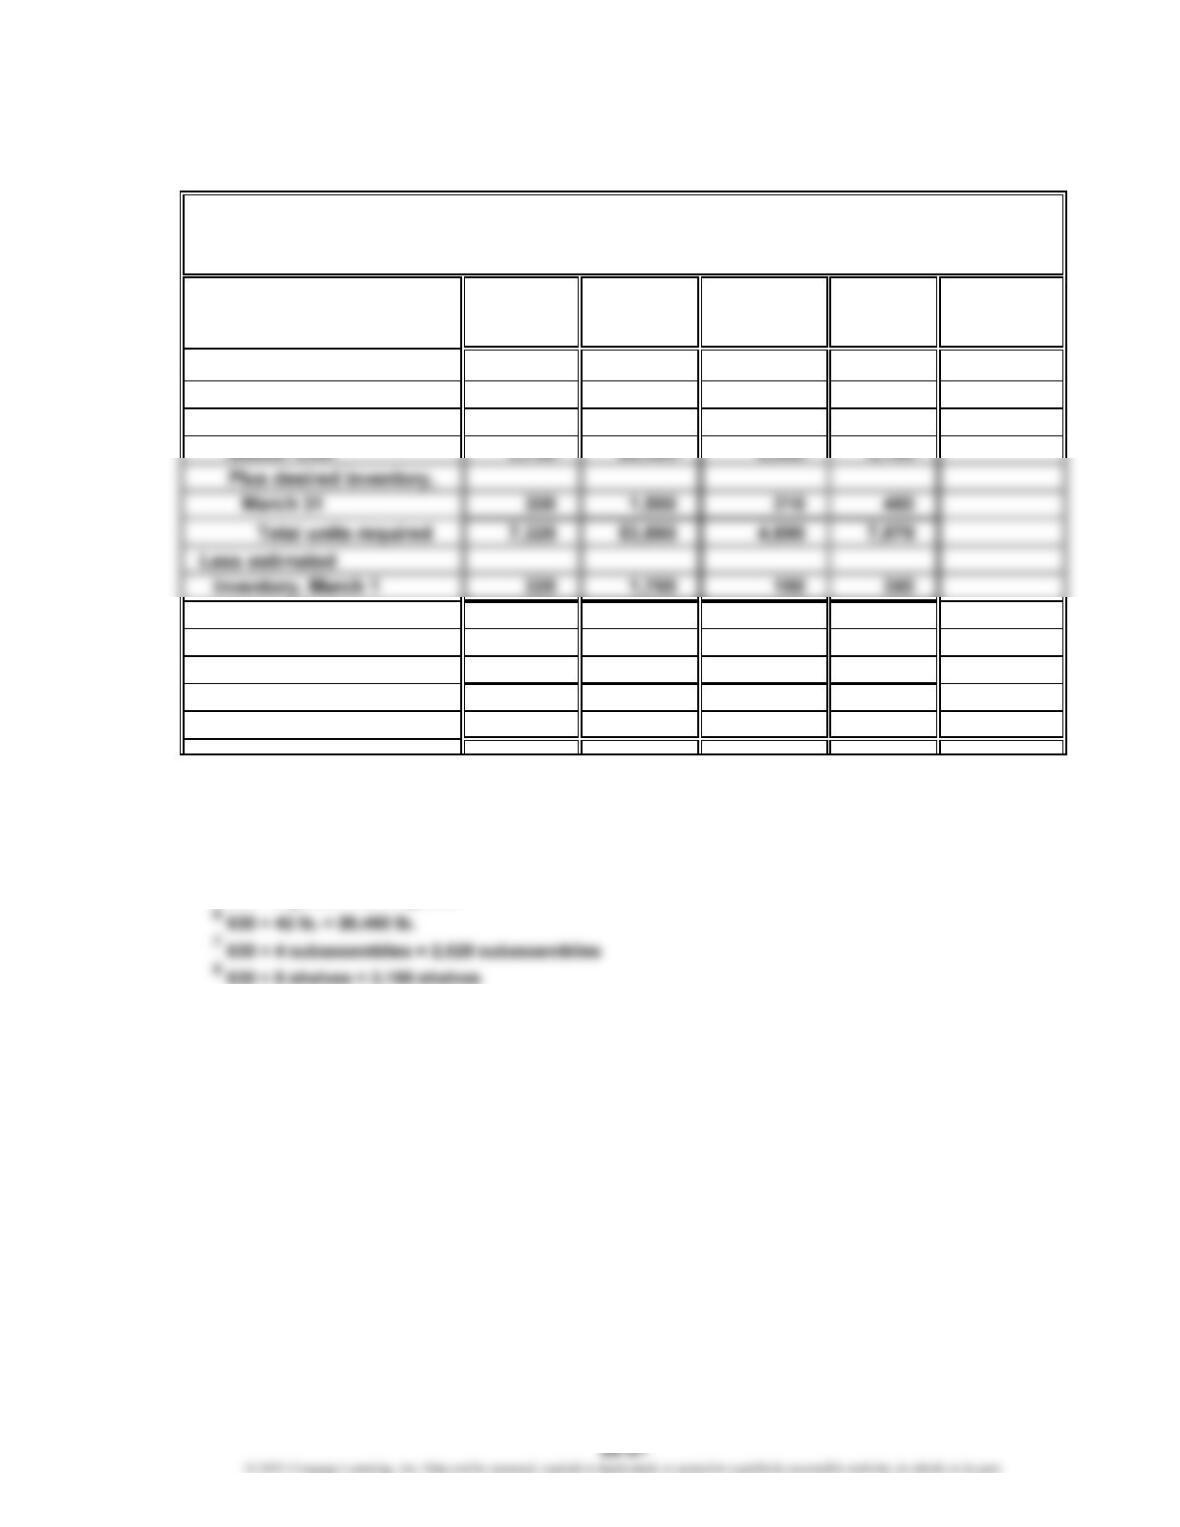
3.
Stainless Burner
Grates Steel Subassemblies Shelves
(units) (lb.) (units) (units) Total
Required units for
production:
Backyard Chef 3,240 25,920 2,160 4,320
Total units to be
purchased 7,000 52,180 4,700 7,520
Unit price $16.00 $8.00 $120.00 $12.00
Total direct materials
to be purchased $112,000 $417,440 $564,000 $90,240 $1,183,680
1
1,080 × 3 grates = 3,240 grates
2
1,080 × 24 lb. = 25,920 lb.
3
1,080 × 2 subassemblies = 2,160 subassemblies
4
1,080 × 4 shelves = 4,320 shelves
5
630 × 6 grates = 3,780 grates
Gourmet Grill Company
Direct Materials Purchases Budget
For the Month Ending March 31
××××
12 34
56 78
CHAPTER 22 Budgeting
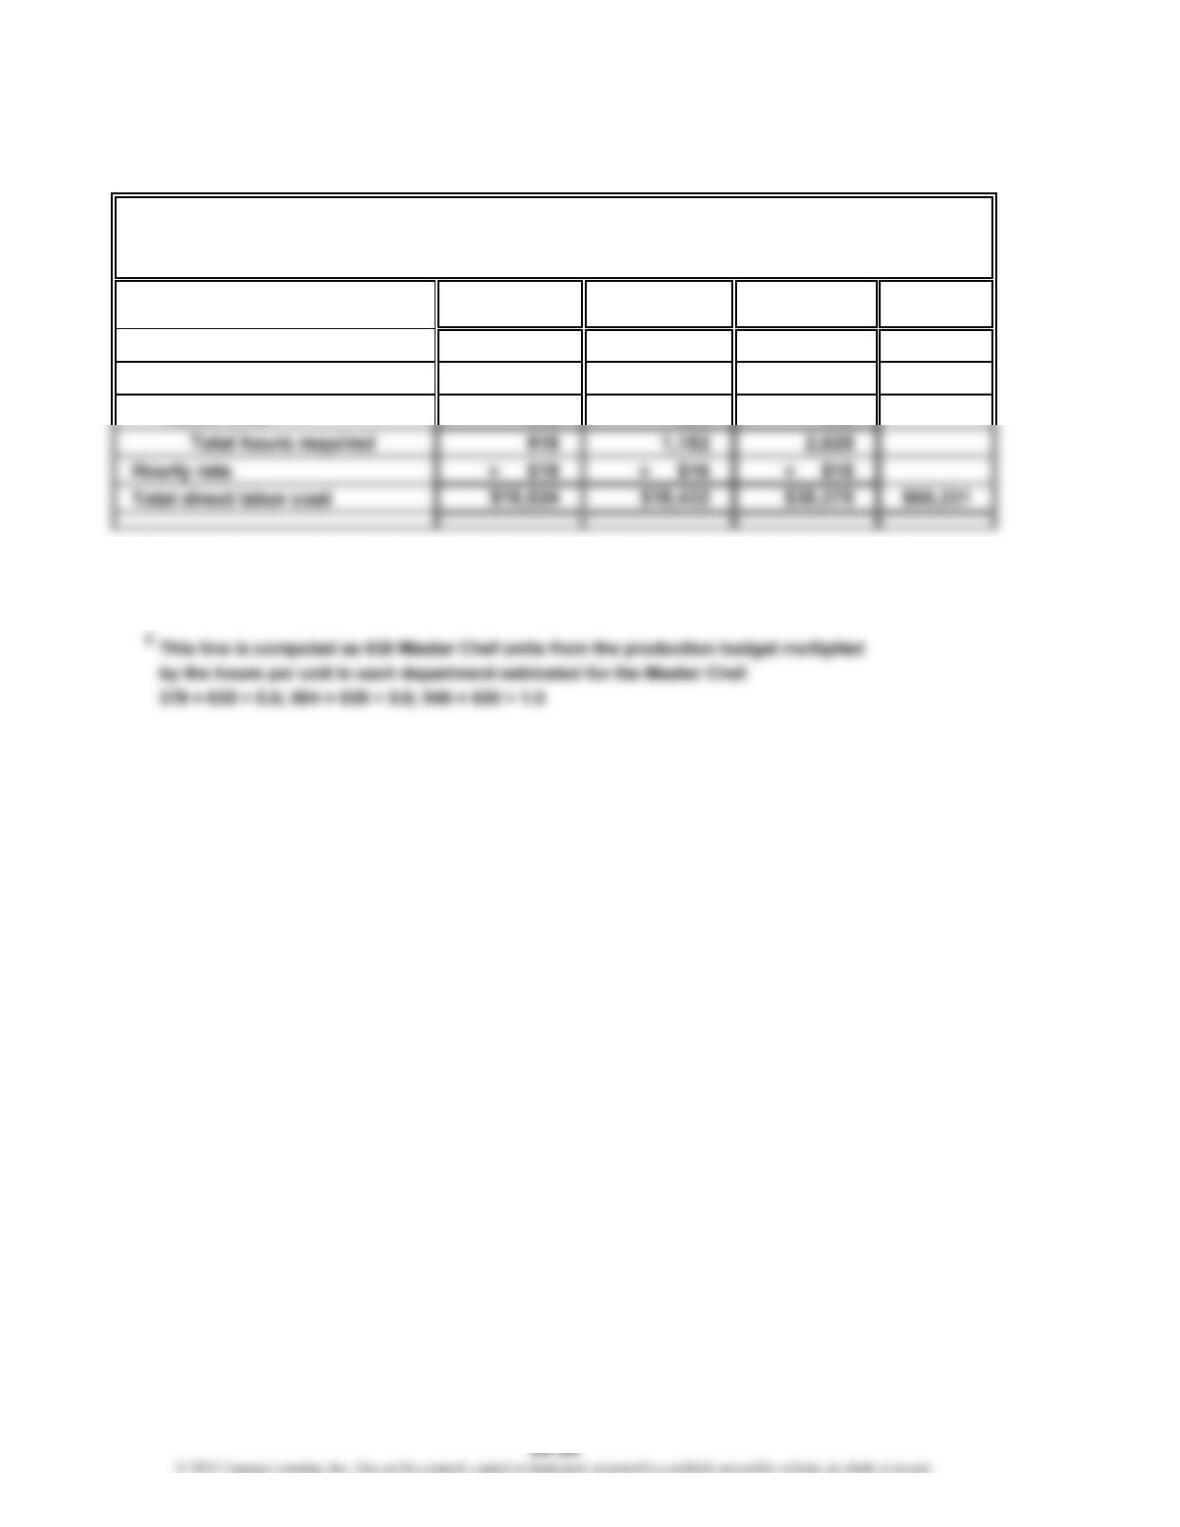
Prob. 22-2A (Concluded)
4.
Stamping Forming Assembly
Department Department Department Total
Hours required for production:
Backyard Chef
1
540 648 1,080
2
378 504 945
1
This line is computed as 1,080 Backyard Chef units from the production budget multiplied
by the hours per unit in each department estimated for the Backyard Chef.
540 = 1,080 × 0.5; 648 = 1,080 × 0.6; 1,080 = 1,080 × 1.0
Gourmet Grill Company
Direct Labor Cost Budget
For the Month Ending March 31
CHAPTER 22 Budgeting
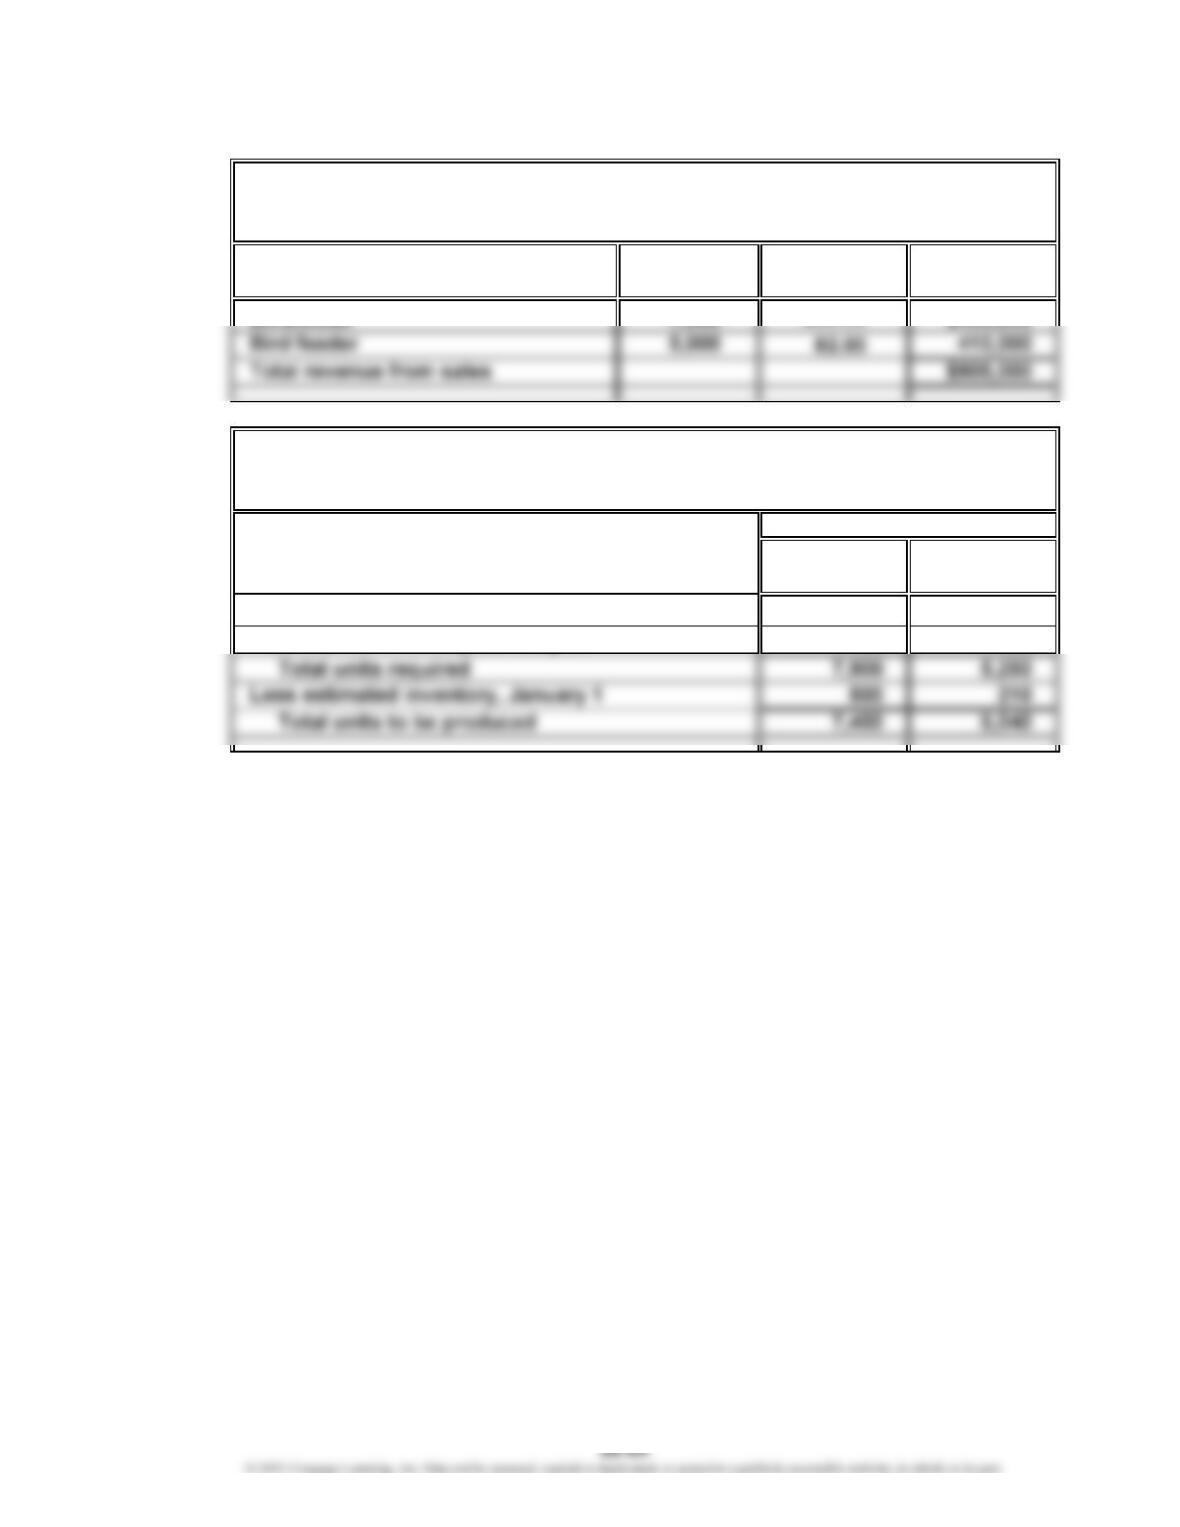
Prob. 22-3A
1.
Unit Sales Unit Selling
Volume Price Total Sales
2.
Bird- Bird
house Feeder
Expected units to be sold 7,500 5,000
Plus desired inventory, January 31 400 250
For the Month Ending January 31
Units
Birds and Beyond Inc.
Sales Budget
For the Month Ending January 31
Birds and Beyond Inc.
Production Budget
CHAPTER 22 Budgeting
Prob. 22-3A (Continued)
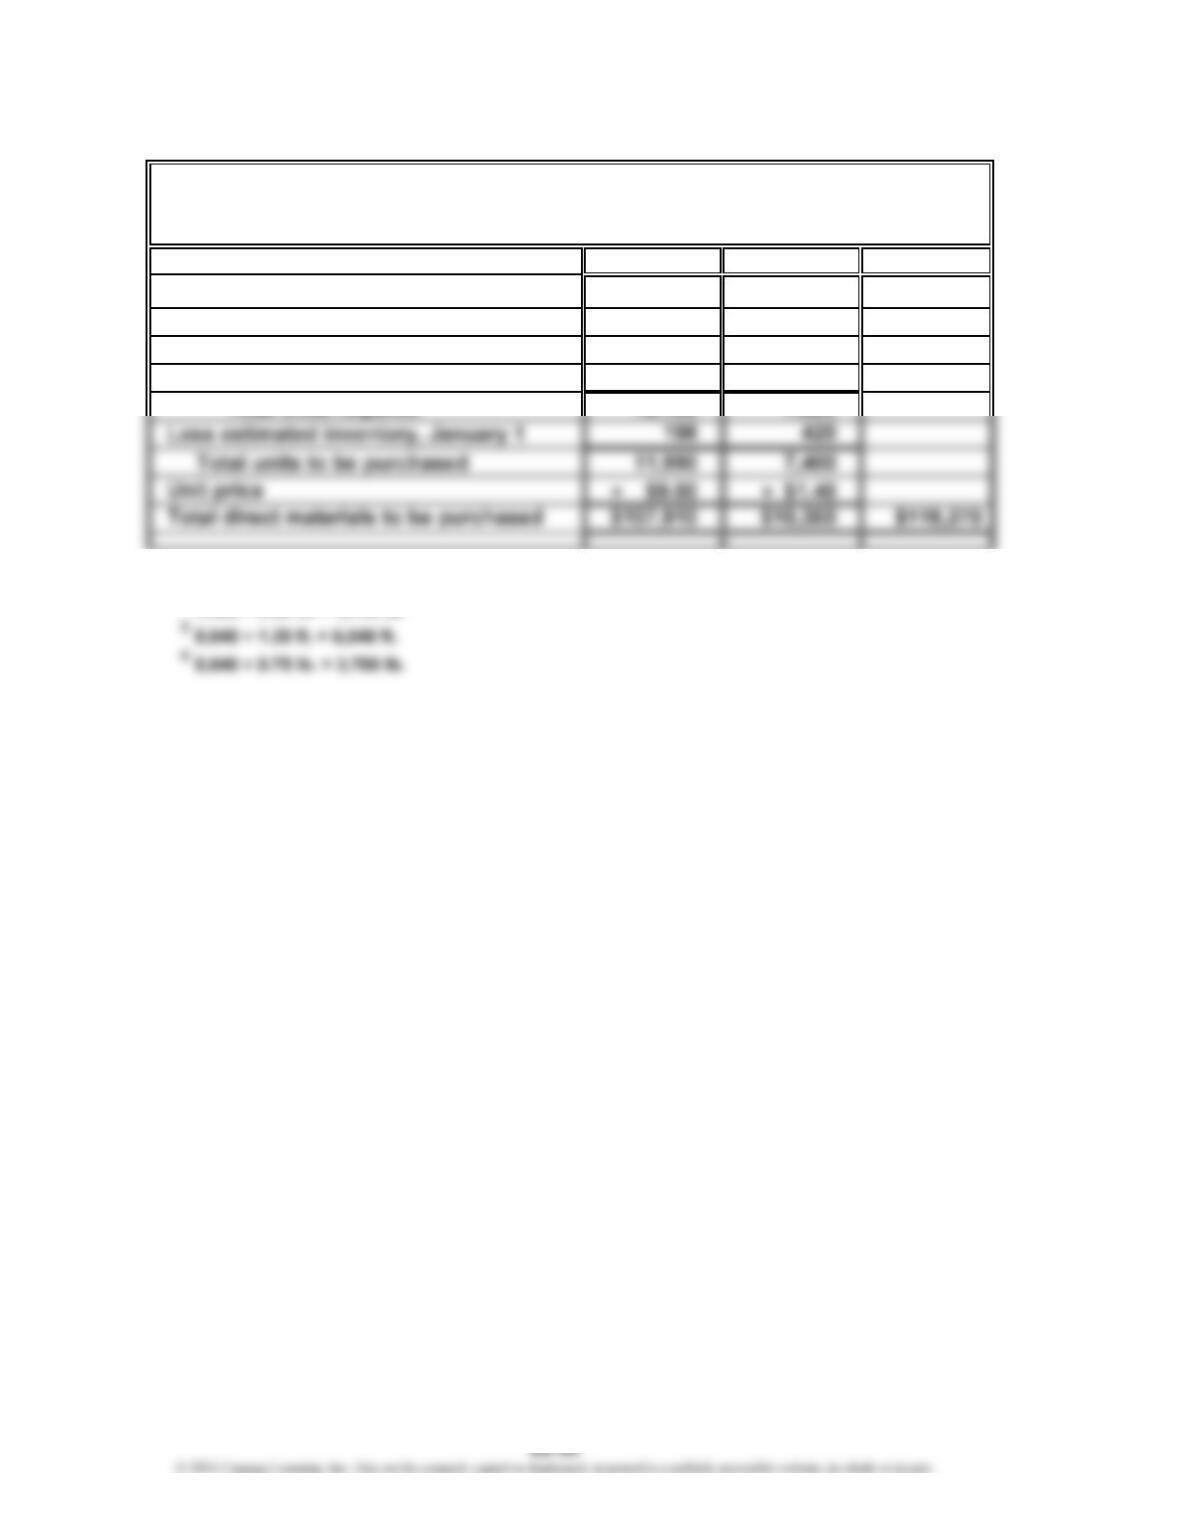
3.
Wood Plastic Total
Required units for production:
Birdhouse 5,920 3,700
Bird feeder 6,048 3,780
Plus desired inventory, January 31 220 340
1
7,400 × 0.80 ft. = 5,920 ft.
2
Birds and Beyond Inc.
Direct Materials Purchases Budget
For the Month Ending January 31
12
34
CHAPTER 22 Budgeting
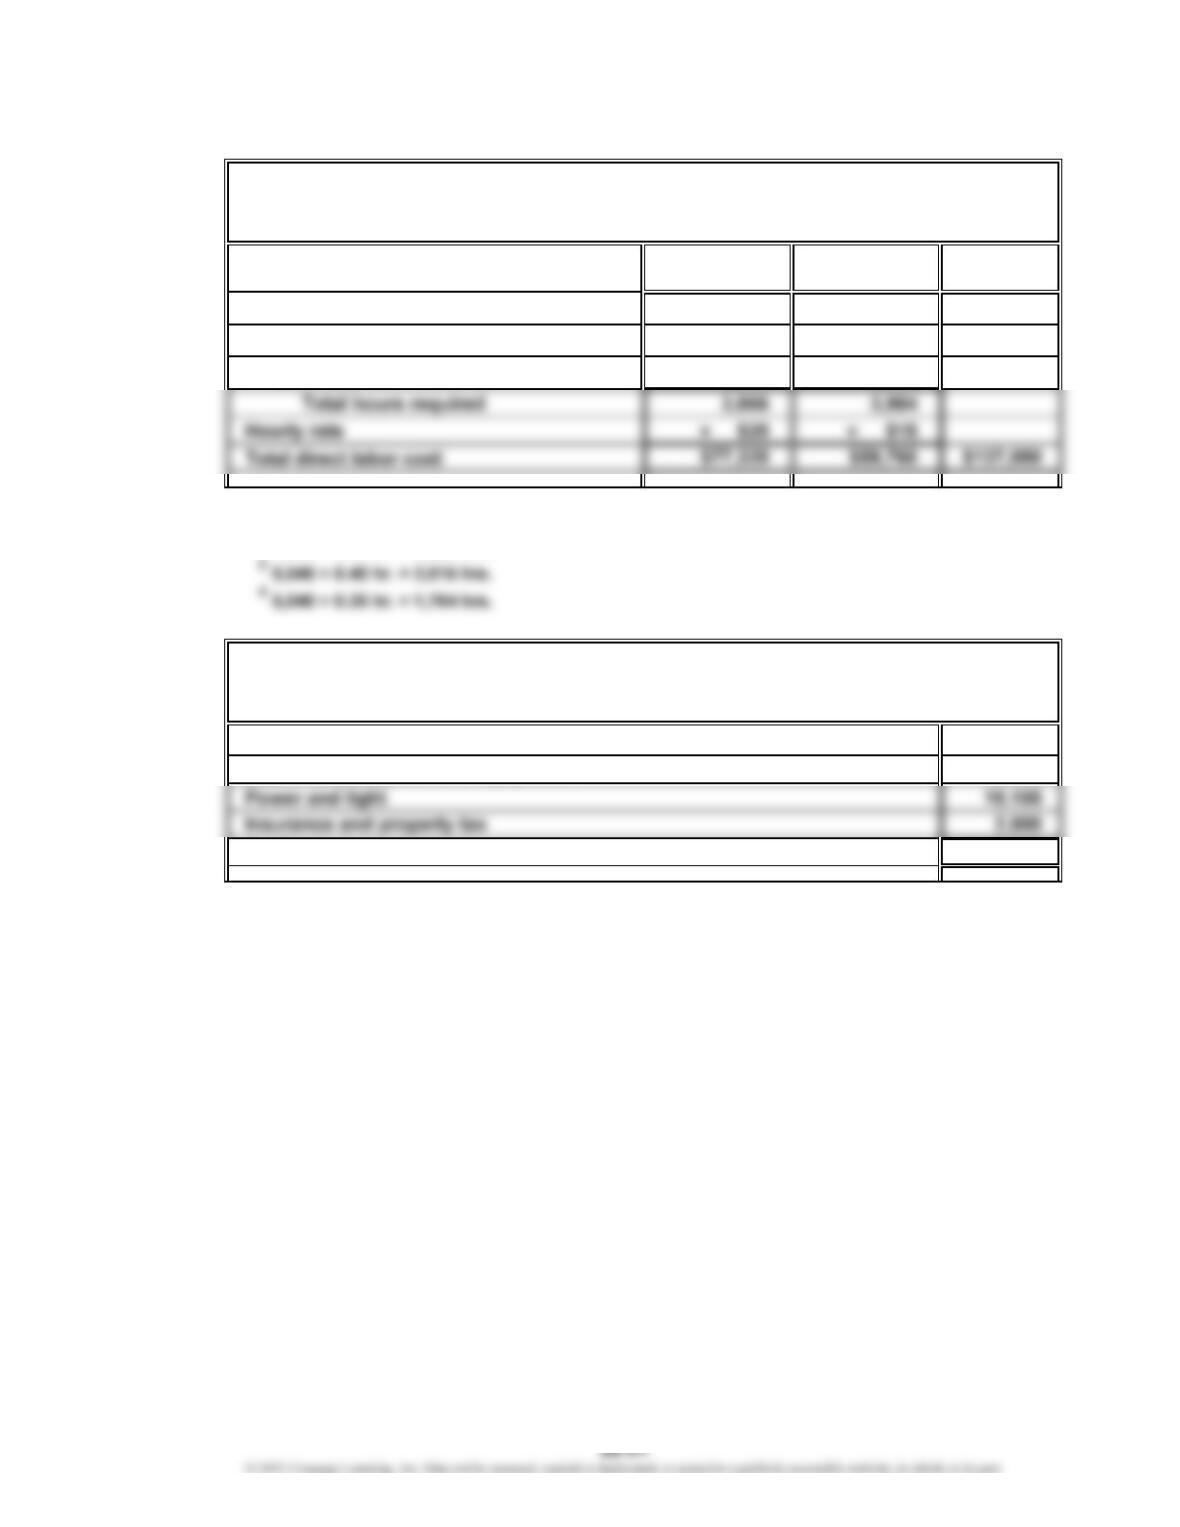
Prob. 22-3A (Continued)
4.
Fabrication Assembly
Department Department Total
Hours required for production:
Birdhouse 1,850 2,220
Bird feeder 2,016 1,764
1
7,400 × 0.25 hr. = 1,850 hrs.
2
7,400 × 0.30 hr. = 2,220 hrs.
5.
Indirect factory wages $ 92,000
Depreciation of plant and equipment 34,000
Total $138,900
Factory Overhead Cost Budget
For the Month Ending January 31
Birds and Beyond Inc.
Direct Labor Cost Budget
For the Month Ending January 31
Birds and Beyond Inc.
12
34
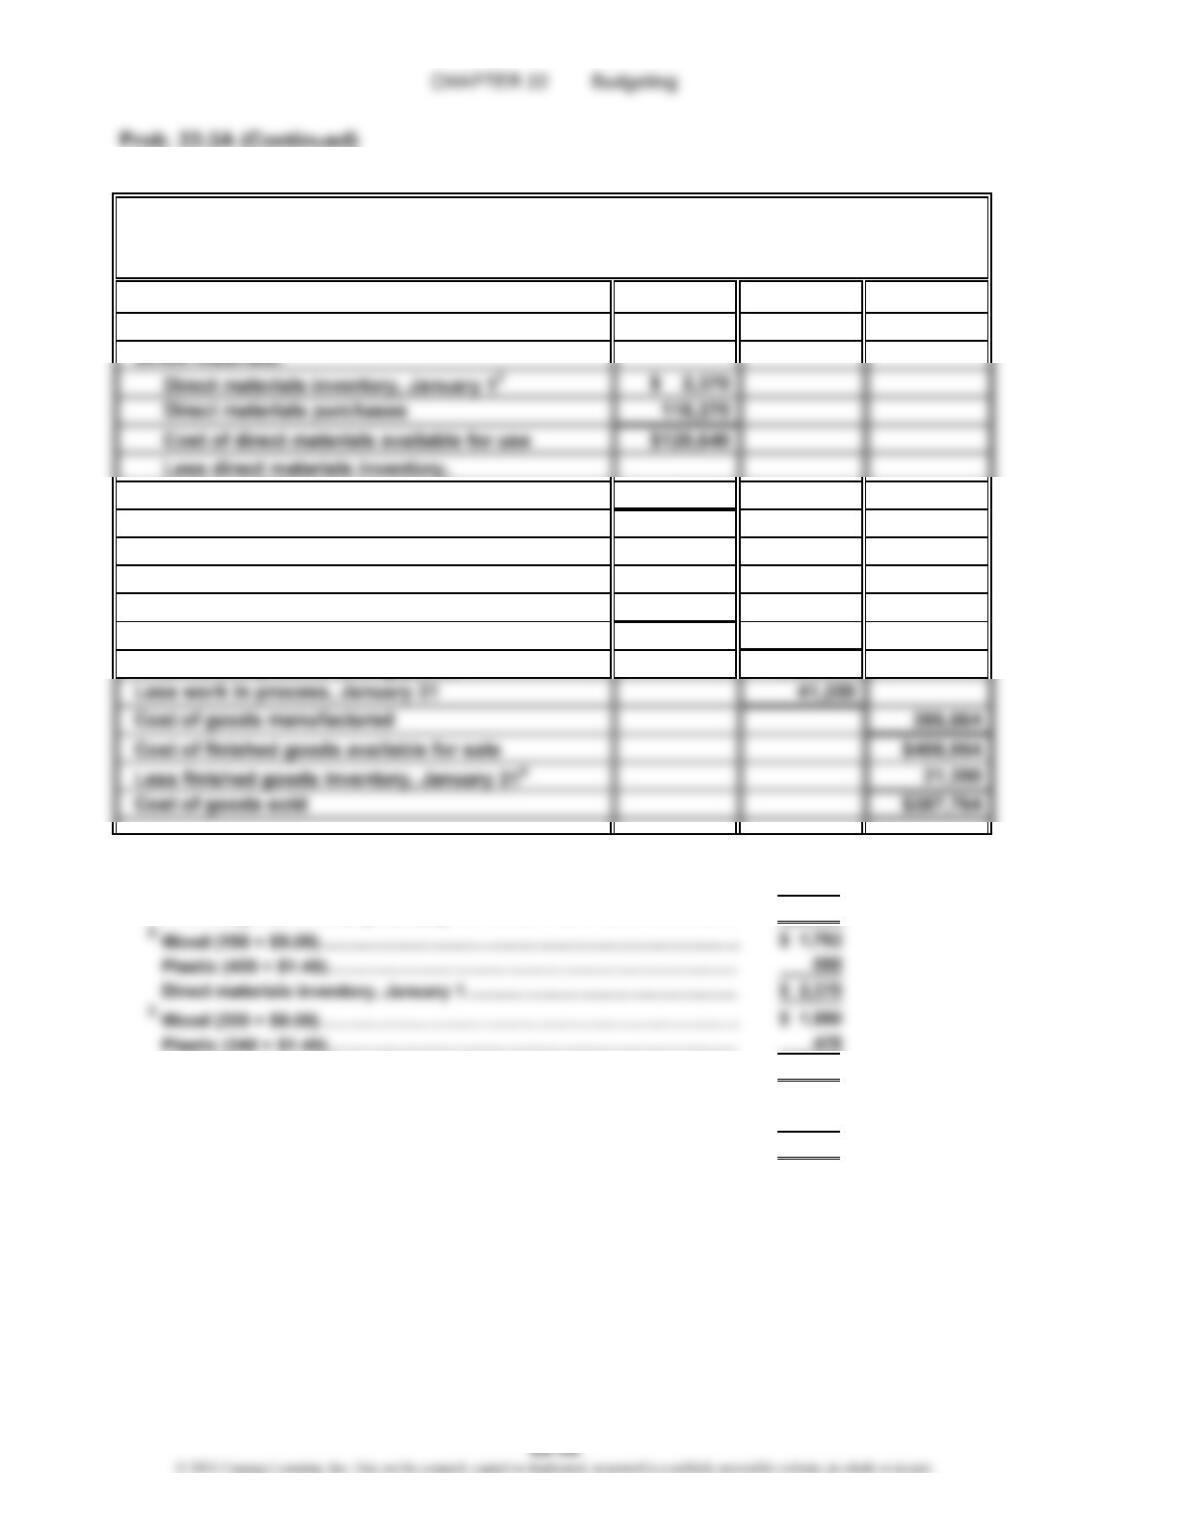
6.
Finished goods inventory, January 1
1
$ 22,400
Work in process inventory, January 1 $ 33,600
January 31
3
2,456
Cost of direct materials placed in
production $118,184
Direct labor 137,080
Factory overhead 138,900
Total manufacturing costs 394,164
Total work in process during period $427,764
1
Birdhouse (500 × $28)…………………………………………………………… $14,000
Bird feeder (210 × $40)…………………………………………………………
…
8,400
Finished goods inventory, January 1………………………………………
…
$22,400
…
…
Direct materials inventory, January 31………………………………………
…
$ 2,456
4
Birdhouse (400 × $28)…………………………………………………………… $11,200
Bird feeder (250 × $40)…………………………………………………………
…
10,000
Finished goods inventory, January 31………………………………………
…
$21,200
Cost of Goods Sold Budget
For the Month Ending January 31
Birds and Beyond Inc.
CHAPTER 22 Budgeting
Prob. 22-3A (Concluded)
7.
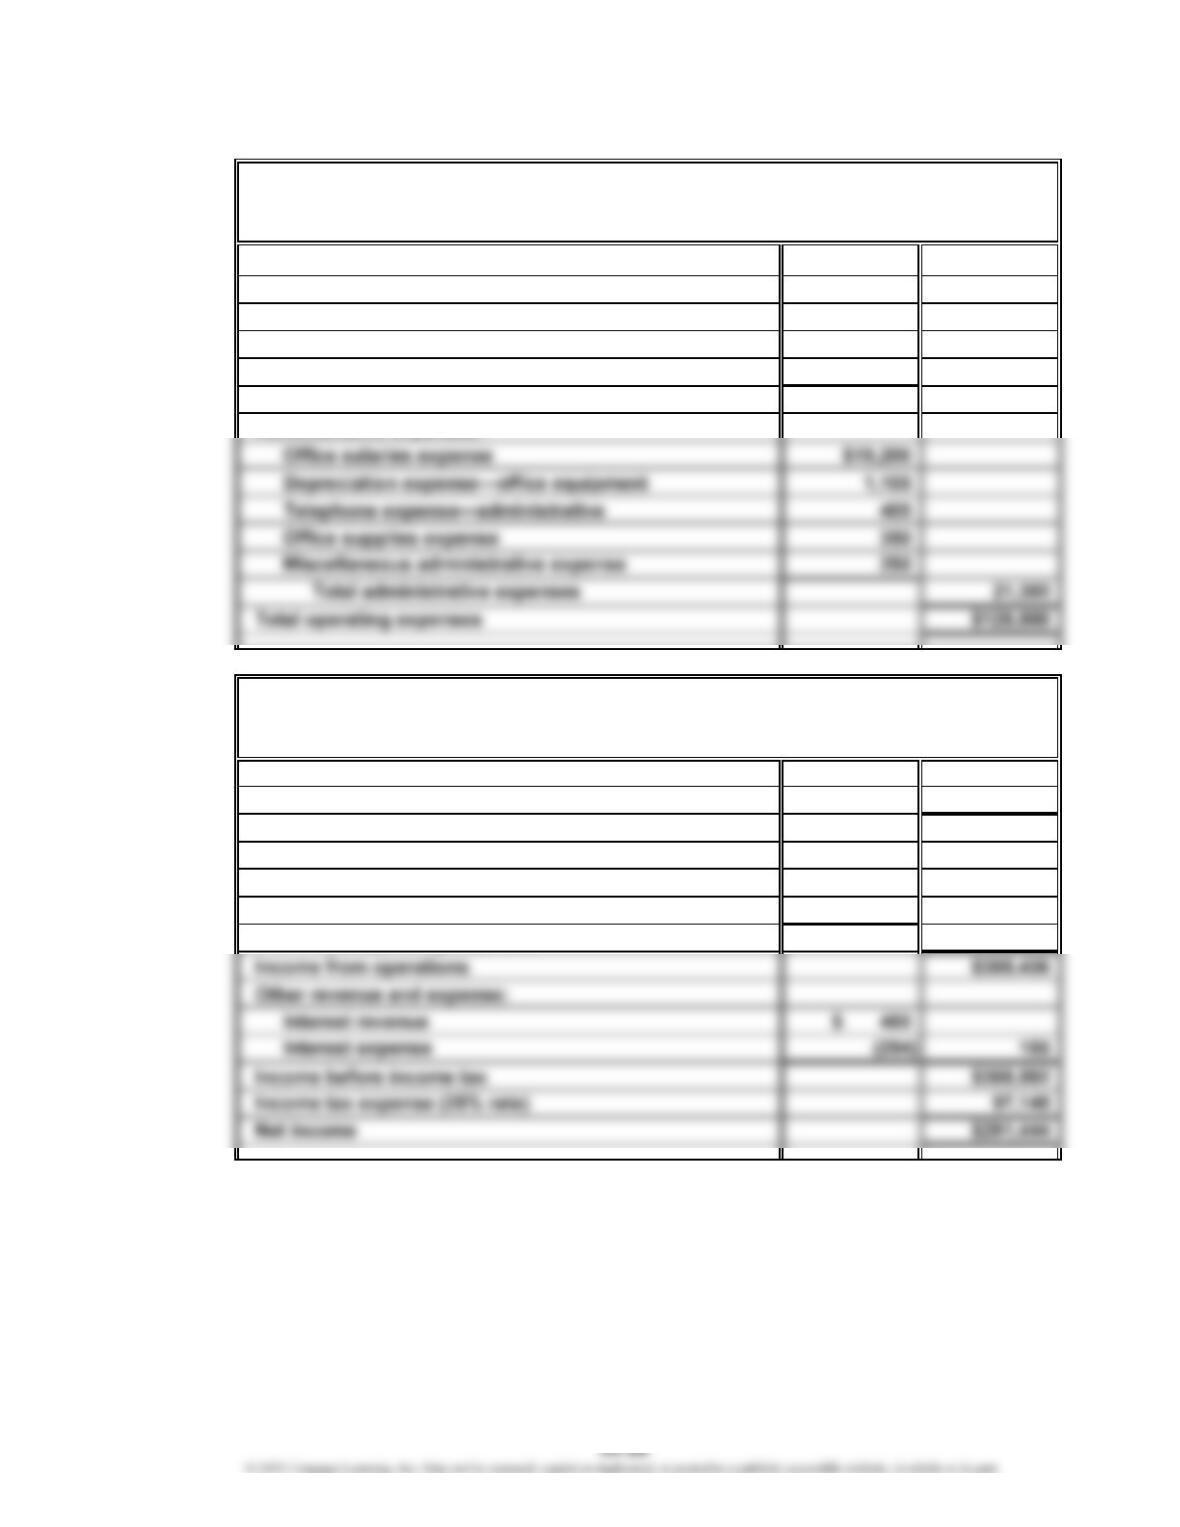
Selling expenses:
Sales salaries expense $85,100
Advertising expense 17,600
Telephone expense—selling 1,000
Travel expense—selling 3,800
Total selling expenses $107,500
8.
Revenue from sales $905,000
Cost of goods sold 387,764
Gross profit $517,236
Operating expenses:
Selling expenses $107,500
Administrative expenses 21,300
Total operating expenses 128,800
Birds and Beyond Inc.
Birds and Beyond Inc.
Budgeted Income Statement
For the Month Ending January 31
Selling and Administrative Expenses Budget
For the Month Ending January 31
CHAPTER 22 Budgeting
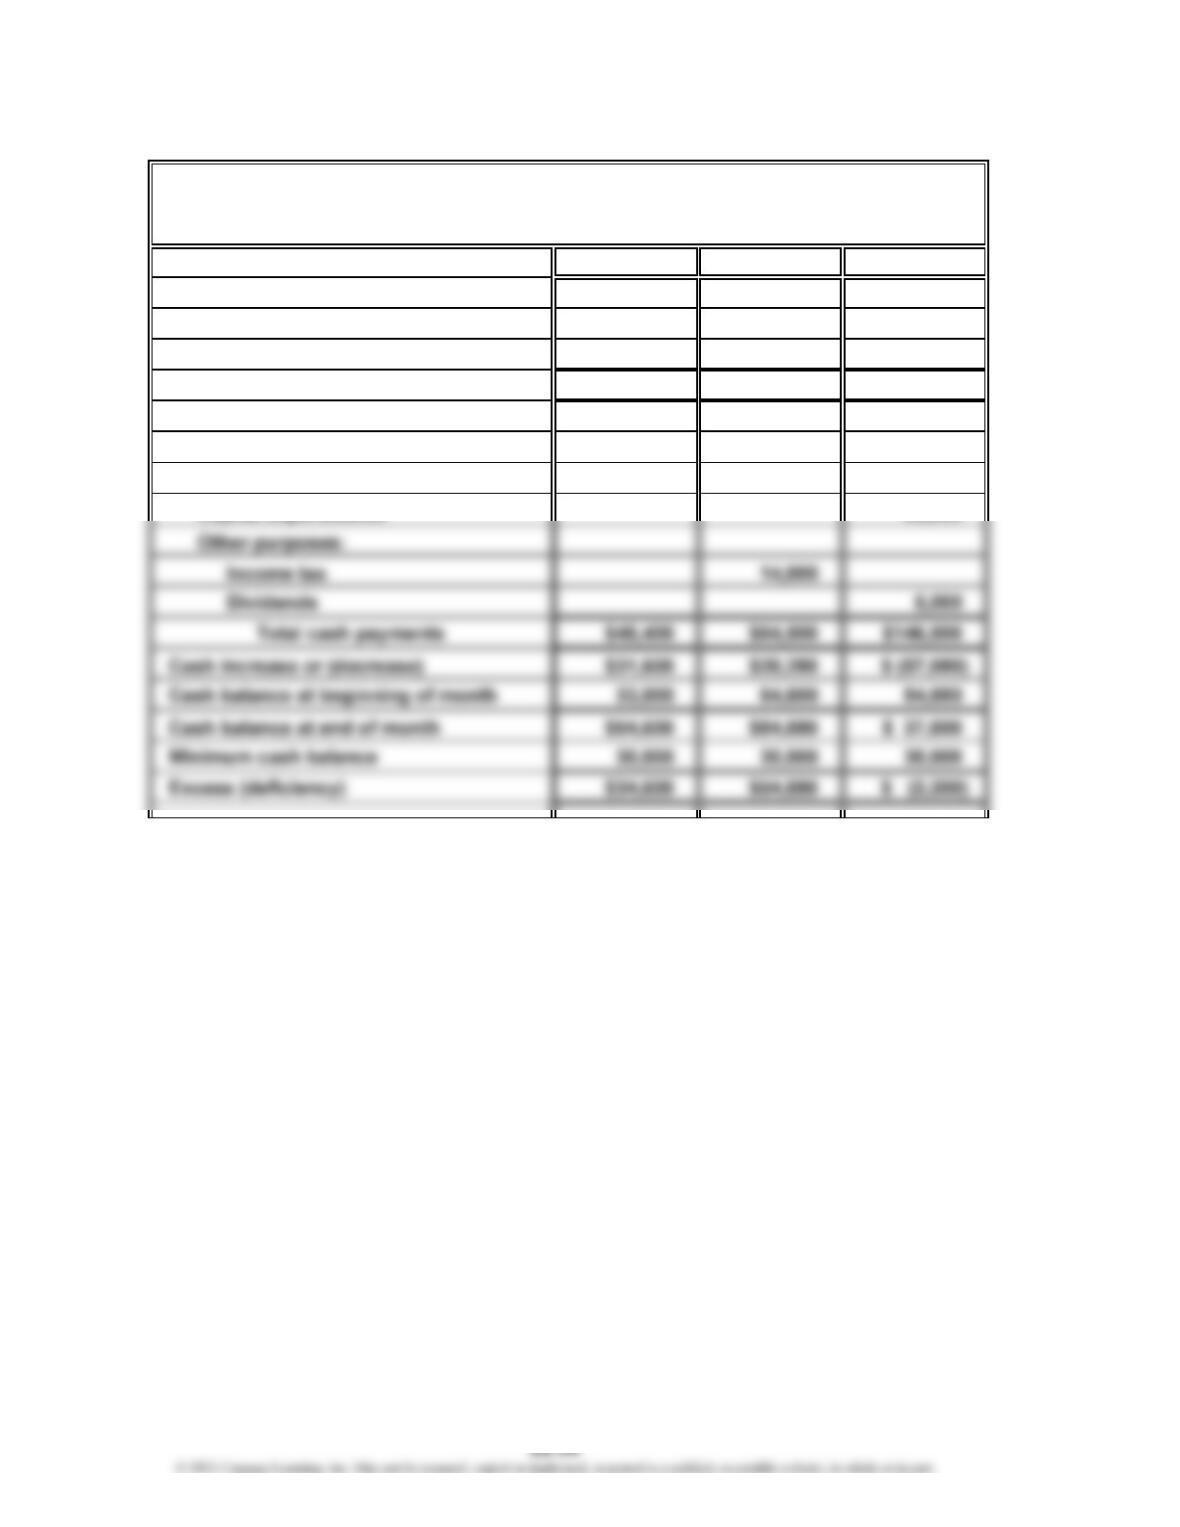
Prob. 22-4A
1.
May June July
Estimated cash receipts from:
Cash sales (10% of monthly sales) $ 8,600 $ 9,000 $ 9,500
Collection of accounts receivablea68,400 75,780 79,920
Total cash receipts $77,000 $84,780 $ 89,420
Estimated cash payments for:
Manufacturing costsb$30,400 $34,500 $ 39,500
Selling and administrative expenses 15,000 16,000 22,000
Sonoma Housewares Inc.
For the Three Months Ending July 31
Cash Budget
CHAPTER 22 Budgeting
Prob. 22-4A (Concluded)
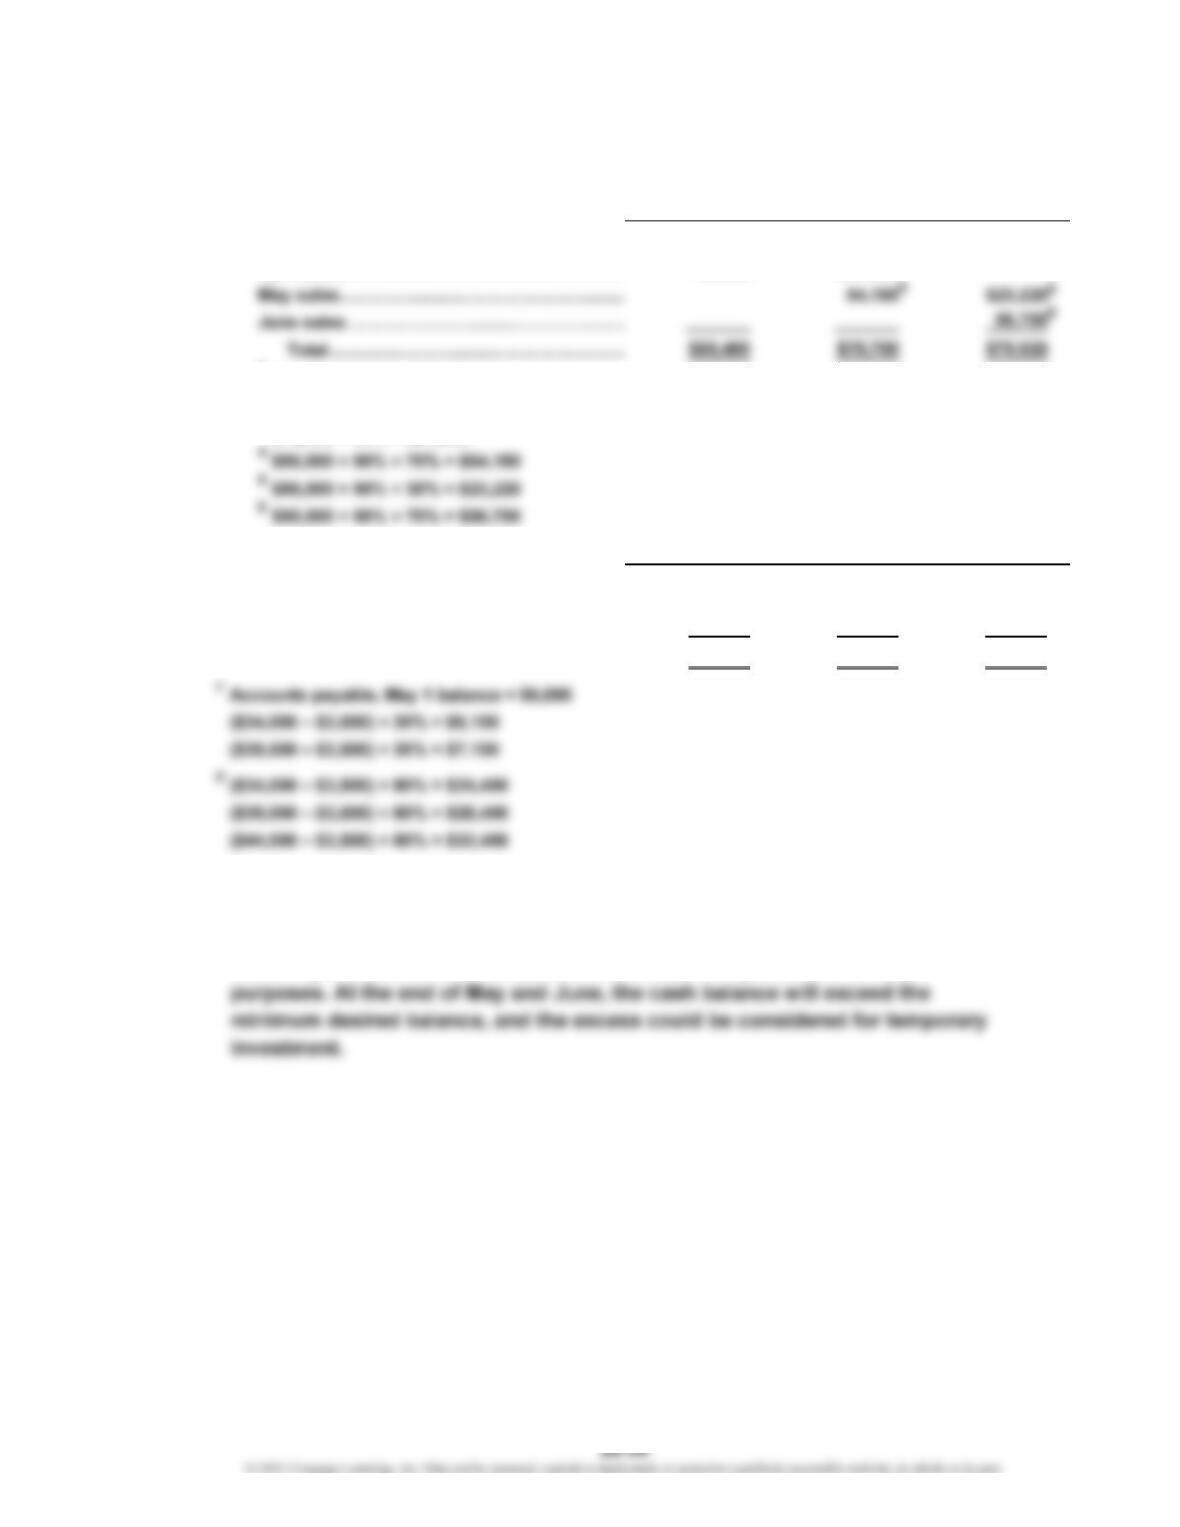
Computations:
a
Collections of accounts receivable: May June July
March sales………………………………………
…
$18,000
April sales…………………………………………
…
50,400 $21,600
1
$60,000 × 30% = $18,000
2
$72,000 × 70% = $50,400
3
$72,000 × 30% = $21,600
b
Payments for manufacturing costs: May June July
Payment of accounts payable, beginning
of month balance
c
……………………………
…
$ 6,000 $ 6,100 $ 7,100
Pa
y
ment of current month’s cost
d
……………
…
24,400 28,400 32,400
Total……………………………………………
…
$30,400 $34,500 $39,500
2. The budget indicates that the minimum cash balance will not be maintained
in July. This is due to the capital expenditures requiring significant cash
outflows during this month. This situation can be corrected by borrowing
and/or by the sale of the marketable securities, if they are held for such
1
23
…
…
CHAPTER 22 Budgeting
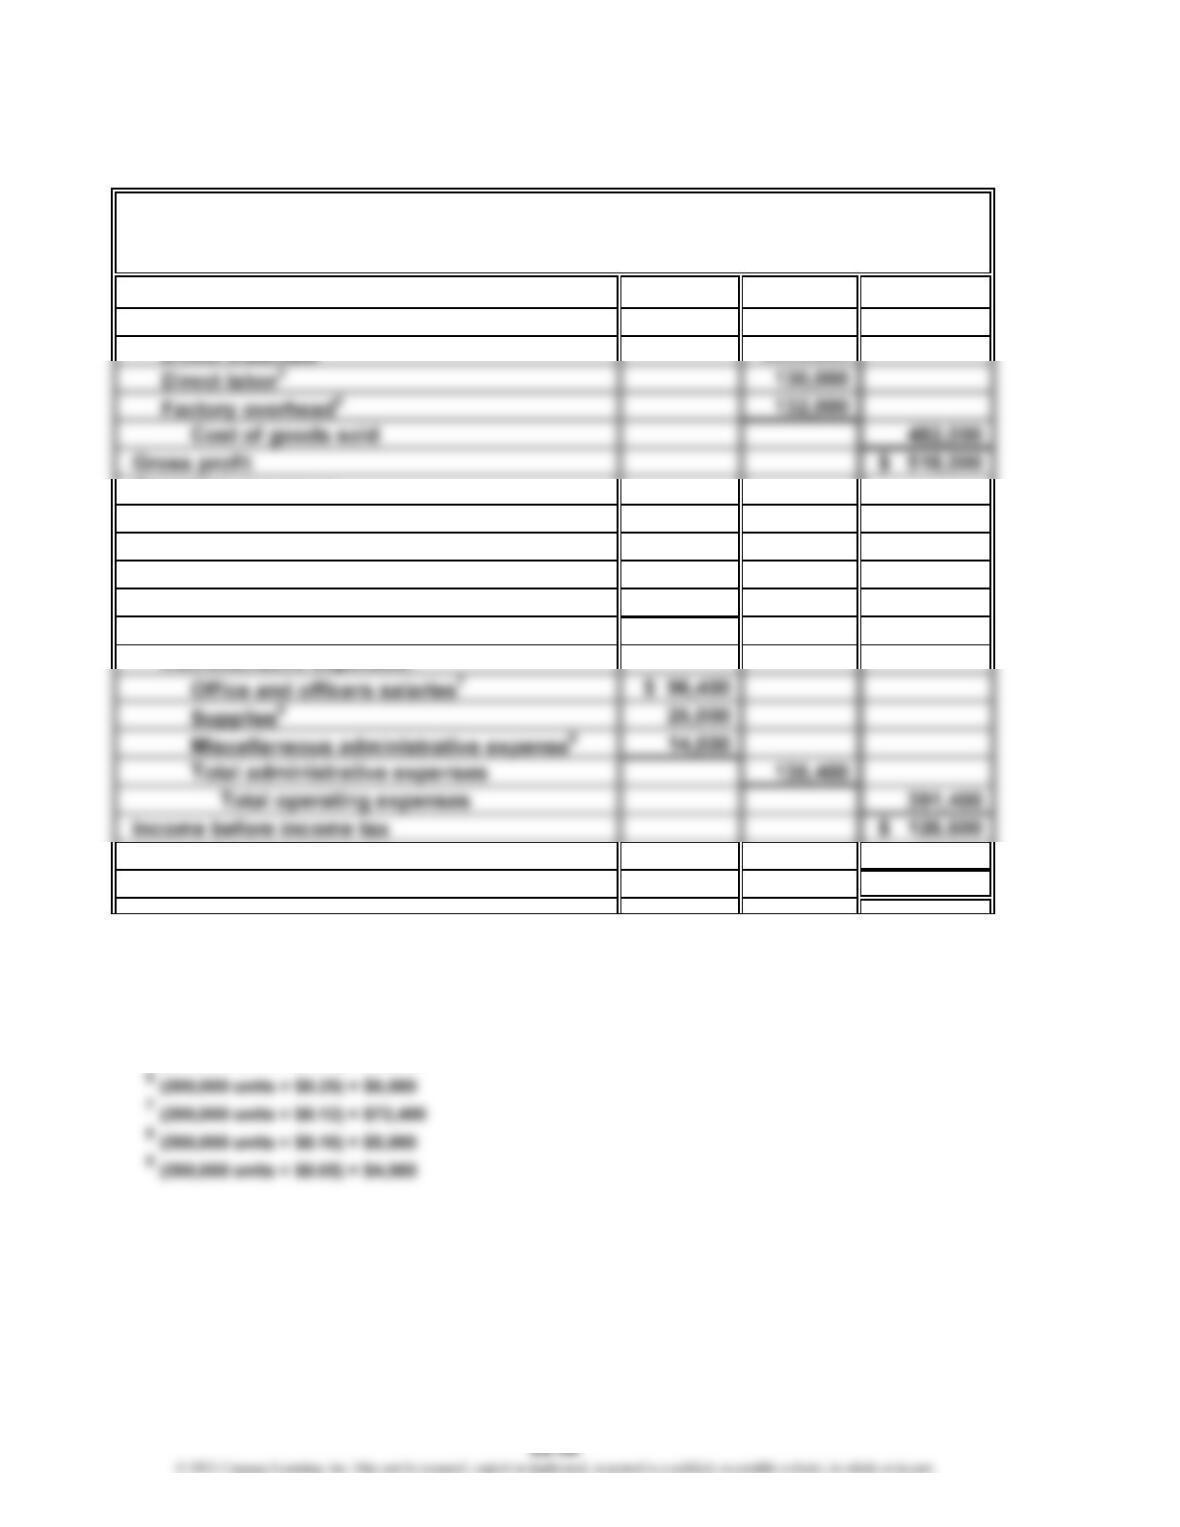
Prob. 22-5A
1.
Sales1$1,000,000
Cost of goods sold:
Operating expenses:
Selling expenses:
Sales salaries and commissions5$136,000
Advertising 64,000
Miscellaneous sellin
g
ex
p
enses656,000
Total selling expenses $256,000
Income tax expense 30,000
Net income $ 96,600
1200,000 units × $5.00
2200,000 units × $1.10
3200,000 units × $0.65
4(200,000 units × $0.40) + $40,000 + $12,000
5(200,000 units × $0.45) + $46,000
Regina Soap Co.
Budgeted Income Statement
For the Year Ending December 31, 20Y4
CHAPTER 22 Budgeting
Prob. 22-5A (Continued)
2.
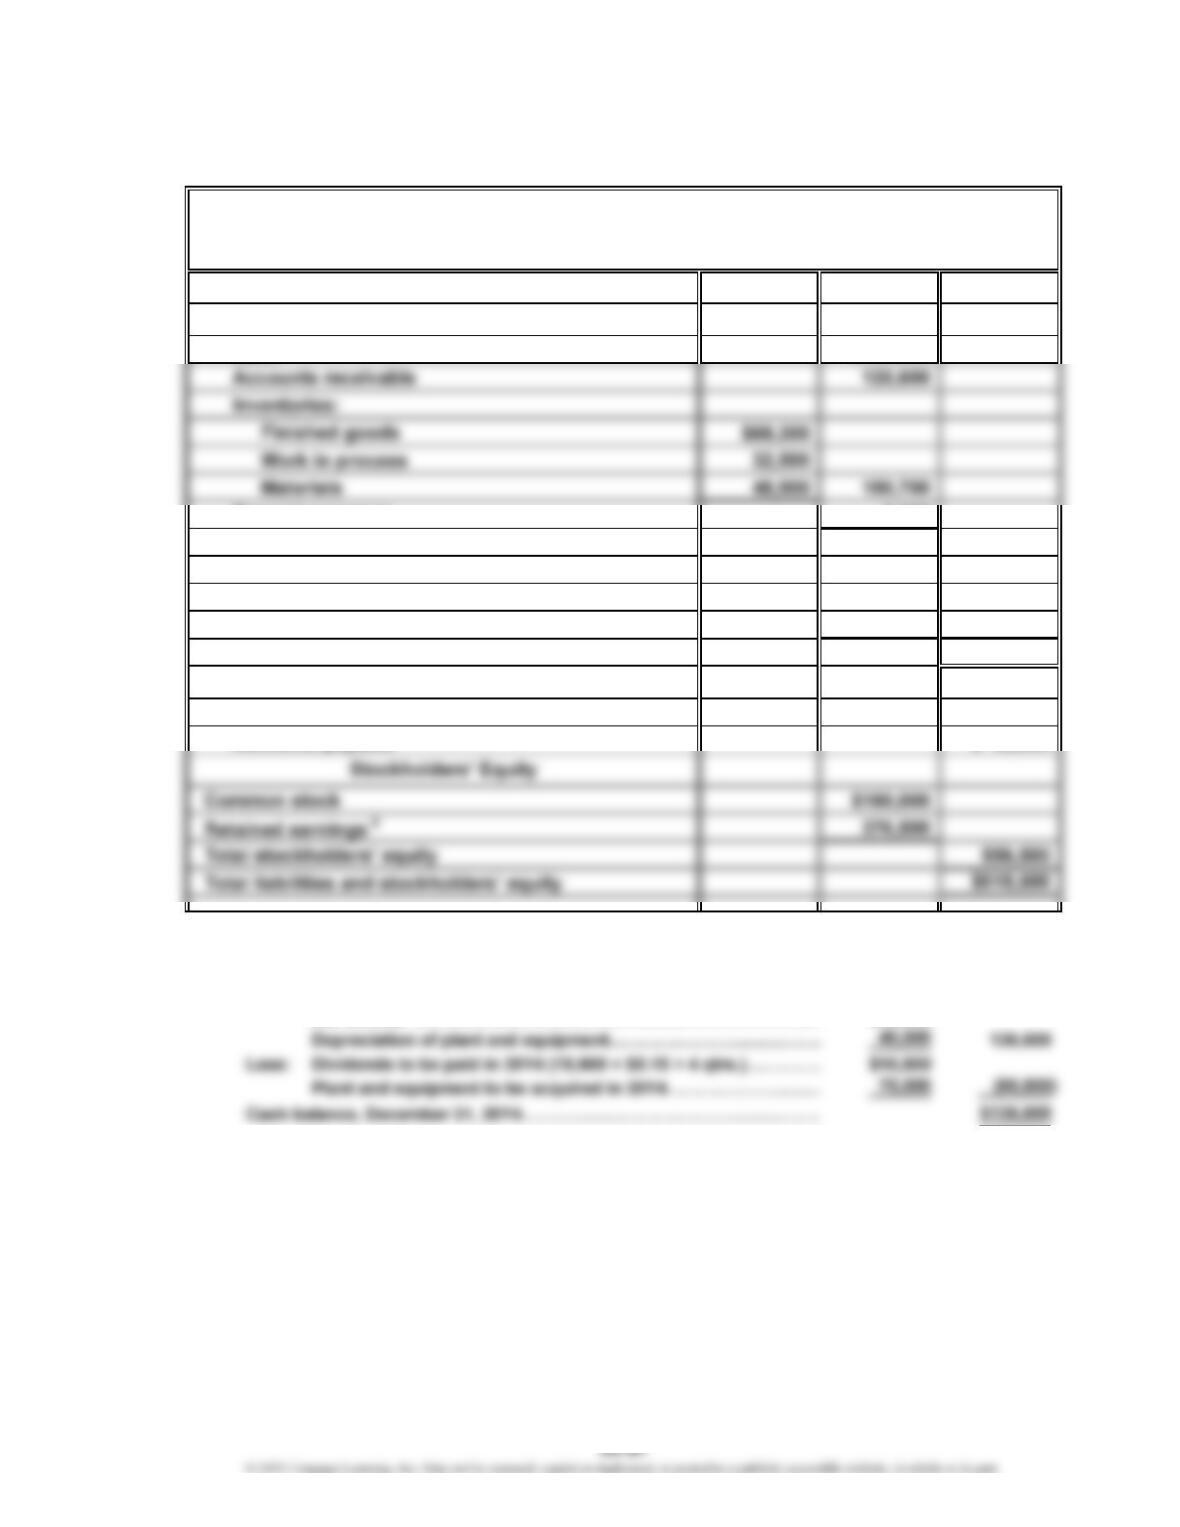
Current assets:
Cash 1 $135,800
Prepaid expenses 2,600
Total current assets $414,700
Property, plant, and equipment:
Plant and equipment 2 $400,000
Less accumulated depreciation 3 196,200 203,800
Total assets $618,500
Current liabilities:
1Cash balance, December 31, 20Y4:
Balance, January 1, 20Y4………………………………………………………
…
$ 85,000
Add: Cash from operations
Net income*……………………………………………………………
…
$96,600
…
*As per question: Balances of accounts receivable, prepaid expenses, and accounts payable
at the end of the year are not expected to differ significantly from the beginning balances.
Therefore, there is no need to adjust net income for changes to current assets and/or
current liabilities to arrive at the cash from operating activities.
Regina Soap Co.
Budgeted Balance Sheet
December 31, 20Y4
Assets
Liabilities
CHAPTER 22 Budgeting
Prob. 22-5A (Concluded)
2$325,000 + $75,000 = $400,000
3$156,200 + $40,000 = $196,200
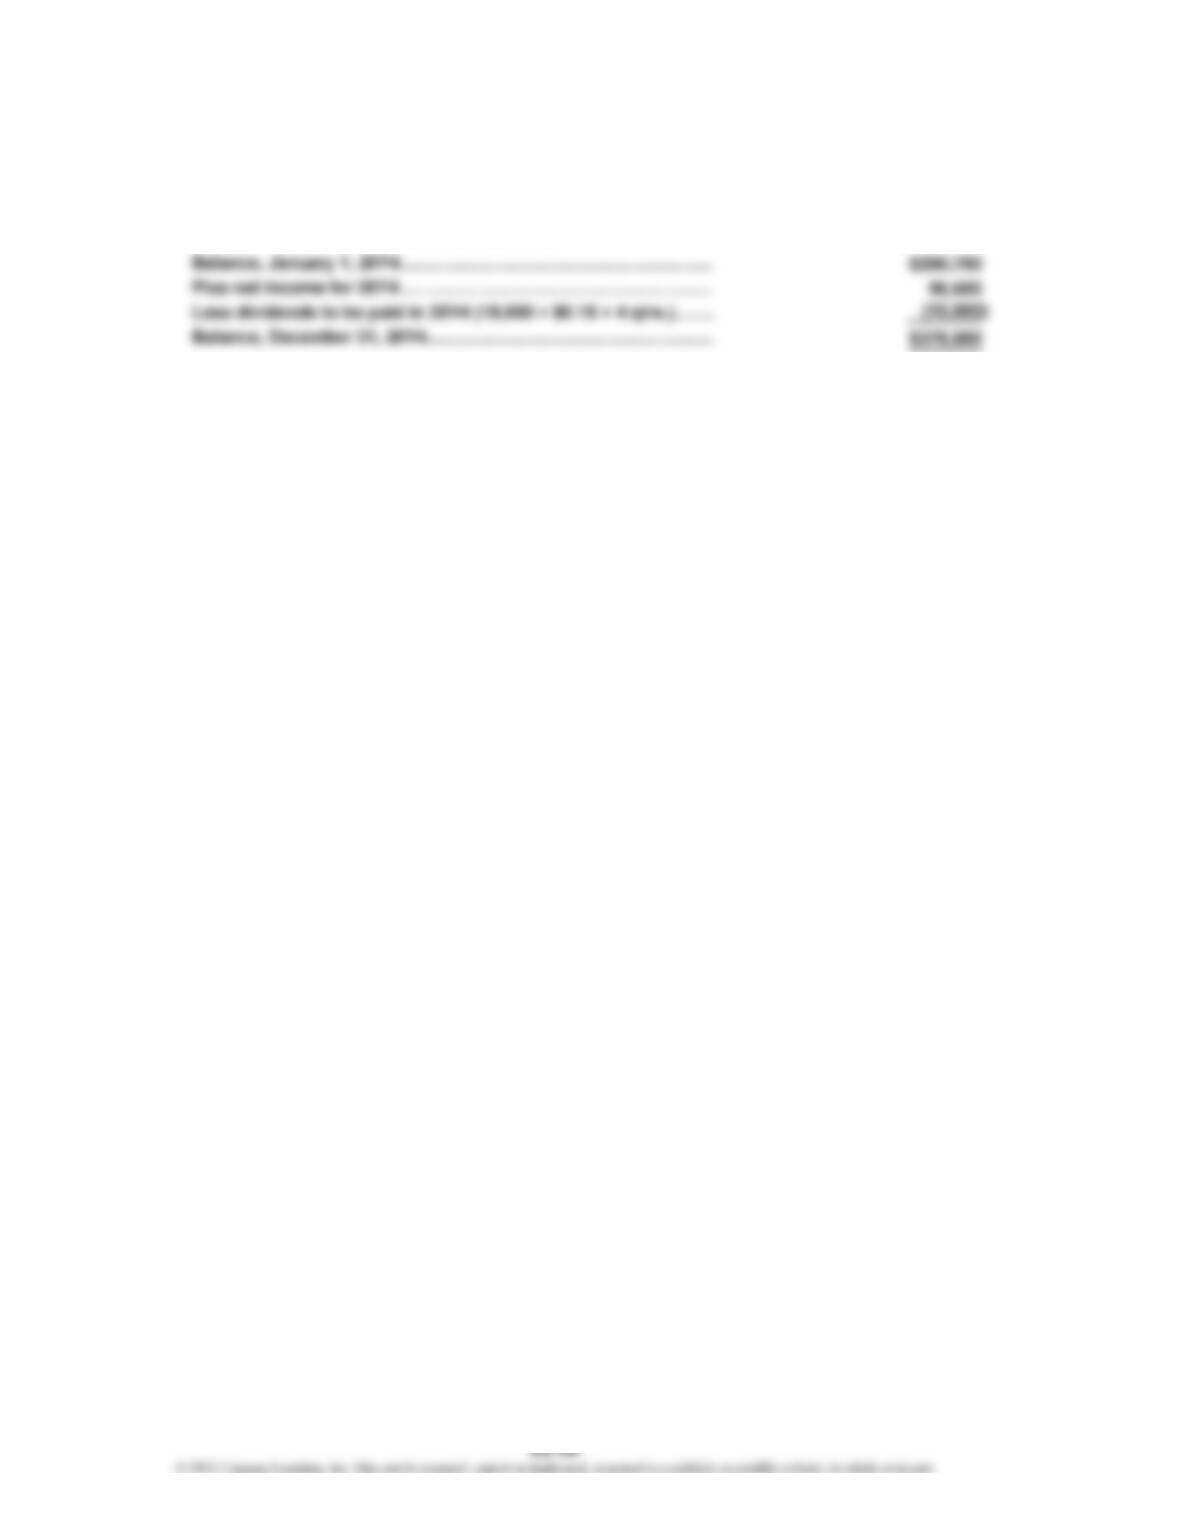
4Retained earnings balance, December 31, 20Y4:
CHAPTER 22 Budgeting
Prob. 22-1B
1.
Budget Actual Sales Amount Percent
Home Alert System:
United States 1,700 1,734 34 2%
Europe 580 609 29 5%
*
34 ÷ 1,700
2.
20Y9
20Y8 Percenta
g
eBud
g
eted
Actual Increase Units
Units
(
Decrease
)
(
rounded
)
Home Alert System:
United States 1,734 2% 1,769
Europe 609 5% 639
Increase (Decrease)
Unit Sales, Year Ended 20Y8 Actual Over Bud
g
et
*
CHAPTER 22 Budgeting
Prob. 22-1B (Concluded)
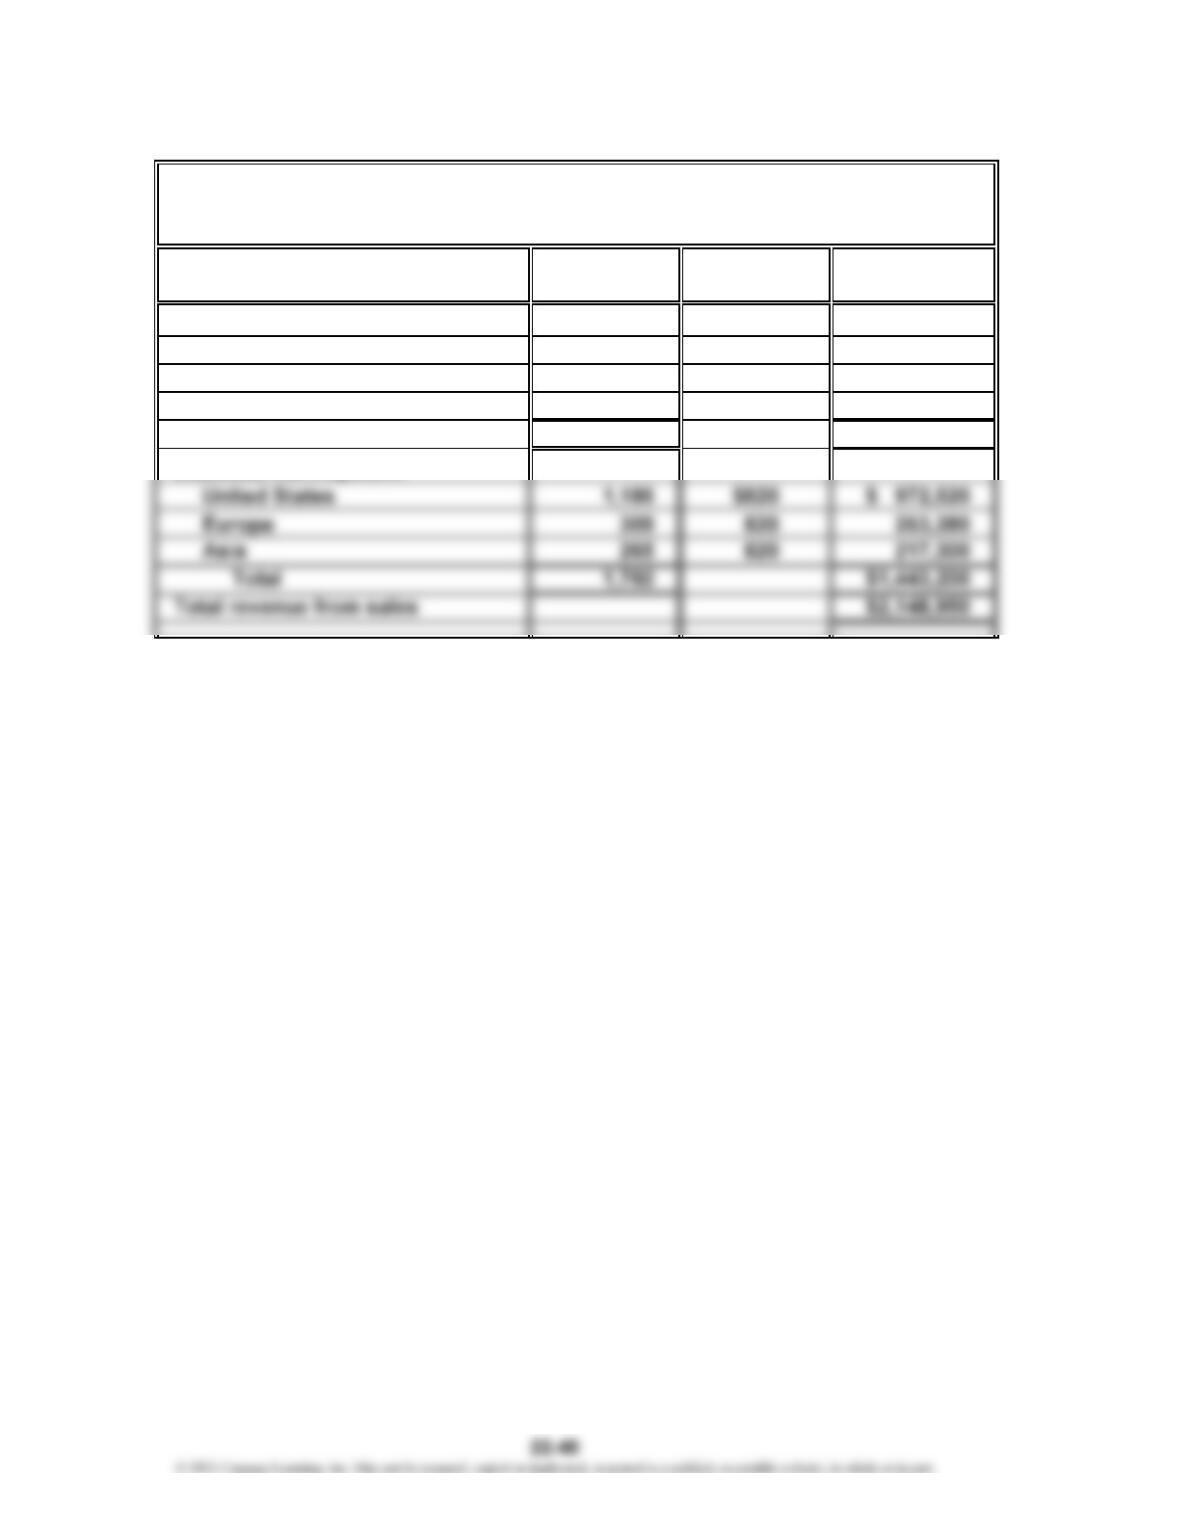
3.
Unit Sales Unit Selling
Volume Price Total Sales
Home Alert System:
United States 1,769 $250 $ 442,250
Europe 639 250 159,750
Asia 415 250 103,750
Total 2,823 $ 705,750
Product and Area
Sentinel Systems Inc.
For the Year Ending December 31, 20Y9
Sales Budget