
Chapter 22
Analyzing Financial Statements
Chapter Overview
This chapter illustrates some analysis techniques used by investors, creditors, and management in making
business decisions. The investor is concerned with the future profitability, future dividend probability, and
company growth probability as compared to other potential investments. The creditors are concerned the
company has enough cash to pay back the loan plus interest. The management is concerned with the
company operating as efficiently as possible and finding areas that can be improved.
Financial analysis results need to be placed in context in order to best understand the numbers.
Learning Objectives
After studying Chapter 22, your students should gain proficiency in the following:
2. Prepare a Horizontal and Vertical Analysis of an Income Statement.
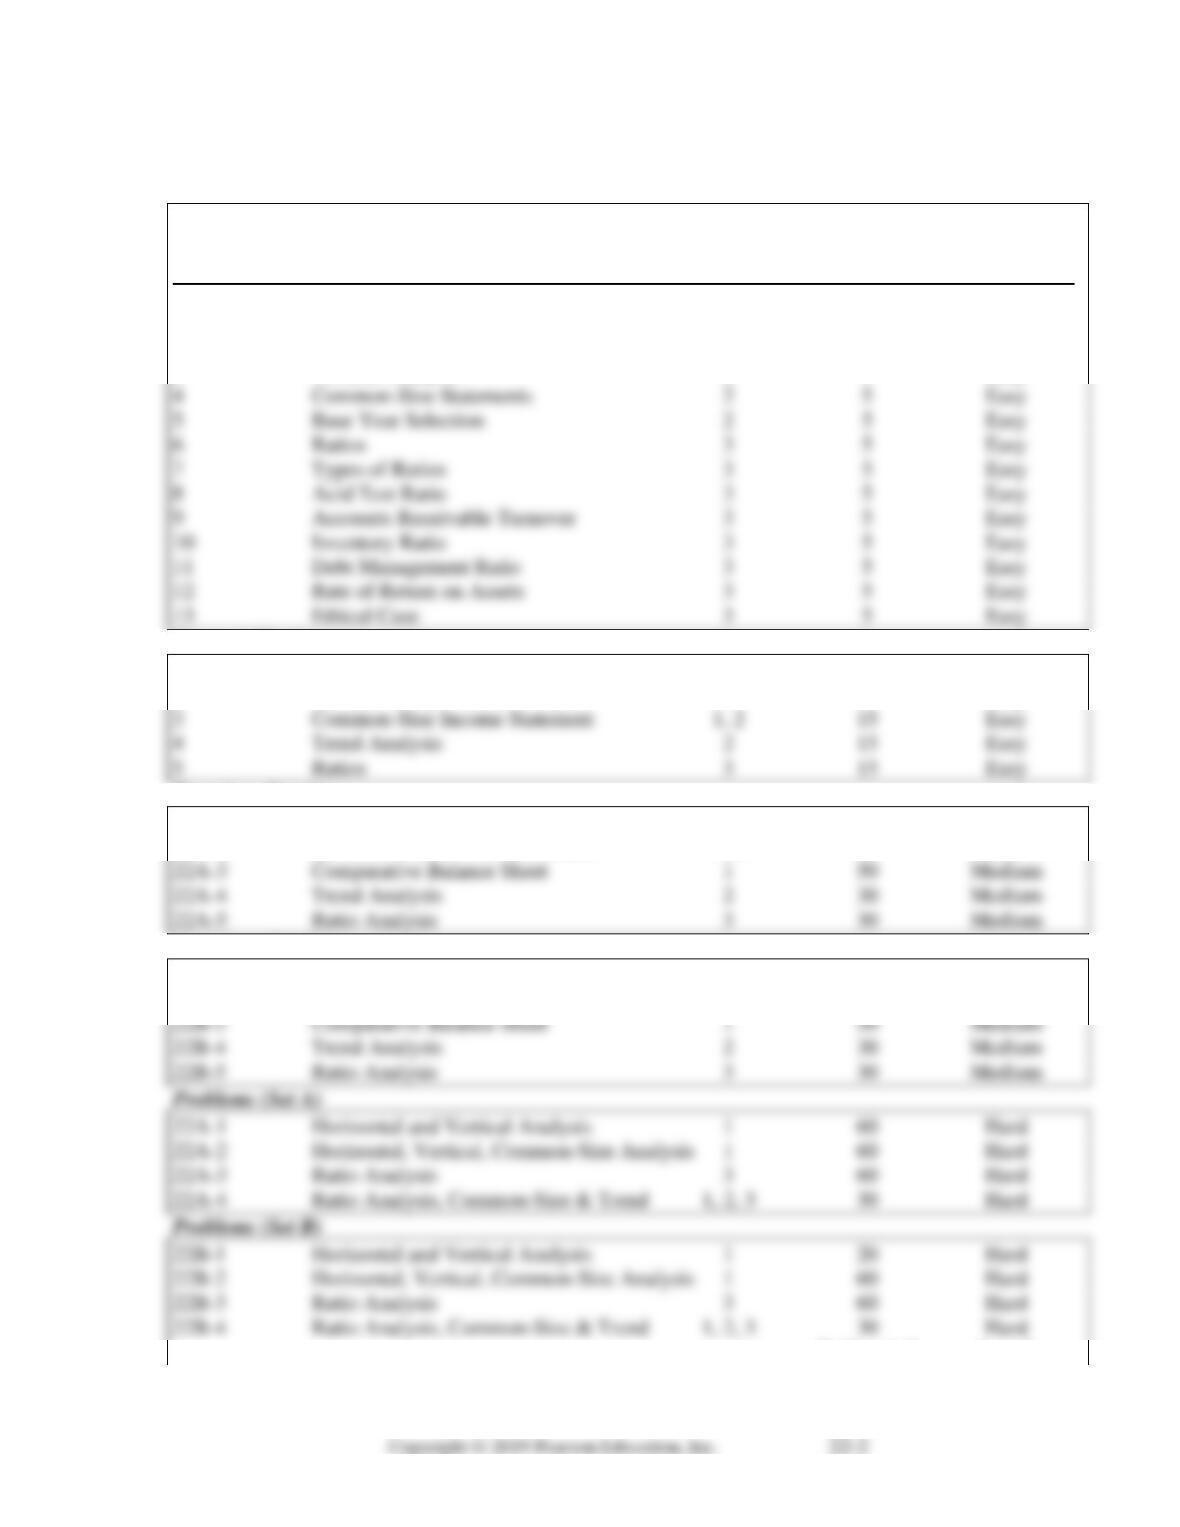
Chapter 22 Assignment Grid
Estimated Level
Learning Time in of
Assignment Topic(s) Objective(s) Minutes Difficulty
Discussion Questions and Critical Thinking/Ethical Case
1 Financial Statement Analysis 1 5 Easy
2 Horizontal Analysis 2 5 Easy
3 Vertical Analysis 2 5 Easy
Concept Checks
1 Horizontal Analysis Balance Sheet 1 10 Easy
2 Vertical Analysis Balance Sheet 1 15 Easy
Exercises (Set A)
22A-1 Comparative Income Statement 2 30 Medium
22A-2 Common-Size Income Statement 1, 2 30 Medium
Exercises (Set B)
22B-1 Comparative Income Statement 2 30 Medium
22B-2 Common-Size Income Statement 1, 2 30 Medium
Estimated Level
Learning Time in of
Assignment Topic(s) Objective(s) Minutes Difficulty
Learning Unit 22-1: Horizontal and Vertical Analysis of
Comparative Balance Sheets
Summary: Common Size Statements are comparative reports in which each item is expressed as a
percentage of a base amount. A Comparative Balance Sheet shows data from two or more periods side by
side. (See Figure 22.1) The current year’s balance sheet figures are placed next to figures from the
In vertical analysis, each item on a comparative balance sheet is shown as a percentage of a total base
(either total assets or total liabilities plus stockholder’s equity).
Key Concepts: Comparative balance sheets, horizontal analysis, vertical analysis, common-size
statements.
Lecture Outline:
1. Horizontal analysis (See Figure 22.1):
a. Column 1 contains the current year data.
b. Column 2 contains the prior year data.
2. Vertical analysis (See Figure 22.2) still uses a comparative format:
a. Column 1 contains the current year data
b. Column 2 shows the percentages compared to the base. (The base is the total assets or total
liabilities plus owners’ equity.)
c. The total of Column 2 for the assets should equal 100%.
3. The common-size statement makes it easier to see and make the comparisons.
a. Used to compare companies of different sizes without being influenced by dollar amounts.
Teaching Tips/Strategy: After explaining the procedures for horizontal analysis, trend analysis, vertical
analysis and common-size statement, use the Concept Checks #1 and #2 to illustrate these procedures to
analyze financial statements. Exercise 22A–3 can be used for classroom illustration of a common-size
statement.
Use the “Ten-Minute Quiz” questions #4, #6, and #7 to reinforce the learning concepts.
Learning Unit 22-2: Horizontal and Vertical Analysis of Income
Statements
Summary: Common Size Statements are comparative reports in which each item is expressed as a
percentage of a base amount. A Comparative Income Statement shows data from two or more periods
side by side. (See Figure 22.4) The current year’s income statement figures are placed next to figures from
the preceding year’s income statement. The third column shows the amount of increase or decrease
between the two years. The last column shows the percentage of decrease or increase between the years.
Key Concepts: Trend analysis
Lecture Outline:
1. Horizontal analysis (See Figure 22.4)
a. Column 1 contains the current year data.
2. Vertical analysis (See Figure 22.5) still uses a comparative format.
3. Trend analysis is a type of horizontal analysis that deals with percentage changes in items on the
financial reports for several years. This analysis:
a. Uses a base year to calculate the percentage change within each item.
b. Usually uses the earlier year as the base year.
c. States each item as a percentage of the base year.
Teaching Tips/Strategy: After explaining the procedures for horizontal analysis, trend analysis, vertical
Learning Unit 22-3: Calculate Financial Ratios
Summary: Another method for understanding the numbers on the financial statement is the use of ratio
analysis. A ratio is the relationship of two quantities or numbers, one divided by the other. Ratio analysis
looks at the relationship of figures on the financial statement. To be meaningful, ratios are often compared
with other standards, such as past company ratios or industry-wide ratios. The ratios we discuss fall into
four general categories:
• Liquidity Ratios measure a company’s ability to meet short-term obligations:
o Current Ratio (Current Assets/Current liabilities)
o Acid Test Ratio: (Current Assets-Merchandise Inventory-Prepaid expenses/Current
Liabilities)
• Asset Management Ratios measure how effectively a company is using its assets.
o Accounts Receivable Turnover: Net Credit Sales / Average Accounts Receivable)
• Debt Management Ratios measure how well a company is using debt versus its equity position.
o Debt to Total Assets: Total Liabilities / Total Assets
o Debt to Stockholders’ Equity: Total Liabilities / Stockholder’s Equity
o Times Interest Earned: Income Before Taxes and Interest Expense / Interest Expense
• Profitability Ratios measure a company’s ability to earn profits.
o Gross Profit Rate: Gross Profit / Net Sales
o Return on Sales: Net Income Before Taxes / Net Sales
Key Concepts: Ratio, ratio analysis, liquidity ratios, asset management ratios, debt management ratios,
profitability ratios, current ratio, acid test ratio, quick assets, accounts receivable turnover ratio, average
Lecture Outline:
Ratios are relationships of two quantities or numbers, one divided by the other.
2. Company ratios analyze different aspects of the business.
There are four major categories of ratios
1. Liquidity Ratios: measure a company’s ability to pay its short-term debt.
a. Current Ratio: Current Assets / Current Liabilities
(a) Indicates a company’s ability to pay its short-term debt.
(b) Does not provide as much certainty as the acid test ratio.
Example:
b. Acid Test Ratio (Quick Ratio):
(a) Quick assets are those assets – mainly cash, accounts receivable, and notes
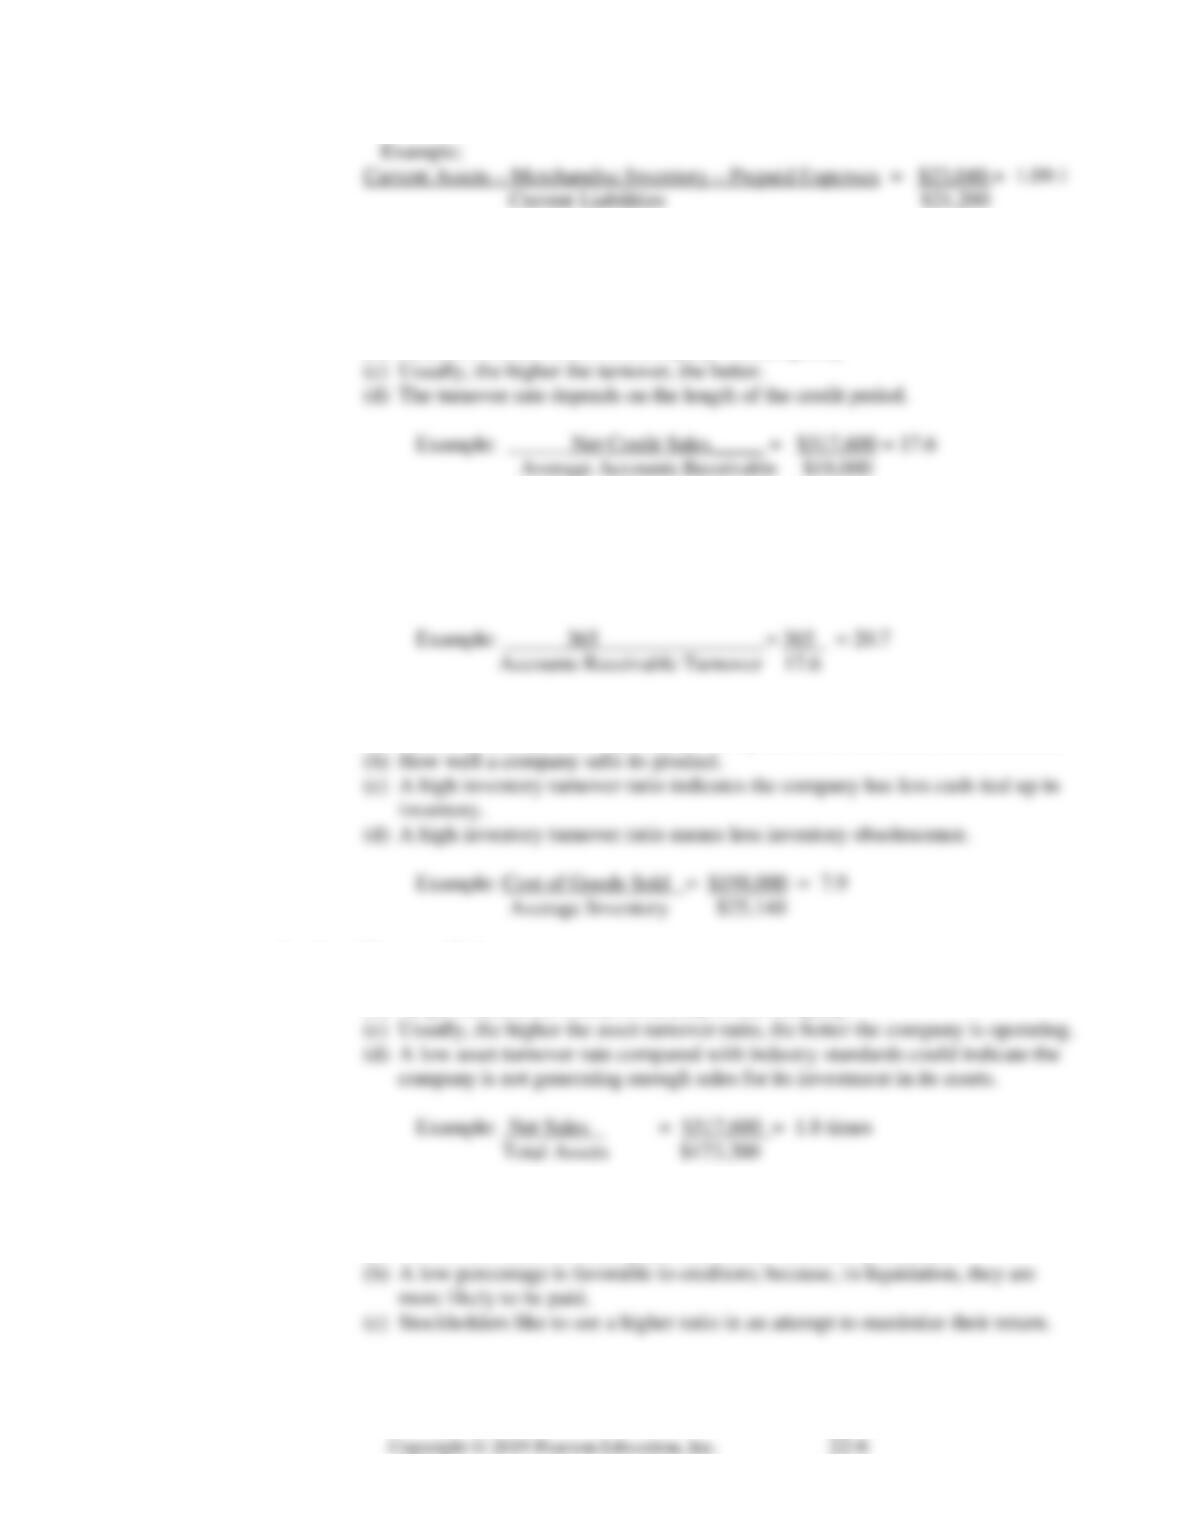
2. Asset Management Ratios: measure how effectively a company uses its assets
a. Accounts Receivable Turnover Ratio –
(a) A ratio that indicates the number of times accounts receivables are converted to
cash within a given period.
(b) Measures effectiveness of a company’s credit policy.
b. Average Collection Period:
(a) A ratio that shows how long it takes to collect the average accounts receivable.
(b) Accounts Receivable Turnover is calculated first, and the turnover is used in this
calculation.
c. Inventory Turnover Ratio:
(a) Ratio that indicates how quickly inventory moves off the shelf, and, therefore,
d. Asset Turnover Ratio:
(a) A ratio that indicates how efficiently a company uses its assets to generate sales.
(b) Helps measure the overall efficiency of the company.
3. Debt Management Ratios: measure a company’s mix of debt and equity financing.
a. Debt to Total Asset ratio:
(a) Shows how much of a company’s assets are financed by creditors.
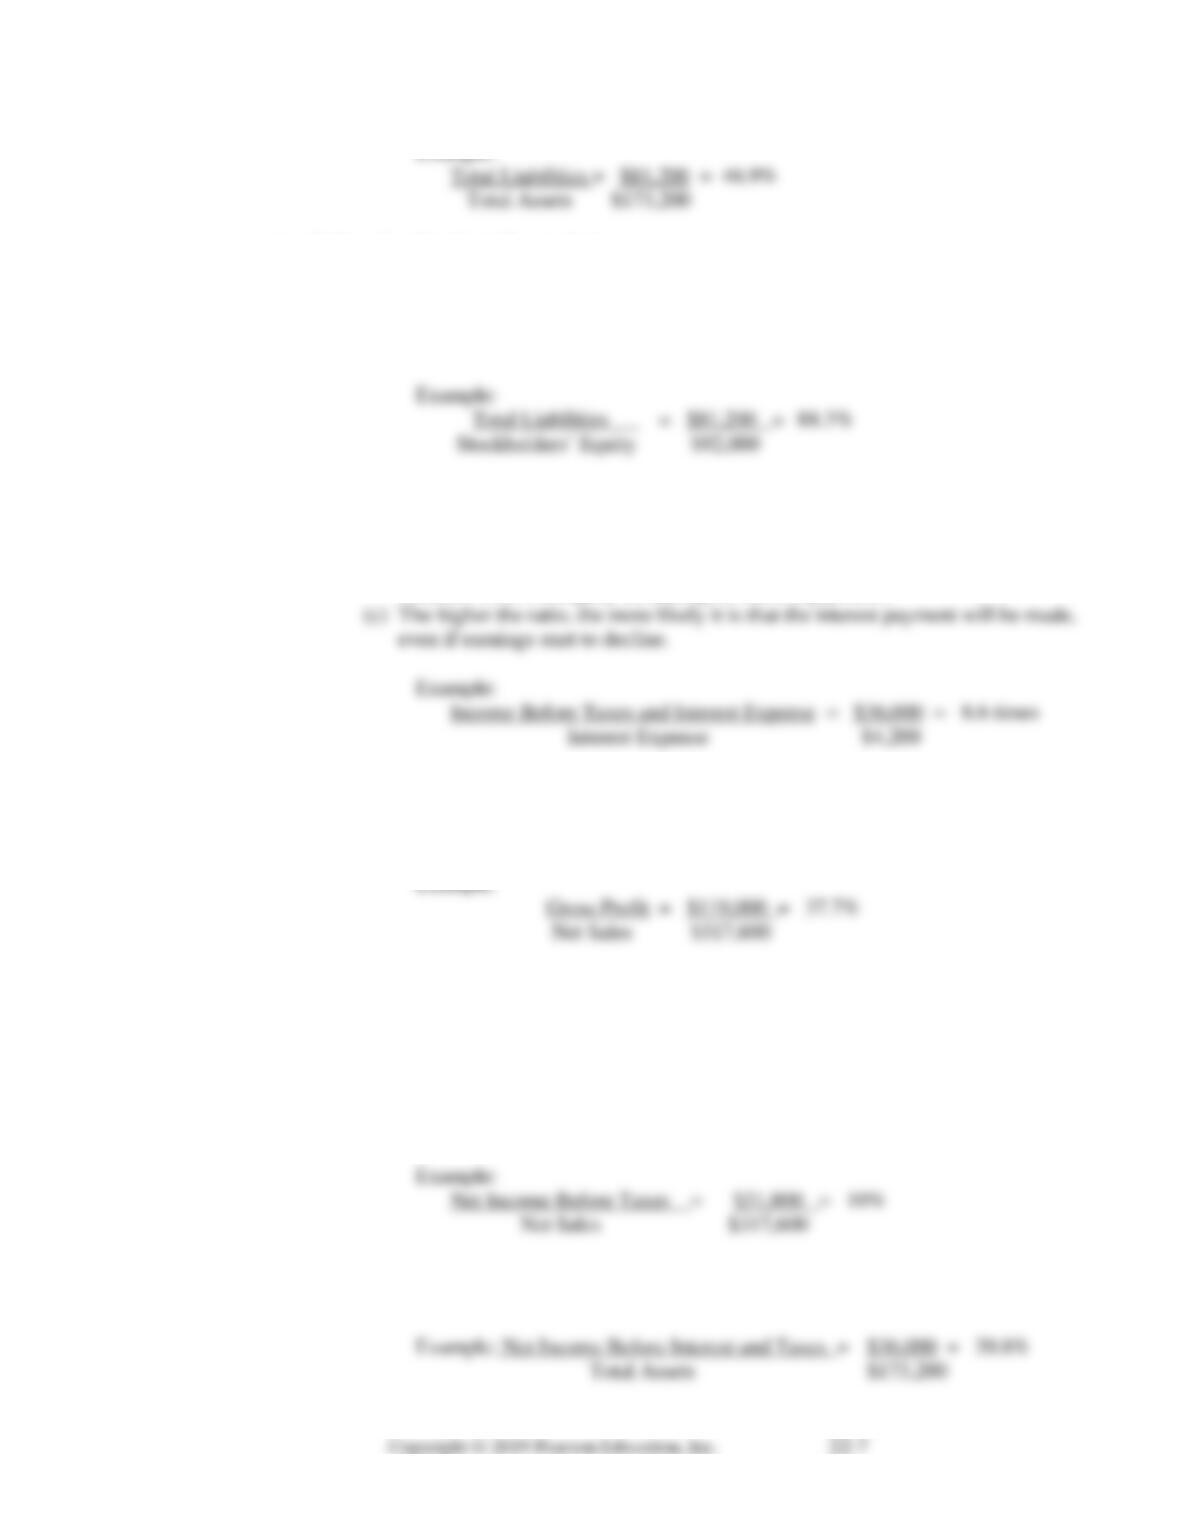
Example:
b. Debt to Stockholders’ Equity Ratio:
(a) Ratio in which total liabilities are divided by the amount of stock that is owned.
(b) Measures the risk creditors run in comparison with stockholders.
(c) There is no guideline as to what the ratio of debt to stockholders’ equity should
be:
c. Times Interest Earned (Interest Coverage Ratio):
(a) Ratio that indicates the degree of risk to lenders that a company will default on
its interest payments.
(b) Creditors are interested in this ratio because it indicates the degree of risk to
creditors from a company defaulting on interest payments.
4. Profitability Ratios: measure a company’s ability to earn a profit.
a. Gross Profit rate:
(a) Indicates how well net sales covers administrative and selling expenses.
b. Return on Sales ratio:
(a) Shows the relationship of net income before taxes to net sales
(b) Measures the effectiveness of a company’s pricing policies.
(c) Stores with low inventory turnover will have a high return on sales because the
goods are priced high.
(d) Stores that have a high inventory (grocery stores) will price its goods lower,
resulting in a lower return per dollar of sales.
c. Return on Total Assets ratio:
(a) Measures how widely a company has invested in and managed its assets.
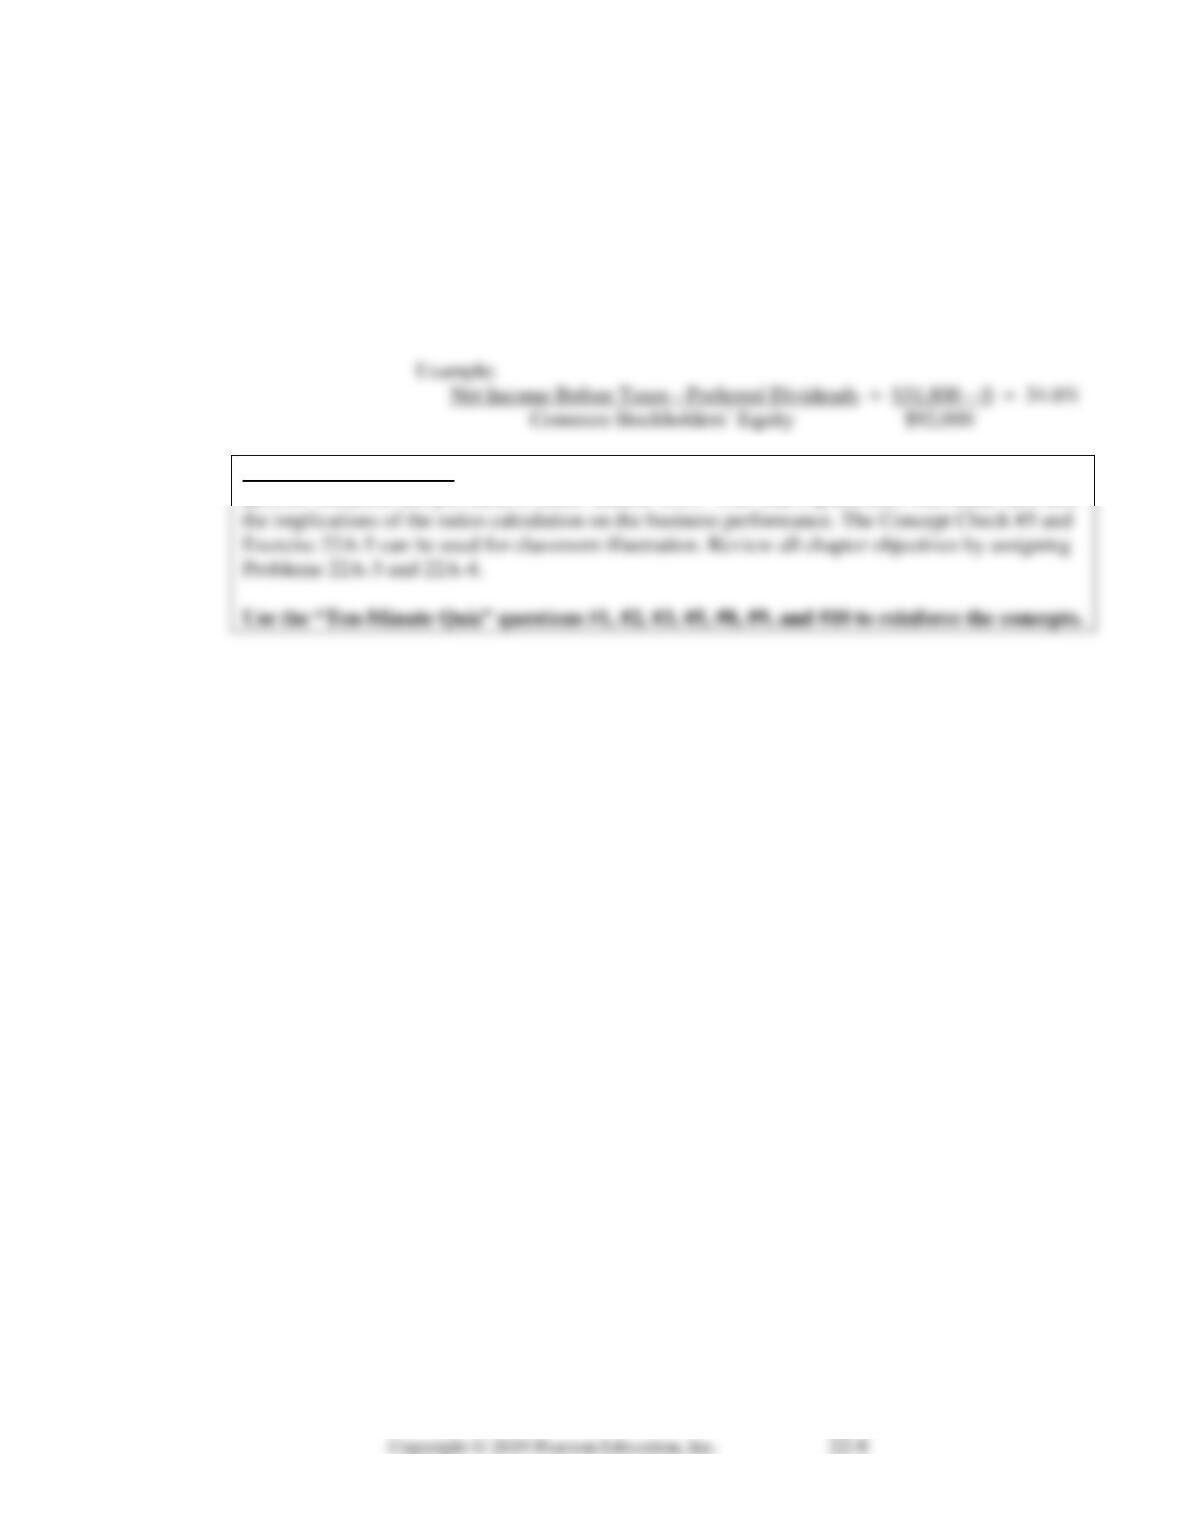
d. Return on Common Stockholders’ Equity ratio:
(a) Indicates how well a company is managing debt financing to earn a profit for
holders of common stock.
(b) Aids in evaluating how well it is earning profit for its common stockholders.
(c) Return has to be compared with that of the competitors.
(d) If the rate is higher than the industry standards, the company is using debt
financing wisely.
Teaching Tips/Strategy: Refer students to the Demonstration Summary Problem for the five
quizzes. Solutions are provided to check student work. After that explain each individual ratio and

Name Date Section
CHAPTER 22
TEN-MINUTE QUIZ
Circle the letter of the best response.
1. Which stakeholder would be most interested in the company’s profitability?
a. investors b. IRS
c. creditors d. management
2. Which stakeholder would be most interested in the company’s ability to pay principal and interest?
a. investors b. IRS
c. creditors d. management
3. Which stakeholder would be most interested in the company’s operations being efficient?
a. investors b. IRS
c. creditors d. management
4. The main way(s) to analyze financial statements are:
a. common-size analysis
b. inventory and accounts receivable turnover
c. horizontal and vertical analysis
d. trend analysis
5. Which of the following is a liquidity ratio?
a. accounts receivable turnover b. current ratio
c. debt to total assets d. gross profit rate
6. Horizontal analysis is also known as:
a. trend analysis b. common-size analysis
c. vertical analysis d. profitability analysis
7. Vertical analysis is also known as:
a. trend analysis b. common-size analysis
c. vertical analysis d. profitability analysis
8. Which of the following is an asset management ratio?
a. acid test ratio b. average collection period
c. debt to stockholders’ equity d. return on sales
9. Which of the following is a debt management ratio?
a. rate of return on total assets b. inventory turnover
c. current ratio d. times interest earned
10. Which of the following is a profitability ratio?
a. rate of return on common stockholders’ equity
b. debt to total assets
c. acid test ratio
d. accounts receivable turnover

Answer Key to Chapter 22 Quiz
6. a