Chapter 22
Performance Measurement and
Responsibility Accounting
QUESTIONS
1. Many companies are divided into departments when they become too large to be
effectively managed as single units. This division into departments is often needed
so that the responsibilities for the activities of a unit do not overwhelm the
manager’s ability to oversee and control them effectively. Also, departments can be
organized to take advantage of the specialized skills of each manager.
2. Operating departments are directly involved in manufacturing or selling the
products or services of a business. Service departments support operating
departments through activities such as accounting, payroll, and legal services.
3. Controllable costs of a department are those that the department’s manager has the
power to control, determine or at least strongly influence. The manager does not
have the power to control, determine or influence the amounts of uncontrollable
costs. The controllable/uncontrollable distinction must be drawn with regard to a
specific manager because costs that are uncontrollable at one level of management
may be controllable at the next higher level. Also, the distinction must be drawn
within the context of a given time period because all costs tend to become
controllable over the long run (at least by top management).
4. Uncontrollable costs are not within the manager’s control or influence.
9. a. Sales of the departments or the number of employees in each department.
b. Square feet of floor space, perhaps adjusted for its value.
c. Square feet of floor space or cubic feet of space occupied.
d. Number, size, and usage time of lights in each department.
e. Square feet of floor space occupied.
f. Sales in each selling department.
g. Insured value of equipment in each department.
h. Assessed value of equipment in each department.
10. A department’s contribution to overhead is measured by subtracting its direct
expenses from its revenues.
11. The individual responsible for controlling the cost needs timely reports with specific
cost information. This individual has the power to adjust cost levels to more
efficient and/or effective levels.
12. A transfer price is an amount used to record transactions made between divisions
within the same company. The three main approaches to transfer pricing are: cost-
based, negotiated, and market pricing.
13.B A market-based transfer price is most likely to be used when a) the item being
transferred has a readily available substitute with a market price and b) the
transferor division is operating at full capacity.
14.C A joint cost is incurred to produce or purchase two or more different products at the
same time. Joint costs are usually allocated to products in proportion to the sales
values of the joint products, called value basis of allocation. Another, less common,
method of joint cost allocation is called the physical basis of allocation.
QUICK STUDIES
Quick Study 22-1 (10 minutes)
1.
A
4.
C
2.
F
5.
D
3.
B
6.
E
Quick Study 22-2 (5 minutes)
1.
D
3.
B
Quick Study 22-3 (10 minutes)
Controllable costs for the service department would include:
Cost of parts ……………………………………………………………………
$22,400
Mechanics’ wages ……………………………………………………….
14,300
Quick Study 22-4 (10 minutes)
% of
Advertising to
Allocated
Department
Sales
Total
allocate
amount
1 …………………………………
$220,000
27.5%
$100,000
$ 27,500
2 …………………………………
400,000
50.0%
100,000
50,000
3 …………………………………
180,000
22.5%
100,000
22,500
Total …………………………..
$800,000
100.0%
$100,000
Quick Study 22-5 (10 minutes)
% of
Admin. Exp.
Allocated
Department
Employees
Total
amount
Mixing …………………………
60.0%
$160,000
$ 96,000
Bottling ……………………….
40.0%
160,000
64,000
Total …………………………..
100.0%
Quick Study 22-6 (10 minutes)
% of
Maint. Exp.
Allocated
Department
Sq. Feet
Total
to allocate
amount
Mixing …………………………
55.0%
$200,000
Bottling ……………………….
45.0%
200,000
90,000
Quick Study 22-7 (15 minutes)
The first step is to allocate total rent expense between the two floors.
Amount
Allocated
% of Total
Cost
$ 84,500
$130,000
First Floor
Sq. Feet
% of Total
Cost
Jewelry Dept. ……………………..
1,440
30%
$25,350
Cosmetics Dept. …………………
3,360
70
59,150
Totals …………………………..
4,800
100%
$84,500
Second Floor
Sq. Feet
% of Total
Cost
Tools Dept. ………………………..
1,824
Totals …………………………..
4,800
Quick Study 22-8 (15 minutes)
Departmental contribution to overhead
Dept. A: $18,815 – $ 3,660 = $15,155
Dept. B: $76,300 – $37,060 = $39,240
Dept. C: $34,440 – $ 7,386 = $27,054
Departmental contribution to overhead (as a percent of sales)*
Dept. A: $15,155 / $ 53,000 = 28.6%
Dept. B: $39,240 / $180,000 = 21.8%
Dept. C: $27,054 / $ 84,000 = 32.2%
*Rounded to one decimal place
Dept. B contributes the highest dollar amount to overhead.
Dept. C generates the highest contribution percentage to overhead.
Quick Study 22-9 (10 minutes)
Return on
Quick Study 22-10 (10 minutes)
Cameras &
camcorders
Phones &
communication
Computers &
accessories
Quick Study 22-11 (15 minutes)
Investment center A:
Return on investment = Net income / Average invested assets
= $352,000 / $1,400,000 = 25%
Profit margin = Net income / Sales
0.08 = $352,000 / Sales, thus Sales = $4,400,000
Investment turnover = Sales / Average invested assets
= $4,400,000 / $1,400,000 = 3.14
Quick Study 22-11 (continued)
Investment center B:
Return on investment = Profit margin x Investment turnover
0.12 = Profit margin x 1.5
Thus,
Profit margin = 0.12 / 1.5 = 0.08, or 8%
Profit margin = Net income / Sales
0.08 = Net income / $10,400,000
Thus,
Net income = $832,000
Investment turnover = Sales / Average invested assets
1.5 = $10,400,000 / Average invested assets
Quick Study 22-12 (10 minutes)
Quick Study 22-13 (5 minutes)
1. C 5. I
2. I 6. P
Quick Study 22-14 (10 minutes)
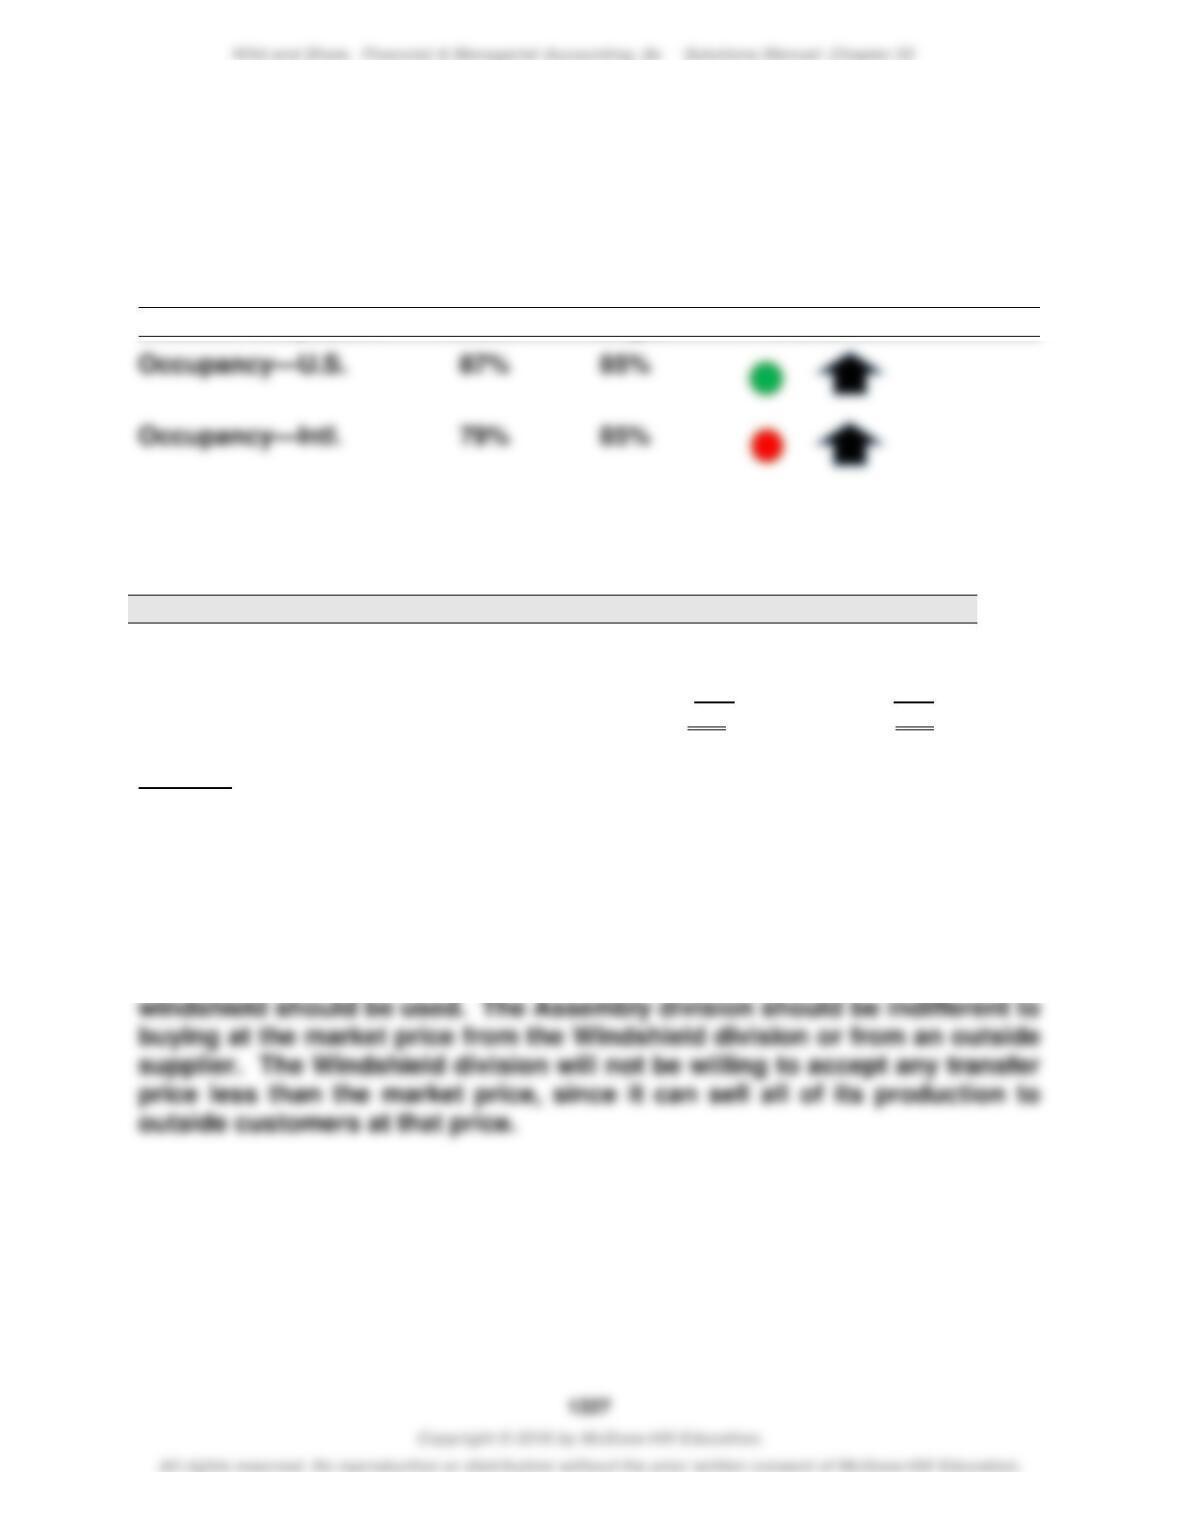
The U.S. division exceeded the occupancy target for the current year. Both
the U.S. and International divisions improved on occupancy performance
during the current year.
Process Perspective Actual Target Trend
Quick Study 22-15 (10 minutes)
Spartan Co.
Chen Co.
Days’ sales in accounts receivable…
32
45
Days’ sales in inventory.………………
20
24
Days’ payable outstanding………….
(27)
(32)
Cash conversion cycle………………..
25
37
Spartan is more effective at managing cash since its cash conversion cycle
is shorter.
Quick Study 22-16B (10 minutes)
Without excess capacity, a market-based transfer price of $450 per
Quick Study 22-17B (10 minutes)
Quick Study 22-18C (15 minutes)
Total joint cost = $325,000 + $50,000 = $375,000
Unit A market value (3,340 x $1.00) …………………………
$3,340
Unit B market value (6,680 x $0.75) …………………………
5,010
Total market value …………………………………………………
$8,350
Unit B joint cost = $375,000 x ($5,010 / $8,350) = $225,000
Quick Study 22–19 (5 minutes)
Average invested assets = (€12,888 + €13,099) / 2
= €12,994 (rounded)
Return on investment (assets) = €3,385 / €12,994
= 26.05% (rounded)
EXERCISES
Exercise 22-1 (15 minutes)
Responsibility Accounting Performance Report
Dept. Manager, Snowmobile Department
For the Year
Budgeted
Actual
Over (Under)
Amount
Amount
Budget
Controllable Costs
Raw materials …………………………..
$19,500
$19,420
$ (80)
Employee wages ………………………..
10,400
10,660
260
Supplies used …………………………..
3,300
3,170
(130)
Depreciation—Equipment …………..
6,000
6,000
0
Totals ………………………………………..
$39,200
$39,250
$ 50
Exercise 22-2 (15 minutes)
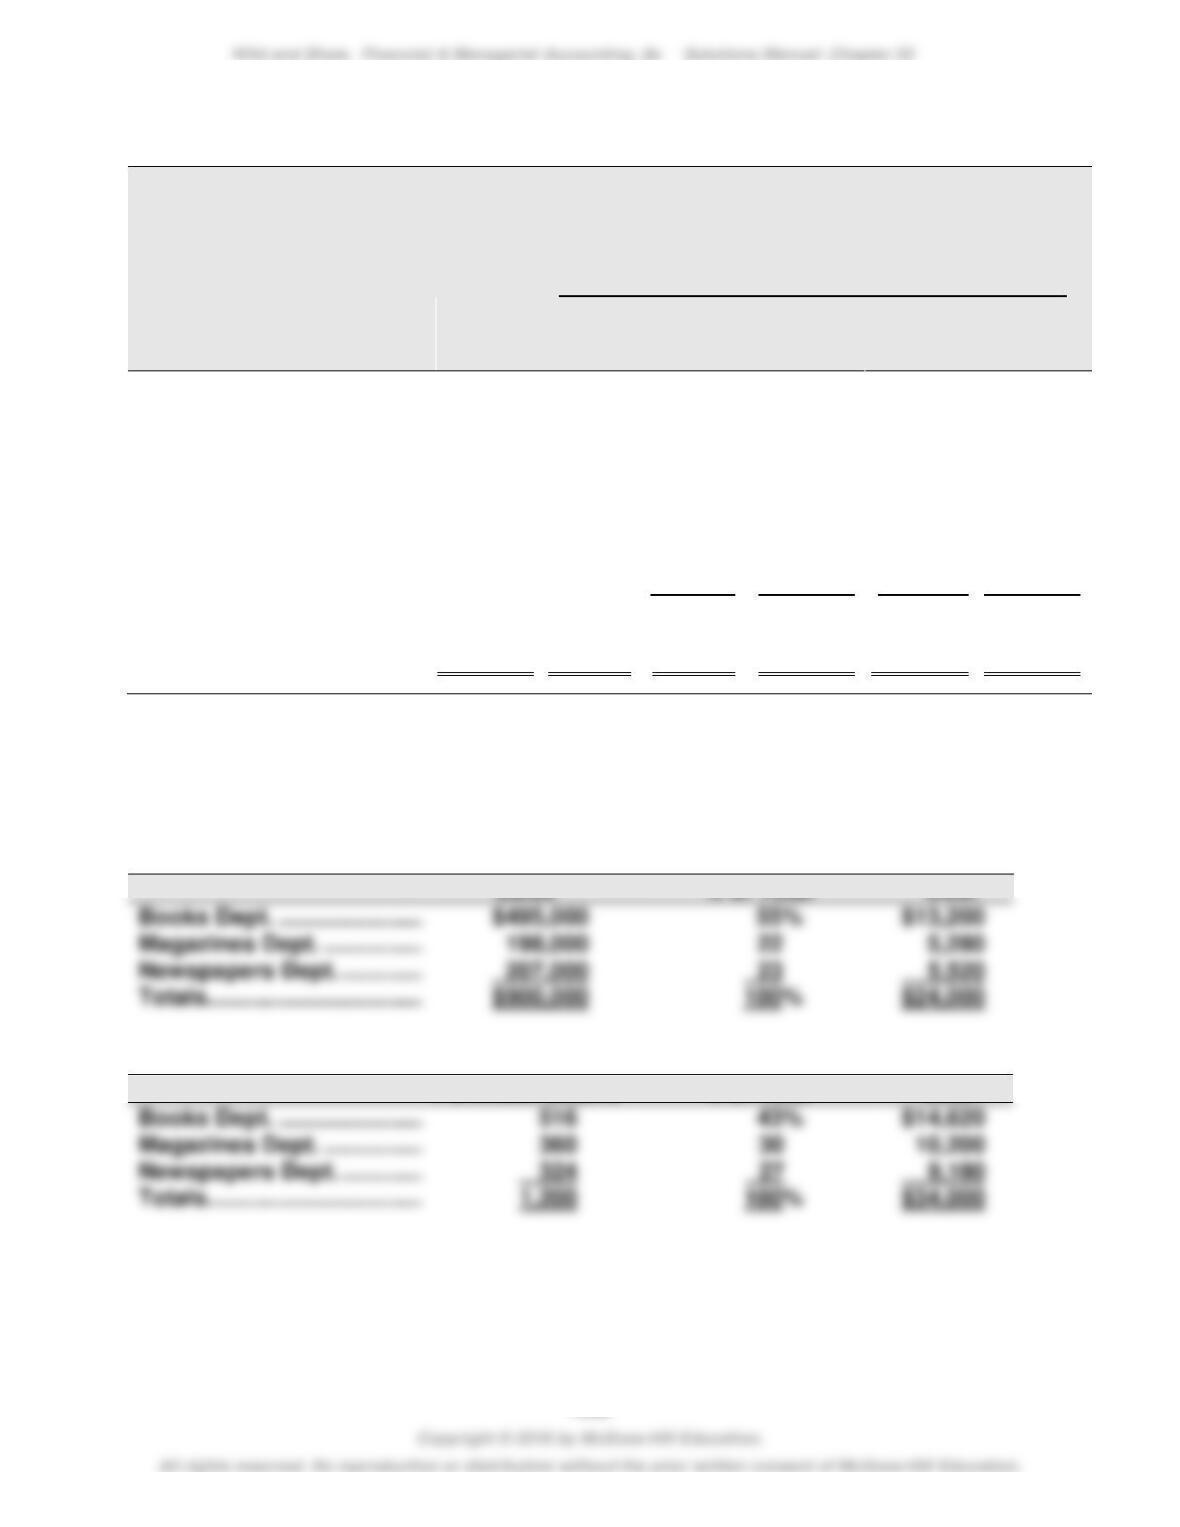
Responsibility Accounting Performance Report
Dept. Manager, ATV Department
For the Year
Budgeted
Actual
Over (Under)
Amount
Amount
Budget
Controllable Costs
Raw materials …………………………..
Employee wages ………………………..
20,500
21,240
740
Depreciation—Equipment …………..
12,500
Totals ………………………………………..
$61,400
$63,480
Exercise 22-3 (25 minutes)
COZY BOOKSTORE
Departmental Expense Allocation Spreadsheet
For Period Ended _______
Allocation of Expenses to Departments .
Alloca-
tion Base
Exp.
Account
Balance
Adver-
tising
Dept.
Purch-
asing
Dept.
Books
Dept.
Maga-
zines
Dept.
News-
papers
Dept.
Total dept. exp. ………………..
$698,000
$24,000
$34,000
$425,000
$ 90,000
$125,000
Service Dept. Expenses
Advertising Dept. ……………….
Sales
(24,000)
13,200
5,280
5,520
Purchasing
Dept. …………………………..
Purch.
orders
______
(34,000)
14,620
10,200
9,180
Total expenses
allocated to
operating depts.
$698,000
$ 0
$ 0
$452,820
$105,480
$139,700
Computations for allocations of service dept. costs to operating departments
Advertising: $24,000
Books Dept. ………………………….
$495,000
Magazines Dept. ……………………
Newspapers Dept. …………………
Purchasing: $34,000
Purchase Orders
% of Total
Cost
Magazines Dept. ……………………
Newspapers Dept. …………………
Exercise 22-4 (20 minutes)
Allocation of annual wages between the two departments
Hours Worked*
% of Total
Cost
Jewelry Dept. …………………………..
57
75%
$22,500
Cosmetics Dept. ………………………….
19
25
$ 7,500
Totals …………………………………………
76
100%
$30,000
Exercise 22-5 (25 minutes)
1. Allocation of Indirect Expenses to Four Operating Departments
Supervision expenses
Department
Employees
% of Total
Cost
Materials …………………………..
27
18%
$14,850
Personnel …………………………..
9
6
4,950
Manufacturing ……………………
63
42
34,650
Packaging ………………………….
51
34
28,050
Totals …………………………..
150
100%
$82,500
Utilities expenses
Materials …………………………..
25%
$12,500
Personnel …………………………..
5
2,500
Manufacturing ……………………
55
27,500
Packaging ………………………….
15
7,500
Totals …………………………..
$50,000
Insurance expenses
Department
Assets Value
% of Total
Cost
Materials …………………………..
10%
$ 2,250
Personnel …………………………..
2
Packaging ………………………….
25
5,625
Totals …………………………..
$22,500
2. Report of Indirect Expenses Assigned to Four Operating Departments
Supervision
Utilities
Insurance
Total
Materials …………………………..
$14,850
$12,500
$ 2,250
$ 29,600
Personnel …………………………..
4,950
2,500
450
$ 7,900
Manufacturing ……………………
34,650
27,500
14,175
$ 76,325
Packaging ………………………….
28,050
7,500
5,625
$ 41,175
Totals …………………………..
$82,500
$50,000
$22,500
$155,000
Exercise 22-6 (20 minutes)
MARATHON RUNNING SHOP
Departmental Expense Allocation Spreadsheet
For Year Ended December 31, 2019
Allocation of Expenses to Departments .
Alloca-
tion
Base
Expense
Account
Balance
Adver-
tising
Dept.
Admini-
strative
Dept.
Shoes
Dept.
Clothing
Dept.
Direct expenses …………
$161,000
$18,000
$25,000
$103,000
$15,000
Indirect utilities
expenses. ………………..
Sq.
feet
64,000
5,120
6,400
32,640
19,840
Total dept. exp. ………….
225,000
23,120
31,400
135,640
34,840
Service Dept. Expenses
Advertising Dept.……….
Ads
(23,120)
17,340
5,780
Administrative Dept. ….
Sales
______
(31,400)
24,492
6,908
Total exp. allocated
to operating depts.. ….
$225,000
$ 0
$ 0
$177,472
$47,528
Supporting expense allocation calculations
Utilities expense: $64,000
% of Total
Cost
Advertising expense: $23,120
Ads Placed
% of Total
Cost
75%
Administrative expense: $31,400
Sales
% of Total
Cost
(1)
WHOLESALE GUITARS
Departmental Contribution Statements
For Year Ended December 31, 2019
Acoustic
Electric
Dept.
Dept.
Combined
Sales ………………………………….
$112,500
$105,500
$218,000
Cost of goods sold …………….
55,675
66,750
122,425
Gross profit ……………………….
56,825
38,750
95,575
Direct expenses
Salaries expense ………………..
17,300
13,500
30,800
Deprec. expense-Equip. ……..
10,150
9,000
19,150
Supplies expense……………….
2,030
1,700
3,730
Rent expense ……………………..
12,055
Advertising expense …………..
Total indirect expenses ………
(2) Based on departmental contribution to overhead, the Electric guitar
department should not be eliminated, as it contributes $14,550 to
covering indirect expenses.
Exercise 22-8 (25 minutes)
1.
JANSEN COMPANY
Departmental Income Statement—Ski Department
For Year Ended December 31, 2019
Ski Dept.
Sales ………………………………………
$605,000
Cost of goods sold …………………
425,000
Gross profit …………………………...
Operating expenses
Salaries ………………………………..
Utilities …………………………………
Depreciation …………………………
Office expenses ……………………
180,000
112,000
14,000
42,000
20,000
Operating income (loss) ………….
$ (8,000)
2.
JANSEN COMPANY
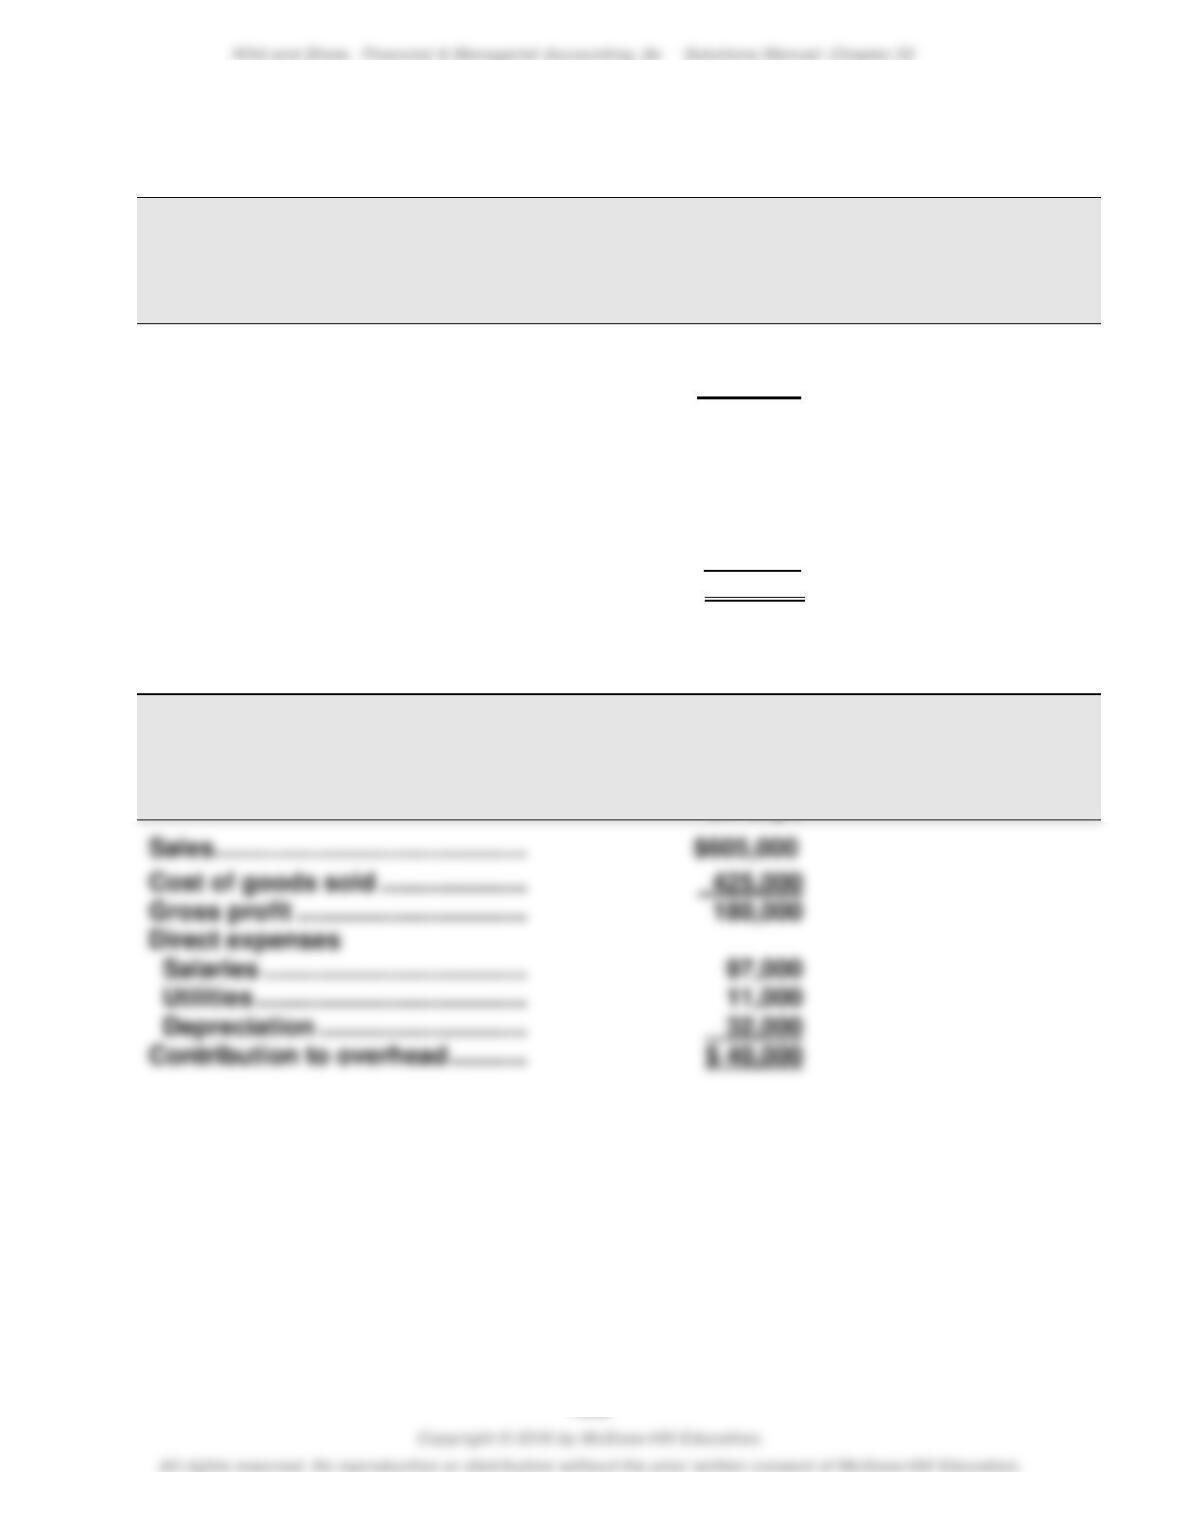
Departmental Contribution to Overhead—Ski Department
For Year Ended December 31, 2019
Ski Dept.
Sales ………………………………………
Cost of goods sold …………………
425,000
3. Based on these performance reports, the Ski department should not be
eliminated. It generates a positive contribution to overhead.
Exercise 22-9 (15 minutes)
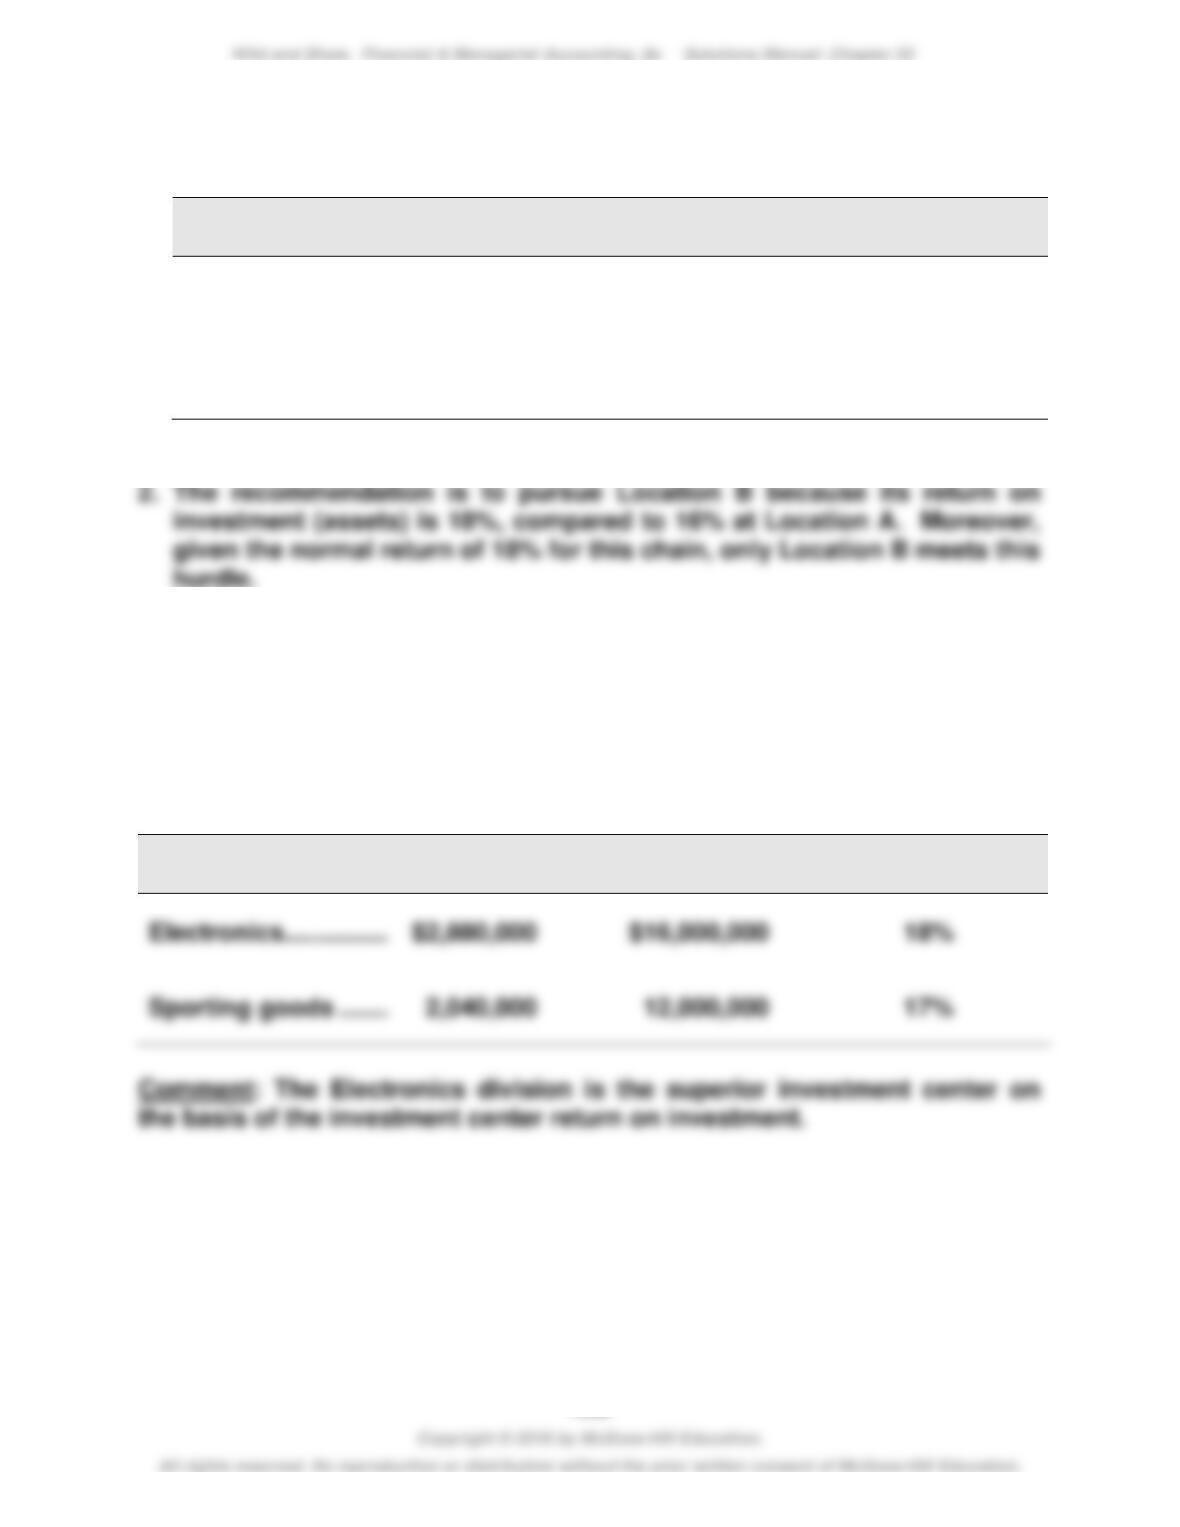
1.
Location
Net income
Average assets
Return on
investment
Location A …………………..
$160,000
$1,000,000
16%
Location B …………………..
$108,000
$ 600,000
18%
Exercise 22–10 (20 minutes)
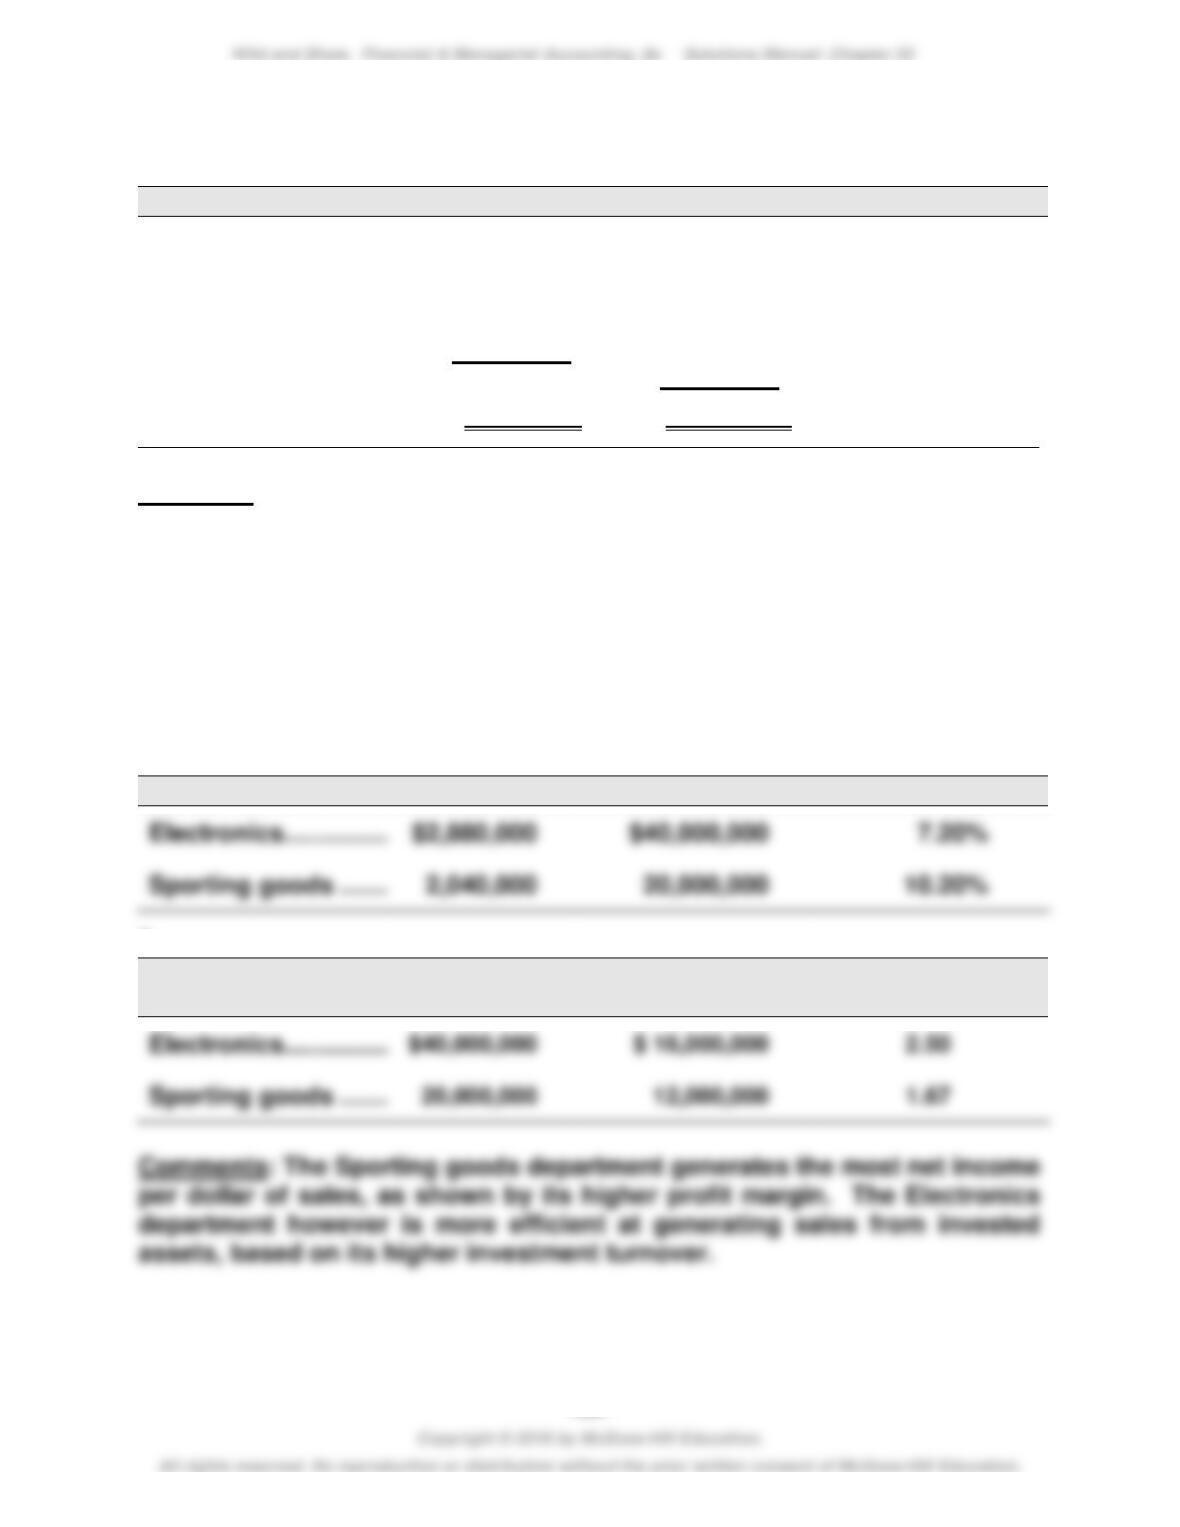
(1)
Investment center
Income
Average assets
Return on
investment
$16,000,000
Exercise 22–10 (continued)
(2)
Investment Center
Electronics
Sporting goods
Net income ………………..
$2,880,000
$2,040,000
Target net income
$16,000,000 x 12% …..
12,000,000 x 12% ……
(1,920,000)
(1,440,000)
Residual income……… $ 960,000 $ 600,000
Comment: The Electronics department is the superior investment center on
the basis of investment center residual income.
(3) The Electronics department should accept the new opportunity because
it will generate residual income of 3% (15% – 12%) of the investment’s
invested assets.
Exercise 22-11 (15 minutes)
1.
Investment Center
Income
Sales
Profit margin
2.
Investment Center
Sales
Average assets
Investment
turnover
(1)
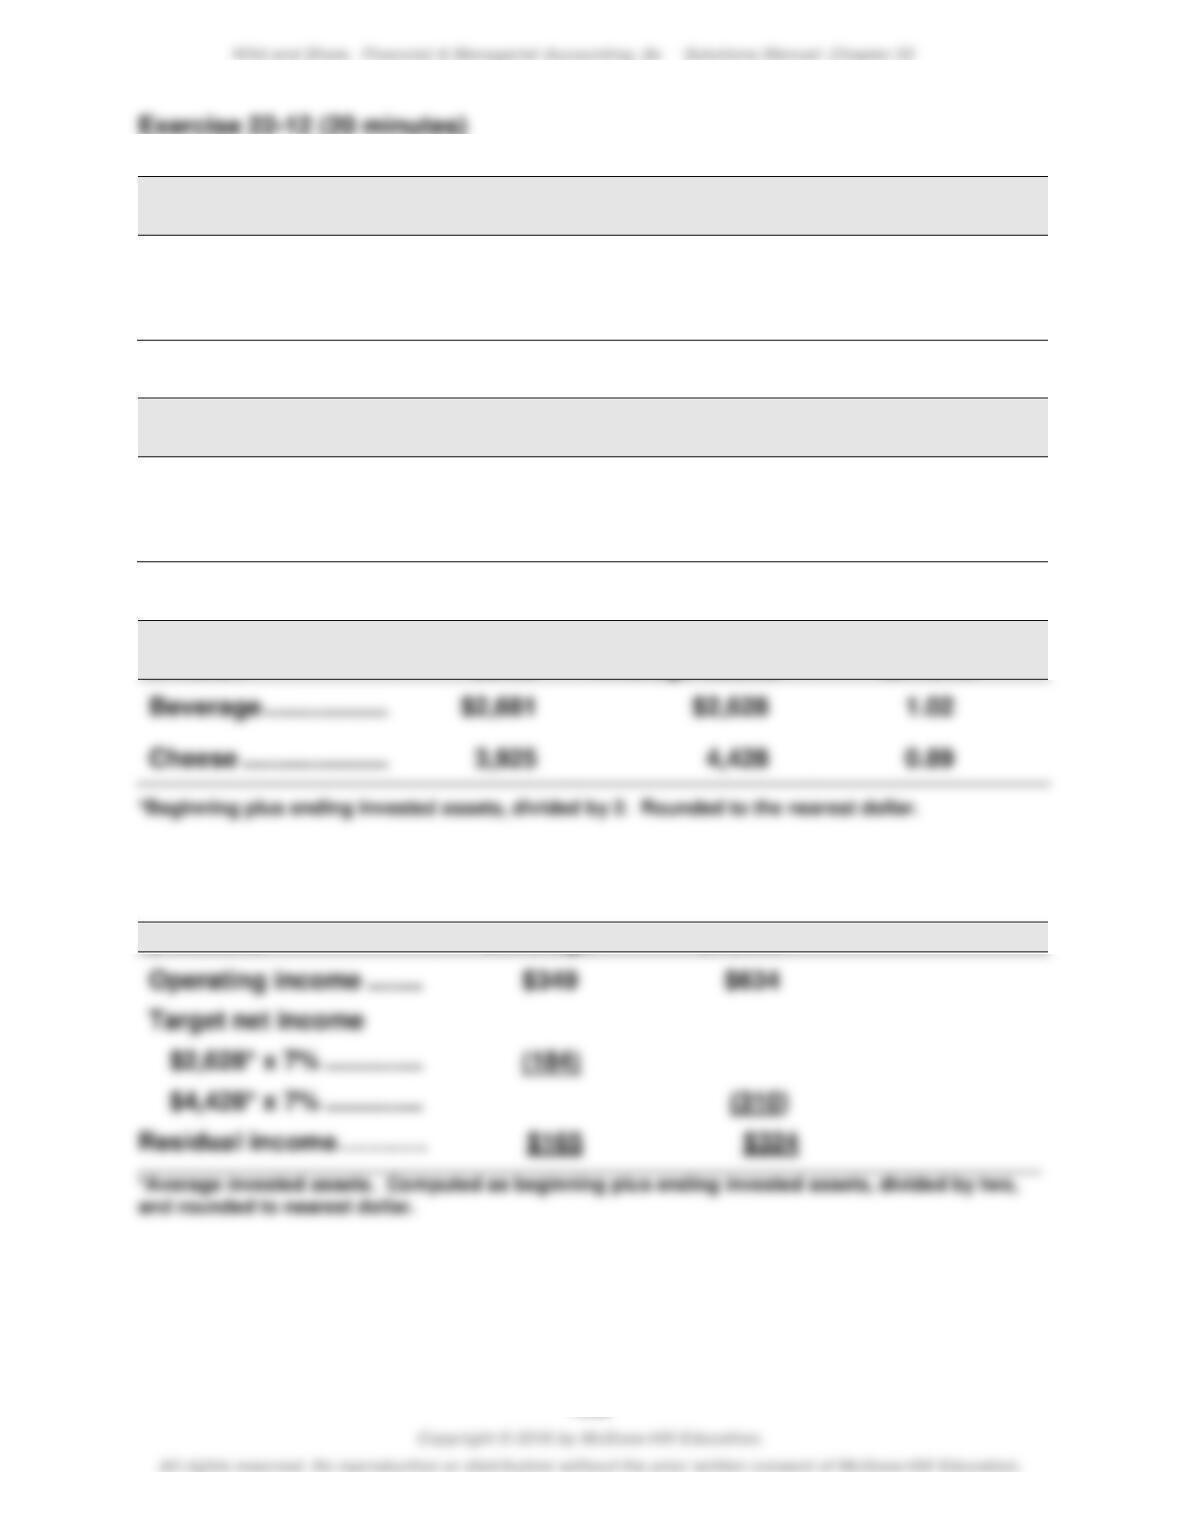
Division
Operating
income
Average assets*
Return on
investment
Beverage …………………..
$349
$2,628
13.28%
Cheese ……………………..
634
4,428
14.32%
(2)
Division
Operating
income
Sales
Profit margin
Beverage …………………..
$349
$2,681
13.02%
Cheese ……………………..
634
3,925
16.15%
(3)
Division
Sales
Average assets*
Investment
turnover
Beverage …………………..
Cheese ……………………..
4,428
Exercise 22-13 (10 minutes)
$ millions
Beverage
Cheese