CHAPTER 22
COST-VOLUME-PROFIT
Learning Objectives
1. EXPLAIN VARIABLE, FIXED, AND MIXED COSTS AND
THE RELEVANT RANGE.
2. APPLY THE HIGH-LOW METHOD TO DETERMINE
THE COMPONENTS OF MIXED COSTS.
3. PREPARE A CVP INCOME STATEMENT TO
DETERMINE CONTRIBUTION MARGIN.
4. COMPUTE THE BREAK-EVEN POINT USING THREE
APPROACHES.
5. DETERMINE THE SALES REQUIRED TO EARN
TARGET NET INCOME AND DETERMINE MARGIN OF
SAFETY.
6. USE CVP ANALYSIS TO RESPOND TO CHANGES IN
THE BUSINESS ENVIRONMENT.
*7. EXPLAIN THE DIFFERENCE BETWEEN ABSORPTION
COSTING AND VARIABLE COSTING.
CHAPTER REVIEW
Cost Behavior Analysis
1. Cost behavior analysis is the study of how specific costs respond to changes in the level of
business activity. A knowledge of cost behavior helps management plan operations and decide
between alternative courses of action.
2. The activity index identifies the activity that causes changes in the behavior of costs; examples
include direct labor hours, sales dollars, and units of output. Once an appropriate activity index is
chosen, costs can be classified as variable, fixed or mixed.
Variable and Fixed Costs
3. (L.O. 1) Variable costs are costs that vary in total directly and proportionately with changes in the
activity level. Examples of variable costs include direct materials and direct labor, cost of goods sold,
sales commissions, and freight out. A variable cost may also be defined as a cost that remains
the same per unit at every level of activity.
4. Fixed costs are costs that remain the same in total regardless of changes in the activity level.
Examples include property taxes, insurance, rent, supervisory salaries, and depreciation. Fixed
costs per unit vary inversely with activity; as volume increases, unit cost declines and vice versa.
Mixed Costs
5. Mixed costs are costs that contain both a variable element and a fixed element; they increase in
total as the activity level increases, but not proportionately. For purposes of CVP analysis, mixed
costs must be classified into their fixed and variable elements.
Relevant Range
6. The range over which a company expects to operate during the year is called the relevant range.
Within the relevant range a linear (straight-line) relationship exists for both variable and fixed
costs.
7. (L. O. 2) The high-low method uses the total costs incurred at the high and low levels of activity.
The difference in costs represents variable costs, since only the variable cost element can change
as activity levels change.
8. The steps in computing fixed and variable costs under the high-low method are:
a. Determine variable cost per unit from the following formula:
High minus
Low Total
Costs
÷
High minus Low
Activity Level
=
Variable Cost per
Unit
b. Determine the fixed cost by subtracting the total variable cost at either the high or the low
activity level from the total cost at that activity level.
Cost-Volume-Profit Analysis
9. Cost-volume-profit (CVP) analysis is the study of the effects of changes in costs and volume on
a company’s profits. It is a critical factor in such management decisions as profit planning, setting
selling prices, determining the product mix, and maximizing use of production facilities.
10. CVP analysis considers the interrelationships among the following components: (a) volume or
level of activity, (b) unit selling prices, (c) variable cost per unit, (d) total fixed costs, and (e) sales mix.
Basic CVP Components
11. The following assumptions underlie each CVP analysis:
a. The behavior of both costs and revenues is linear throughout the relevant range of the
activity index.
b. Costs can be classified accurately as either variable or fixed.
c. Changes in activity are the only factors that affect costs.
d. All units produced are sold.
e. When more than one type of product is sold, the sales mix will remain constant.
CVP Income Statement
12. (L.O. 3) The cost-volume-profit (CVP) income statement classifies costs and expenses as
variable or fixed and specifically reports contribution margin in the body of the statement.
Contribution Margin
13. Contribution margin is the amount of revenue remaining after deducting variable costs. The
formula for contribution margin per unit is:
Unit Selling
Price
–
Unit Variable
Cost
=
Contribution
Margin per Unit
14. Contribution margin per unit indicates the amount available to cover fixed costs and contribute to
income. The formula for the contribution margin ratio is:
Contribution
Margin per Unit
÷
Unit Selling
Price
=
Contribution
Margin Ratio
The ratio indicates the portion of each sales dollar that is available to apply to fixed costs and to
contribute to income.
Break-Even Analysis
15. (L.O. 4) The break-even point is the level of activity at which total revenue equals total costs
both fixed and variable. Knowledge of the break-even point is useful to management when it
decides whether to introduce new product lines, change sales prices on established products, or
enter new market areas.
16. A common equation used for CVP analysis is as follows:
Sales = Variable Costs + Fixed Costs + Net Income
17. Under the contribution margin technique, the break-even point can be computed by using
either the contribution margin per unit or the contribution margin ratio.
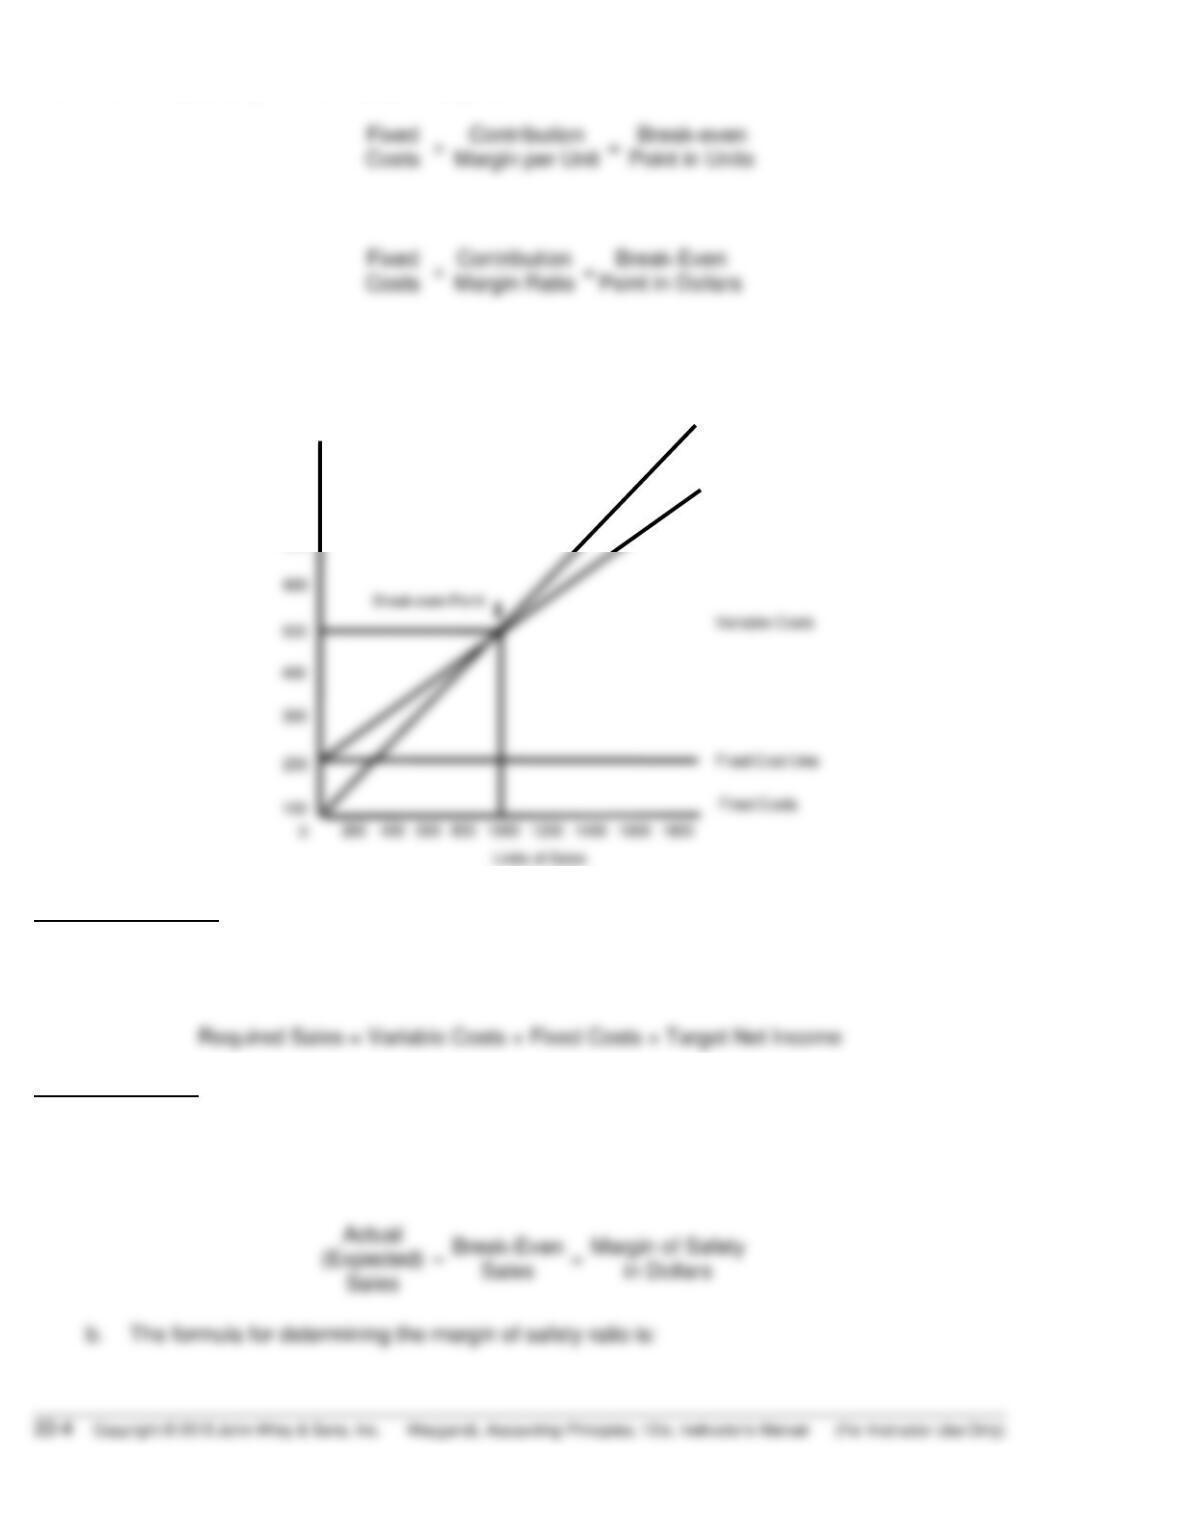
18. The formula, using unit contribution margin, is:
Fixed
Costs
÷
Contribution
Margin per Unit
=
Break-even
Point in Units
19. The formula using the contribution margin is:
Fixed
Costs
÷
Contribution
Margin Ratio
=
Break-Even
Point in Dollars
20. A chart (or graph) can also be used as an effective means to determine and illustrate the break-even
point. A cost-volume-profit (CVP) graph is as follows:
900
800
100
200
200
300
400
500
600
700
Break–even Point
Sales Line
Total Cost Line
400 600 800 1000 1200 1400 1600 1800
Units of Sales
Dollars (000)
Variable Costs
Fixed Cost Line
Fixed Costs
0
Target Net Income
21. (L.O. 5) Target net income is the income objective for individual product lines. The following
equation is used to determine required sales to meet target net income:
Required Sales = Variable Costs + Fixed Costs + Target Net Income
Margin of Safety
22. Margin of safety is the difference between actual or expected sales and sales at the break-even
point.
a. The formula for stating the margin of safety in dollars is:
Actual
(Expected)
Sales
–
Break-Even
Sales
=
Margin of Safety
in Dollars
b. The formula for determining the margin of safety ratio is:
Margin of Safety in
Dollars
÷
Actual
(Expected)
Sales
=
Margin of Safety
Ratio
The higher the dollars or the percentage, the greater the margin of safety.
NOTE – I AM NOT SURE HOW YOU WANT TO INCORPORATE L. O. 6
Absorption and Variable Costing
*23. (L.O. 7) There are two approaches to product costing.
a. Under full or absorption costing all manufacturing costs are charged to the product.
b. Under variable costing, only direct materials, direct labor, and variable manufacturing overhead
costs are product costs; fixed manufacturing overhead costs are treated as period costs
(expenses) when incurred.
*24. The income statement under variable costing is prepared in the cost-volume-profit format.
*25. The effects of the alternative costing methods on income from operations are:
Effects on Income
Circumstance From Operations
Units produced exceed units sold Income under absorption
costing is higher than under
variable costing
Units produced are less than Income under absorption costing
units sold is lower than under variable costing
Units produced equal units sold Income will be equal under both
approaches
*26. The use of variable costing is acceptable only for internal use by management. It cannot be used
in determining product costs in financial statements prepared in accordance with generally
accepted accounting principles because it understates inventory costs.
LECTURE OUTLINE
A. Cost Behavior Analysis.
1. Cost behavior analysis is the study of how specific costs respond to
changes in the level of business activity.
2. The activity index identifies the activity that causes changes in the
behavior of costs. With an appropriate activity index, companies can
classify the behavior of costs into three categories: variable, fixed, or
mixed.
3. Variable costs are costs that vary in total directly and proportionately
with changes in the activity level. A variable cost remains the same per
unit at every level of activity.
4. Fixed costs are costs that remain the same in total regardless of changes
in the activity level.
a. Because total fixed costs remain constant as activity changes, it
follows that fixed costs per unit vary inversely with activity.
b. Examples of fixed costs include property taxes, insurance, rent,
supervisory salaries, and depreciation on buildings and equipment.
5. The relevant range is the range of activity in which a company expects to
operate during a year. It is important in CVP analysis because the behavior
of costs is assumed to be linear (straight-line) throughout the relevant
range. Although the linear (straight-line) relationship may not be
completely realistic, the linear assumption produces useful data for CVP
analysis as long as the level of activity remains within the relevant
range.
6. Mixed costs are costs that contain both a variable element and a fixed
element. Mixed costs change in total but not proportionately with
changes in the activity level.
a. For purposes of CVP analysis, mixed costs must be classified into
their fixed and variable elements. One method that management
may use is the high-low method.
b. The high-low method uses the total costs incurred at the high and
low levels of activity. The difference in costs between the high and
low levels represents variable costs, since only the variable cost
element can change as activity levels change. Fixed costs are
determined by subtracting the total variable cost at either the high
or low activity level from the total cost at that activity level.
MANAGEMENT INSIGHT
The recession that started in 2008 produced a surprise for some manufacturers—
the number of jobs lost was actually lower than in previous recessions. Between
2000 and 2008 many factories adopted lean manufacturing practices that relied
less on large numbers of low skilled workers, and more on machines and a few
highly skilled workers. Because the employees are highly skilled, employers are
reluctant to lose them.
Would you characterize labor costs as being a fixed cost, a variable cost, or
something else in this situation?
Answer: Because these labor costs are essentially unchanged for most levels of
production, they are primarily fixed. However, it could be described as
being a “step function.” If production gets too far outside the normal
range, workers’ hours will change. If production goes too low, hours are
cut, and if it goes too high, overtime hours are needed.
B. Cost-Volume-Profit Analysis.
1. Cost-volume-profit (CVP) analysis is the study of the effects of changes
in costs and volume on a company’s profits. CVP analysis is important in
profit planning. It is useful in setting selling prices, determining product
mix, and maximizing use of production facilities.
2. CVP analysis considers the interrelationships among the following
components:
a. Volume or level of activity.
b. Unit selling prices.
c. Variable cost per unit.
d. Total fixed costs.
e. Sales mix.
3. The following assumptions underlie each CVP analysis:
a. The behavior of both costs and revenues is linear throughout the
relevant range of the activity index.
b. Costs can be classified accurately as either variable or fixed.
c. Changes in activity are the only factors that affect costs.
d. All units produced are sold.
e. When more than one type of product is sold, the sales mix will
remain constant (the percentage that each product represents of
total sales will stay the same).
C. CVP Income Statement.
The CVP income statement classifies costs and expenses as variable or
fixed. It also reports contribution margin in the body of the statement
4. Contribution margin is the amount of revenue remaining after deducting
variable costs. It can be expressed as a per unit amount or as a ratio.
a. Contribution Margin per Unit = Unit Selling Price – Unit Variable
Costs.
b. Contribution Margin Ratio = Contribution Margin per Unit ÷ Unit
Selling Price.
D. Break-even Analysis.
1. At the break-even point, the company will realize no income but will
suffer no loss.
2. Knowledge of the break-even point is useful to management when it
decides whether to introduce new product lines, change sales prices on
established products, or enter new market areas.
3. The break-even point can be:
a. Computed from a mathematical equation: Break-even Point in
Dollars = Total Variable Costs + Total Fixed Costs. The break-even
point in units can be computed by using unit selling prices and unit
variable costs.
b. Computed by using contribution margin: Break-even Point in Units =
Fixed Costs ÷ Contribution Margin per Unit. Break-even Point in
Dollars = Fixed Costs ÷ Contribution Margin Ratio.
c. Derived from a CVP graph at the intersection of the total-cost line
and the total-revenue line.
4. The income objective set by management is called target net income. To
meet target net income, required sales must be determined.
a. Mathematical equation: Required Sales = Variable Costs + Fixed
Costs + Target Net Income. Required sales may be expressed in
either sales units or sales dollars.
b. Contribution margin technique: Fixed Costs + Target Net Income ÷
Contribution Margin Ratio = Required Sales in Dollars.
c. Graphic presentation: In the profit area of the CVP graph, the distance
between the sales line and the total cost line at any point equals net
income. A company can find required sales by analyzing the differ-
ences between the two lines until the desired net income is found.
SERVICE COMPANY INSIGHT
FlightServe, a chartered aircraft company, decided to match up executives with
charter flights in small “private jets”. The company noted that the average charter
jet had eight seats, but it would break even at an average of 3.3 seats per flight.
How did FlightServe determine that it would break even with 3.3 seats full per flight?
Answer: FlightServe determined its break-even point with the following formula:
Fixed costs ÷ Contribution margin per seat occupied = Break-even
point in seats.
MANAGEMENT INSIGHT
The promoter for the Rolling Stones’ tour guaranteed $1.2 million to the group. In
addition, 20% of the gross goes to the stadium where the performance is staged
and another $400,000 for other expenses such as ticket takers and advertising.
What amount of sales dollars are required for the promoter to break even?
Answer: Fixed costs = $1,200,000 + $400,000 = $1,600,000
*E. Variable Costing.
1. Under absorption costing (full costing), all manufacturing costs are charged
to, or absorbed by, the product.
2. Under variable costing, only direct materials, direct labor, and variable
manufacturing overhead costs are considered product costs. In this
approach, companies recognize fixed manufacturing overhead costs as
period costs (expenses) when incurred.
3. Selling and administrative expenses are period costs under both absorp-
tion and variable costing.
4. The CVP income statement format is used with variable costing.
5. When units produced exceed units sold, income under absorption costing
is higher than under variable costing (because fixed overhead costs are
included in the inventory rather than expensed). When units produced
are less than units sold, income under absorption costing is lower than
under variable costing (because the ending inventory cost will be higher
under absorption costing than under variable costing).
6. The use of variable costing is acceptable only for internal use by
management. Companies must use absorption costing in determining
product costs in financial statements and for income tax purposes.

20 MINUTE QUIZ
Circle the correct answer.
True/False
1. The range over which a company is expected to operate is called the relevant range of
the activity index.
True False
2. A mixed cost contains both selling and administrative cost elements.
True False
3. Variable costs are costs that remain the same per unit at every level of activity.
True False
4. If a salesperson incurs $2,000 of expenses in servicing two customers and $4,000 of
expenses in servicing four customers, the fixed costs are $1,000.
True False
5. If revenue = $80 and variable cost = 40% of revenue, then contribution margin = $48.
True False
6. The contribution margin is the amount of revenue remaining after deducting fixed costs.
True False
7. Sales mix is the relative combination in which a company’s products are sold.
True False
8. If the unit contribution margin is $300 and fixed costs are $240,000 then the break-even
point in units would be 800 units.
True False
9. In a CVP income statement, contribution margin is reported in the body of the statement.
True False
10. Margin of safety is the difference between actual sales and contribution margin.
True False

Multiple Choice
1. Which of the following is a false statement regarding assumptions of CVP analysis?
a. Total fixed costs remain constant over the relevant range.
b. Unit selling prices are constant.
c. Changes in volume or level of activity increase variable costs per unit.
d. All units produced are sold.
2. Mixed costs may be separated into fixed costs and variable costs by using
a. the variable costing method.
b. the high-low method.
c. the contribution margin method.
d. all of the above.
3. If the unit selling price is $500, the unit variable cost is $300, and the total monthly fixed
costs are $300,000, then the contribution margin ratio is
a. 30%.
b. 40%.
c. 50%.
d. 60%.
4. If activity level increases 25% and a specific cost increases from $40,000 to $50,000, this
cost would be classified as a
a. variable cost.
b. mixed cost.
c. fixed cost.
d. none of the above.
5. If total fixed costs are $900,000 and variable costs as a percentage of unit selling price
are 40%, then the break-even point in dollars is
a. $1,500,000.
b. $360,000.
c. $2,250,000.
d. not determinable with the information given.
ANSWERS TO QUIZ
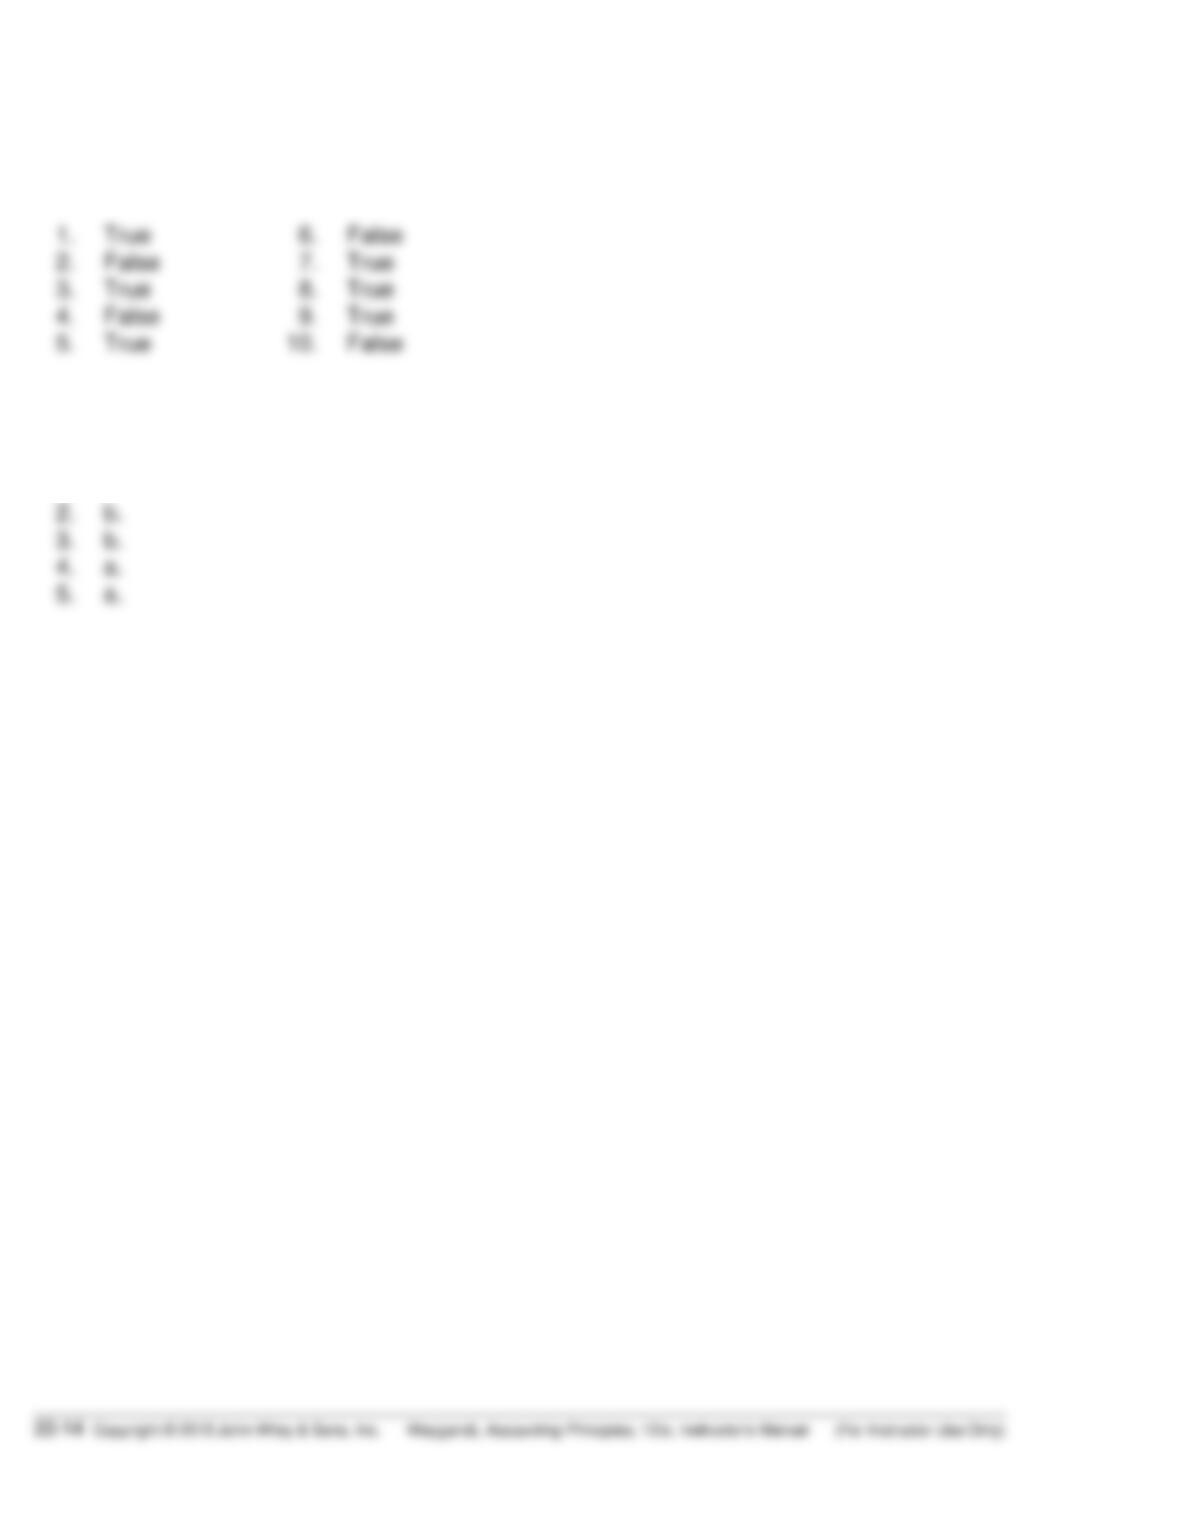
True/False
1. True 6. False
2. False 7. True
Multiple Choice
1. c.