1. The three major objectives of budgeting are (1) to establish specific goals for future
operations, (2) to execute plans to achieve the goals, and (3) to periodically compare
actual results with the goals.
2. If goals set by the budgets are viewed as unrealistic or unachievable, employees and
managers may become discouraged and may not be committed to the achievement of the
goals, resulting in the budget becoming less effective as a planning and control tool.
5. A static budget is most appropriate in situations where costs are not variable to an underlying
activity level. As a result, it is reasonable to plan spending on the basis of a fixed quantity of
resources for the year. This will occur in some administrative functions, such as human
resources, accounting, or public relations.
6. Computers not only speed up the budgeting process, but they also reduce the cost of budget
p
reparation when large quantities of data need to be processed. In addition, by using
computerized simulation models, management can determine the impact of various operating
8. Purchases of direct materials should be closely coordinated with the production budget so
that inventory levels can be maintained within reasonable limits.
9. a. The cash budget contributes to effective cash planning. This involves advance planning
so that a cash shortage does not arise and excess cash is not permitted to remain “idle.”
b. The excess cash can be invested in readily marketable income-producing securities or
used to reduce loans.
b
CHAPTER 22
BUDGETING
DISCUSSION QUESTIONS
b
CHAPTER 22 Budgeting
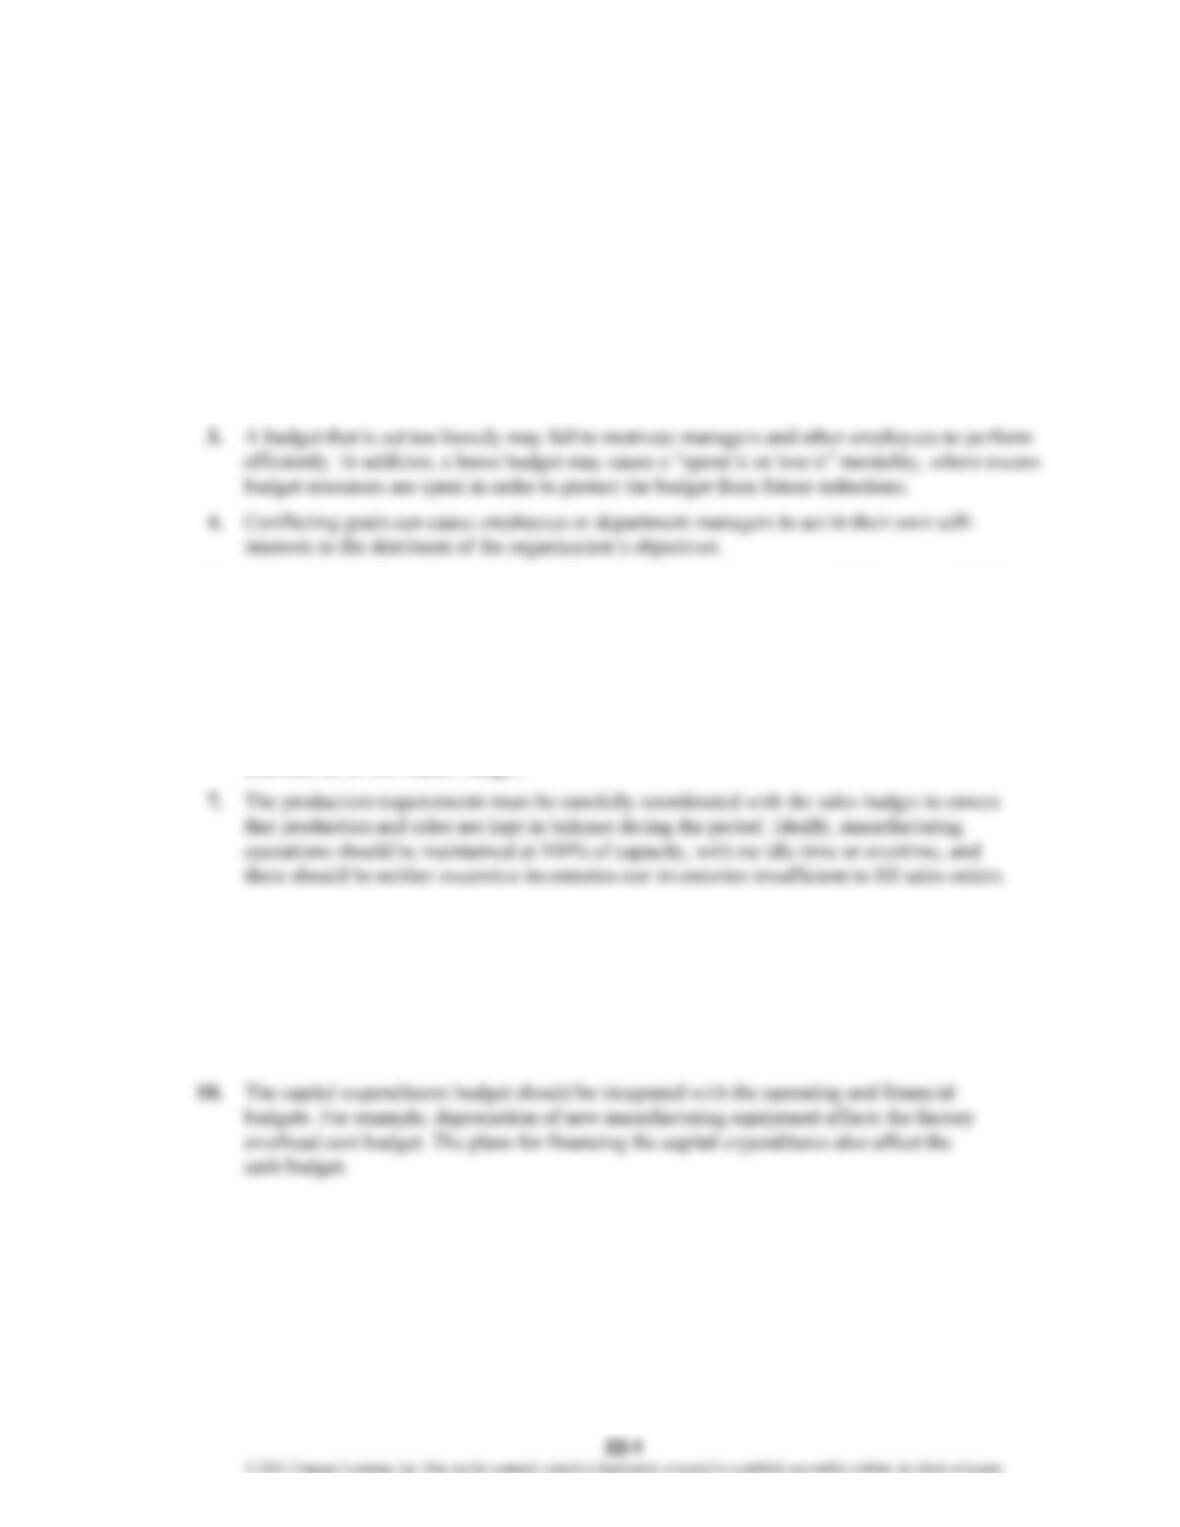
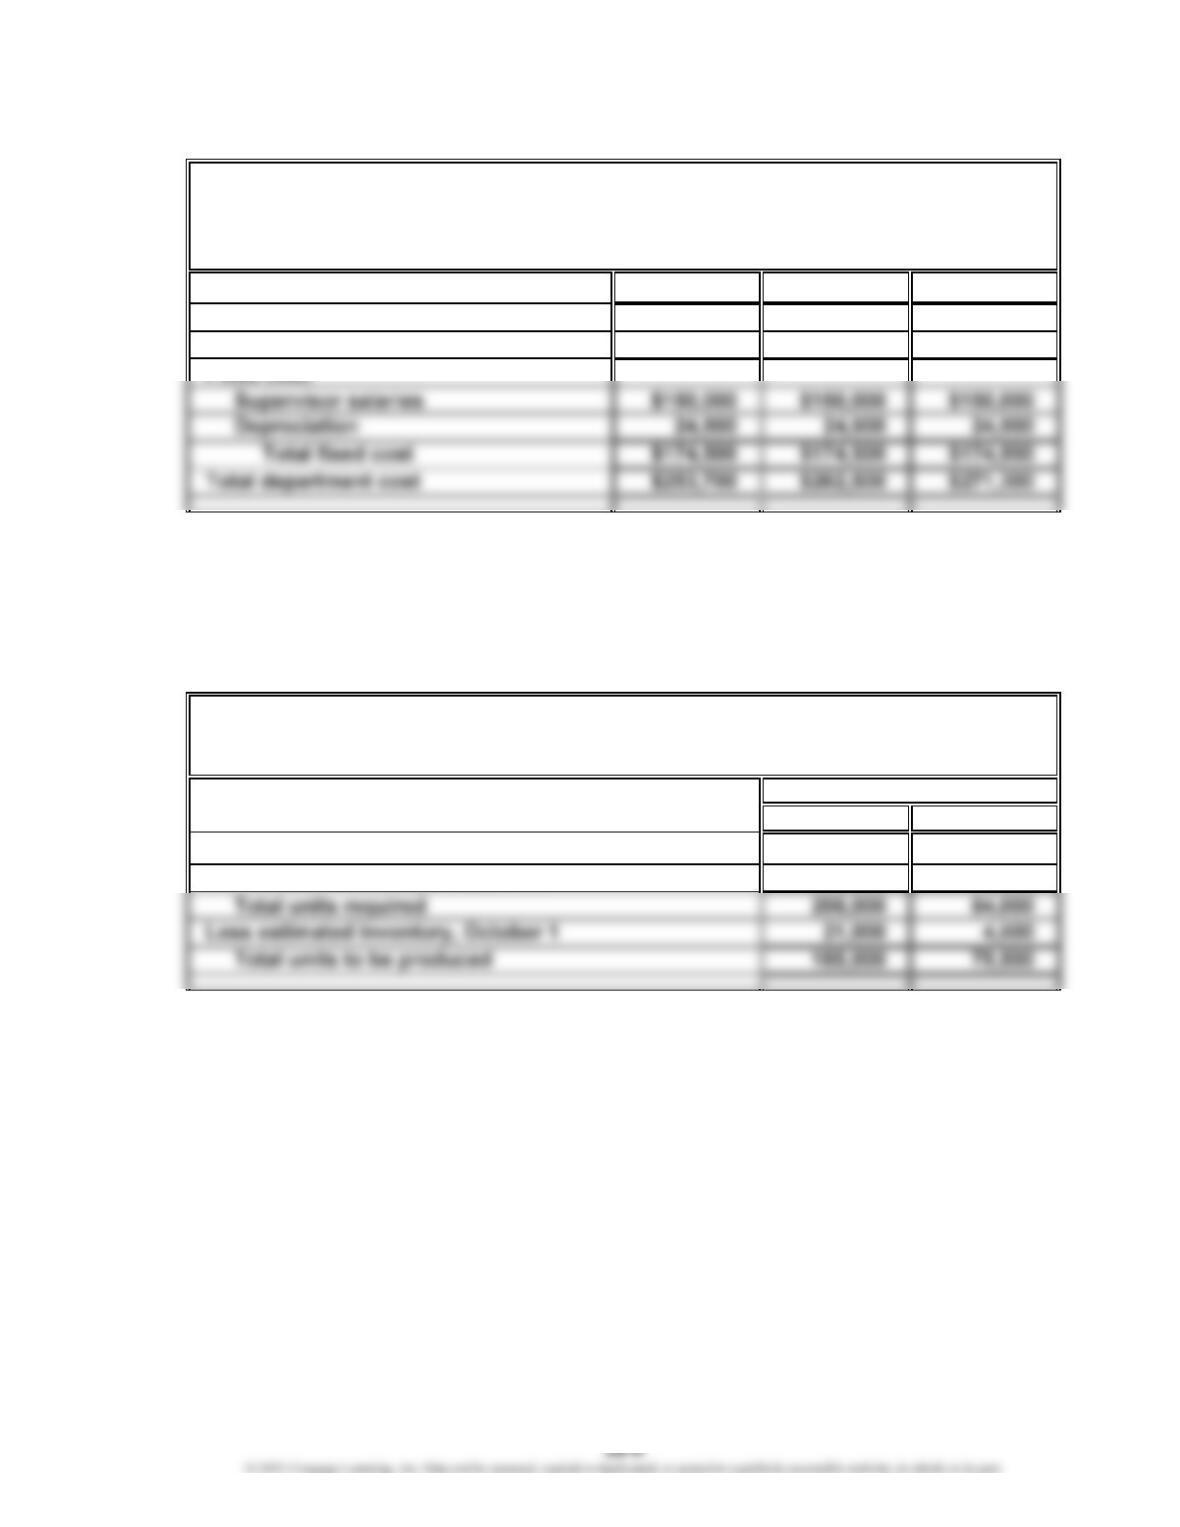
PE 22-1A
Variable cost:
Direct labor (7,200 hours × $19.00* per hour)…………………………………
…
$136,800
Fixed cost:
Property tax…………………………………………………………………………
…
14,700
Total department costs………………………………………………………………… $151,500
*$123,500 ÷ 6,500 hours
PE 22-1B
Variable cost:
PE 22-2A
Expected units to be sold 252,000
Plus desired ending inventory, December 31, 20Y6 19,700
Total units required 271,700
Less estimated beginning inventory, January 1, 20Y6 13,700
Total units to be produced 258,000
PE 22-2B
Harbour Inc.
Production Budget
For the Year Ending December 31, 20Y6
Soft Glow Candle Inc.
Production Budget
CHAPTER 22 Budgeting
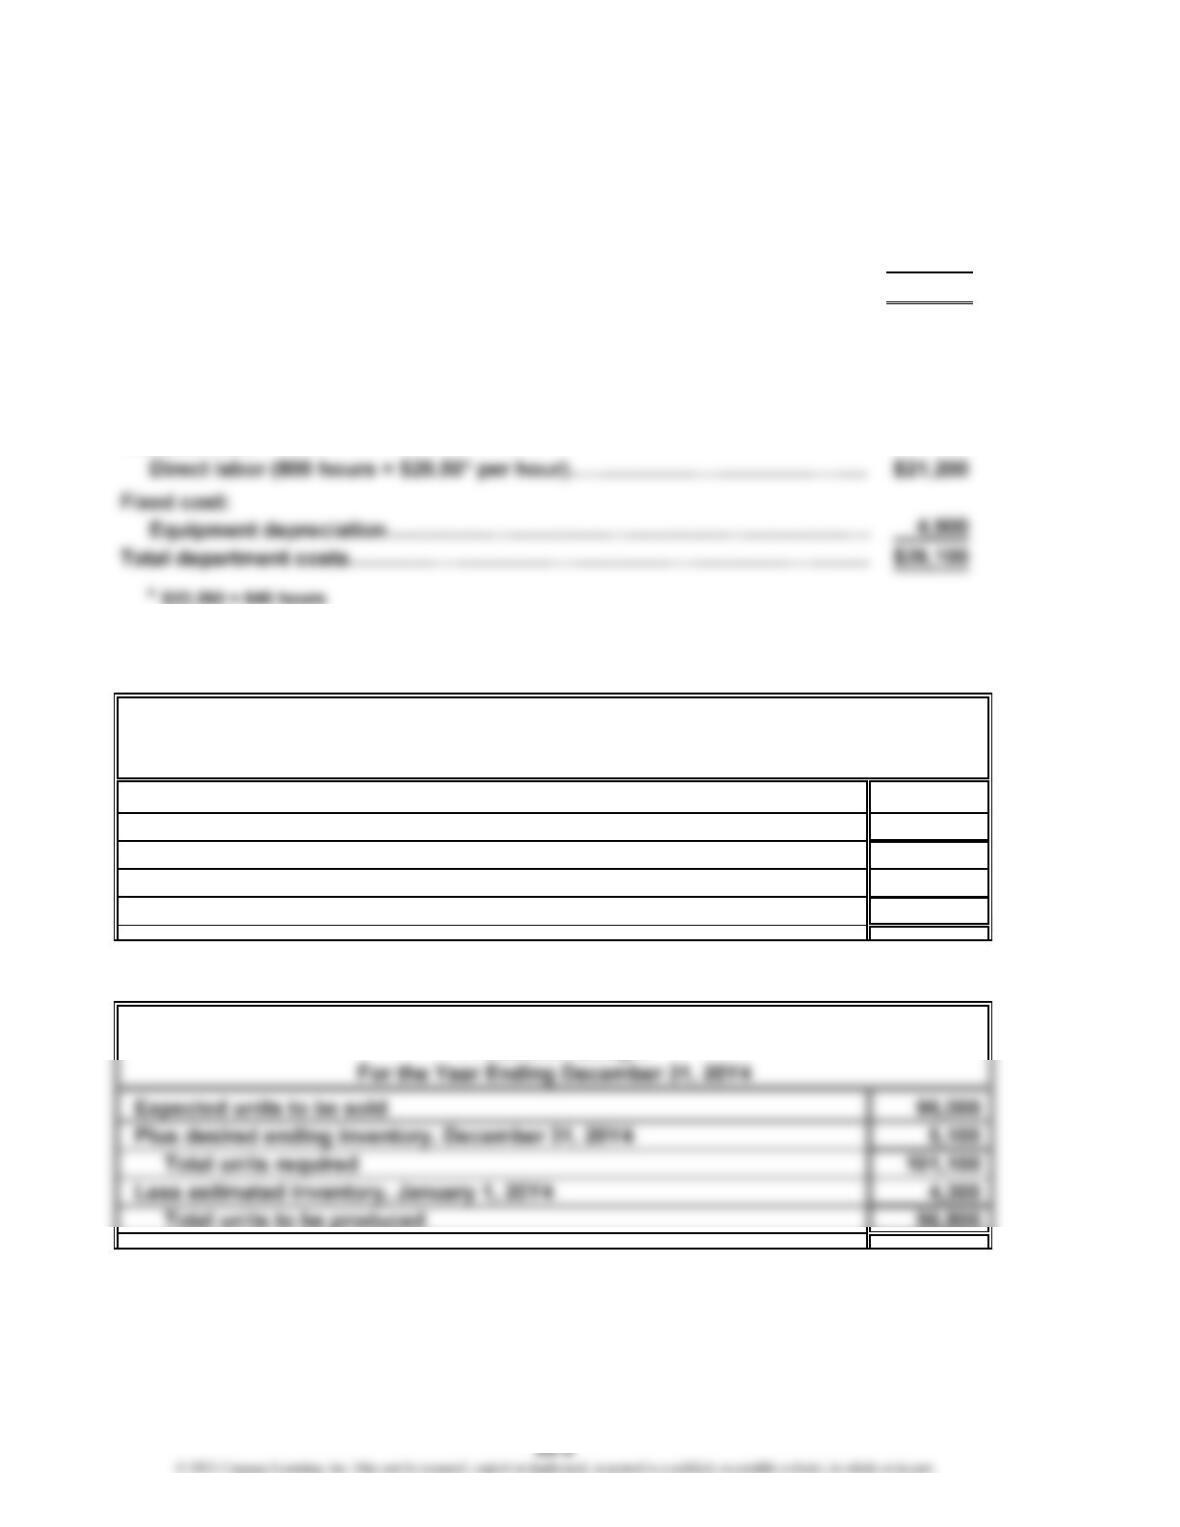
PE 22-3A
Square yards required for production:
Personal journals (258,000 × 5 sq. yds.) 1,290,000
Plus desired ending inventory, December 31, 20Y6 17,000
PE 22-3B
Pounds of wax required for production:
Candles [(96,800 × 8 oz.) ÷ 16 oz.] 48,400
Plus desired ending inventory, December 31, 20Y4 5,200
PE 22-4A
Hours required for assembly:
Personal journals (258,000 × 6 min.) 1,548,000 min.
Convert minutes to hours 60 min.
Harbour Inc.
Direct Labor Cost Budget
For the Year Ending December 31, 20Y6
Harbour Inc.
Direct Materials Purchases Budget
For the Year Ending December 31, 20Y6
Soft Glow Candle Inc.
Direct Materials Purchases Budget
For the Year Ending December 31, 20Y4
÷
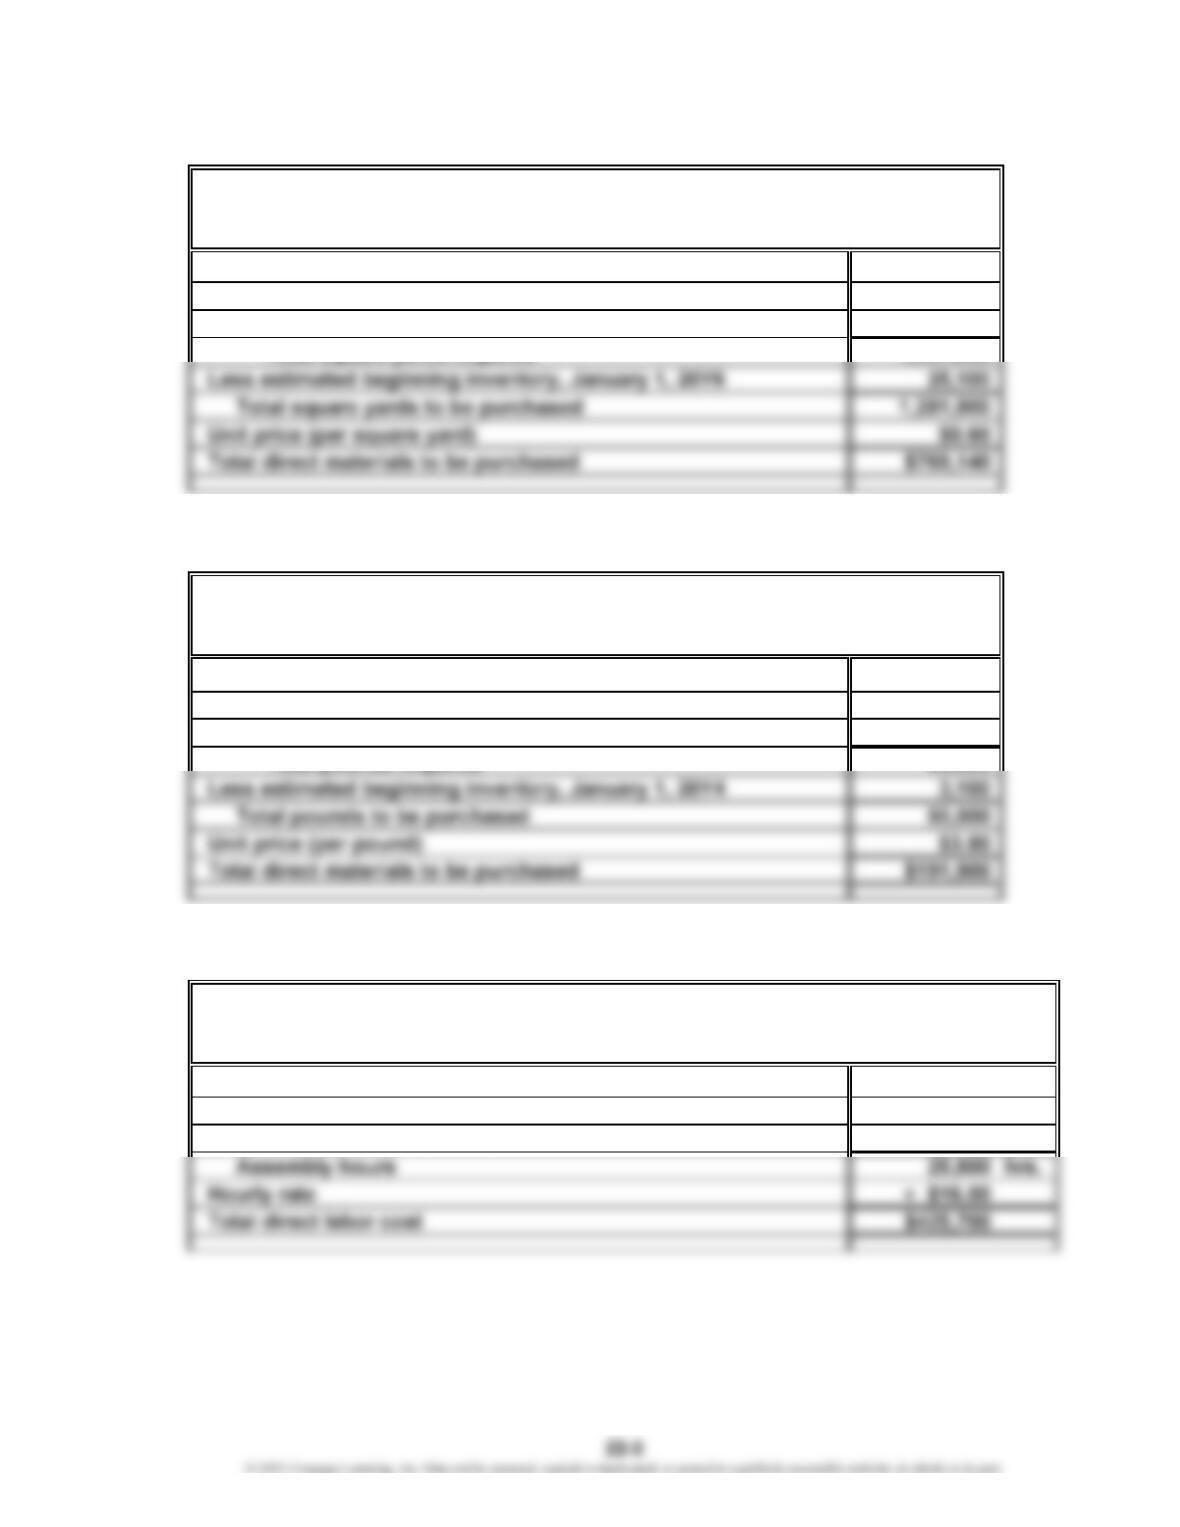
PE 22-4B
Hours required for molding:
Candles (96,800 × 9 min.) 871,200 min.
PE 22-5A
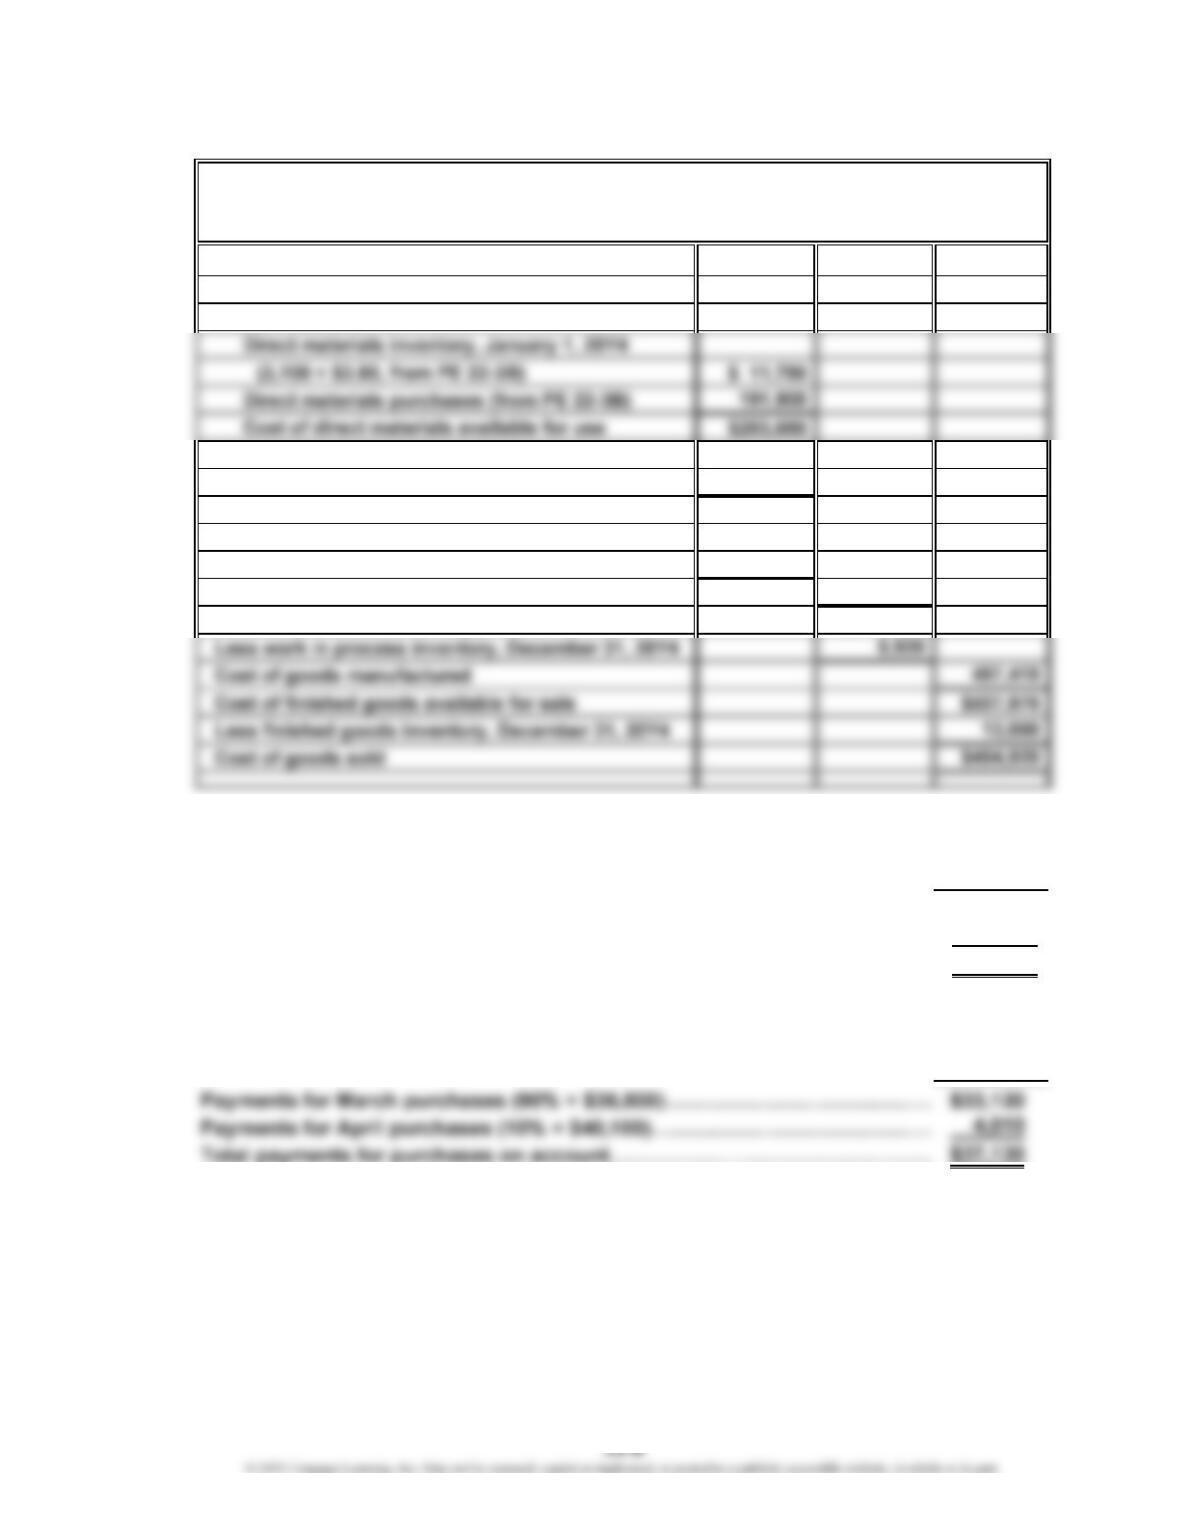
Finished goods inventory, January 1, 20Y6
Work in process inventory, January 1, 20Y6 $ 35,700
Cost of direct materials available for use $784,200
Less direct materials inventory,
December 31, 20Y6 (17,000 × $0.60,
from PE 22-3A) 10,200
Cost of direct materials placed in production $774,000
Direct labor (from PE 22-4A) 425,700
Factory overhead 197,200
Cost of goods sold $1,373,000
Soft Glow Candle Inc.
Direct Labor Cost Budget
For the Year Ending December 31, 20Y4
Harbour Inc.
Cost of Goods Sold Budget
For the Year Ending December 31, 20Y6
$ 41,100
CHAPTER 22 Budgeting
PE 22-5B
Finished goods inventory, January 1, 20Y4 $ 10,560
Work in process inventory, January 1, 20Y4 $ 6,440
Direct materials:
Less direct materials inventory,
December 31, 20Y4 (5,200 × $3.80) 19,760
Cost of direct materials placed in production $183,920
Direct labor (from PE 22-4B) 217,800
Factory overhead 95,170
Total manufacturing costs 496,890
Total work in process during period $503,330
PE 22-6A
October
Collections from September sales (75% × $246,000)……………………………
…
$184,500
Collections from October sales (25% × $284,000)………………………………
…
71,000
Total receipts from sales on account………………………………………………
…
$255,500
PE 22-6B
April
…
…
Soft Glow Candle Inc.
Cost of Goods Sold Budget
For the Year Ending December 31, 20Y4
CHAPTER 22 Budgeting
Ex. 22-1
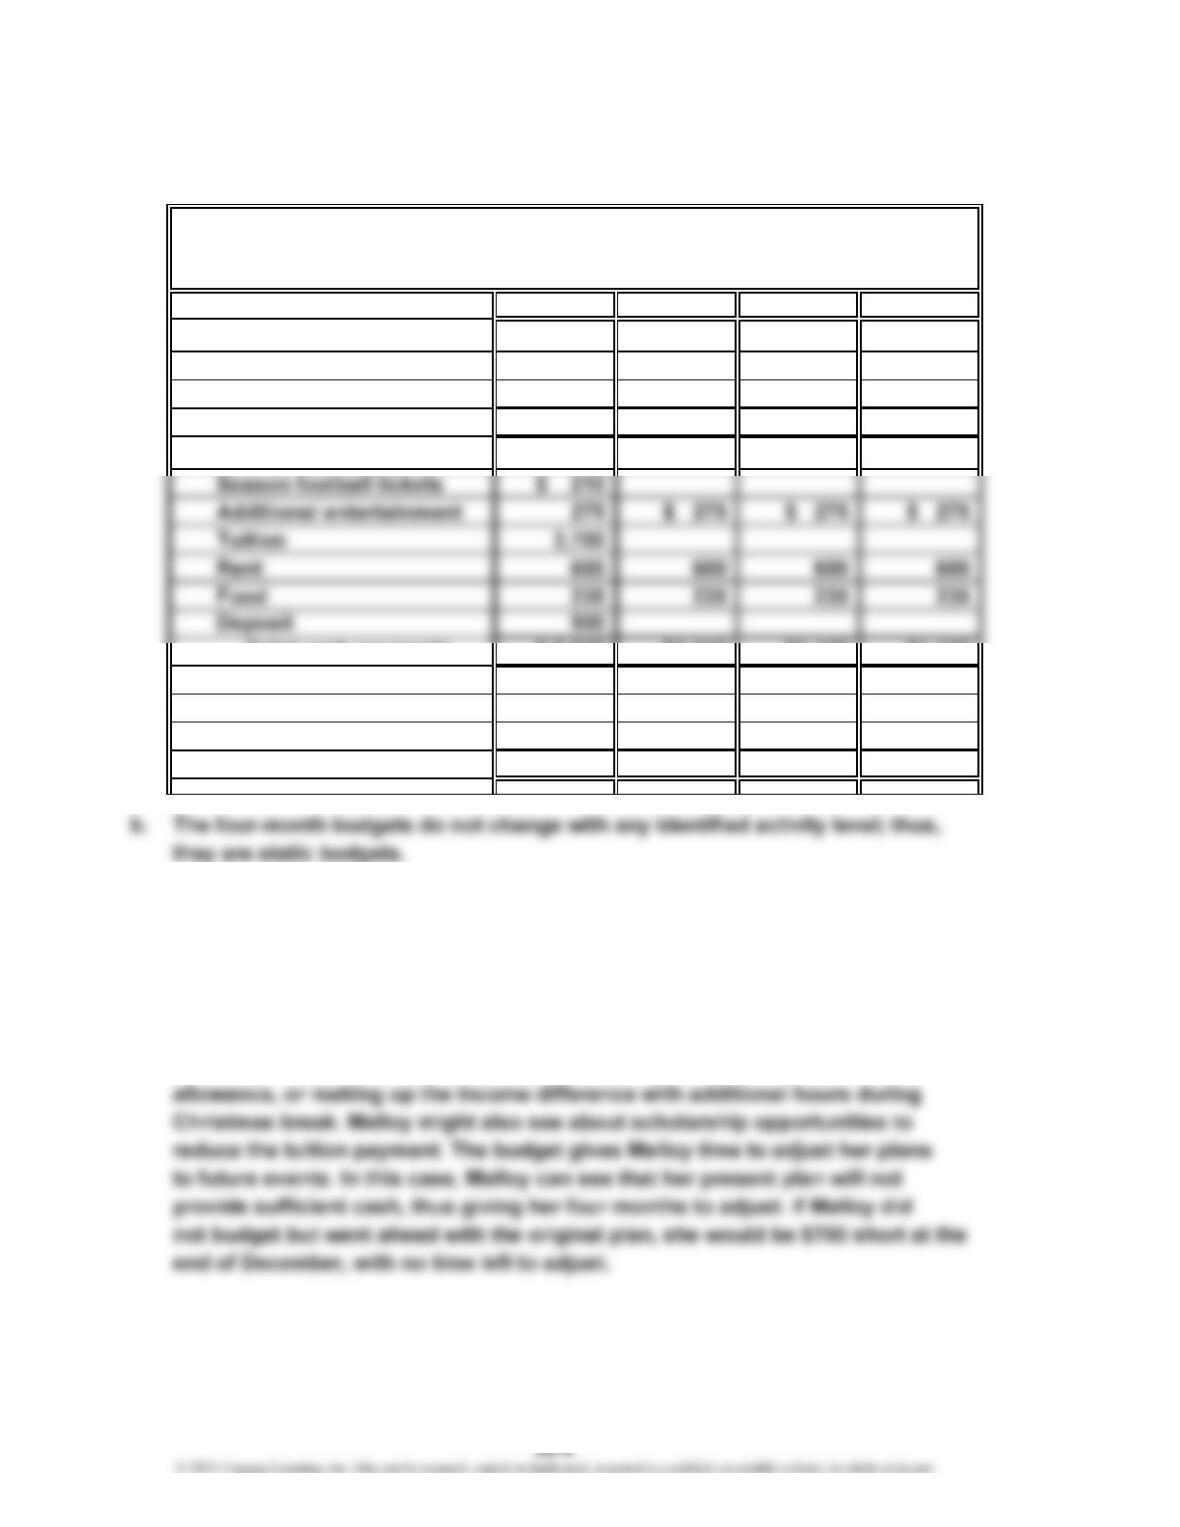
a.
September October November December
Estimated cash receipts from:
Part-time job $ 1,400 $1,400 $1,400 $1,400
Deposit 500
Total cash receipts $ 1,400 $1,400 $1,400 $1,900
Estimated cash payments for:
Total cash payments $ 5,520 $1,110 $1,110 $1,110
Cash increase (decrease) $(4,120) $ 290 $ 290 $ 790
Cash balance at beginning of
month 5,750 1,630 1,920 2,210
Cash balance at end of month $ 1,630 $1,920 $2,210 $3,000
c. While Malloy’s budget might first appear satisfactory, Malloy must earn enough
cash in order to pay for the spring semester tuition. Her present budget shows
that she will be $700 short of the tuition amount ($3,700 – $3,000) by the time she
needs to pay her spring tuition. Thus, Malloy will likely need to adjust the plan
before the fall term even begins. Some possibilities would be to rent a lower
cost apartment or to get a roommate. Other considerations include increasing
her part-time job hours and reducing her monthly entertainment and food
For the Four Months Ending December 31
Katherine Malloy
Cash Budget
EXERCISES
CHAPTER 22 Budgeting
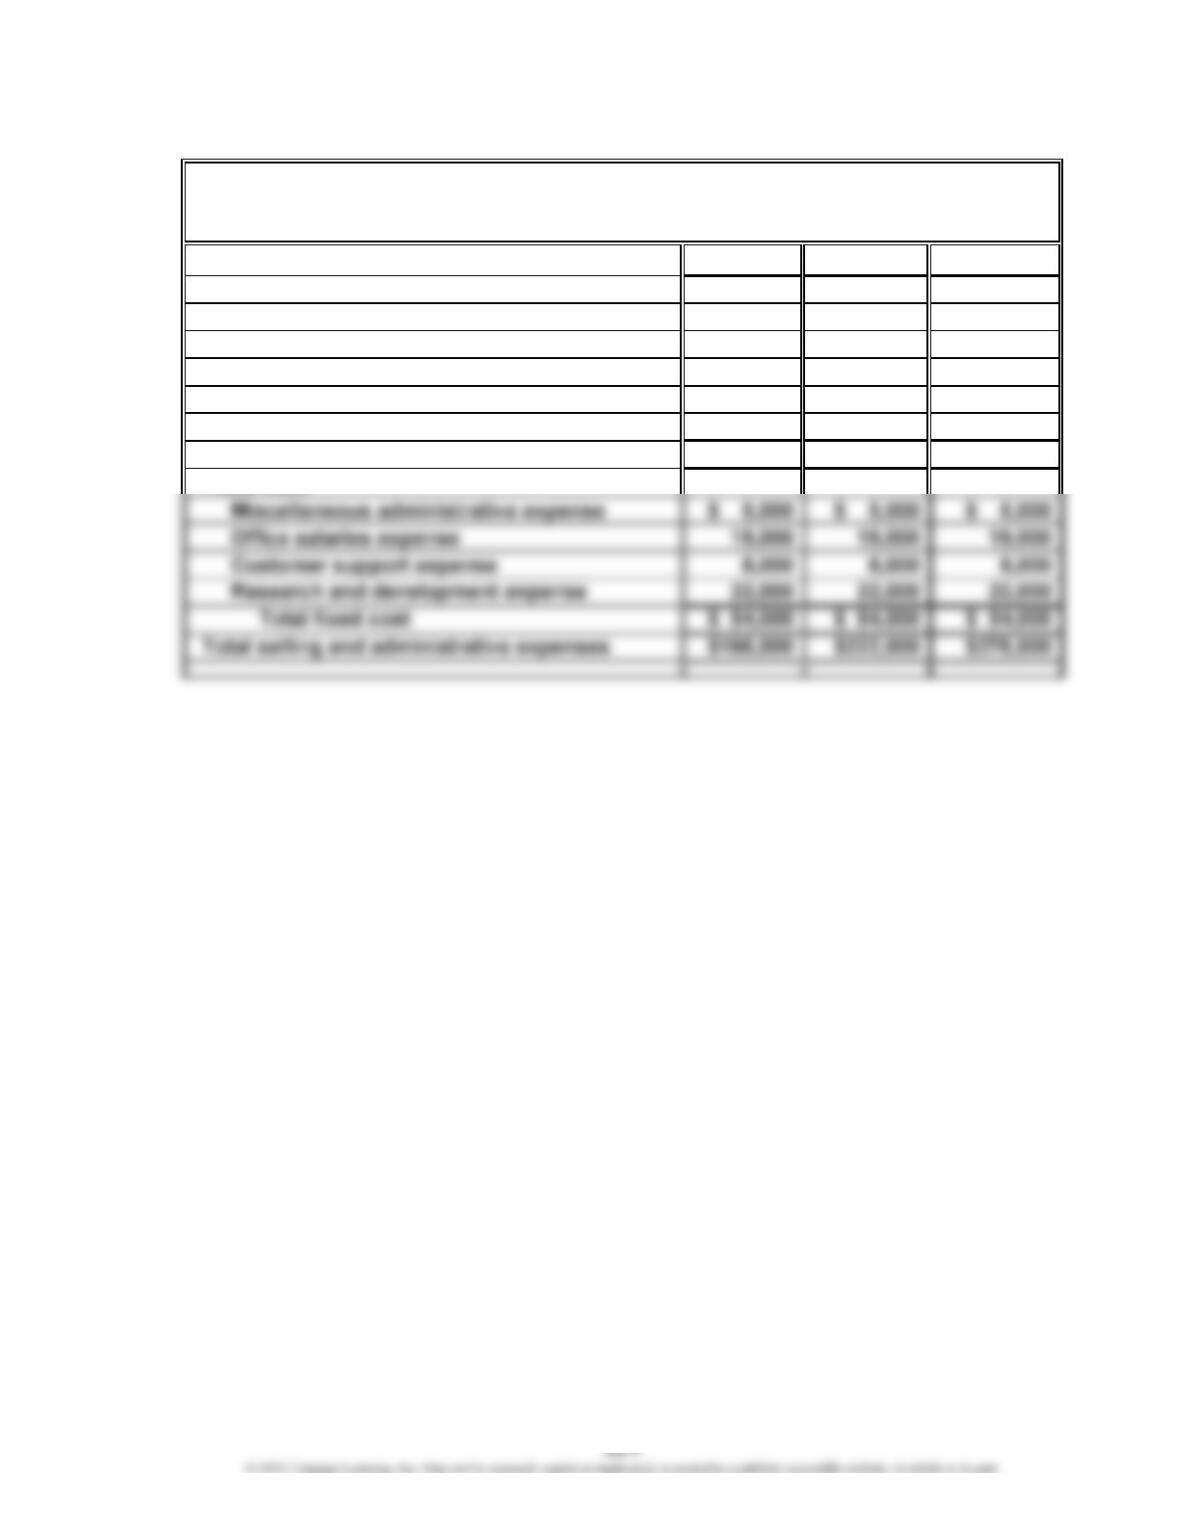
Ex. 22-2
Total sales $200,000 $300,000 $400,000
Variable cost:
Sales commissions (16% of sales) $ 32,000 $ 48,000 $ 64,000
Advertising expense (12% of sales) 24,000 36,000 48,000
Miscellaneous administrative
expense (10% of sales) 20,000 30,000 40,000
Customer support expense (18% of sales) 36,000 54,000 72,000
Total variable cost $112,000 $168,000 $224,000
Daybreak Technologies Inc.
Flexible Selling and Administrative Expenses Budget
For the Month Ending April 30
CHAPTER 22 Budgeting
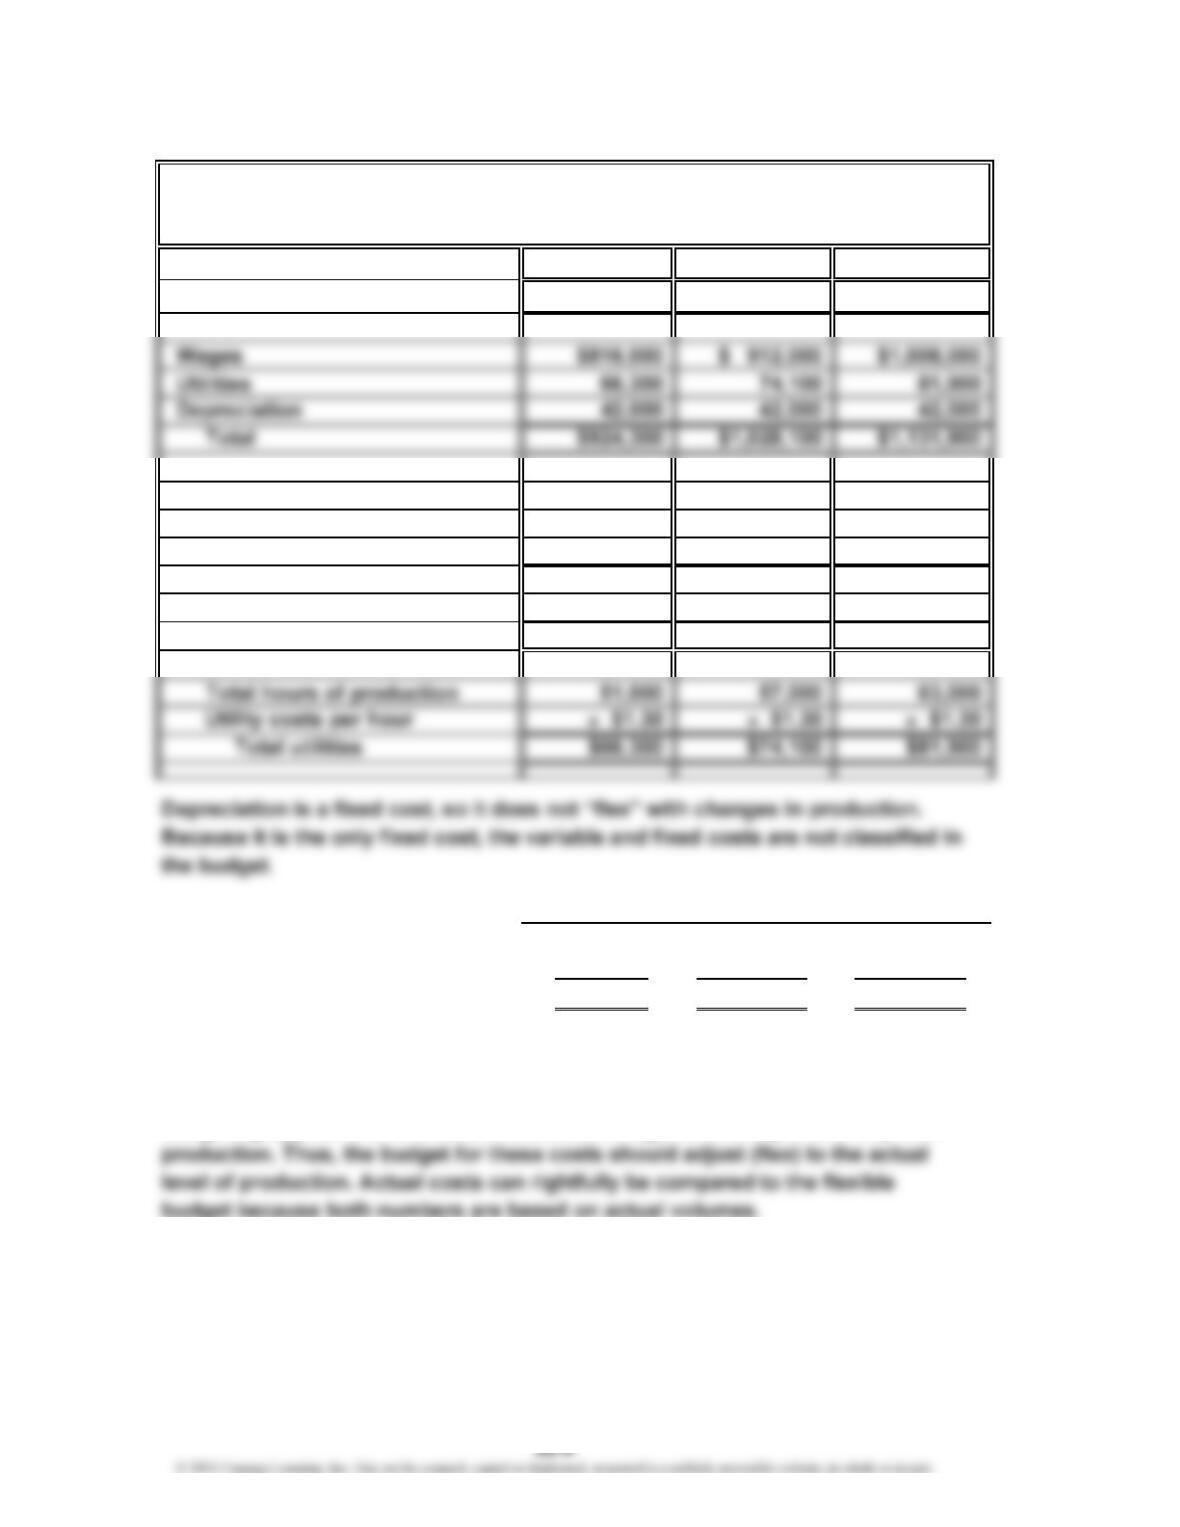
Ex. 22-3
a.
January February March
Units of production 68,000 76,000 84,000
Supporting computations:
Units of production 68,000 76,000 84,000
Hours per unit 0.75 0.75 0.75
Total hours of production 51,000 57,000 63,000
Wages per hou
r
$16.00 $16.00 $16.00
Total wages $816,000 $912,000 $1,008,000
b.
January February March
Actual cost……………………………
…
$ 994,500 $ 1,078,500 $ 1,174,900
Total flexible budget…………………
…
(924,300) (1,028,100) (1,131,900)
Excess of actual cost over budget… $ 70,200 $ 50,400 $ 43,000
The excess of actual cost over the flexible budget suggests that the Machining
Department has not performed as well as originally thought. The department is
spending more than would be expected. The flexible budget is a superior
budgeting approach in this situation because wages and utility costs vary with
Celtic Company—Machining Department
Flexible Production Budget
For the Three Months Ending March 31
×××
×××
CHAPTER 22 Budgeting
Ex. 22-4
Units of production 18,000 20,000 22,000
Variable cost:
Direct labo
r
$ 79,200 $ 88,000 $ 96,800
1
18,000 × 12/60 min. × $22
2
20,000 × 12/60 min. × $22
3
22,000 × 12/60 min. × $22
Ex. 22-5
Bath Scale Gym Scale
Expected units to be sold 190,000 75,000
Plus desired inventory, October 31 16,000 9,000
For the Month Ending October 31
Units
Steelcase Inc.—Assembly Department
Flexible Production Budget
(assumed data)
For the Month Ending August 31
FitHealth Inc.
Production Budget
12
3
CHAPTER 22 Budgeting
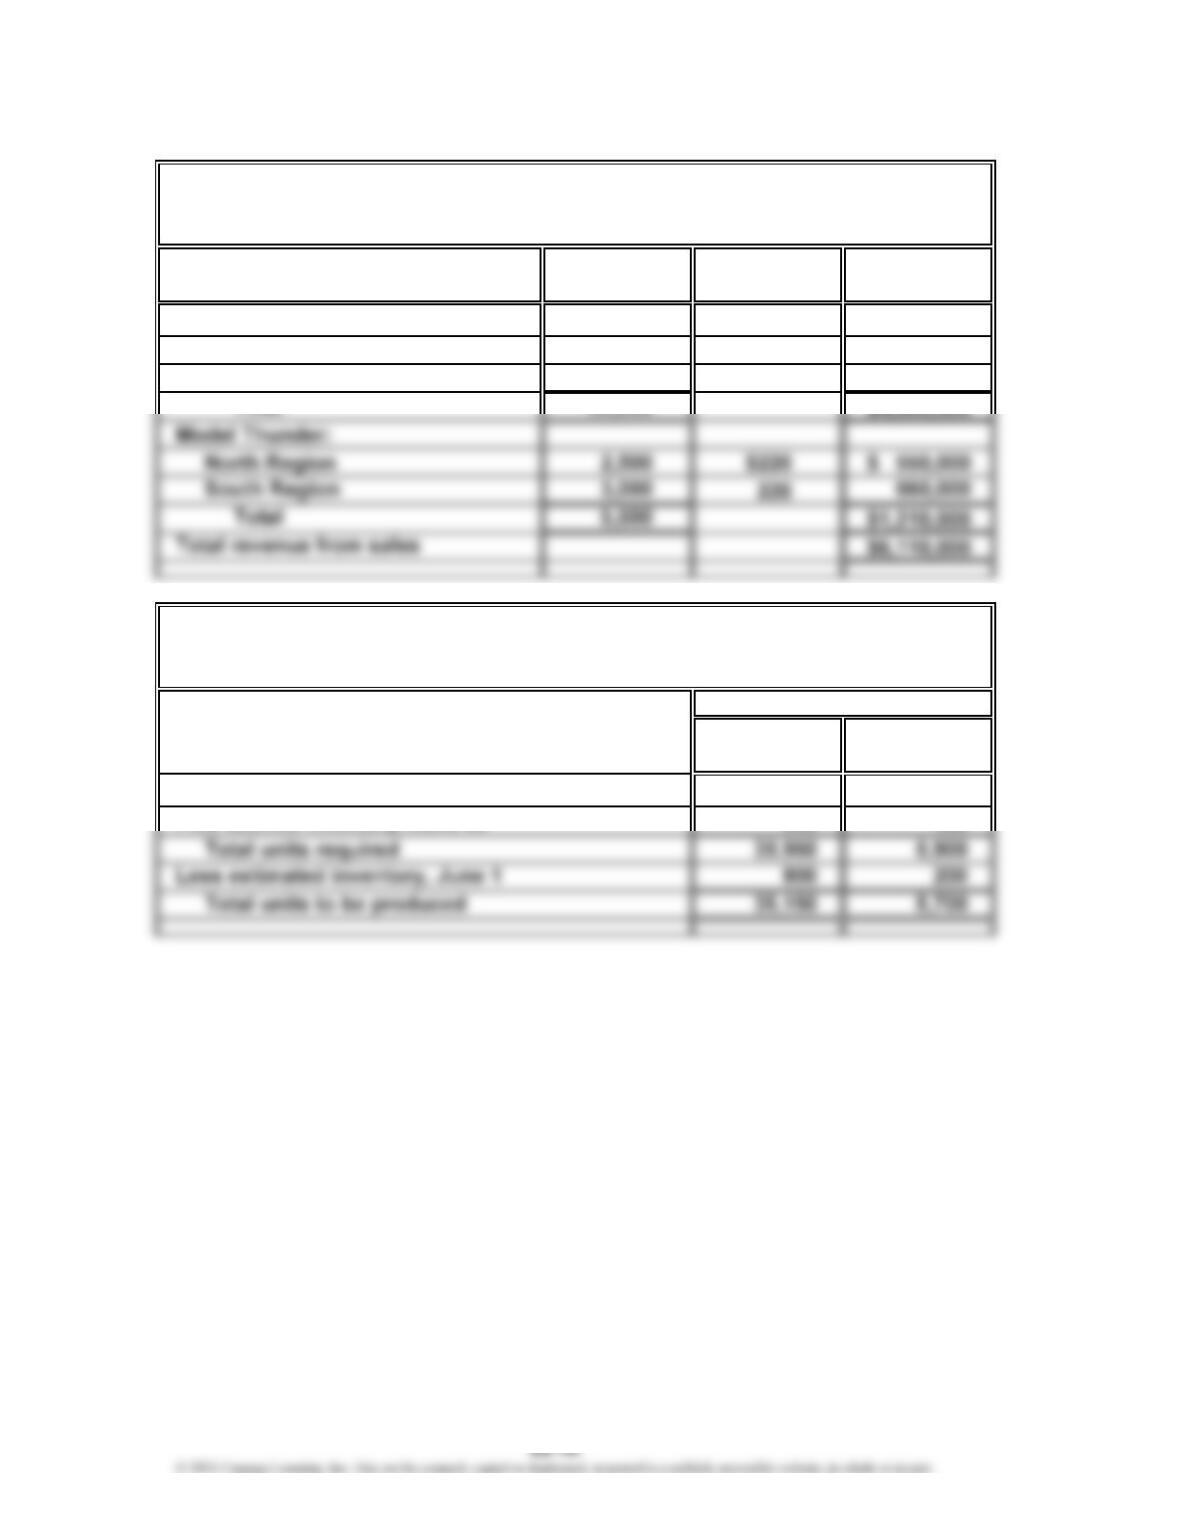
Ex. 22-6
a.
Unit Sales Unit Selling
Volume Price Total Sales
Model Rumble:
North Region 15,000 $140 $2,100,000
South Region 20,000 140 2,800,000
b.
Model Model
Rumble Thunder
Expected units to be sold 35,000 5,500
For the Month Ending June 30
Units
Product and Area
Vibrant Inc.
Sales Budget
For the Month Ending June 30
Vibrant Inc.
Production Budget
CHAPTER 22 Budgeting
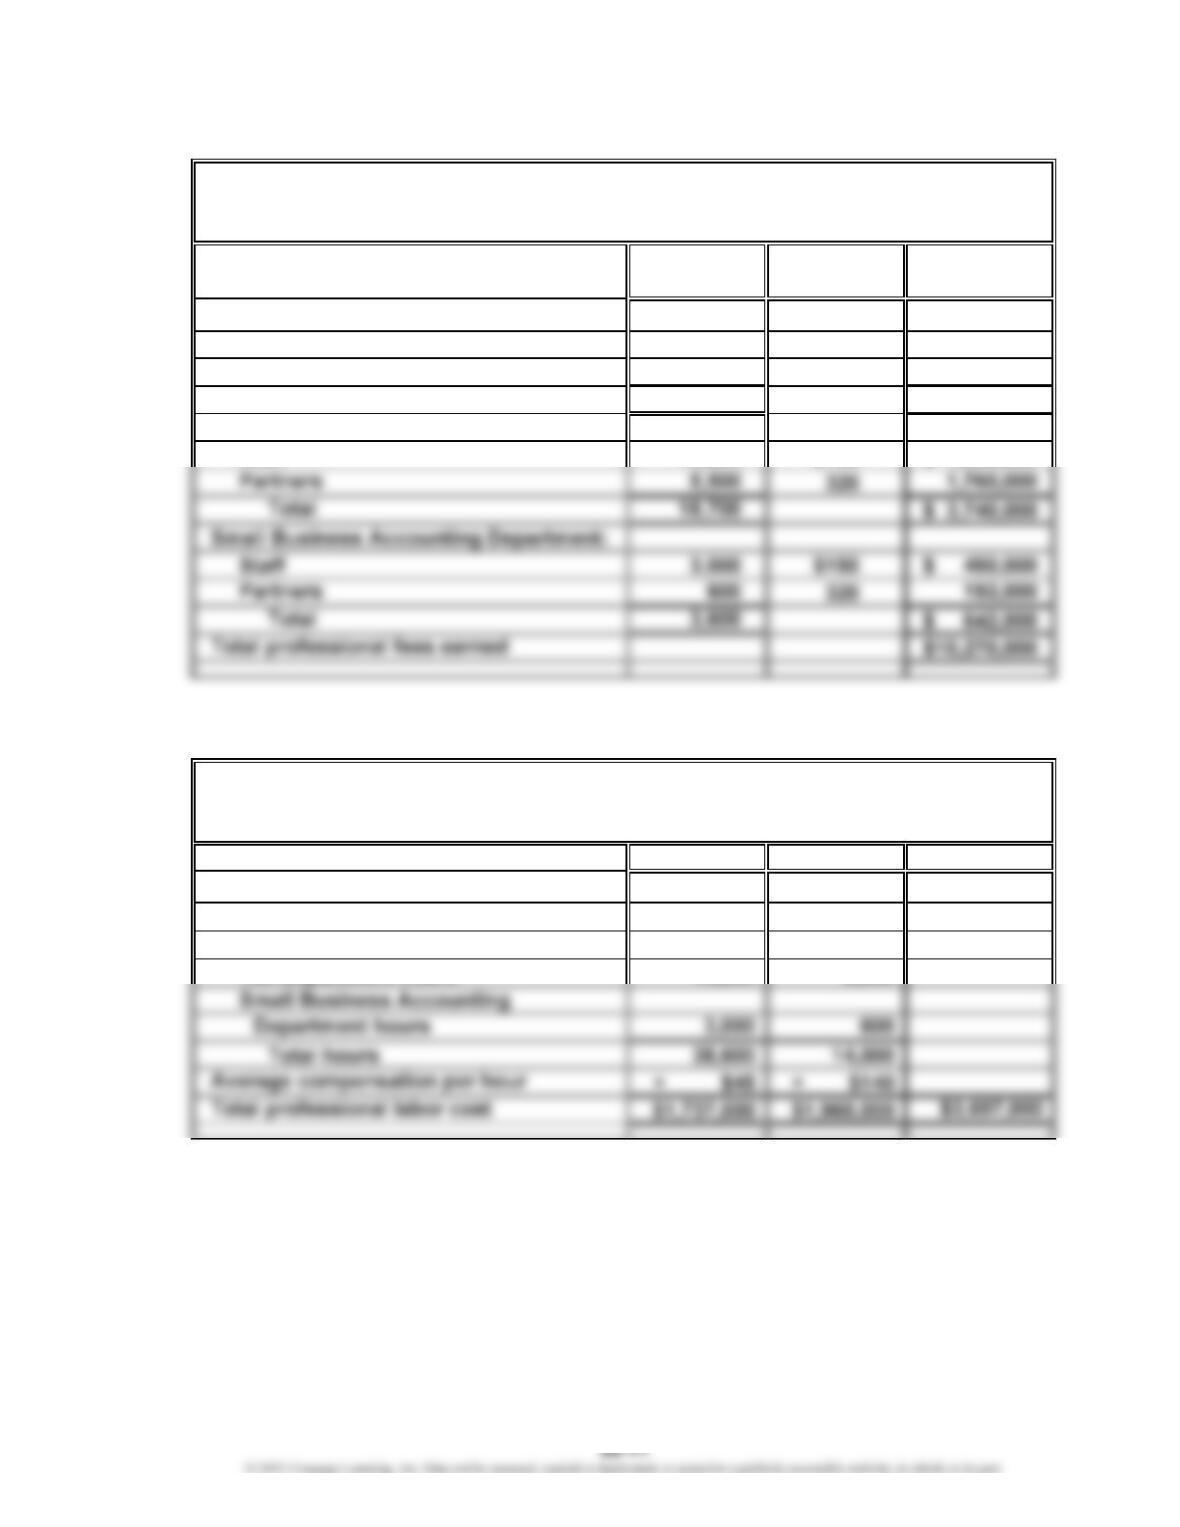
Ex. 22-7
Billable Hourly Total
Hours Rate Revenue
Audit Department:
Staff 22,400 $150 $ 3,360,000
Partners 7,900 320 2,528,000
Total 30,300 $ 5,888,000
Tax Department:
Ex. 22-8
Staff Partners Total
Hours required for professional
services:
Audit Department hours 22,400 7,900
Professional Labor Cost Budget
For the Month Ending January 31, 20Y7
Rollins and Cohen, CPAs
Professional Fees Earned Budget
For the Month Ending January 31, 20Y7
Rollins and Cohen, CPAs
CHAPTER 22 Budgeting
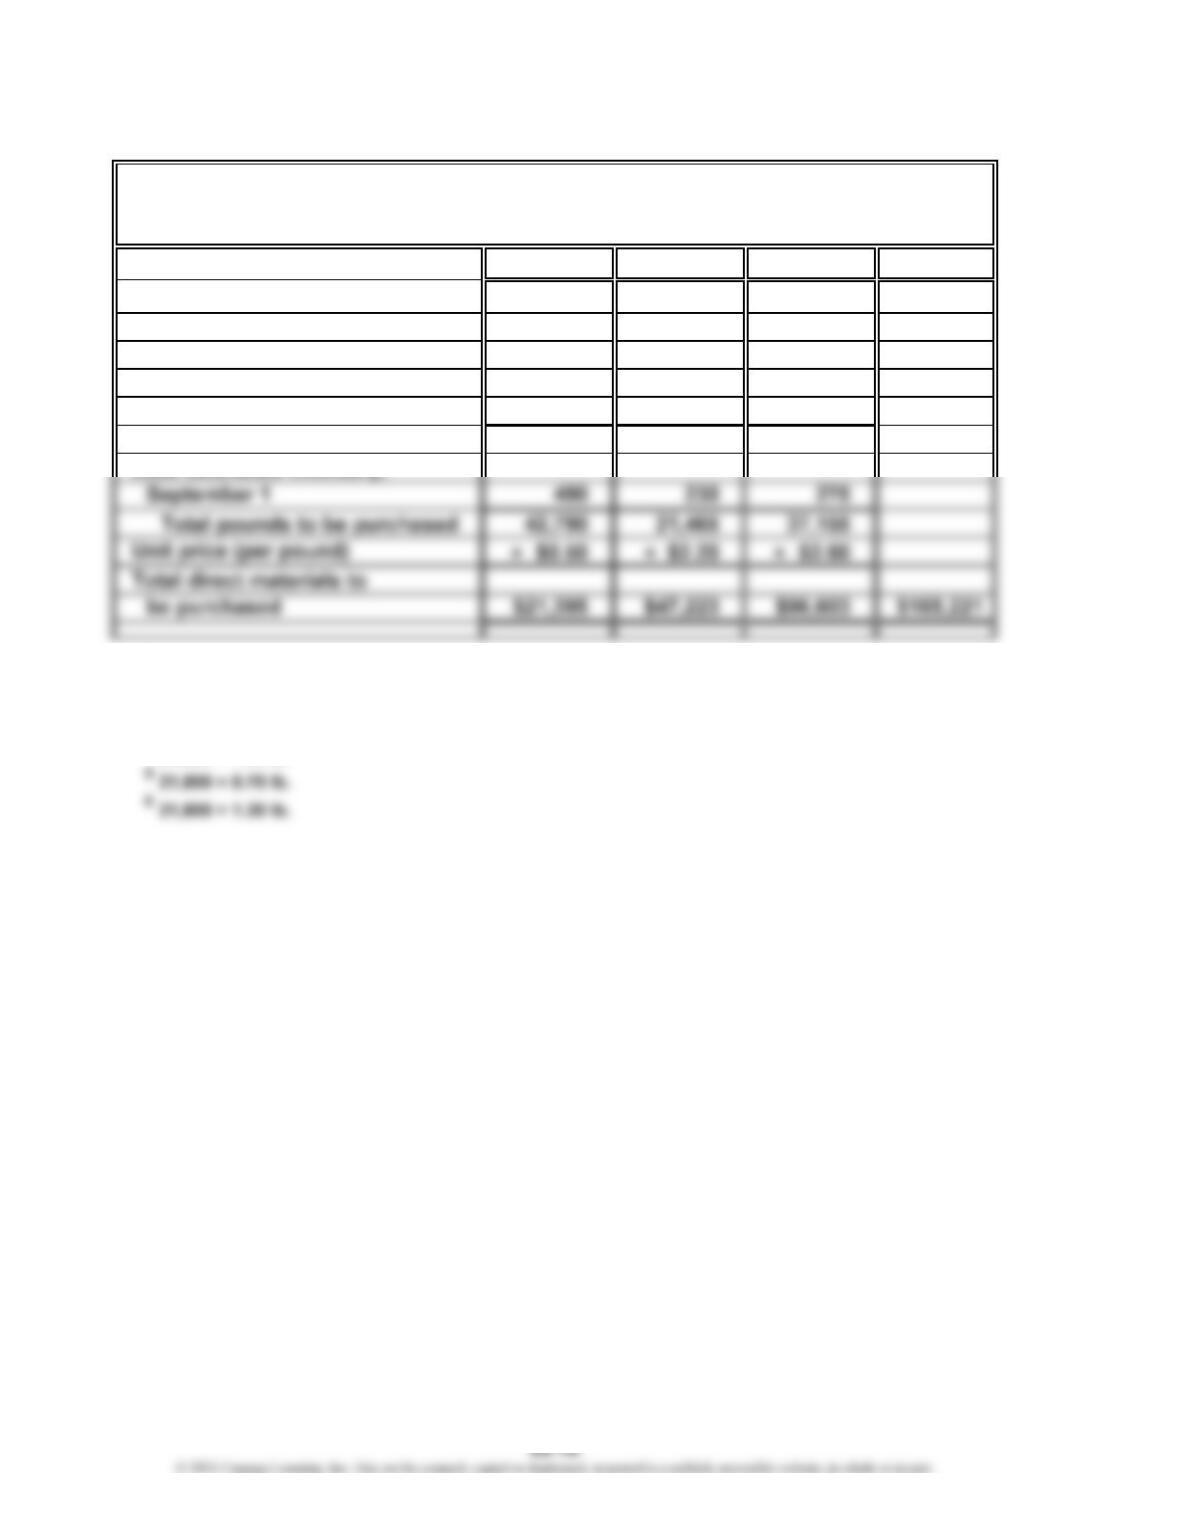
Ex. 22-9
Dough Tomato Cheese Total
Units required for production:
12″ pizza 10,000 6,250 8,750
16″ pizza 32,700 15,260 28,340
Plus desired inventory,
September 30 580 185 340
Total pounds required 43,280 21,695 37,430
1
12,500 × 0.80 lb.
2
12,500 × 0.50 lb.
3
12,500 × 0.70 lb.
4
21,800 × 1.50 lb.
Lorenzo’s Frozen Pizza Inc.
Direct Materials Purchases Budget
For the Month Ending September 30
12
45
3
6
CHAPTER 22 Budgeting
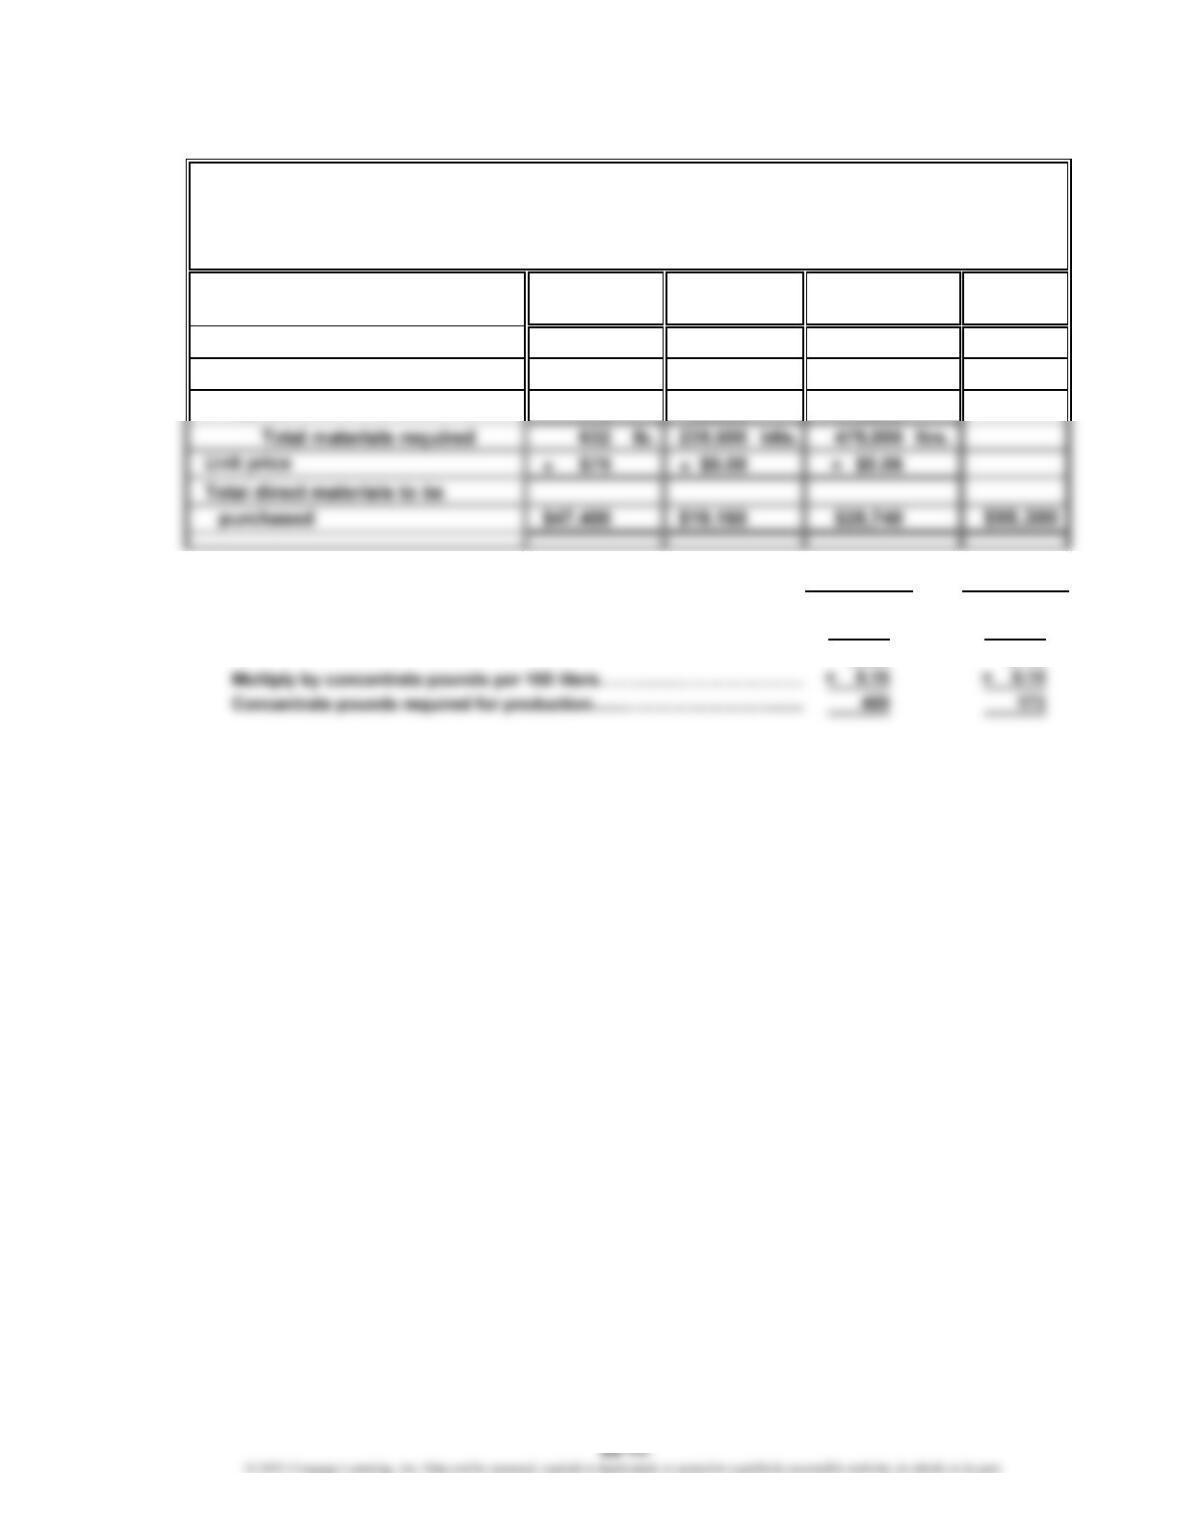
Ex. 22-10
Total
Materials required for production:
Coke® 459 lb. 153,000 btls. 306,000 ltrs.
Sprite
®
173 86,500 173,000
Coke
®
Sprite
®
*
Production in liters (bottles × 2 liters/bottle)………………………………
…
306,000 173,000
Divide by 100……………………………………………………………………… 100 100
3,060 1,730
Concentrate Bottles Water
Coca-Cola Enterprises—Wakefield Plant
For the Month Ending May 31
(assumed data)
Direct Materials Purchases Budget
2-Liter Carbonated
*
*
÷÷
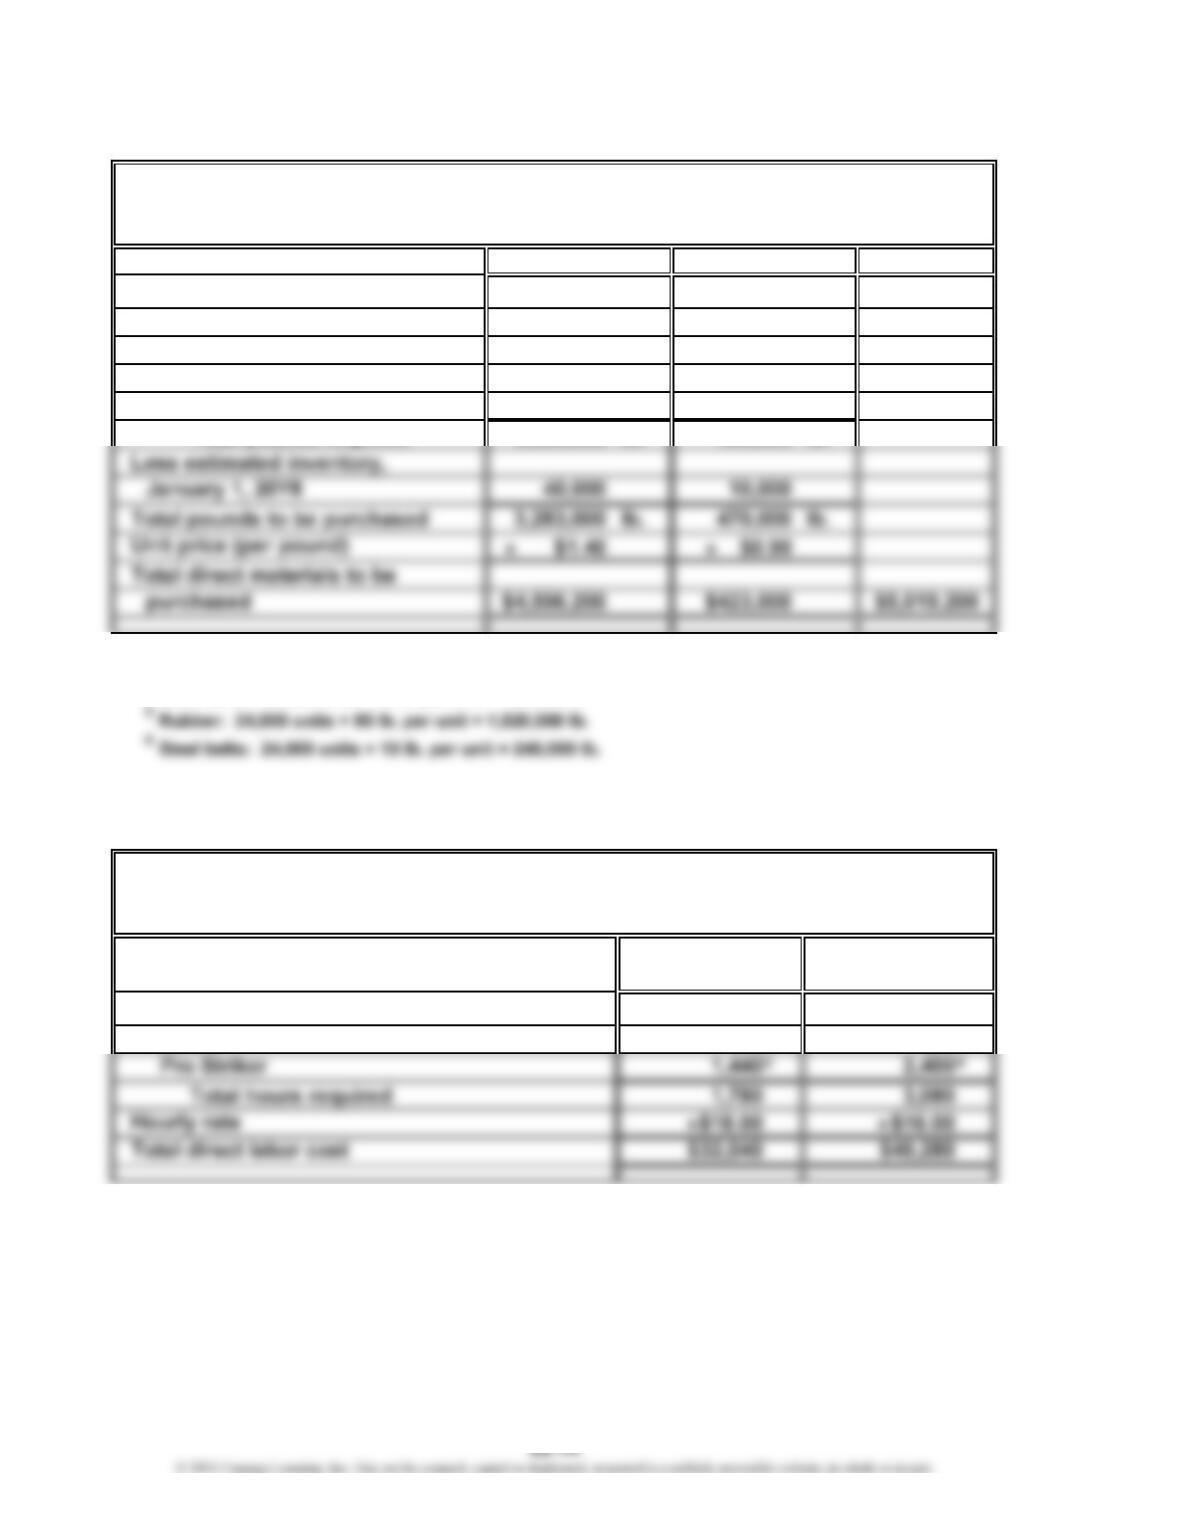
CHAPTER 22 Budgeting
Ex. 22-11
Total
Pounds required for production:
Passenger tires 1,368,000 lb. 228,000 lb.
Truck tires 1,920,000 240,000
Plus desired inventory,
December 31, 20Y8 35,000 12,000
1
Rubber: 38,000 units × 36 lb. per unit = 1,368,000 lb.
2
Steel belts: 38,000 units × 6 lb. per unit = 228,000 lb.
Ex. 22-12
Hours required for production:
Junior
1
Junior: 0.10 hr. × 3,400 = 340 hrs.
2
Junior: 0.20 hr. × 3,400 = 680 hrs.
3
Pro Striker: 0.15 hr. × 9,600 = 1,440 hrs.
4
Pro Striker: 0.25 hr. × 9,600 = 2,400 hrs.
Solid Grip Company
Direct Materials Purchases Budget
For the Year Ending December 31, 20Y8
Rubber Steel Belts
340
680
Direct Labor Cost Budget
For the Month Ending March 31
Rip Court Racket Company
Department
Forming Assembly
Department
12
34
12
CHAPTER 22 Budgeting
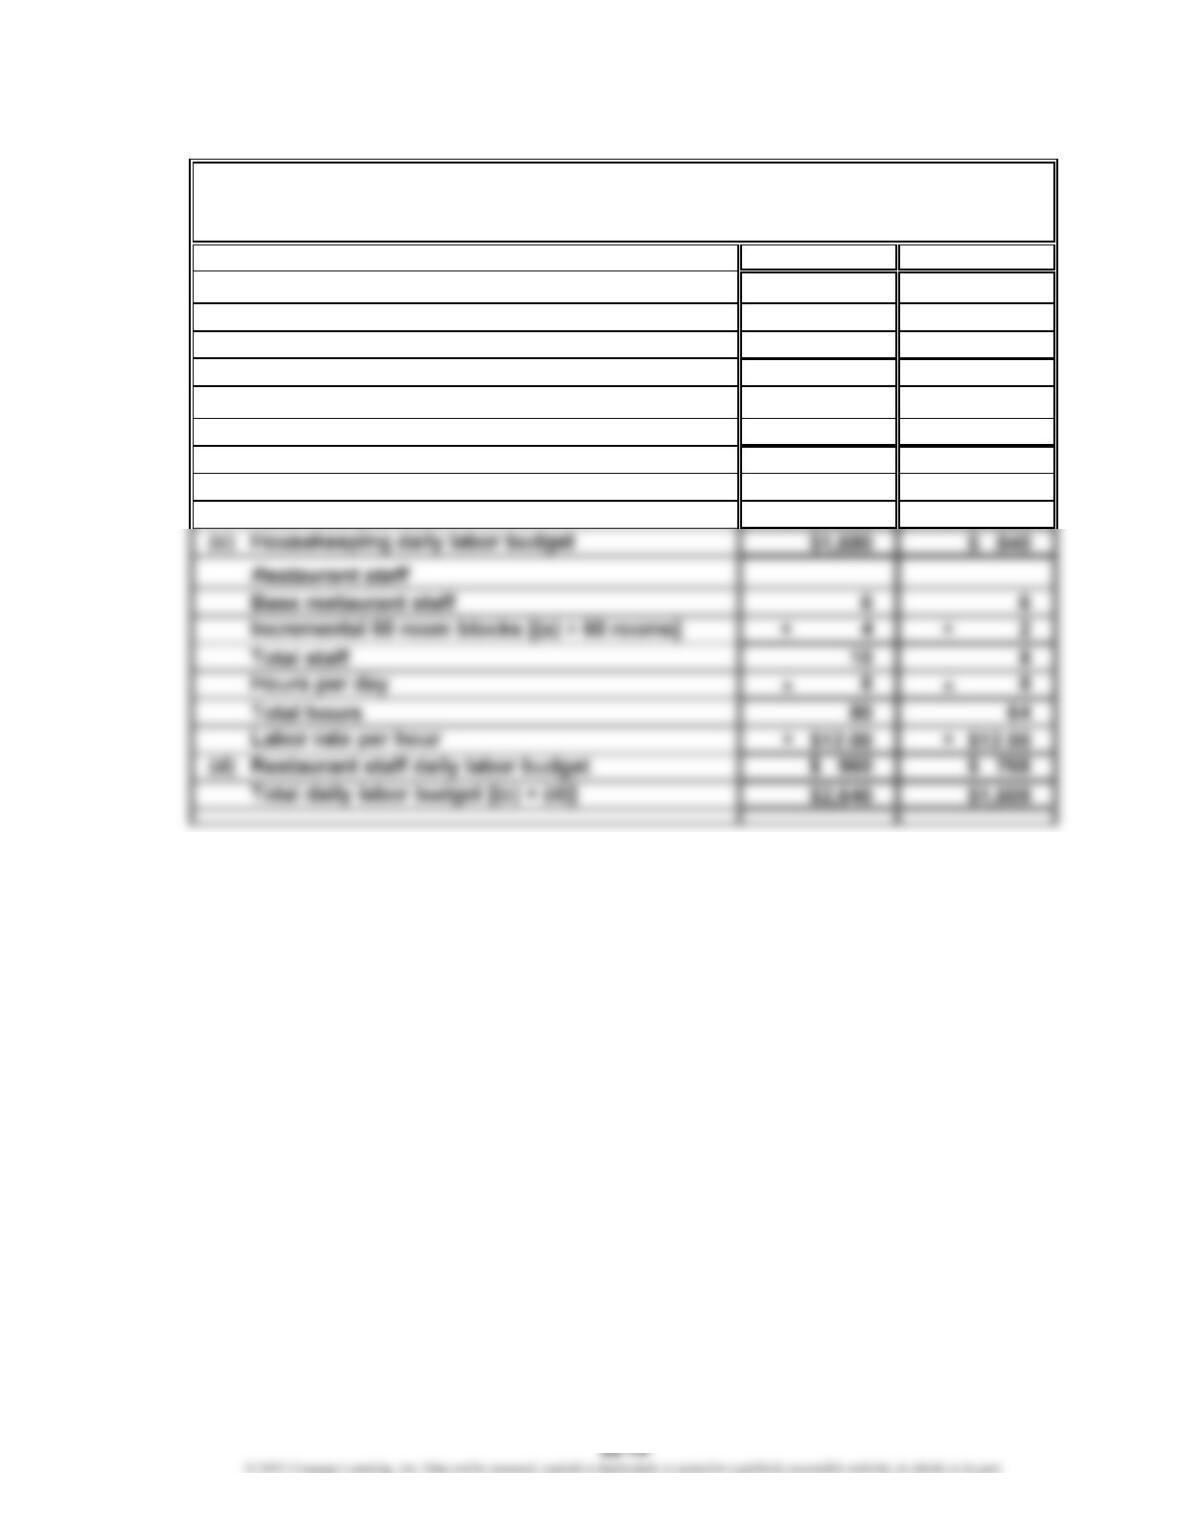
Ex. 22-13
Weekday Weekend Day
Room occupancy
Room capacity 300 300
Occupied percent (occupancy) 80% 40%
(a) Rooms occupied 240 120
Housekeeping
(b) Number of minutes to clean a room 30 30
Total minutes [(a) × (b)] 7,200 3,600
Total hours (Total minutes ÷
60 min.) 120.0 60.0
Labor rate per hou
r
$14.00 $14.00
Ambassador Suites Inc.
Direct Labor Cost Budget
For a Weekday or a Weekend Day
××
××
××
r
CHAPTER 22 Budgeting
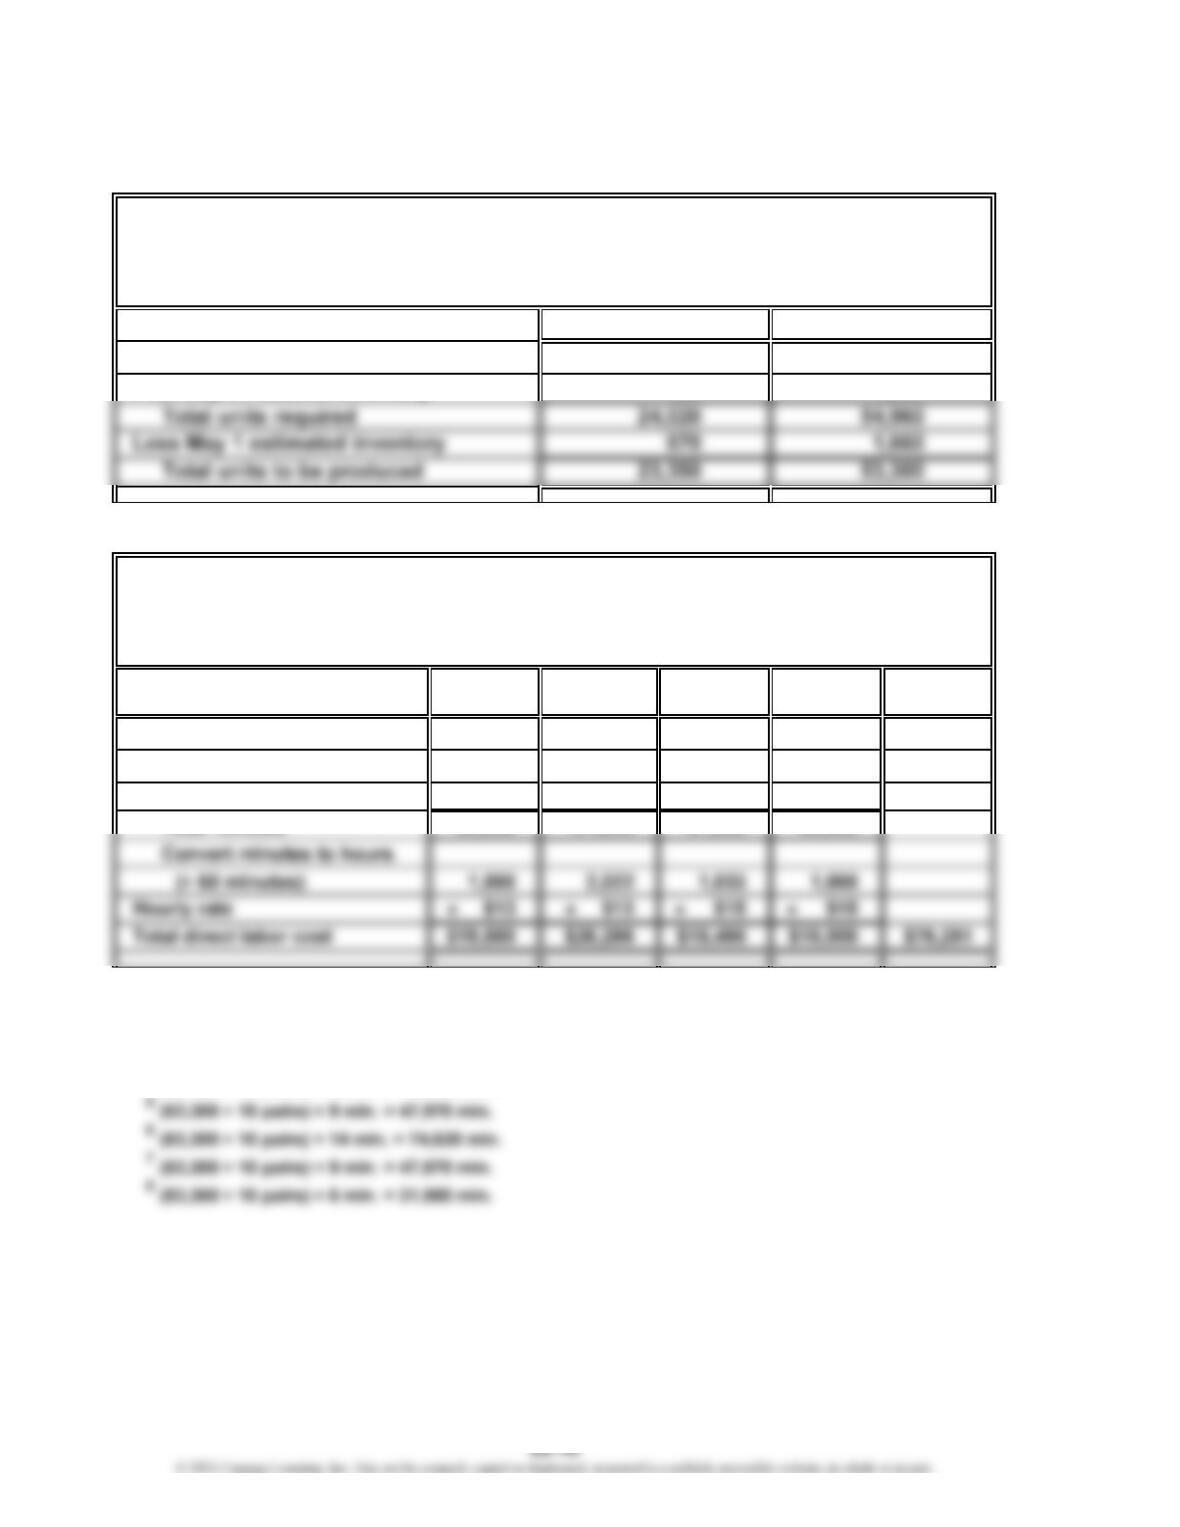
Ex. 22-14
a.
Expected units to be sold
Plus May 31 desired inventory
b.
Outer-
Inseam seam Pockets Zippe
r
Total
Hours required for production:
Dockers
®
(in minutes) 42,030 46,700 14,010 28,020
501
®
Jeans (in minutes) 47,970 74,620 47,970 31,980
1
(23,350 ÷ 10 pairs) × 18 min. = 42,030 min.
2
(23,350 ÷ 10 pairs) × 20 min. = 46,700 min.
3
(23,350 ÷ 10 pairs) × 6 min. = 14,010 min.
4
(23,350 ÷ 10 pairs) × 12 min. = 28,020 min.
Levi Strauss & Co.
Production Budget
(assumed data)
For the Month Ending May 31
Levi Strauss & Co.
501
®
Jeans
53,100
Dockers
®
23,600
420
(assumed data)
For the Month Ending May 31
1,860
Direct Labor Cost Budget
1234
5678
CHAPTER 22 Budgeting
Ex. 22-15
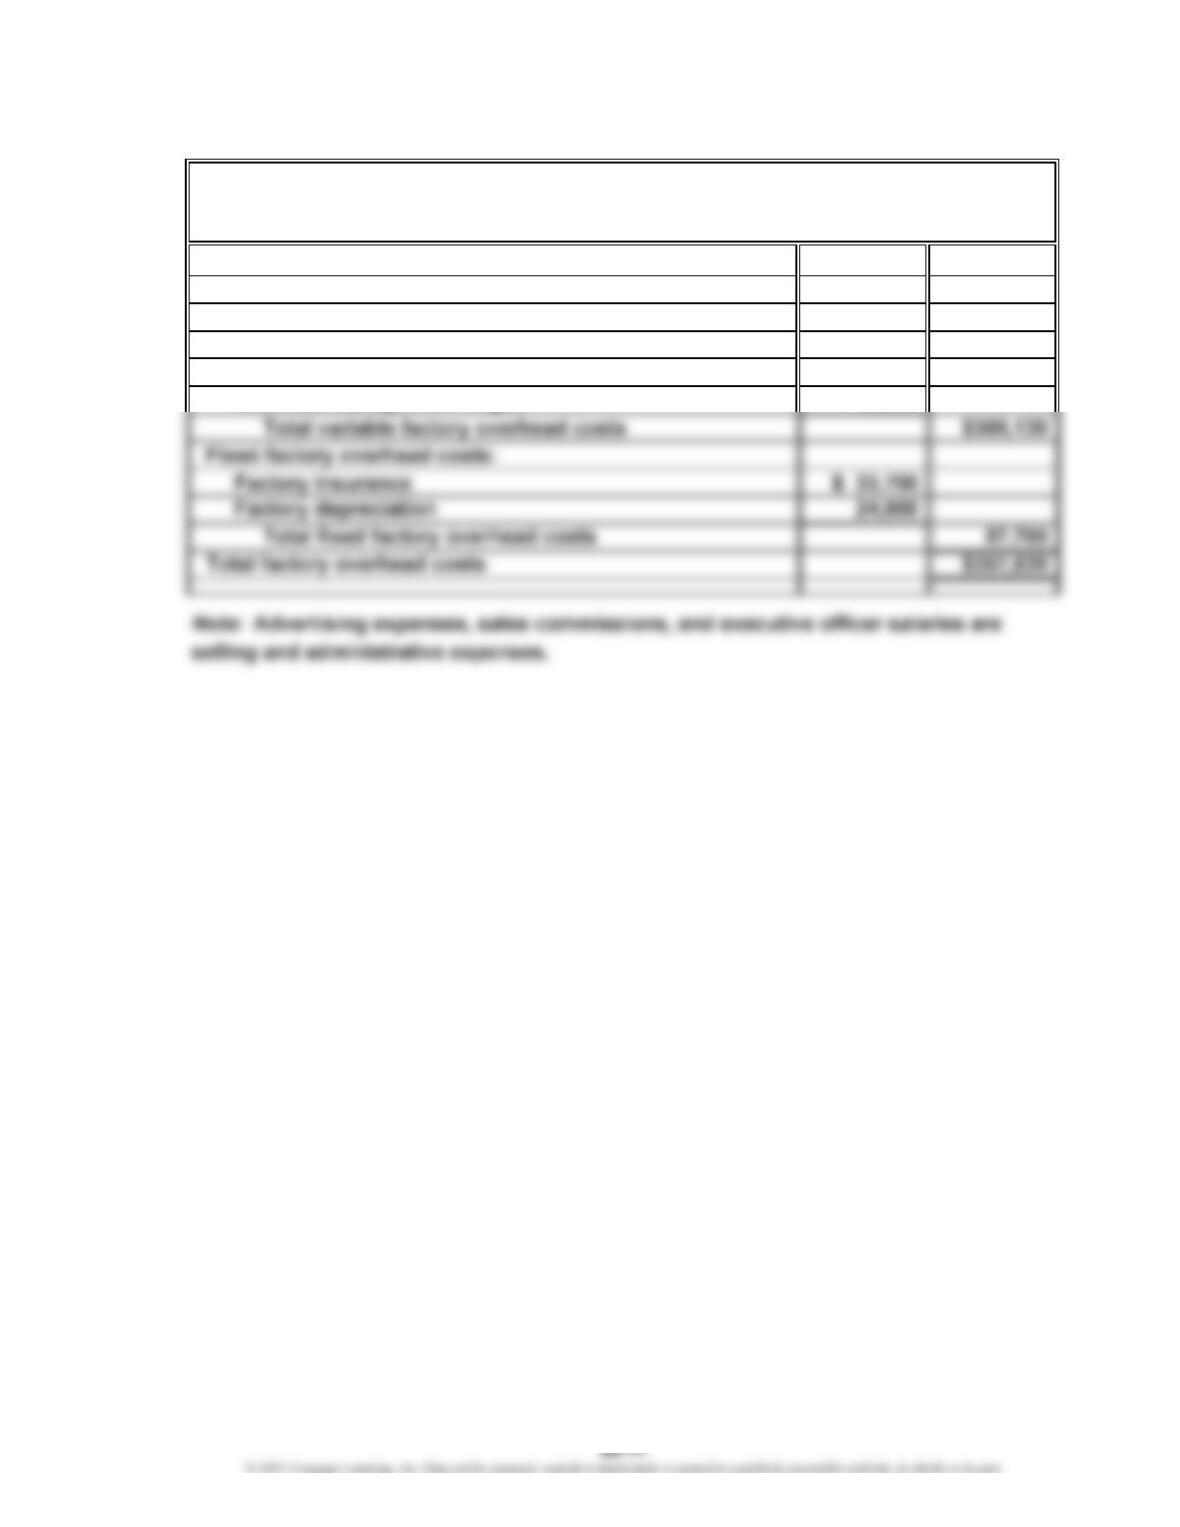
Variable factory overhead costs:
Manufacturing supplies $ 15,680
Power and light 53,760
Production supervisor wages 151,200
Production control wages 35,840
Materials management wages 43,650
Toot Sweet Candy Company
Factory Overhead Cost Budget
For the Month Ending August 31
CHAPTER 22 Budgeting
Ex. 22-16
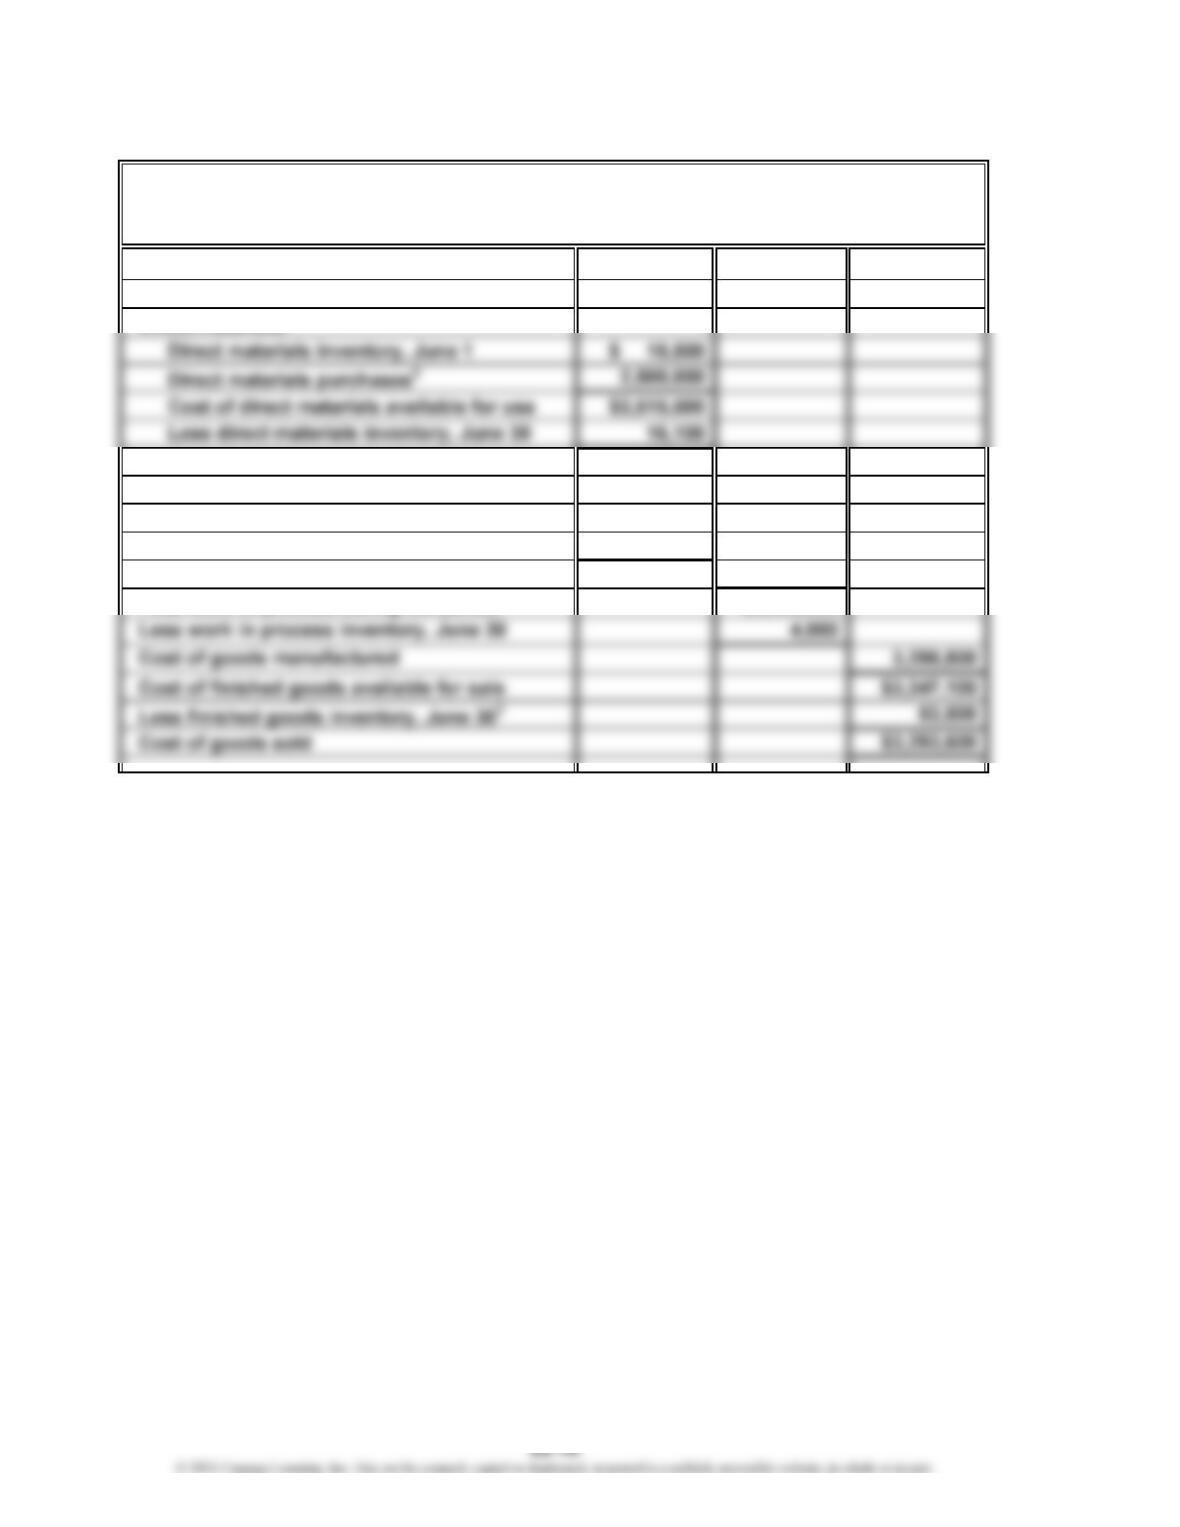
Finished goods inventory, June 1
1
$ 48,300
Work in process inventory, June 1 $ 3,400
Cost of direct materials placed in
production $2,499,400
Direct labor 300,000
Factory overhead 500,000
Total manufacturing costs 3,299,400
1
$25,400 + $22,900
2
50,000 barrels × $50 per barrel
3
$28,500 + $25,000
Wilmington Chemical Company
Cost of Goods Sold Budget
For the Month Ending June 30
CHAPTER 22 Budgeting
Ex. 22-17
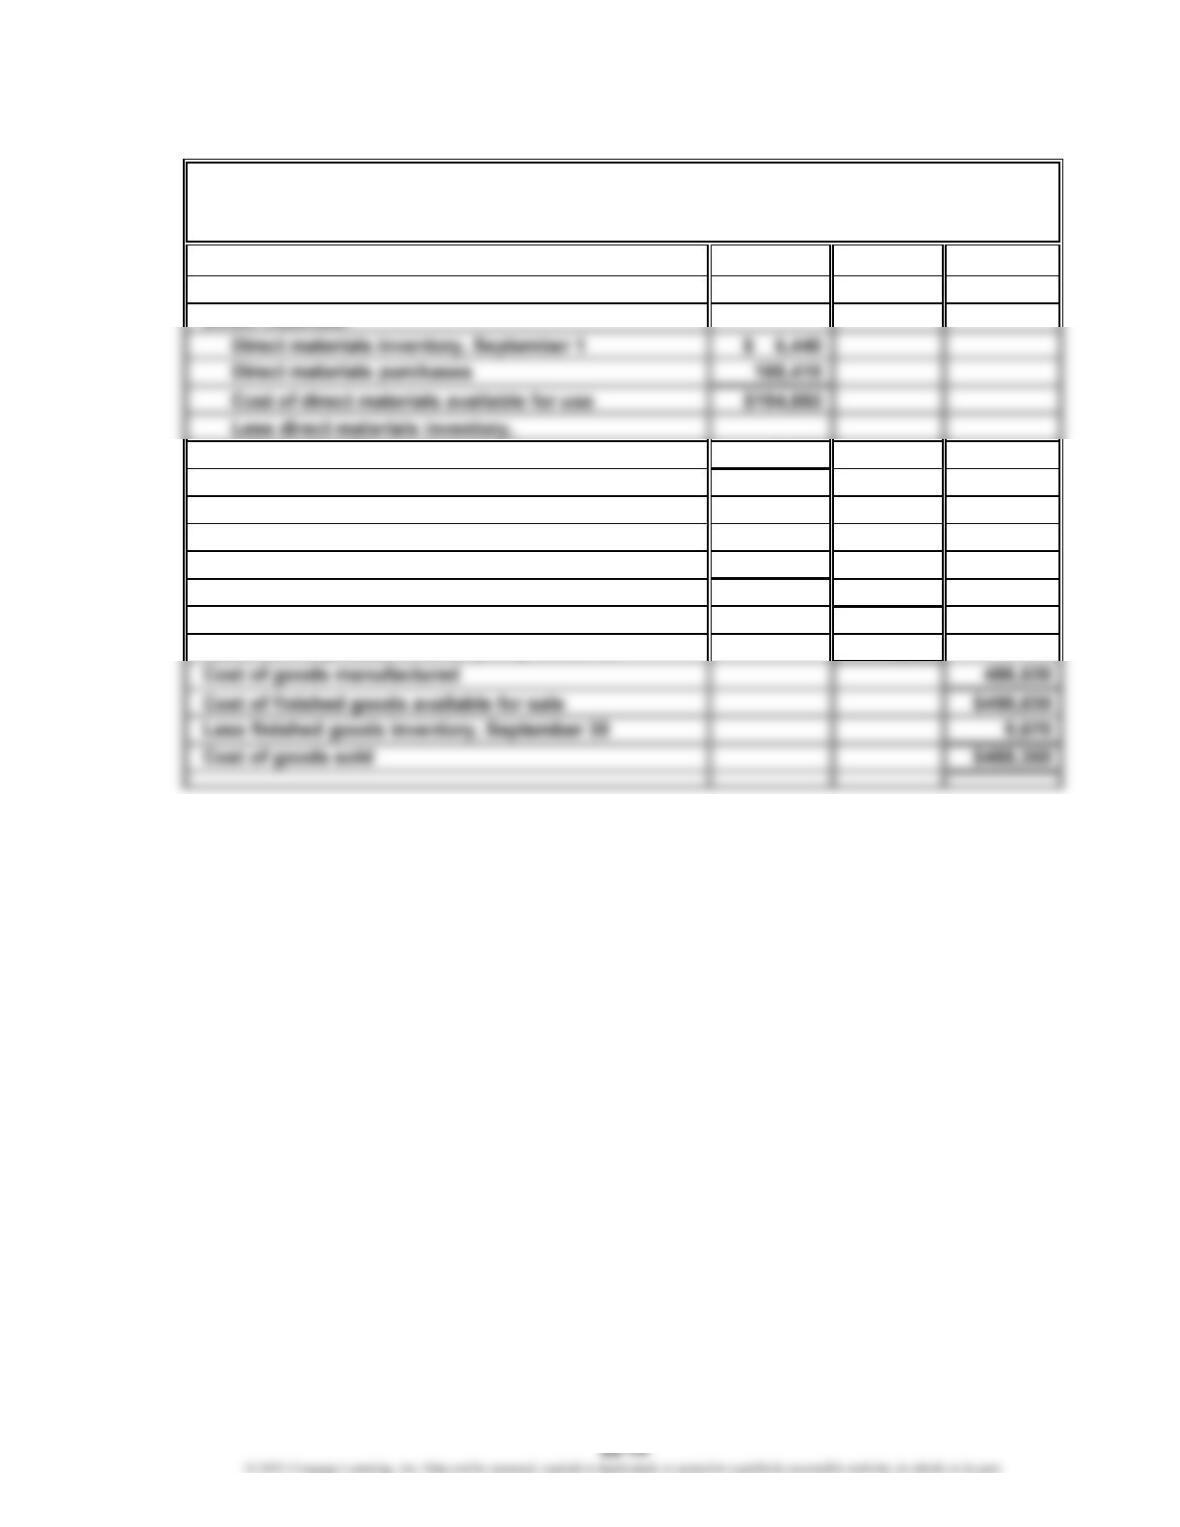
Finished goods inventory, September 1 $ 11,500
Work in process inventory, September 1 $ 3,400
September 30 8,830
Cost of direct materials placed in
production $186,020
Direct labor 193,600
Factory overhead 105,500
Total manufacturing costs 485,120
Total work in process during the period $488,520
Less work in process inventory, September 30 1,990
MingWare Ceramics Inc.
Cost of Goods Sold Budget
For the Month Ending September 30
CHAPTER 22 Budgeting
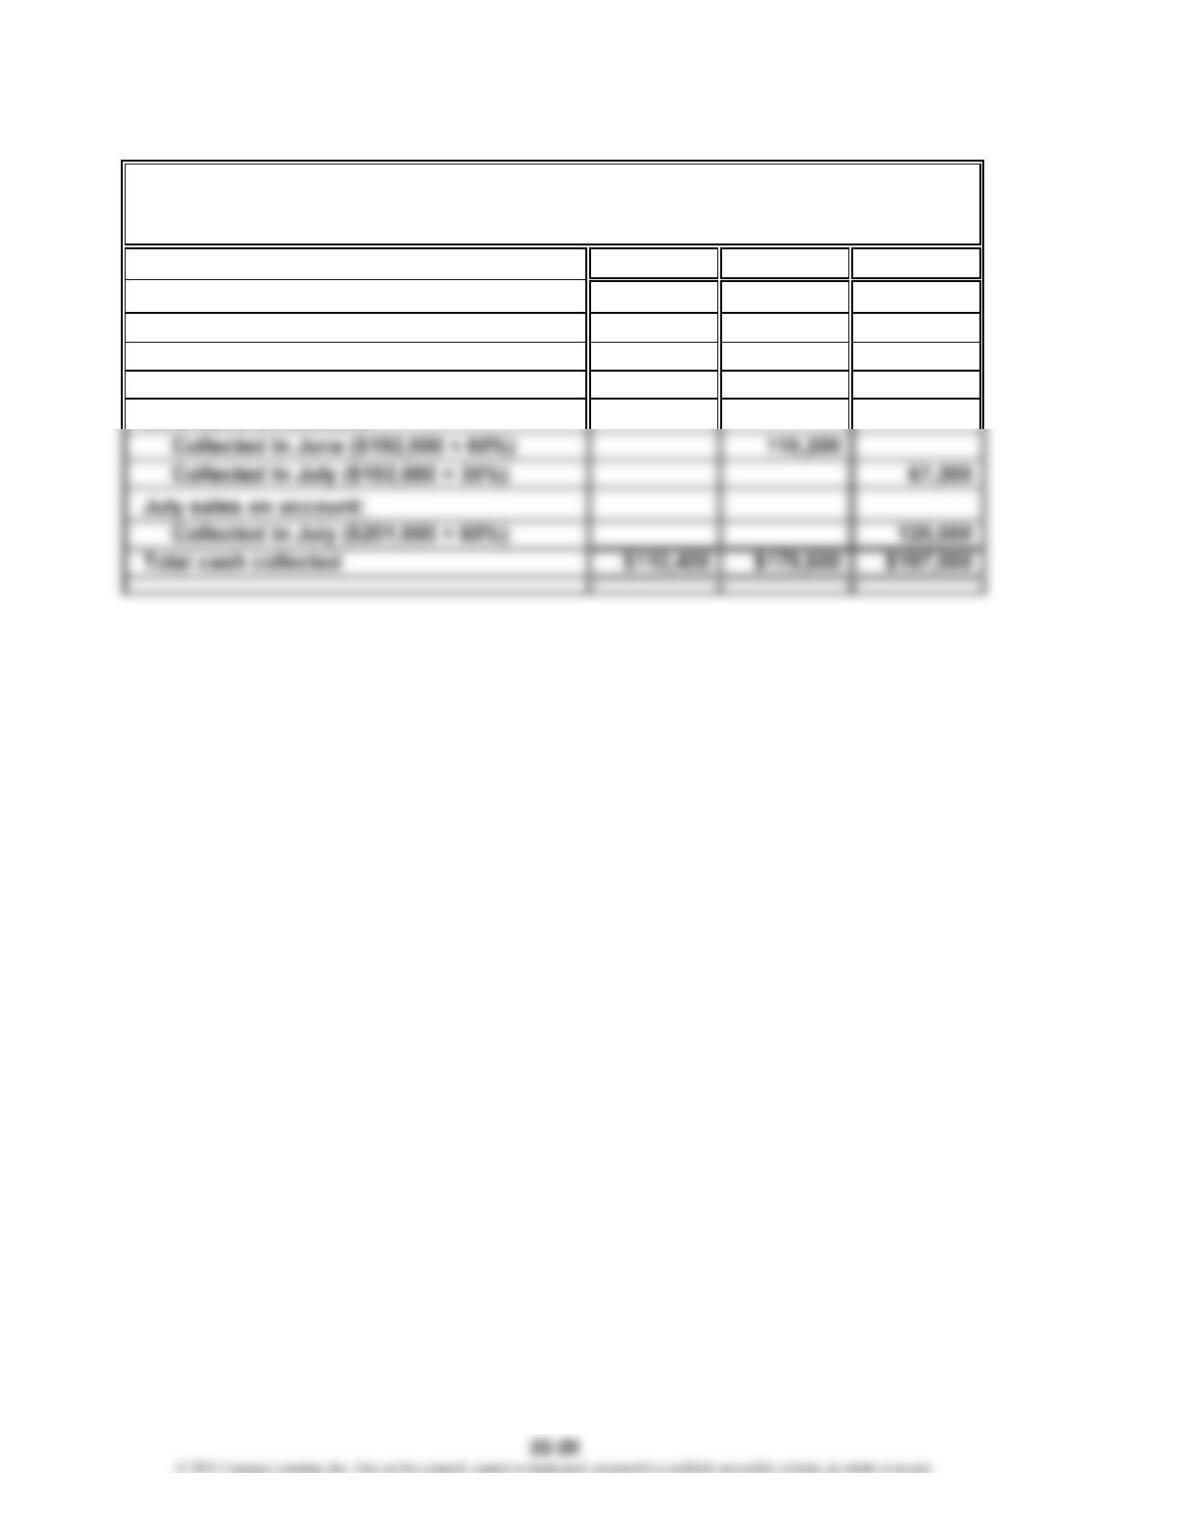
Ex. 22-18
May June July
May sales on account:
Collected in May ($184,000 × 60%) $110,400
Collected in June ($184,000 × 35%) $ 64,400
Collected in July ($184,000 × 5%) $ 9,200
Bark & Purr Supplies Inc.
Schedule of Collections from Sales
For the Three Months Ending July 31