CHAPTER 21 Cost Behavior and Cost-Volume-Profit Analysis
Prob. 21–3B
3.
4. Sales (32,000 × $150)…………………………… $4,800,000
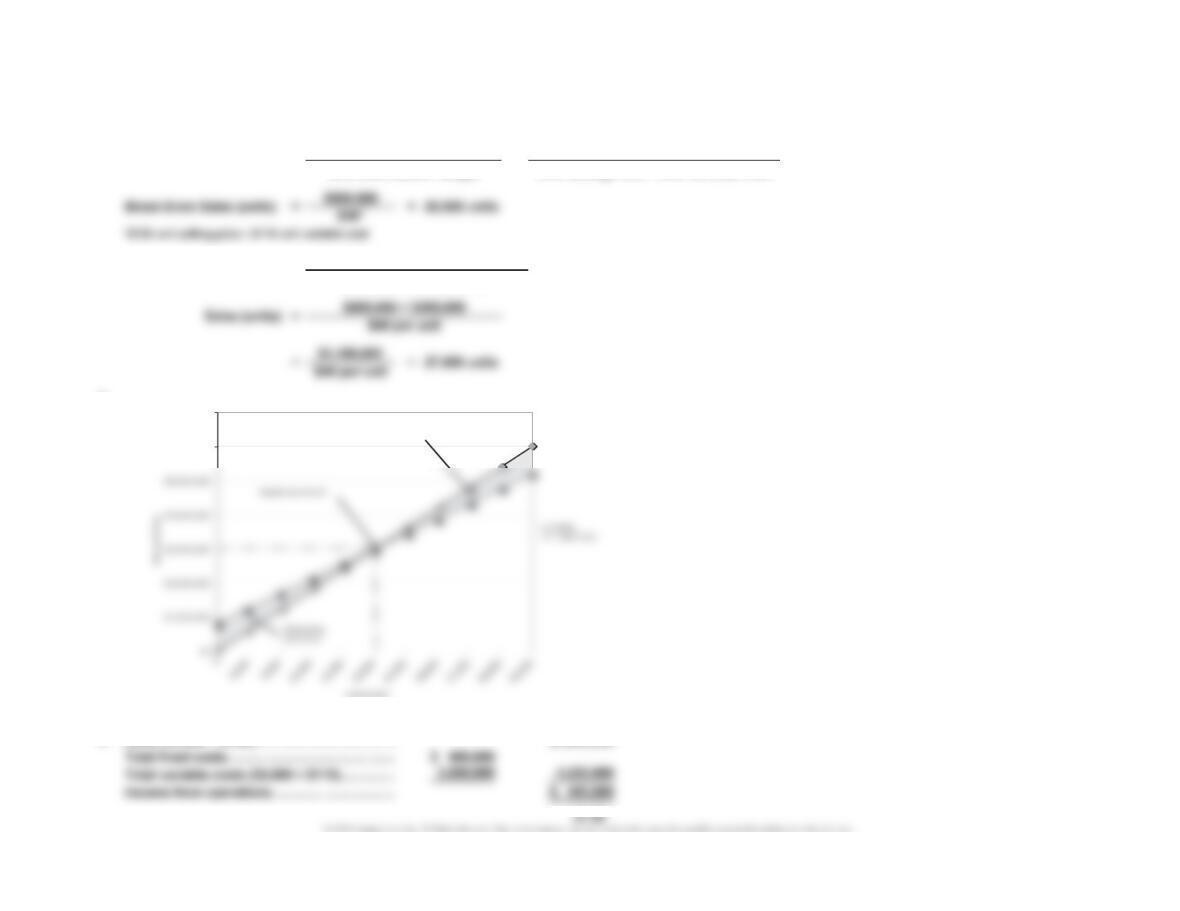
1. Break-Even Sales (units) = Total Fixed Costs
Unit Contribution Margin
2. Sales (units) = Total Fixed Costs + Target Profit
Unit Contribution Margin
=Total Fixed Costs
Unit Selling Price – Unit Variable Cost
$6,000,000
$7,000,000
Operating Profit Area
CHAPTER 21 Cost Behavior and Cost-Volume-Profit Analysis
Prob. 21–4B
1.
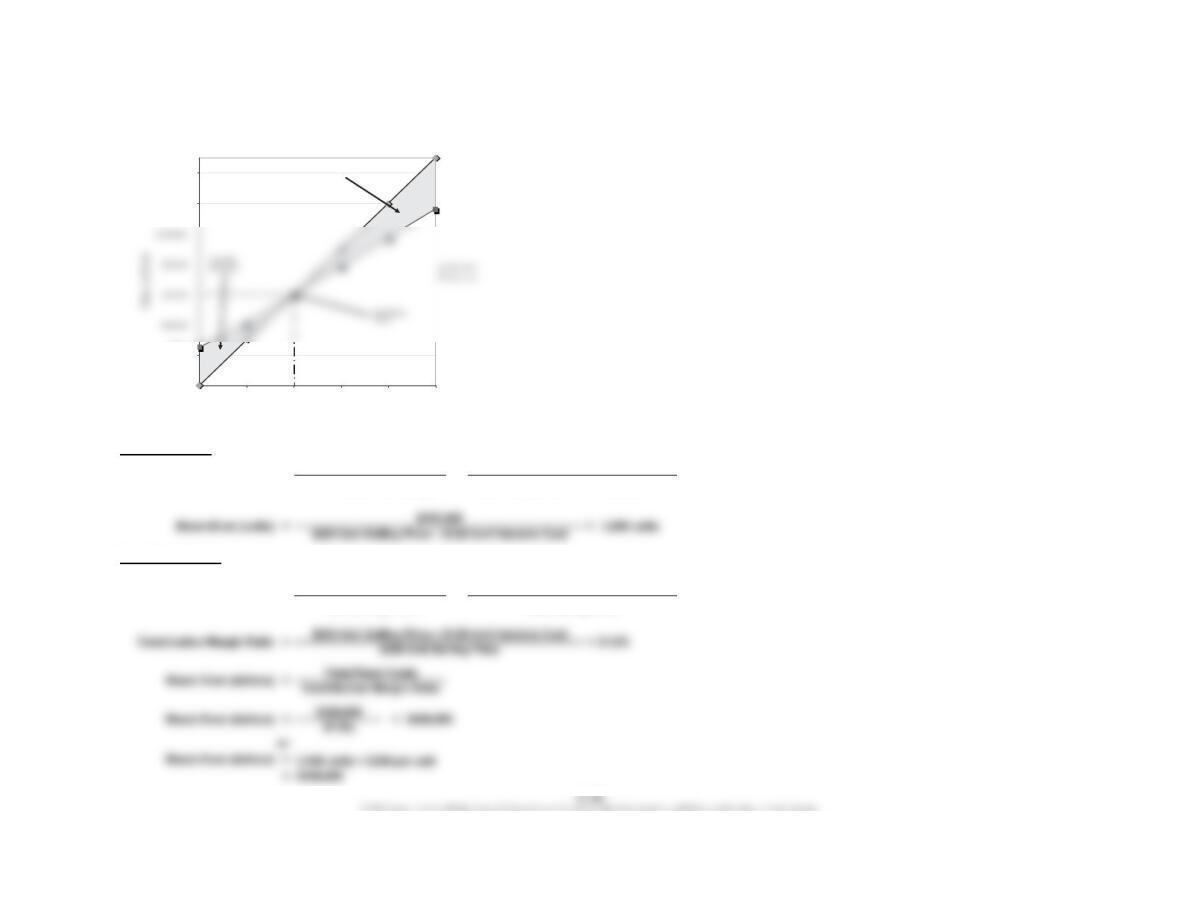
Break-Even Units:
Break-Even Dollars:
=Unit Selling Price – Unit Variable Cost
Unit Selling Price
Contribution Margin Ratio = Unit Contribution Margin
Unit Selling Price
Break-Even Sales (units) = Total Fixed Costs =Total Fixed Costs
Unit Contribution Margin Unit Selling Price – Unit Variable Cost
$0
$200,000
$1,200,000
$1,400,000
0 1,500 3,000 4,500 6,000 7,500
Units of Sales
Operating
Profit Area
$225,000
CHAPTER 21 Cost Behavior and Cost-Volume-Profit Analysis
Prob. 21–4B (Continued)
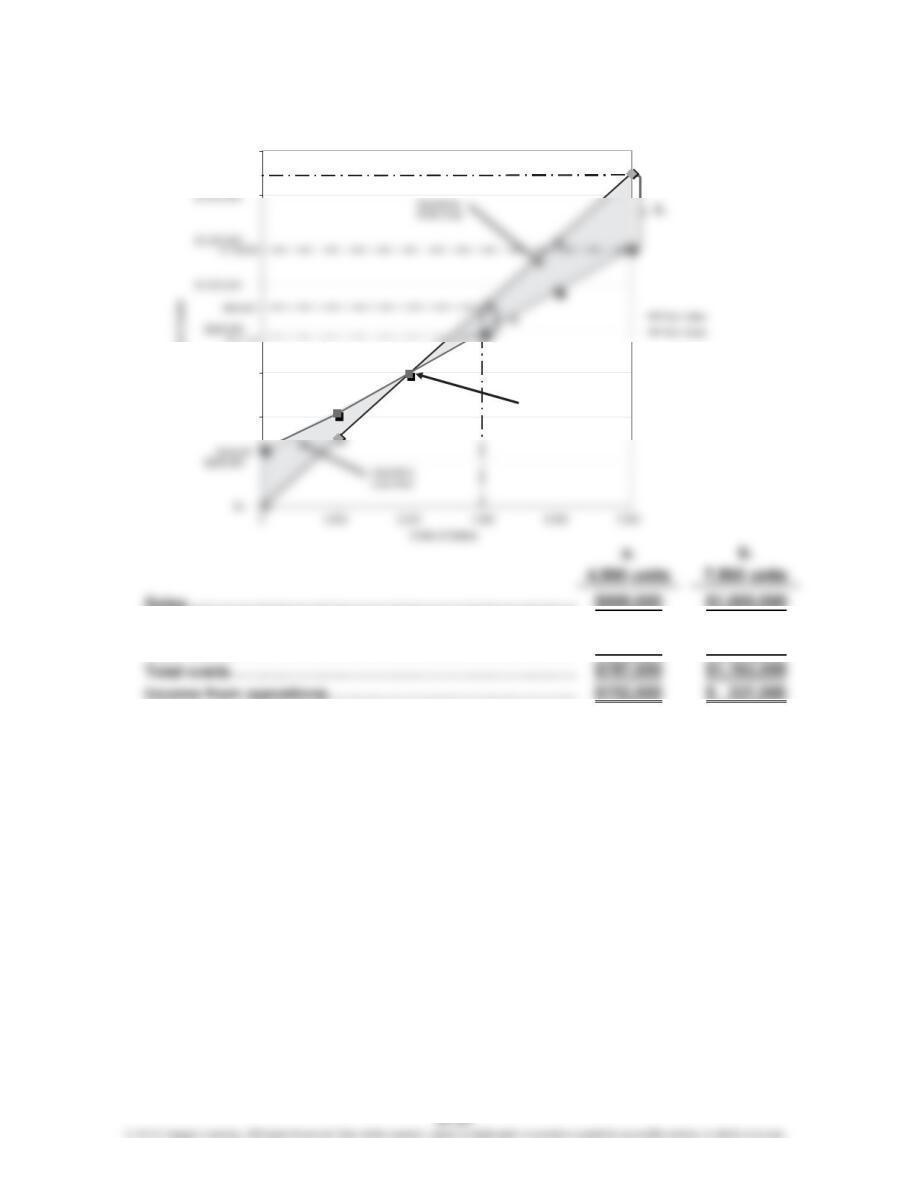
2.
Sales………………………………………………………………
…
V
ariable costs…………………………………………………… $562,500 $ 937,500
Fixed costs………………………………………………………
…
225,000 225,000
$400,000
$600,000
$1,600,000
Sales and Costs
Break-Even
Point
$1,500,000
CHAPTER 21 Cost Behavior and Cost-Volume-Profit Analysis
Prob. 21–4B (Continued)
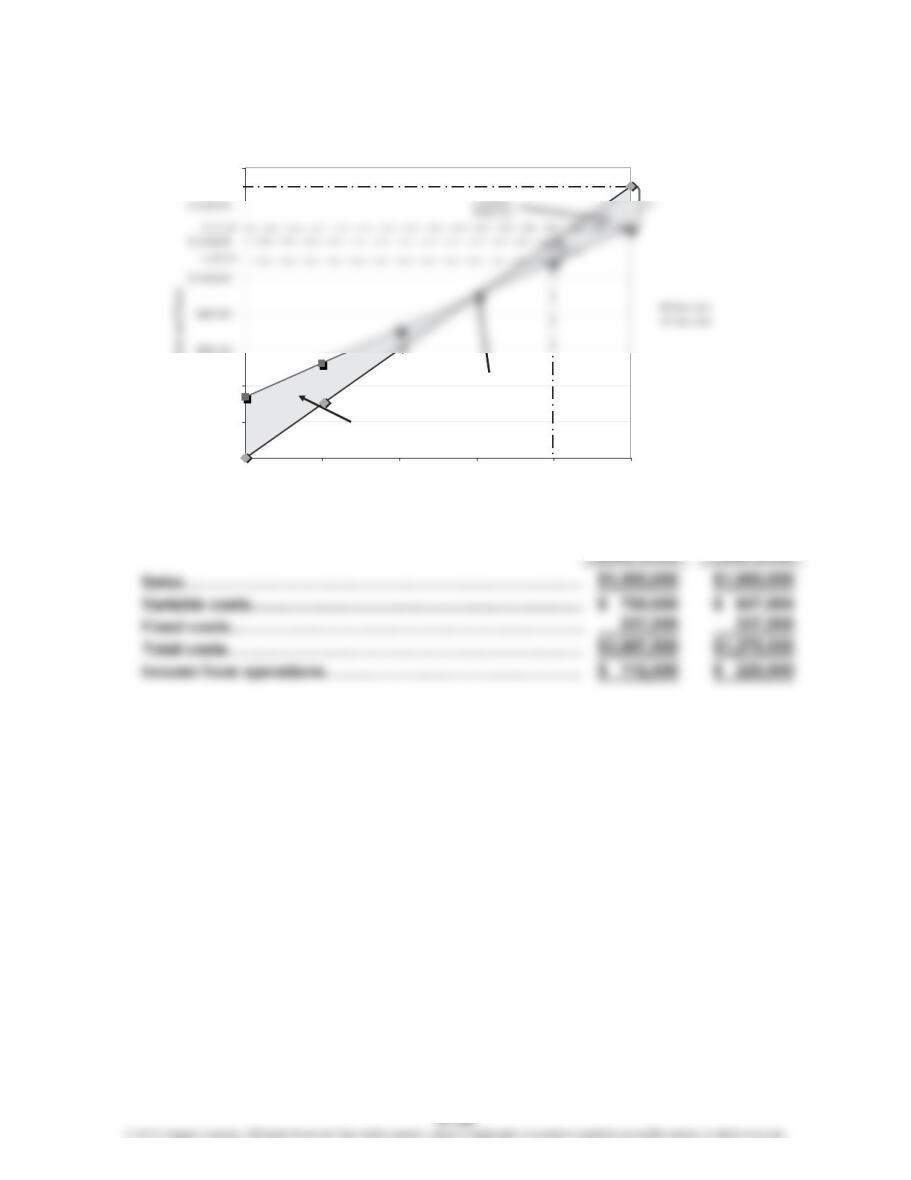
3.
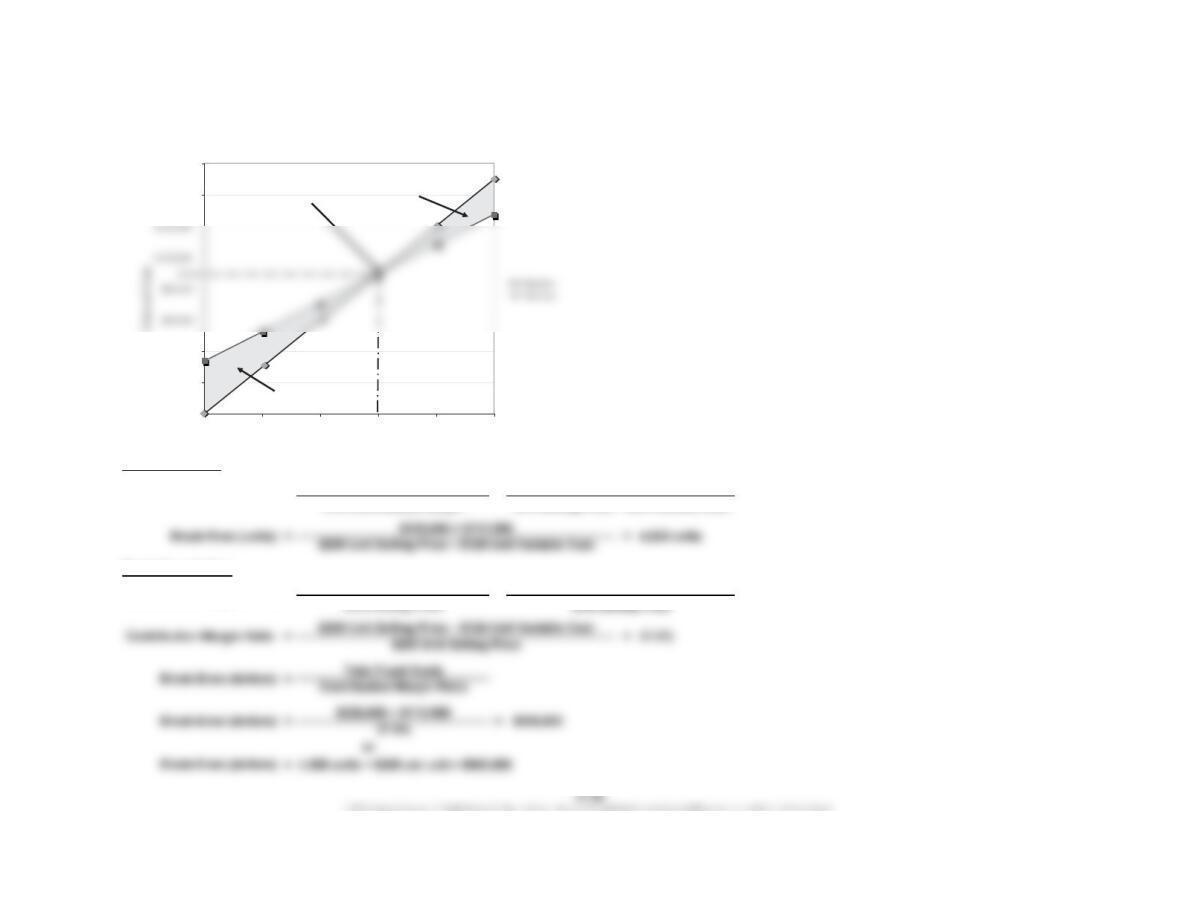
Break-Even Units:
Break-Even Dollars:
=
Unit Contribution Margin
Break-Even Sales (units) = Total Fixed Costs
Unit Selling Price – Unit Variable Cost
Total Fixed Costs =
Contribution Margin Ratio
Unit Contribution Margin =
Unit Selling Price
Unit Selling Price – Unit Variable Cost
Unit Selling Price
$0
$200,000
$400,000
$1,400,000
$1,600,000
0 1,500 3,000 4,500 6,000 7,500
Units of Sales
Operating
Profit Area
Operating
Loss Area
Break-Even
Point
$337,500
CHAPTER 21 Cost Behavior and Cost-Volume-Profit Analysis
Prob. 21–4B (Concluded)
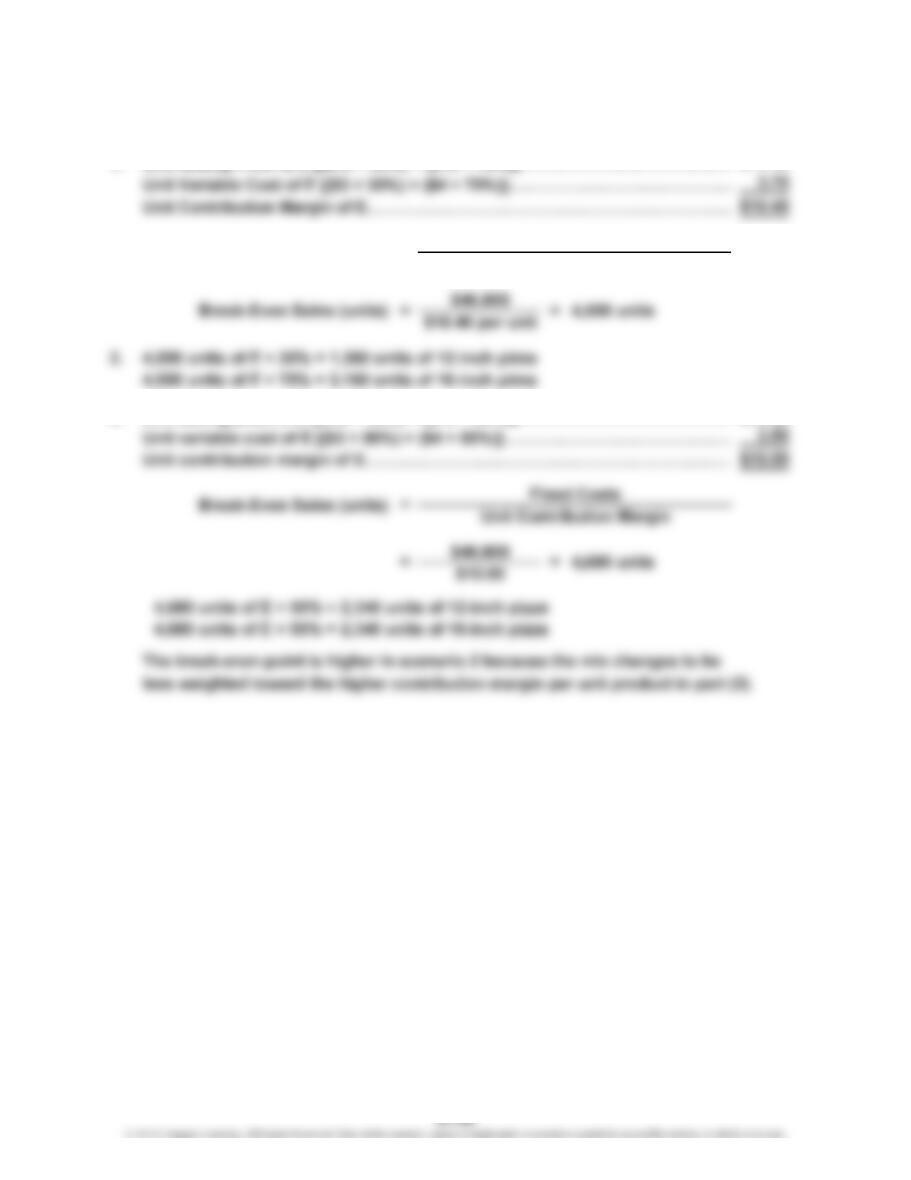
4.
a. b.
6,000 units 7,500 units
$0
$200,000
$400,000
$1,600,000
0 1,500 3,000 4,500 6,000 7,500
Sales and Costs
Units of Sales
Break-Even
Point
Operating
Loss Area
$1,500,000
$337,500
CHAPTER 21 Cost Behavior and Cost-Volume-Profit Analysis
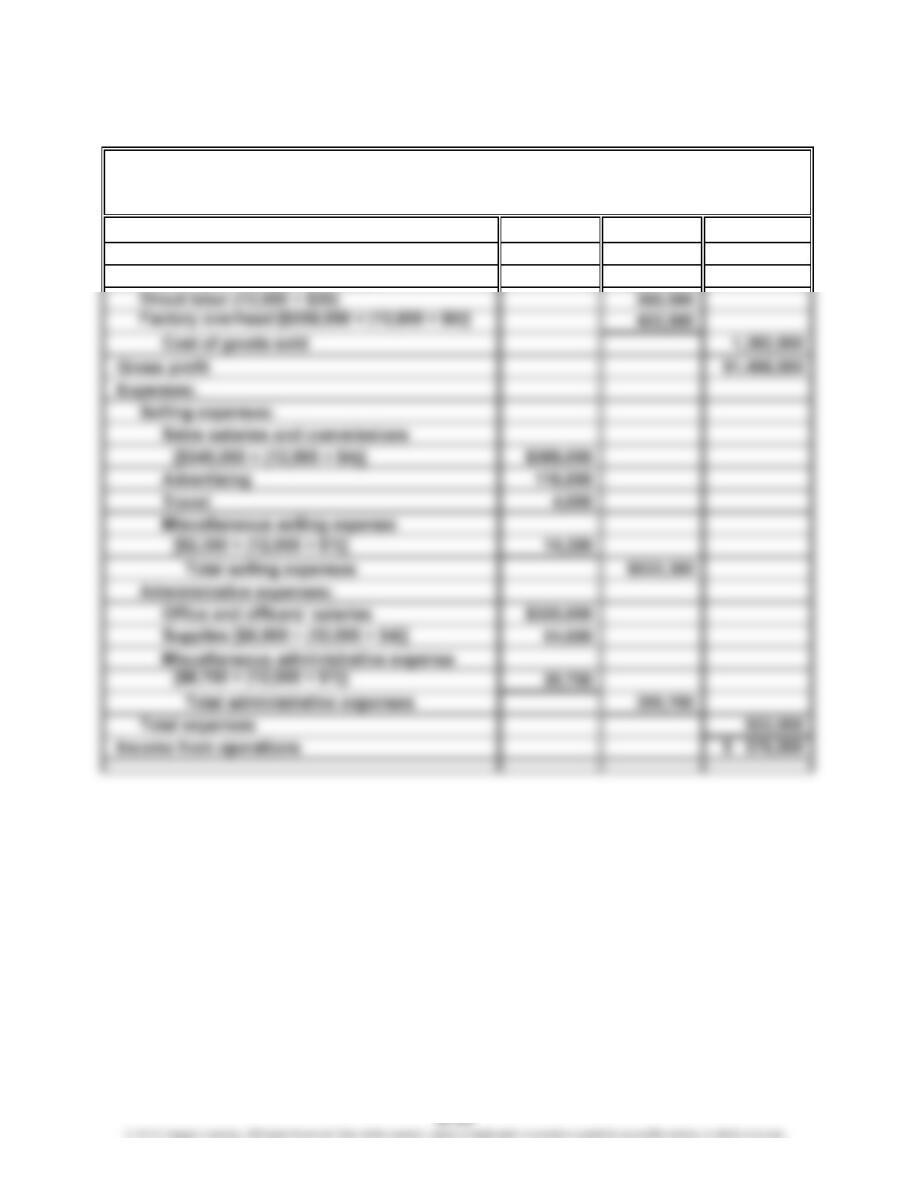
Prob. 21–5B
(Overall product is labeled E.)
1. Unit Selling Price of E [($12 × 30%) + ($15 × 70%)]…………………………………
…
$14.10
3. Unit selling price of E [($12 × 50%) + ($15 × 50%)]…………………………………
…
$13.50
…
Break-Even Sales (units)
=Fixed Costs
Unit Contribution Margin
CHAPTER 21 Cost Behavior and Cost-Volume-Profit Analysis
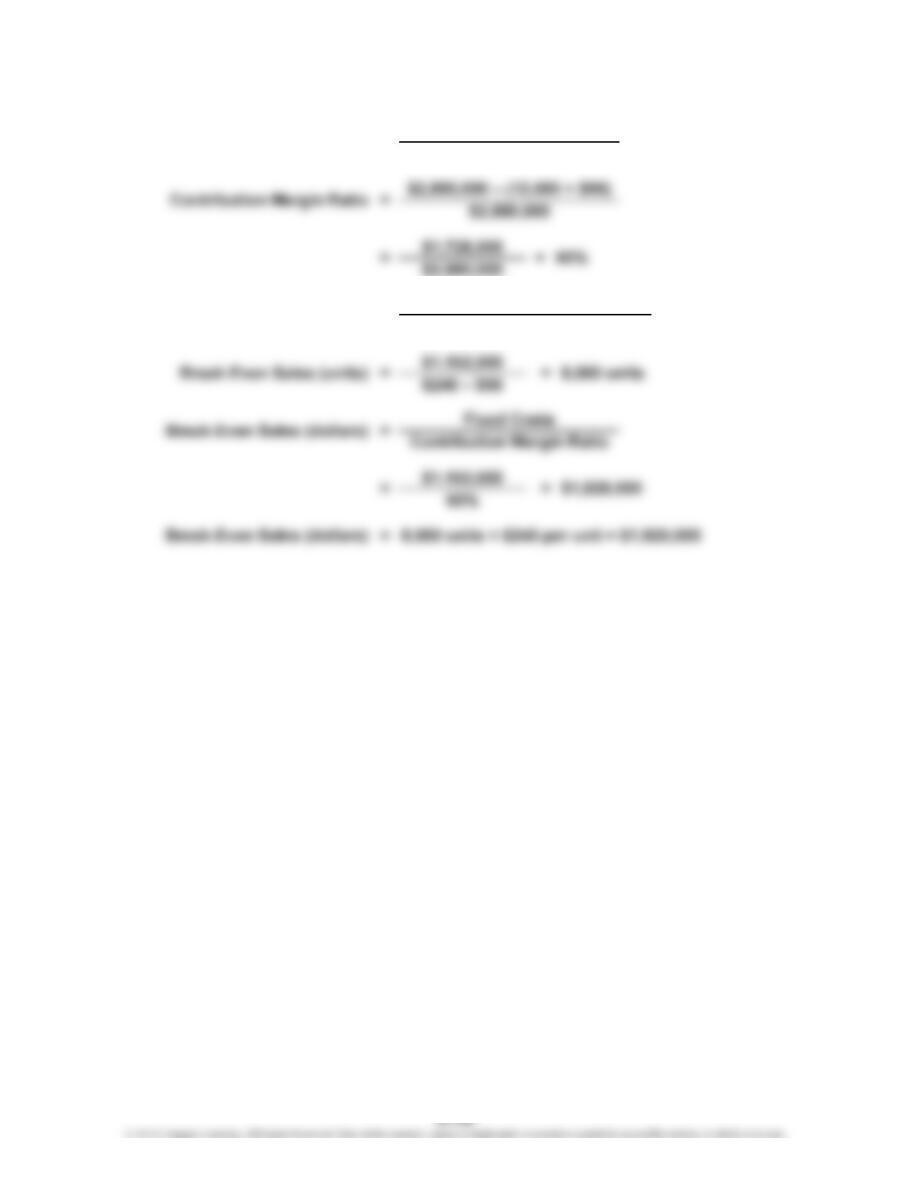
Prob. 21–6B
1.
Sales (12,000 × $240) $2,880,000
Cost of goods sold:
Direct materials (12,000 × $50) $600,000
BELMAIN CO.
Estimated Income Statement
For the Year Ended December 31, 2014
CHAPTER 21 Cost Behavior and Cost-Volume-Profit Analysis
Prob. 21–6B (Continued)
3. Break-Even Sales (units) = Fixed Costs
Unit Contribution Margin
2. Contribution Margin Ratio = Sales – Variable Costs
Sales
CHAPTER 21 Cost Behavior and Cost-Volume-Profit Analysis
Prob. 21–6B (Concluded)
4.
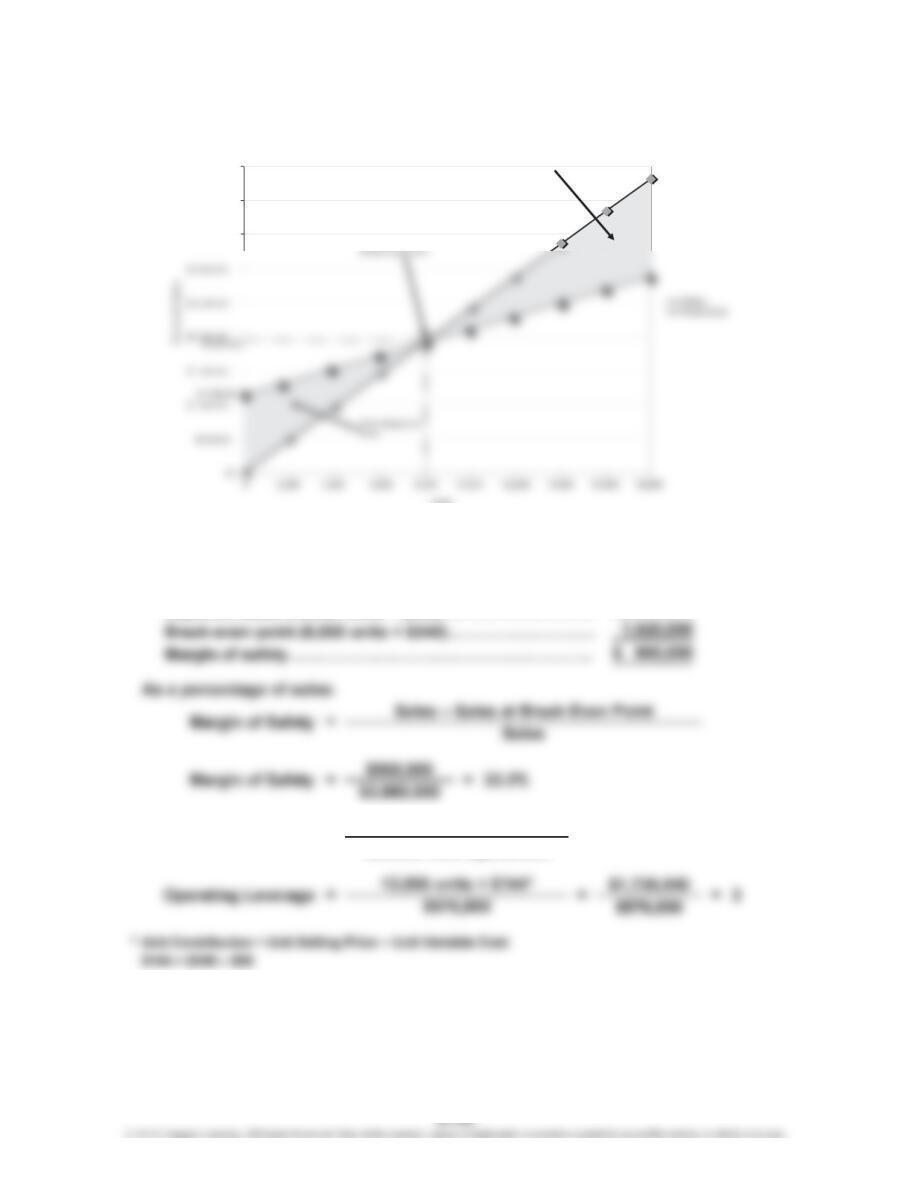
5. Margin of safety:
In dollars:
Expected sales (12,000 units × $240)………………………
…
$2,880,000
6.
Contribution Margin
Income from Operations
Operating Leverage =
$3,500,000
$4,000,000
$4,500,000
Units
Operating
Profit Area
CHAPTER 21 Cost Behavior and Cost-Volume-Profit Analysis
CP 21–1
In an absolute sense, Edward’s actions are devious. He is clearly attempting
to use the first four-year scenario, which is favorable, as a way to market the
partnerships. They are really longer-term investments. After the first four
CASES & PROJECTS
CP 21–2
The airline industry has a high operating leverage. This means that fixed costs
are a large part of the cost structure. The break-even volume is apparently around
65% of capacity. When the volume falls below 65%, the industry loses money. As
the percentage increases above 65%, the industry becomes very profitable. There
The airline strategy of raising ticket prices and consolidating routes may be a
successful strategy; however, there are a number of considerations. First, the
higher ticket prices would increase the revenue per passenger-mile and reduce
the break-even occupancy percentage only if it is assumed that there is no
change in passenger volume. However, this is unlikely. The revenue from price
increases would need to increase faster than the lost revenue from lower traffic
The strategy of consolidating routes attacks a major cost of airlines. The number
of flights and terminals served drives fuel and airport ground- and terminal-related
costs. Therefore, consolidating routes by either reducing the number of terminals
served and/or the number of flights is a method of achieving some economies of
scale. For example, an airline could consolidate three flights departing in the
CHAPTER 21 Cost Behavior and Cost-Volume-Profit Analysis
CP 21–3
Do-Nothing Strategy:
Revenue – Variable Costs – Fixed Costs = Profit
CP 21–4
The direct labor costs are not variable to the increase in unit volume. The unit
volume is the wrong activity base for direct labor costs. The “number of
impressions” is a more accurate reflection of the direct labor cost. An impression
is a separate printing color application on the banners. Thus, the analysis should
be done as follows:
One Three
Color Color Total
Two
Color
Color
Four
CP 21–5
The Shipping Department manager should respond by pointing out that the
activities performed by his department are not related to sales volume but to
CP 21–6
There are many possible applications of break-even analysis in a school
environment. Below are just a few possible ideas.
Revenue Fixed Costs Variable Costs
1 Break-even number Student tuition Faculty salary, space Supplies, copying
of students in a class for a class costs
Break-Even Analysis