CHAPTER 21 Cost-Volume-Profit Analysis
Prob. 21-3B
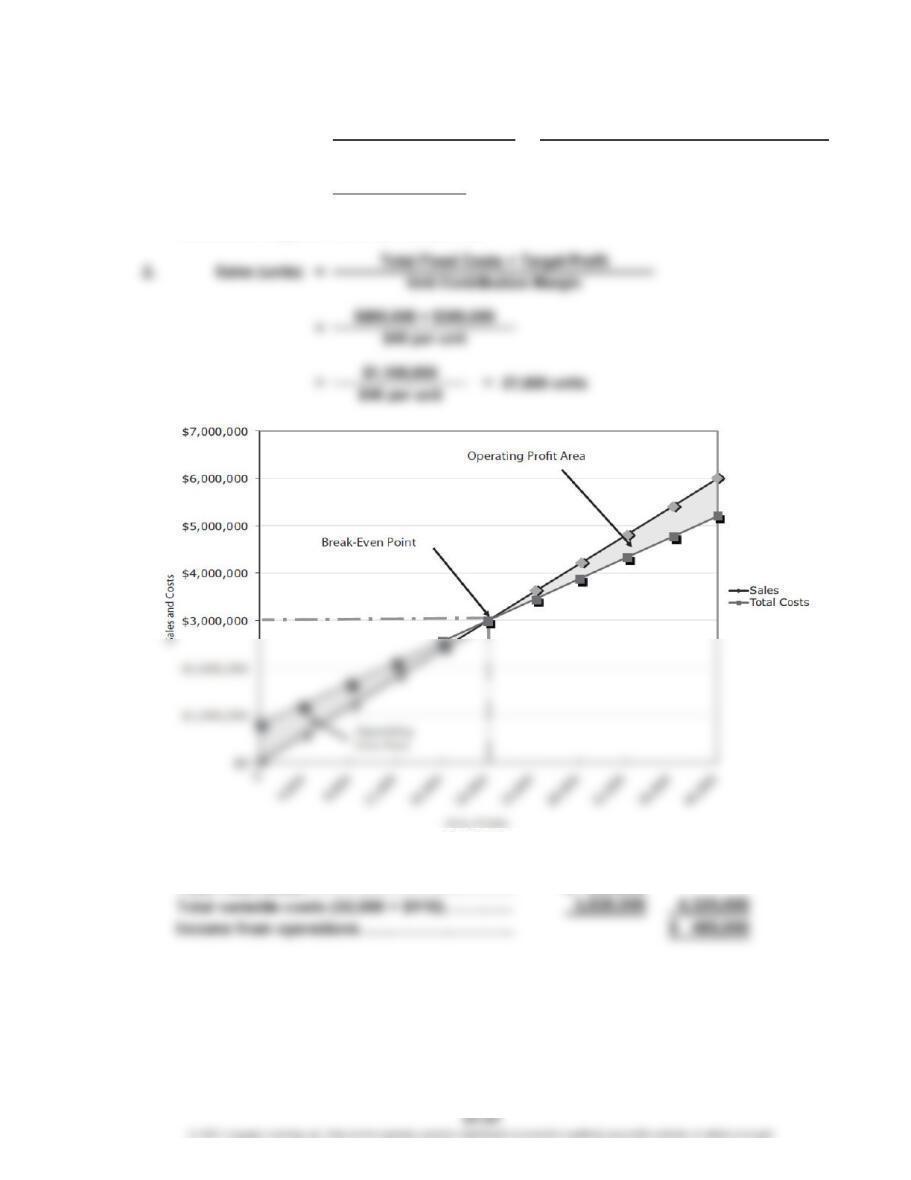
1. Break-Even
Sales (units)
$800,000
$40*
* $150 unit selling price – $110 unit variable cost
3.
4. Sales (32,000 × $150)…………………………… $4,800,000
20,000 units
==
Total Fixed Costs
Unit Selling Price – Unit Variable Cost
=Total Fixed Costs
Unit Contribution Margin =
CHAPTER 21 Cost-Volume-Profit Analysis
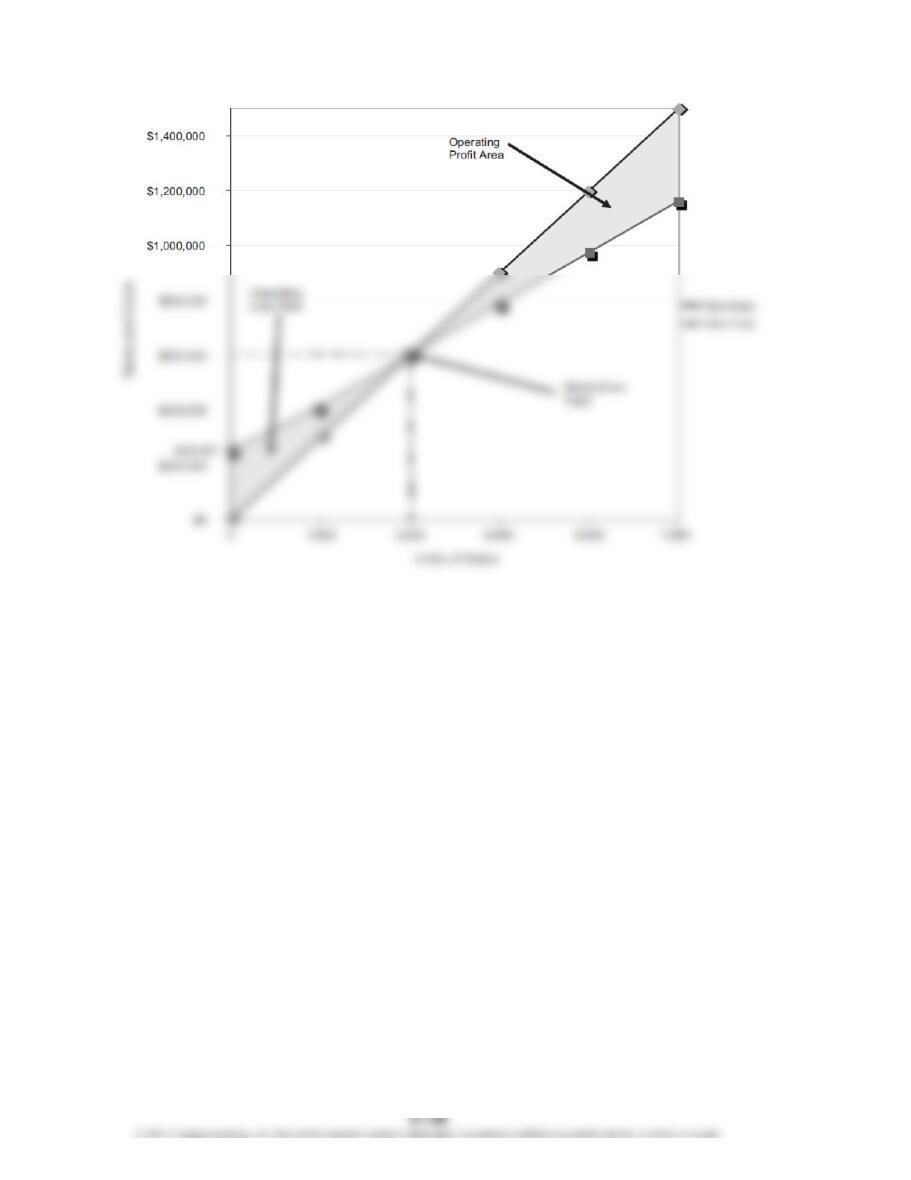
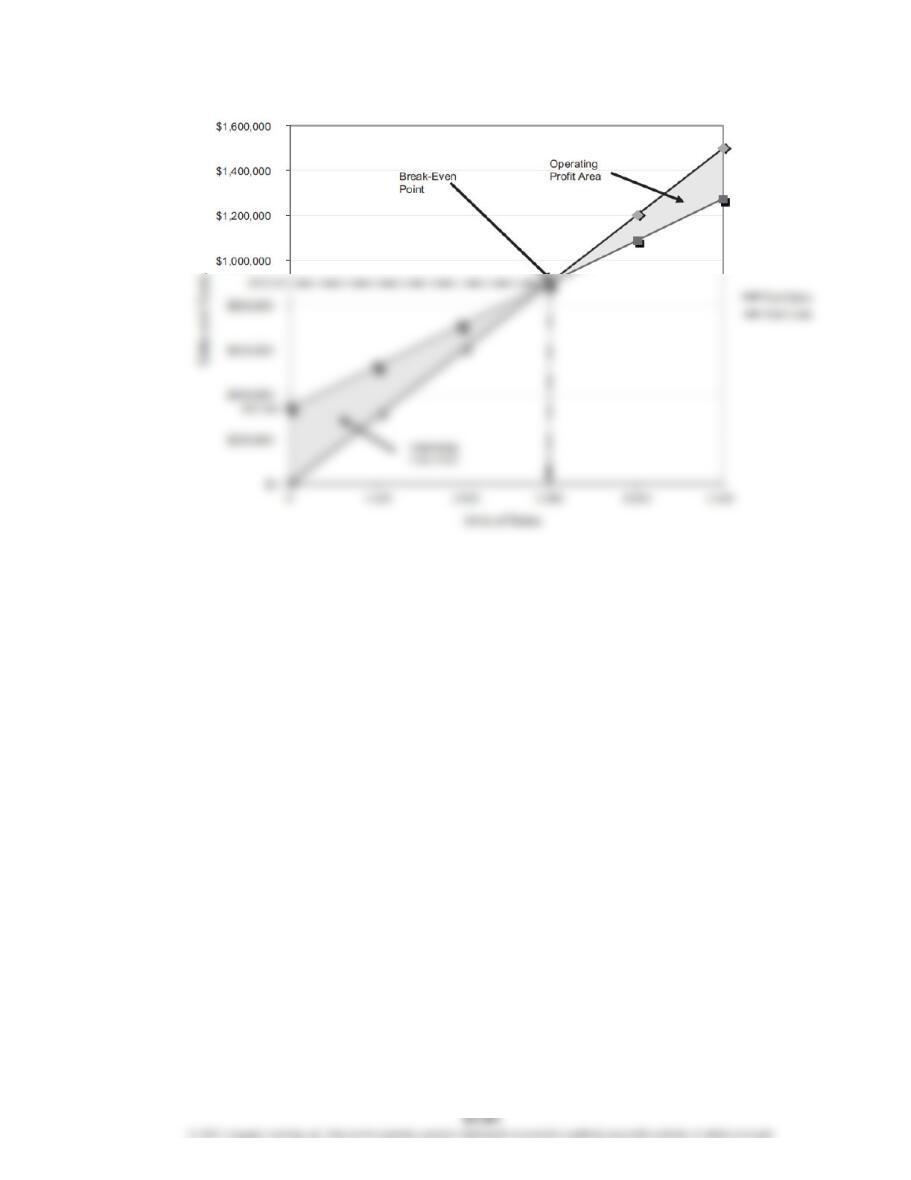
Prob. 21-4B
1.
CHAPTER 21 Cost-Volume-Profit Analysis
Prob. 21-4B (Continued)
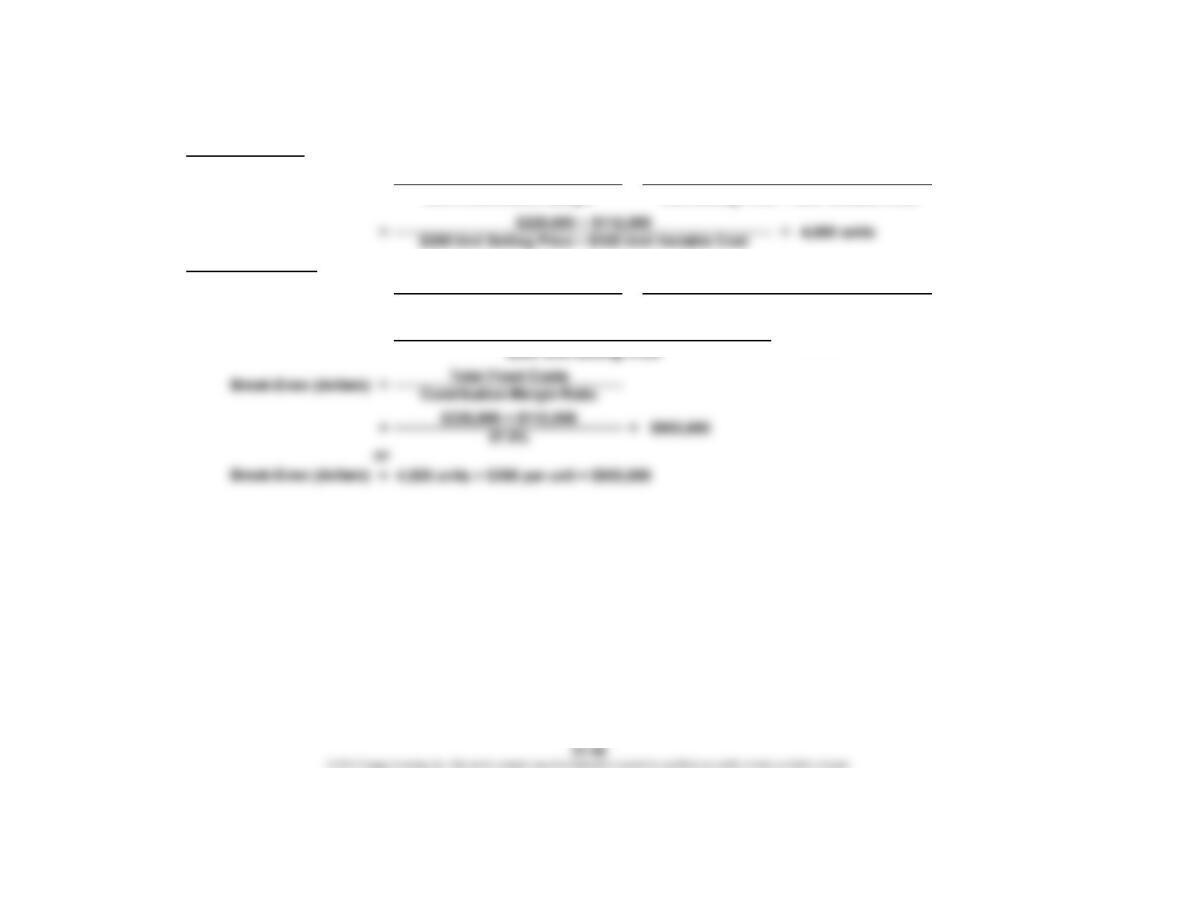
1. Break-Even Units:
$225,000
37.5%
Total Fixed Costs
Unit Contribution Margin Unit Selling Price – Unit Variable Cost
$225,000 = 3,000 units
Break-Even Sales (units) = Total Fixed Costs =
=
=
Break-Even (dollars)
= $600,000
=Total Fixed Costs
Contribution Margin Ratio
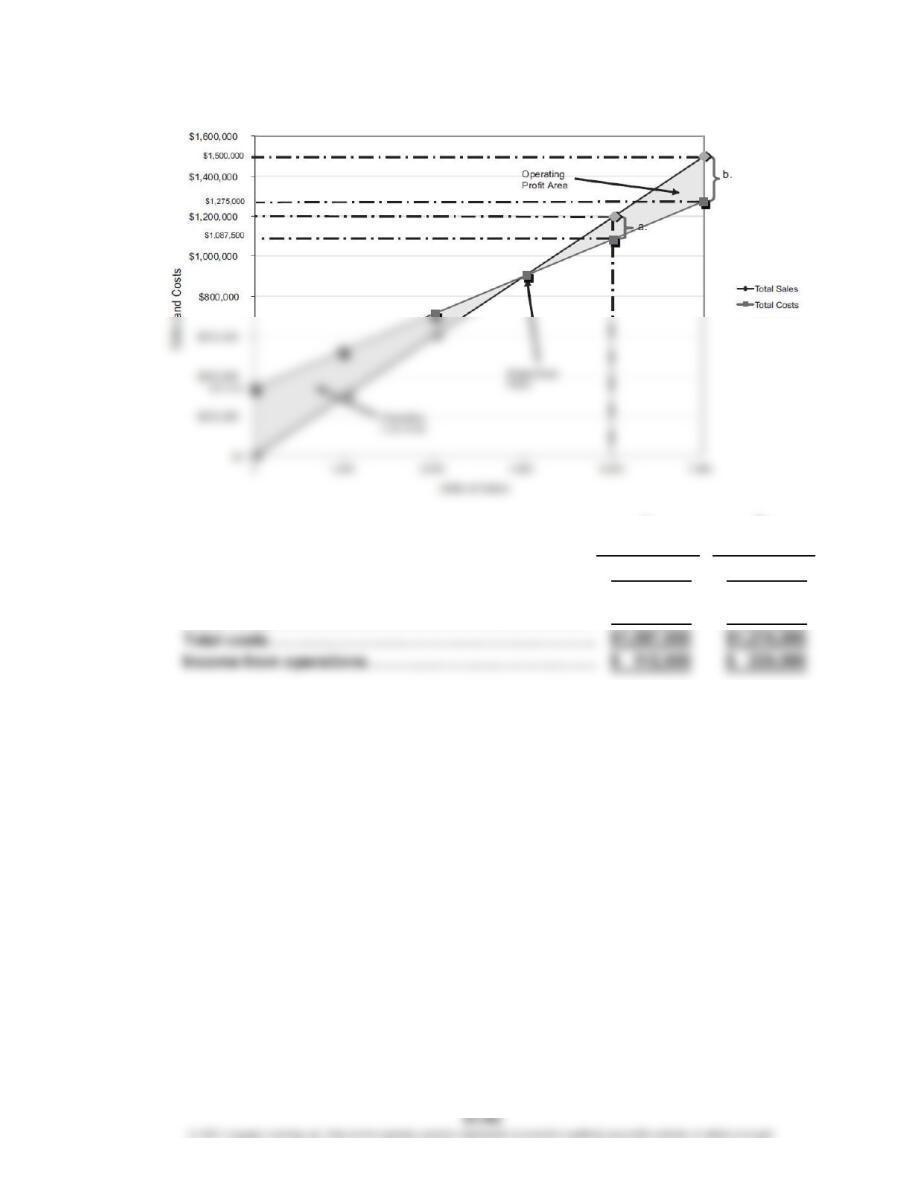
2.
a. b.
4,500 units 7,500 units
Sales…………………………………………………………
…
$900,000 $1,500,000
V
ariable costs………………………………………………
…
$562,500 $ 937,500
CHAPTER 21 Cost-Volume-Profit Analysis
Prob. 21-4B (Continued)
3.
CHAPTER 21 Cost-Volume-Profit Analysis
Prob. 21-4B (Continued)
3. Break-Even Units:
Break-Even Dollars:
Break-Even Sales (units) = Total Fixed Costs =Total Fixed Costs
Unit Contribution Margin Unit Selling Price – Unit Variable Cost
37.5%
Contribution Margin Ratio = Unit Contribution Margin =Unit Selling Price – Unit Variable Cost
Unit Selling Price Unit Selling Price
=$200 Unit Selling Price – $125 Unit Variable Cost =
CHAPTER 21 Cost-Volume-Profit Analysis
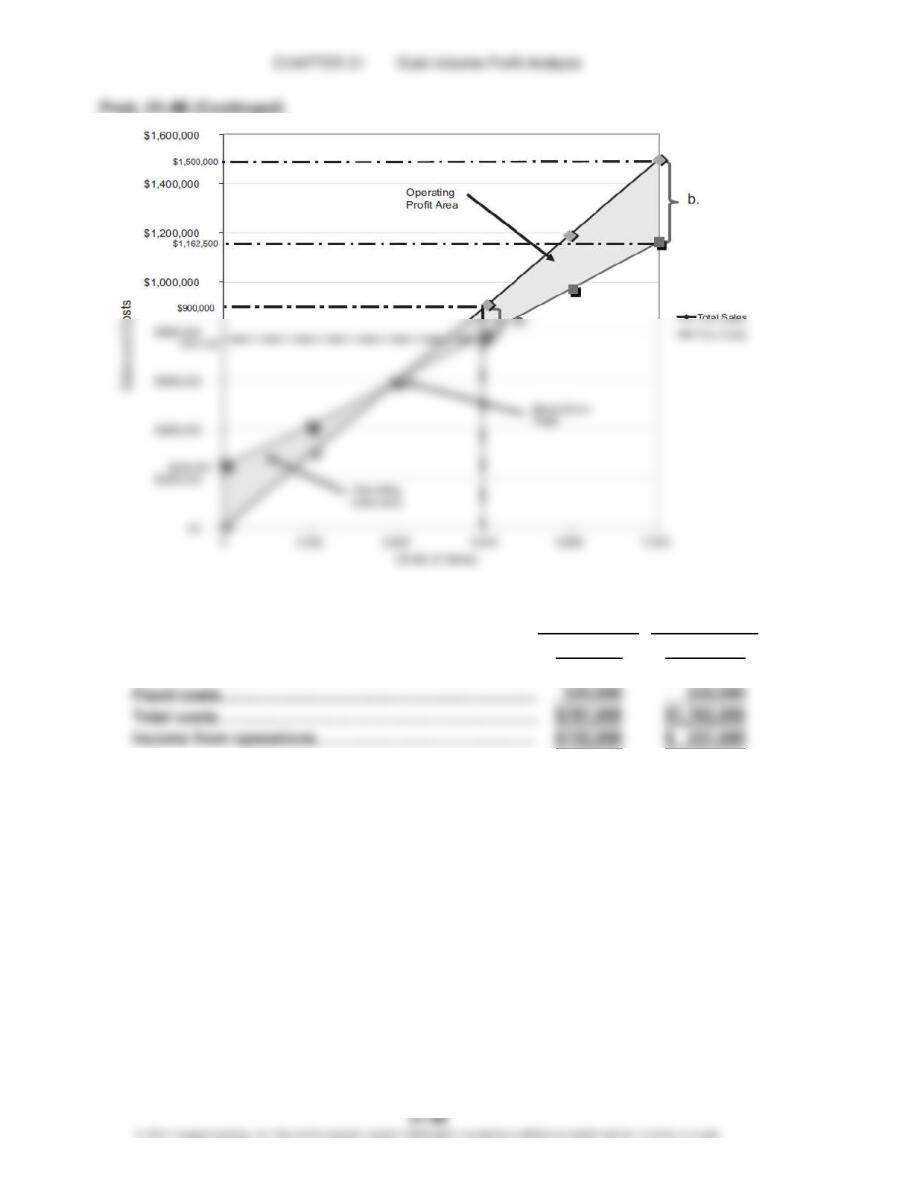
Prob. 21-4B (Concluded)
4.
a. b.
6,000 units 7,500 units
Sales…………………………………………………………… $1,200,000 $1,500,000
V
ariable costs………………………………………………
…
$ 750,000 $ 937,500
Fixed costs……………………………………………………
…
337,500 337,500
CHAPTER 21 Cost-Volume-Profit Analysis
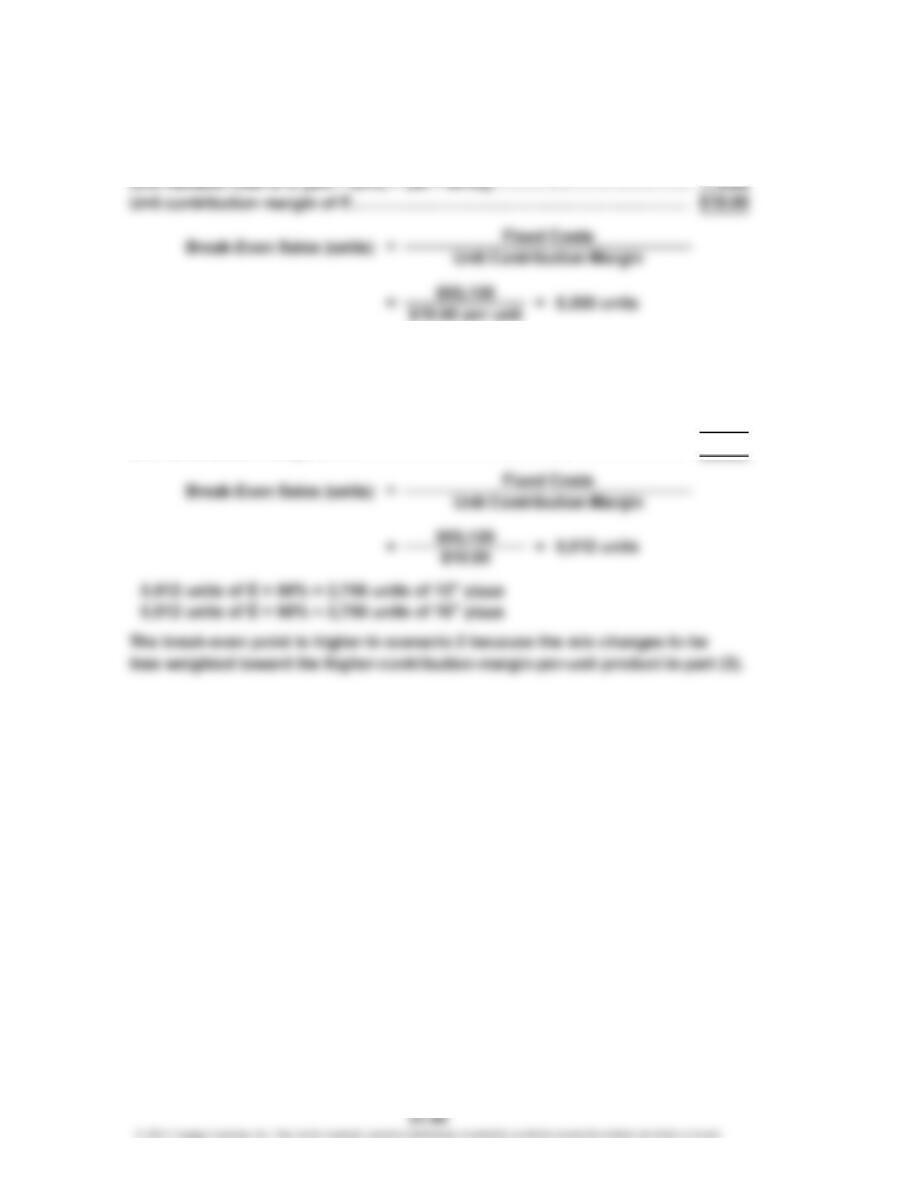
Prob. 21-5B
(Overall product is labeled E.)
1. Unit selling price of E [($13 × 20%) + ($16 × 80%)]……………………………
…
$15.40
2. 5,200 units of E × 20% = 1,040 units of 12″ pizza
5,200 units of E × 80% = 4,160 units of 16″ pizza
3. Unit selling price of E [($13 × 50%) + ($16 × 50%)]……………………………
…
$14.50
Unit variable cost of E [($4 × 50%) + ($5 × 50%)]………………………………
…
4.50
Unit contribution margin of E……………………………………………………… $10.00
…
CHAPTER 21 Cost-Volume-Profit Analysis
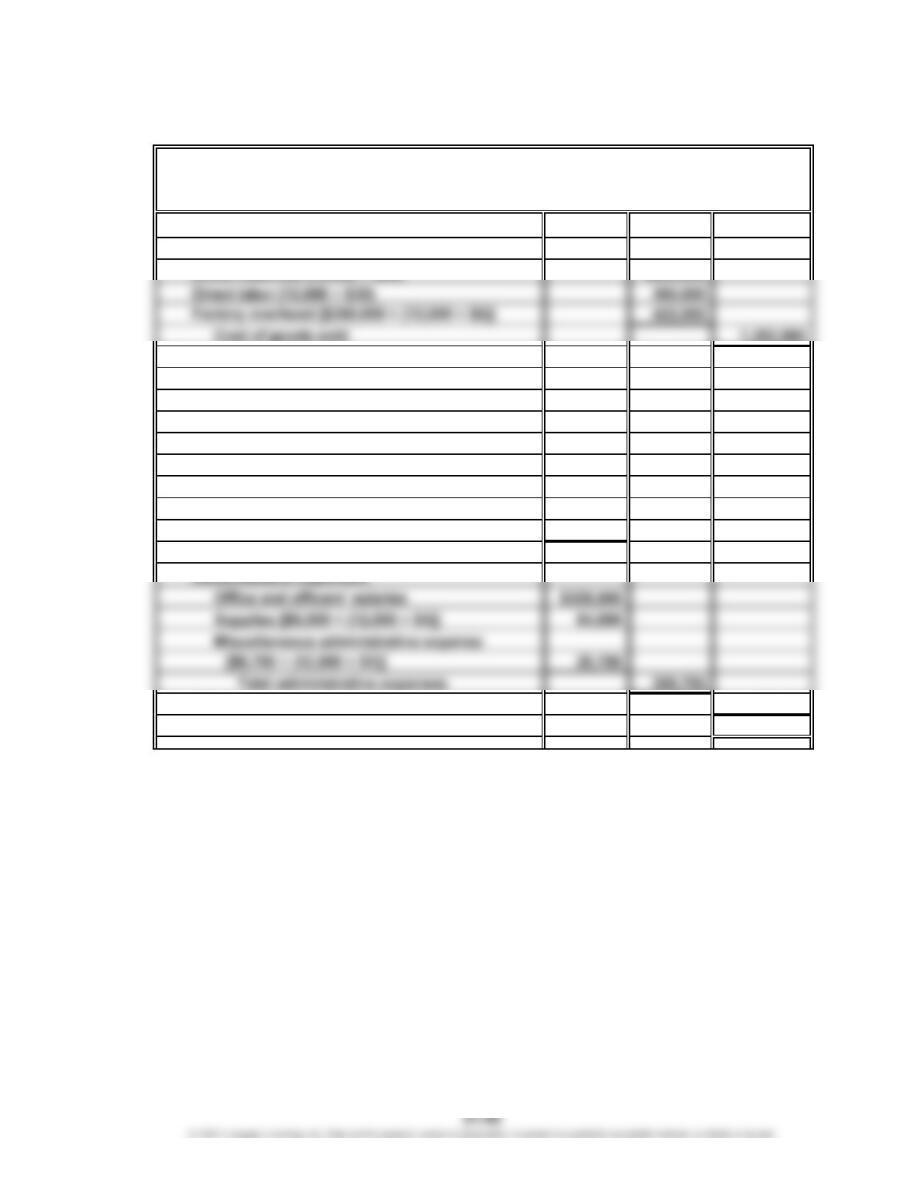
Prob. 21-6B
1.
Sales (12,000 × $240) $2,880,000
Cost of goods sold:
Gross profit $1,498,000
Expenses:
Selling expenses:
Sales salaries and commissions
[$340,000 + (12,000 × $4)] $388,000
Advertising 116,000
Travel 4,000
Miscellaneous selling expense
[$2,300 + (12,000 × $1)] 14,300
Total selling expenses $522,300
Total expenses 922,000
Income from operations $ 576,000
Belmain Co.
Estimated Income Statement
For the Year Ended December 31, 20Y7
CHAPTER 21 Cost-Volume-Profit Analysis
Prob. 21-6B (Continued)
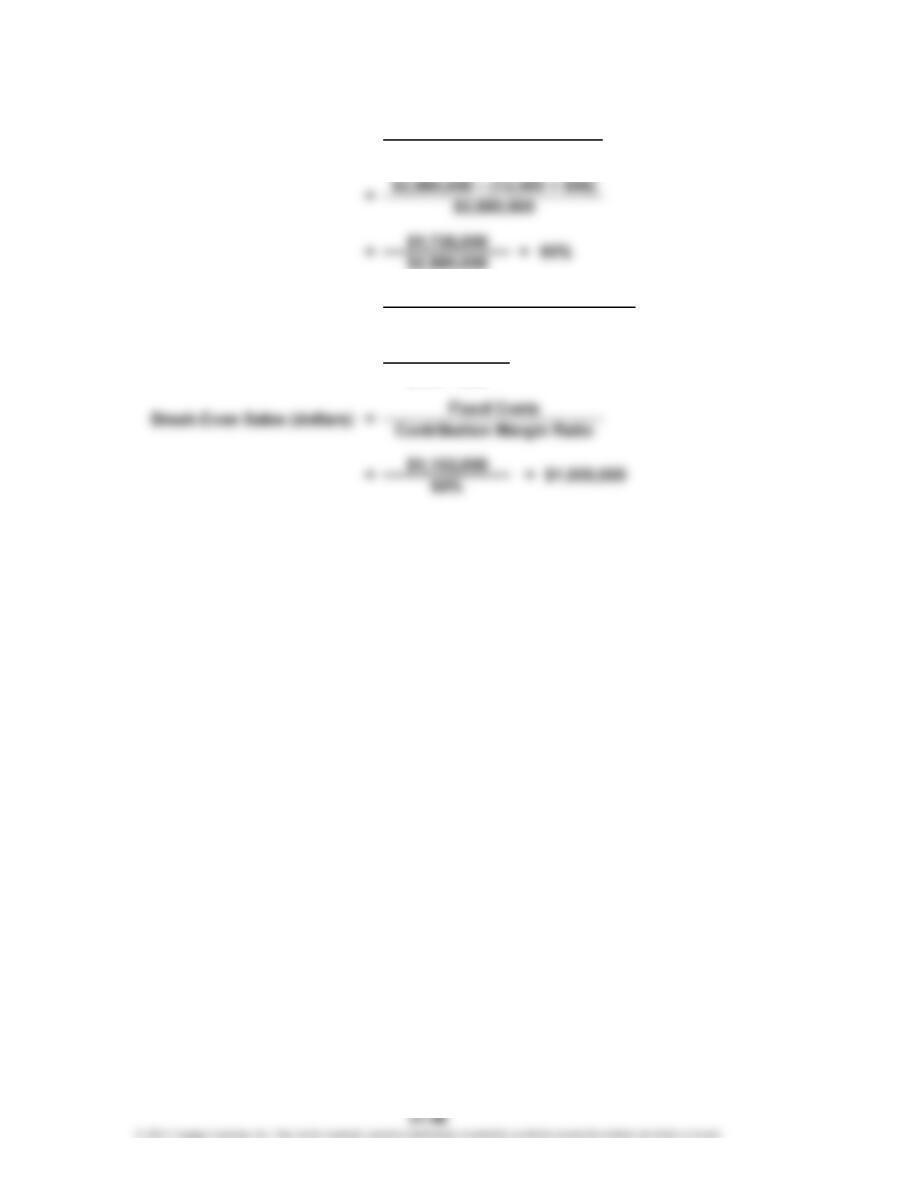
$1,152,000
$240 – $96
or
Break-Even Sales (dollars) = 8,000 units × $240 per unit = $1,920,000
==
8,000 units
2. Contribution Margin Ratio = Sales – Variable Costs
Sales
3. Break-Even Sales (units) = Fixed Costs
Unit Contribution Margin
CHAPTER 21 Cost-Volume-Profit Analysis
Prob. 21-6B (Concluded)
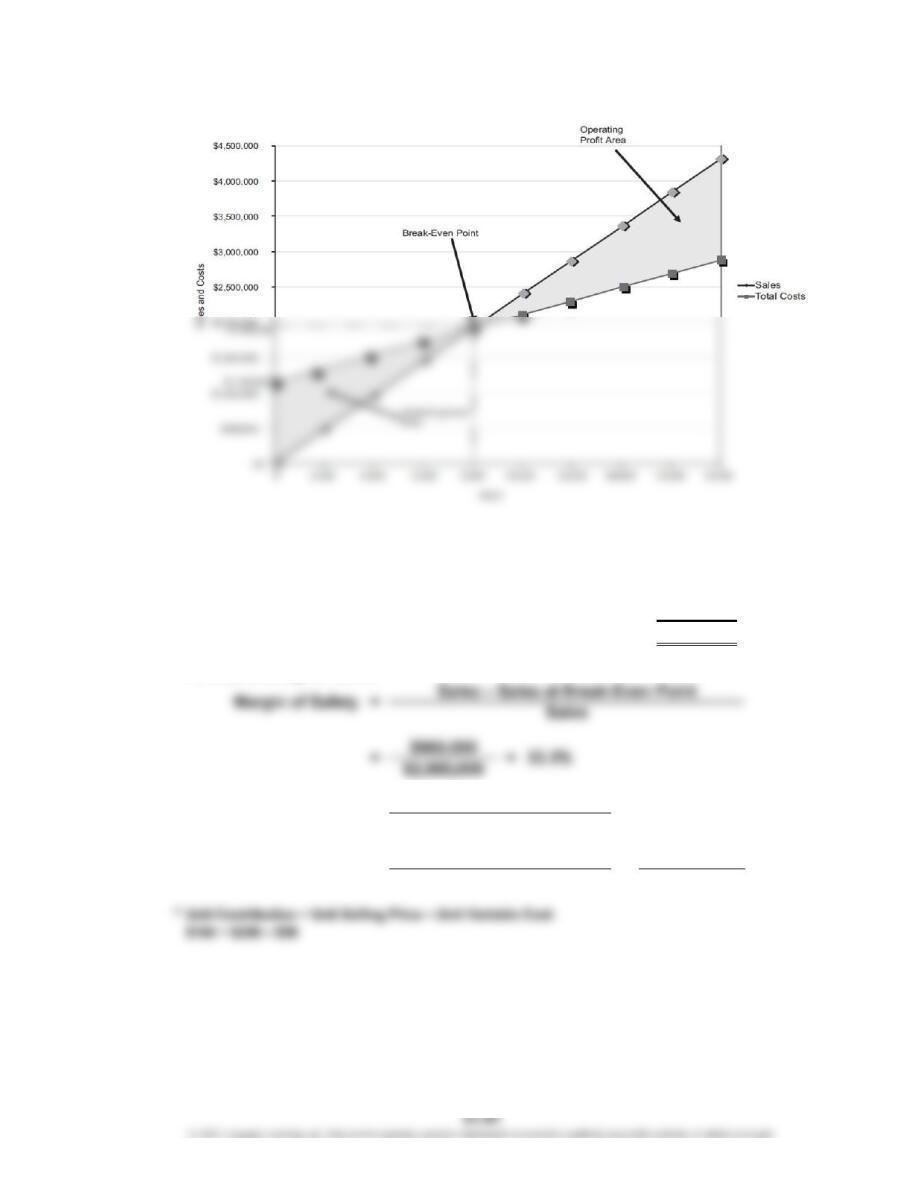
4.
5. Margin of safety:
In dollars:
Expected sales (12,000 units × $240)………………………
…
$2,880,000
Break-even point (8,000 units × $240)……………………… 1,920,000
Margin of safety………………………………………………… $ 960,000
As a percentage of sales:
$1,728,000
$576,000
Contribution Margin
Income from Operations
==3
$576,000
6.
=12,000 units × $144*
Operating Leverage =
CHAPTER 21 Cost-Volume-Profit Analysis
CP 21-1
In an absolute sense, Edward’s actions are devious. He is clearly attempting to
use the first four-year scenario, which is favorable, as a way to market the
partnerships. They are really longer-term investments. After the first four years,
the risk increases dramatically. The break-even occupancy becomes more
difficult to achieve at 95% than it does at 65%. Focusing on the 65% and remaining
silent about the increase to 95% is deceptive. One might argue “let the buyer
beware.” After all, the information is in the fine print. A little spadework would
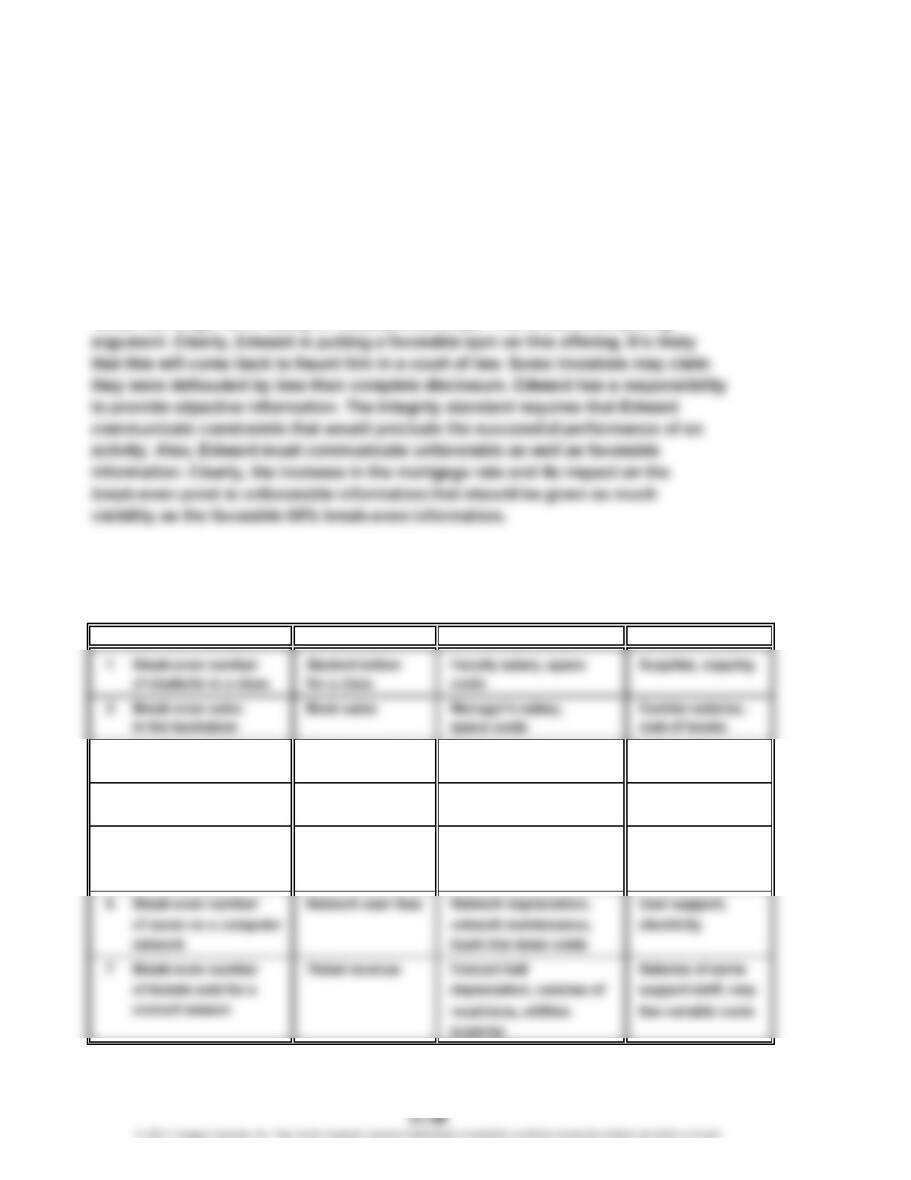
CP 21-2
There are many possible applications of break-even analysis in a school
environment. Below are just a few possible ideas.
Revenues Fixed Costs Variable Costs
3 Break-even daily Meal revenue Salaries, space Food costs
meal revenues
4 Break-even students Room revenue Space, staff salaries, Janitorial costs
in a dorm utilities
5 Break-even number Ticket and Space, staff Clean-up costs,
of tickets sold for a concession salaries, utilities concession costs
basketball game revenue
Break-Even Analysis
CASES & PROJECTS
CHAPTER 21 Cost-Volume-Profit Analysis
CP 21-3
To: Neil Armstrong, CEO Sun Airlines
From: Ima Student
Re: Increasing Ticket Prices
In recent months, Sun Airlines has struggled to stay above break-even sales
volume, which has led to a string of monthly losses. Sun’s break-even volume is
75% of capacity, which is significantly higher than the industry average of 65% of
capacity.
and losses will increase.
For this strategy to succeed, the airline will have to minimize the impact of the
ticket price increase on sales volume. The airline might consider targeting
business travelers who need to fly regardless of ticket price. If successful, this
strategy can reduce the break-even point without significantly decreasing ticket
sales. Restrictions such as allowing reduced fares only on round-trip tickets that
include a Saturday night stay-over achieve this objective, because business
CHAPTER 21 Cost-Volume-Profit Analysis
CP 21-4
Do-Nothing Strategy:
Revenue – Variable Costs – Fixed Costs = Profit
($80 × 1,000,000) – ($35 × 1,000,000) – $35,000,000 = Profit
$80,000,000 – $35,000,000 – $35,000,000 =
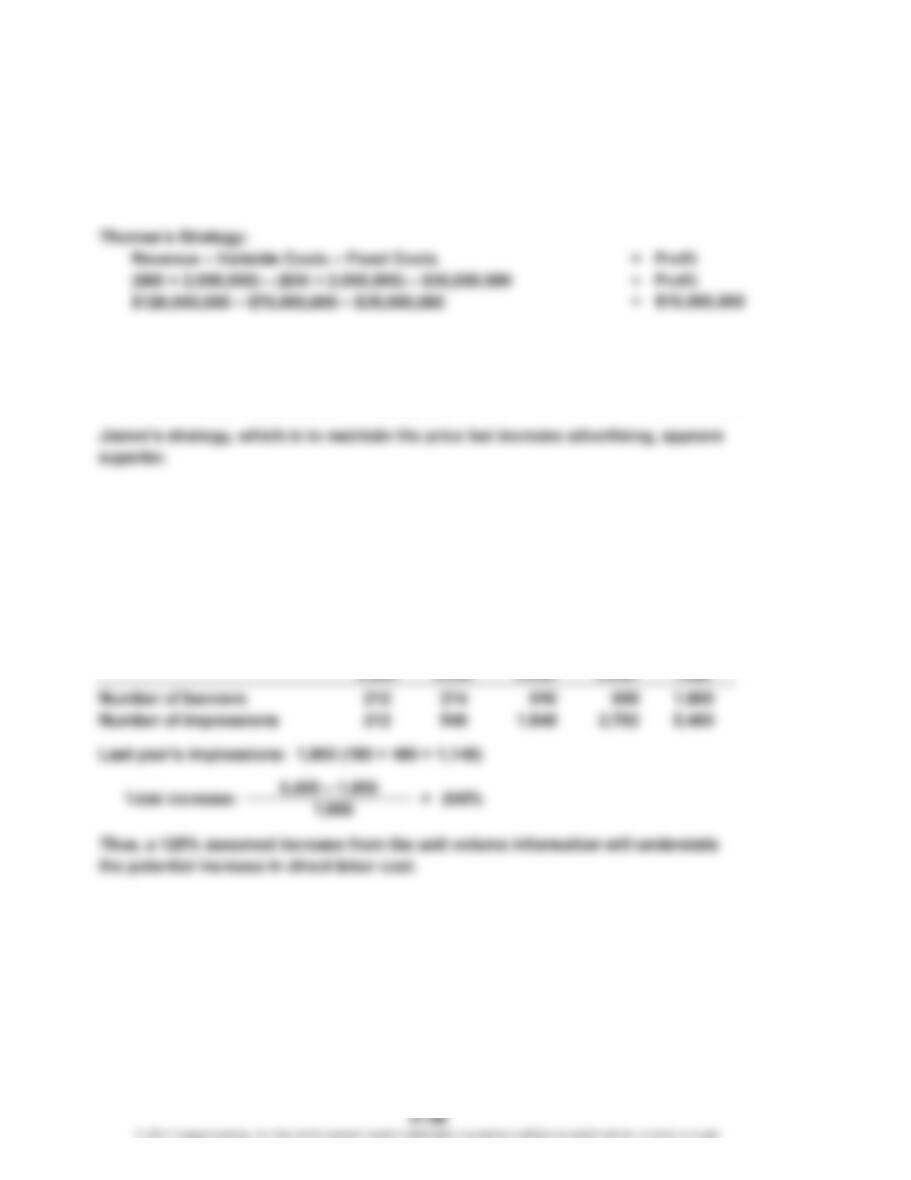
James’s Strategy:
Revenue – Variable Costs – Fixed Costs = Profit
($80 × 1,400,000) – ($35 × 1,400,000) – $45,000,000 = Profit
$112,000,000 – $49,000,000 – $45,000,000 =
CP 21-5
The direct labor costs are not variable to the increase in unit volume. The unit
volume is the wrong activity base for direct labor costs. The “number of
impressions” is a more accurate reflection of the direct labor cost. An impression
is a separate printing color application on the banners. Thus, the analysis should
be done as follows:
One Three
$10,000,000
$18,000,000
Four
Two
CHAPTER 21 Cost-Volume-Profit Analysis
CP 21-6
The Shipping Department manager should respond by pointing out that the
activities performed by his department are not related to sales volume but to
sales orders. The orders require inventory pulling and sorting activities as well