Financial and Managerial Accounting, 8th Edition
21-1
CHAPTER 21
FLEXIBLE BUDGETS AND STANDARD COSTS
Related Assignment Materials
Student Learning Objectives
Discussion
Questions
Quick
Studies*
Exercises*
Problems*
AA and
BTN
Conceptual objectives:
C1. Define standard costs and
explain how standard cost
information is useful for
management by exception.
8, 13, 16, 17
21-5, 21-23
21-1
21-6
AA 21-1, BTN 21-1,
BTN 21-3, BTN 21-4,
BTN 21-5, BTN 21-6
Analytical objectives:
A1. Analyze changes in sales from
expected amounts.
21-20, 21–21
21-23
21-1, 21-2
AA 21-2, BTN 21-7
Procedural objectives:
P1. Prepare a flexible budget and
interpret a flexible budget
performance report.
1, 2, 3, 4, 5,
14
21-1, 21-2,
21-3, 21-4,
21-22
21-2, 21-3,
21-4, 21-5,
21-6
21-1, 21-2,
21-3, SP
P2. Compute the total cost
variance.
11,15
21-5, 21-6
21-7, 21-8
21-2, 21-3
9, 10, 12, 13,
21-3, 21-4
price and quantity variances.
*See additional information on next page that pertains to these quick studies, exercises, and problems.
SP refers to the Serial Problem
AA refers to Accounting Analysis
BTN refers to Beyond the Numbers
GL refers to General Ledger Problems
Questions with Guided Example videos
1:53
1:11
2:36
1:26
0:44
Flow of Events in Variance Analysis
0:23
Cost Variance Computation
1:17
Additional Information on Related Assignment Material
See Chapter 1 of the Instructor’s Resource Manual for more information on materials for this text available in
Connect.
Connect
Available on the instructor’s course-specific website, Connect:
• All numerical Quick Studies, all Exercises and Problems Set A.
o Connect also provides algorithmic versions for Quick Study, Exercises, and Problems.
Hints/Guided Examples
Please note that the Guided Examples are labeled as “Hints” in Connect assignments. The animated PowerPoints without
the video and audio functions for the Guided Examples are also available in the Connect Instructor Library and Exercise
Presentations. These are indicated in the Related Assignment Materials grid on page 1 in blue bold font.
Need-to-Know Videos
LO
Need–to-Know
Title
Time
P1
21-1
Flexible Budget
2:27
P2
21-2
Cost Variances
1:10
P3
21-3
Direct Materials Price and Quantity Variances
2:48
P3
21-4
Direct Labor Rate and Efficiency Variances
2:45
P4
21-5
Overhead Variances
2:46
P6
21-7
Recording Variances
0:47
Concept Overview Videos
LO
Title
Time
C1
Define standard costs and explain how standard cost information is useful for
management by exception.
Standard Costs
1:00
Setting Standard Costs
1:28
Management by Exception
0:47
A1
Analyze changes in sales from expected amounts.
Sales Variances
2:28
21-3
Materials and Labor Variances
1:02
Compute materials and labor variances.
Materials Variances
2:40
Evaluating Materials Variances
0:52
Labor Variances
2:19
Evaluating Labor Variances
1:08
Materials and Labor Variances Model
1:25
P4
Compute overhead controllable and volume variances.
Flexible Overhead Budgets & Overhead Standards
3:54
Computing Overhead Cost Variances
2:17
Overhead Controllable and Volume Variances
2:41
Overhead Variance Report
0:43
P5
Compute overhead spending and efficiency variances. (Appendix 21A)
Expanded Overhead Variances
3:07
Expanded Variable Overhead Variances
2:02
Expanded Fixed Overhead Variance
1:44
Direct Material Journal Entries
1:12
Direct Material Journal Entries – Illustration
0:41
Direct Labor Journal Entries
1:11
Direct Labor Journal Entries – Illustration
0:35
Factory Overhead Journal Entries
1:46
Factory Overhead Journal Entries — Illustration
1:32
Synopsis of Chapter Revision
NEW opener—Away and entrepreneurial assignment.
Added graph to flexible budget exhibit.
Revised discussion of flexible budget.
New exhibit and discussion of computing total cost variance.
Edited discussion of direct materials cost variance.
Chapter Outline
I. Budgetary Process
1. Budgetary Control and Reporting
a. Budgetary control⎯managers use budgets to control operations and see that planned
objectives are met.
5. Fixed budgeting: a fixed budget (also called a static budget) is based on a single product amount
of sales or other activity measure.
6. Flexible budgeting: a flexible budget (also called a variable budget) is based on several different
amounts of sales or activity levels.
7. A flexible budget is more useful when actual results are different from predicted.
8. Fixed Budget Performance Report
a. A fixed budget performance report compares actual results with results expected under the
fixed budget (that predicted a certain sales volume or other activity level). (Exhibit 21.2)
b. Differences between budgeted and actual results are designated as variances.
9. Favorable variance (F)⎯actual revenue is greater than budgeted revenue, or actual cost is lower
than budgeted cost.
10. Unfavorable variance (U)⎯Actual revenue is lower than budgeted revenue, or actual cost is
greater than budgeted cost.
II. Flexible Budget Reports –Superior alternative to fixed budget reports.
A. Purpose of Flexible Budgets
1. Flexible budget (also called variable budget) is based on predicted amounts of revenues and
expenses corresponding to actual level of output.
4. Flexible budgets prepared after the period help managers evaluate past performance.
5. Especially useful because it reflects the different levels of activities in different amounts of
revenues and costs.
a. Comparisons of actual results with budgeted performance are more likely to reveal the causes
of any differences.
b. Helps managers to focus attention on problem areas and to implement corrective actions.
21-5
B. Preparation of Flexible Budgets
1. To prepare a flexible budget, follow these steps:
a. Identify the activity level, units produced or sold.
2. Must classify costs as variable and fixed within a relevant range.
a. Variable cost per unit of activity remains constant; total amount of variable cost changes in
direct proportion to a change in level of activity.
b. Total amount of fixed cost remains unchanged regardless of changes in level of activity
within relevant (normal) operating range.
4. Layout follows a contribution margin format (Exhibit 21.3)
a. Sales are followed by variable costs (per unit), and then by fixed costs⎯difference between
sales and variable costs equals contribution margin.
b. First column shows flexible budget amounts of variable costs per unit, and second column
shows fixed costs for any volume of sales in relevant range.
c. Third, fourth, and fifth columns show flexible budget amounts computed for specified sales
volumes (three different sales volumes used in this example).
d. Total Budgeted Costs = Total Fixed Cost + (Total Variable Cost Per Unit x Units of
Activity).
C. Flexible Budget Performance Report
1. Compares actual performance and budgeted performance based on actual sales volume (or other
level of activity).
2. Helps direct management’s attention to those costs or revenues that differ substantially from
budgeted amounts; areas where corrective actions may help management control operations.
3. Used for variance analysis.
III. Standard Costing⎯Actual costs are amounts paid in past transactions; a measure of comparison is
usually needed to decide whether actual cost amounts are reasonable or excessive, and standard costs
offer one basis for comparison.
A. Standard costs are preset costs for delivering a product or service expected under normal conditions.
1. Used by management to assess the reasonableness of actual costs incurred for producing the
product or service.
2. When actual costs vary from standard costs, management follows up to identify potential
IV. Setting Standard Costs
A. Identifying Standard Costs
1. Managerial accountants, engineers, personnel administrators, purchasing managers, and
production managers work together to set standard costs.
a. To set direct labor costs – conduct time and motion studies for each labor operation in the
process of providing product or service; sets standard labor time required for each operation
under normal conditions.
b. To set direct material costs – study quantity, grade, and cost of each material used.
3. Due to inefficiencies and waste, materials may be lost as part of process.
a. An ideal standard is the quantity of material required if process was 100% efficient without
any loss or waste.
b. A practical standard is the quantity of material required under normal application of process.
The standard direct labor rate should include allowances for employee breaks, cleanup, and
machine downtime.
c. Most companies use practical standards.
4. A standard cost card shows the standard costs of direct materials, direct labor, and overhead for
one unit of product or service.
3. Results of efforts should allow assignment of responsibility for the variance; actions can then be
taken to correct problems.
4. Four steps involved in proper management of variance analysis.
B. Cost Variance Computation⎯Cost variance (CV) equals difference between actual cost (AC) and
standard cost (SC).
1. Actual quantity (AQ ) Standard quantity (SQ)
x Actual price (AP) x Standard price (SP)
Actual Cost (AC) Standard Cost (SC)
2. Actual quantity is actual amount of material or labor used in manufacturing the actual quantity of
output during the period, and Standard Quantity is the input expected for the quantity of output.
3. Actual Price is amount paid for acquiring the input (material or labor), and Standard Price is the
expected price.
4. Two main factors cause a cost variance
a. Price variance caused by difference between actual price paid and standard price.
b. Quantity (or usage or efficiency) variance caused by difference between the actual quantities
of materials or hours used and the standard quantity.
6. Alternative price variance and quantity variance formulas can also be used.
a. Price variance = (Actual price – Standard price) x Actual quantity.
PV = (AP – SP) x AQ.
b. Quantity variance = (Actual quantity – Standard quantity) x Standard price.
QV = (AQ – SQ) x SP.
C. Computing Materials and Labor Variances
1. Material cost variances may be due to price and/or quantity factors.
21-8
2. Labor cost variances may be due to rate (price) and/or efficiency (quantity) factors.
a. Labor rate (price) variance results when wage rate paid to employees differs from standard
rate; personnel administrator or production manager need to explain why the actual rate is
higher or lower than standard
VI. Overhead Standards and Variances⎯A predetermined overhead rate is used to assign standard
overhead costs to products or services produced; predetermined rate is often based on relation between
standard overhead and standard labor cost, standard labor hours, standard machine hours, or another
measure of production.
A. Standard Overhead Rate
3. Standard overhead costs are average per unit costs based on predicted level of activity.
4. To allocate overhead costs to products or services, management establishes standard overhead
cost rate using a 3-step process:
a. Step 1: determine an allocation base: a measure of input management believes is related to
overhead costs, such as direct labor hours or machine hours.
b. Step 2: choose a predicted activity level.
i. Level of 100% of capacity rarely used.
VII. Computing Overhead Cost Variances
1. Cost accounting system applies overhead using predetermined overhead rate when standard costs
are used as described in Step 3.
3. To help identify factors causing the total overhead cost variance managers will analyze the
variance separately for volume and controllable variances.
a. The controllable variance is the difference between the actual total overhead costs incurred
and the budgeted total overhead costs based on a flexible budget; named because it refers to
activities usually under management control.
4. Analyzing overhead controllable and volume variances
a. An unfavorable volume means the company did not reach its expected operating level – a
favorable variance means the company operated at a greater than expected operating level
b. Main purpose of the volume variance to identify what portion of the total overhead variance
is cause by failing to meet the expected production level.
c. Often the reasons the failing to meet expected operating levels are due to factors (e.g.
customer demand) beyond employees’ control.
b. Shows specific overhead costs and how they differ from budgeted amounts
VIII. Decision Analysis⎯Sales Variances⎯Similar to computation and analysis of cost variances.
A. Sales price variance and sales volume variance can be computed. Managers use sales variances for
planning and control purposes.
1. Sales price variance measures the impact of the actual sales price differing from the expected
price.
2. Sales volume variance measures the impact of operating at a different capacity level than
predicted by the fixed budget.
B. When multiple products sold:
IX. Expanded Overhead Variances
A. Computing Overhead Cost Variances⎯assume predetermined rate is based on relation between
standard overhead and standard labor hours.
1. Framework uses classifications of overhead costs as either variable or fixed
2. Exhibit 21A.1 shows that the variable overhead spending and efficiency variances and the fixed
overhead spending variance are combined to get the controllable variance.
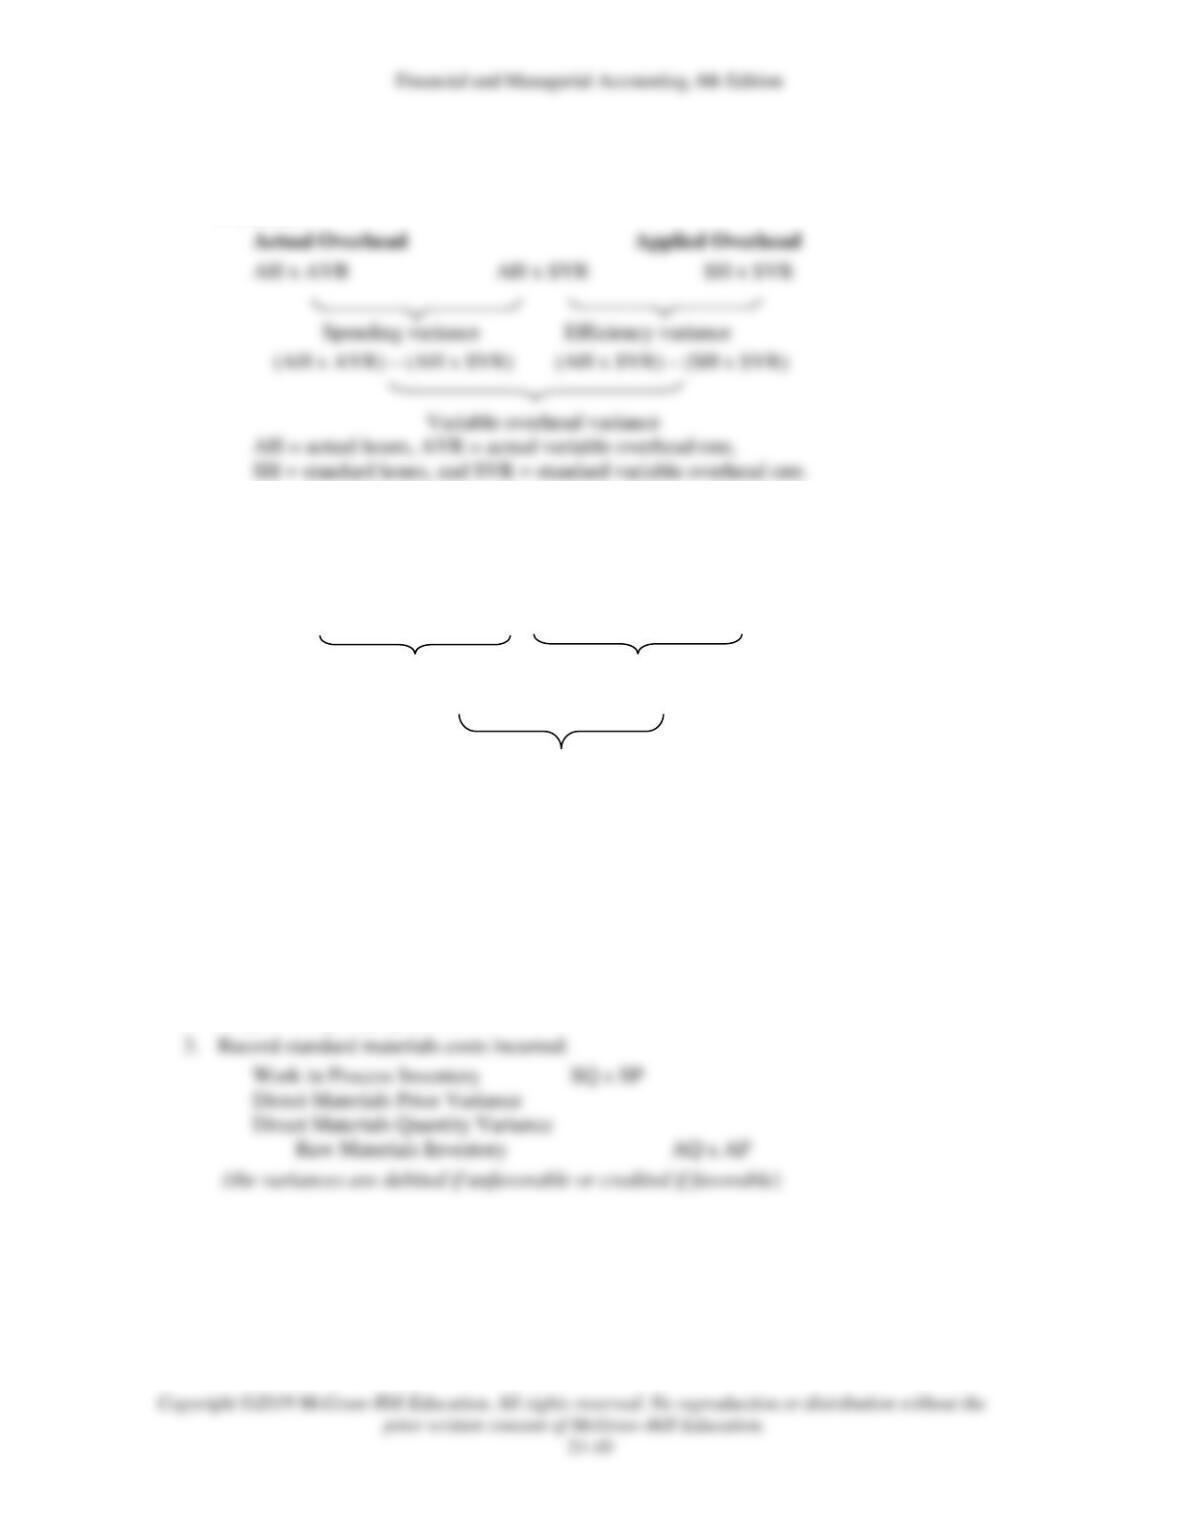
B. Variable overhead cost variances can be determined by formulas.
Formulas:
C. Fixed overhead cost variances can be determined by formulas that include only the fixed portion of
overhead.
Formulas:
Actual Overhead Budgeted Overhead Applied Overhead
(given) (from budget) SH x SFR
Spending variance Volume variance
(actual – budgeted) (budgeted – applied
Fixed overhead variance
SH = standard hours, and SFR = standard fixed overhead rate
1. Fixed overhead volume variance results when actual volume of production differs from standard
68157323volume of production.
2. Budgeted fixed overhead amount remains same regardless of expected volume, and is computed
based on standard direct labor hours allowed for the expected production volume.
X. Standard Cost Accounting Systems
Standard cost systems also record standard costs and variances in most accounts.
1. Simplifies recordkeeping
2. Helpful in report preparation.
4. Record standard labor cost of goods manufactured:
Work in Process Inventory SQ x SP
Direct Labor Rate Variance
Direct Labor Efficiency Variance
Factory Payroll AQ x AP
21-11
(the variances are debited if unfavorable or credited if favorable)
5. Assign standard predetermined overhead to Work in Process:
Variable Overhead Efficiency Variance
Fixed Spending Variance
Factory Overhead actual
(the variances are debited if unfavorable or credited if favorable)
6. An alternative is to combine the spending and efficiency variances into one account called
“Controllable Variances”.
8. Can use a standard costing income statement to summarize a company’s performance. The
Income Statement reports sales and cost of goods sold at stand amounts and then lists the
individual sales and cost variances (favorable are subtracted and unfavorable are added) to
compute gross profit at actual cost.
21-12
Chapter 21 Alternate Demo Problem #1
Problem #1
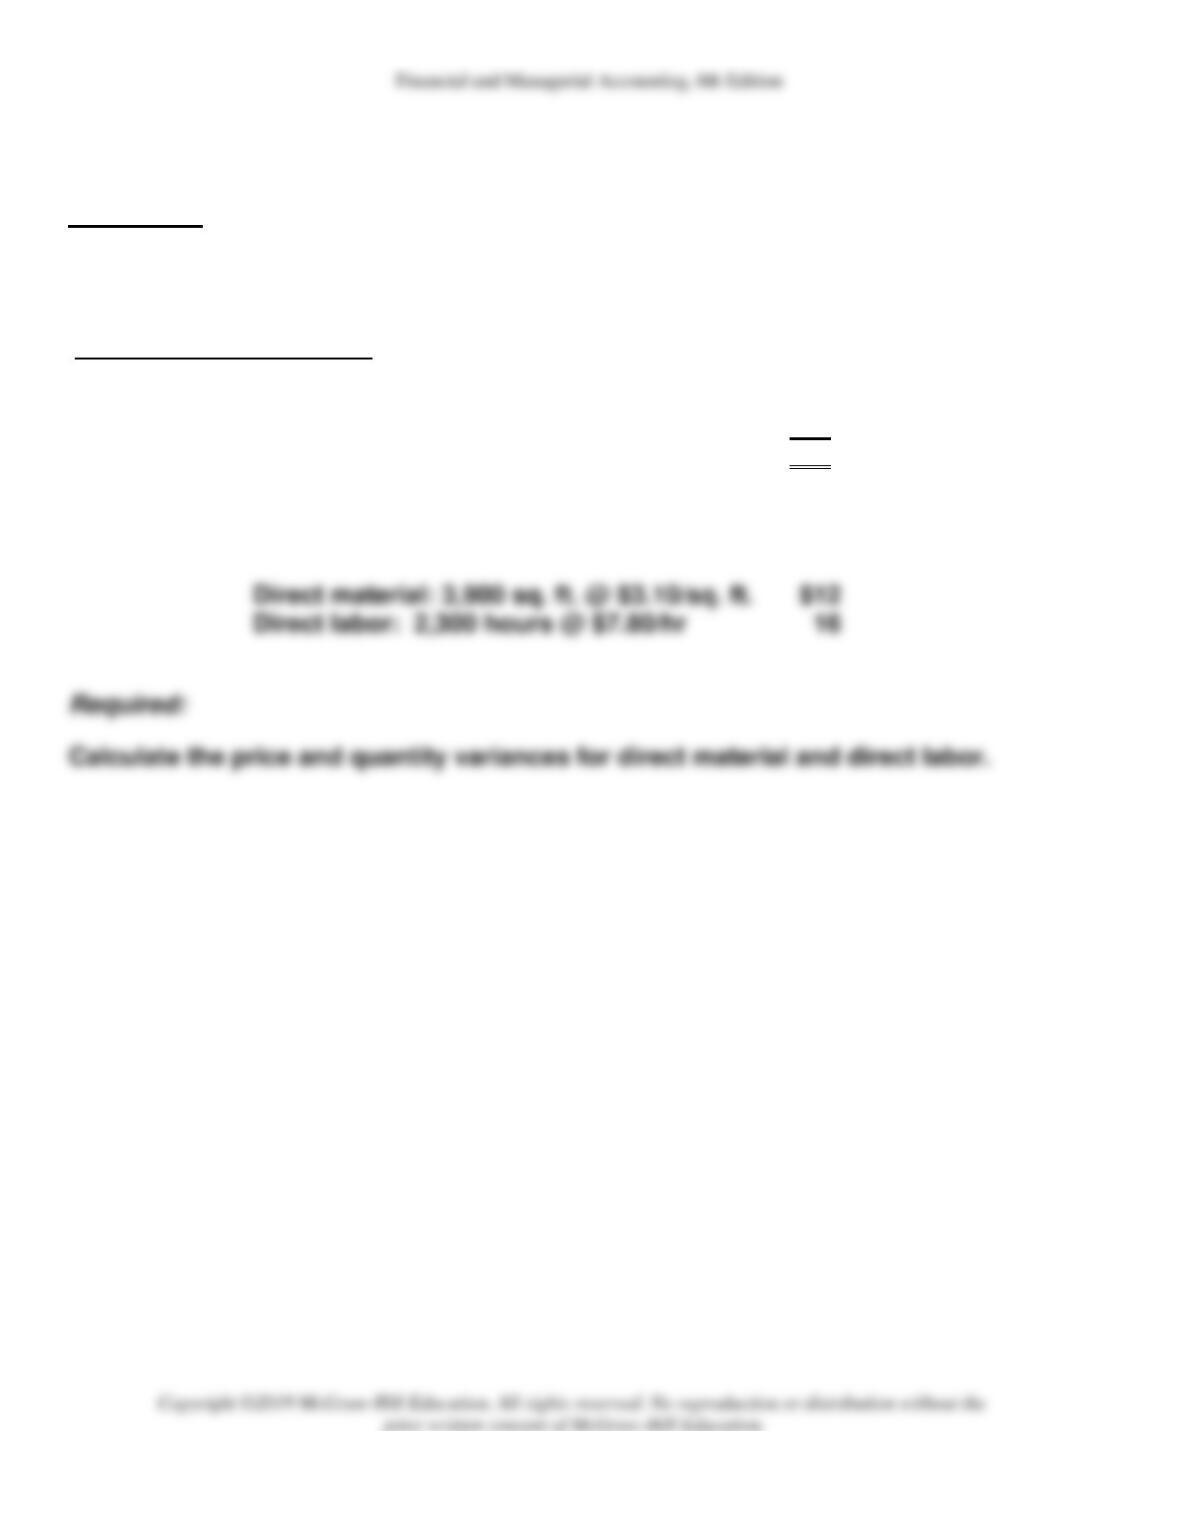
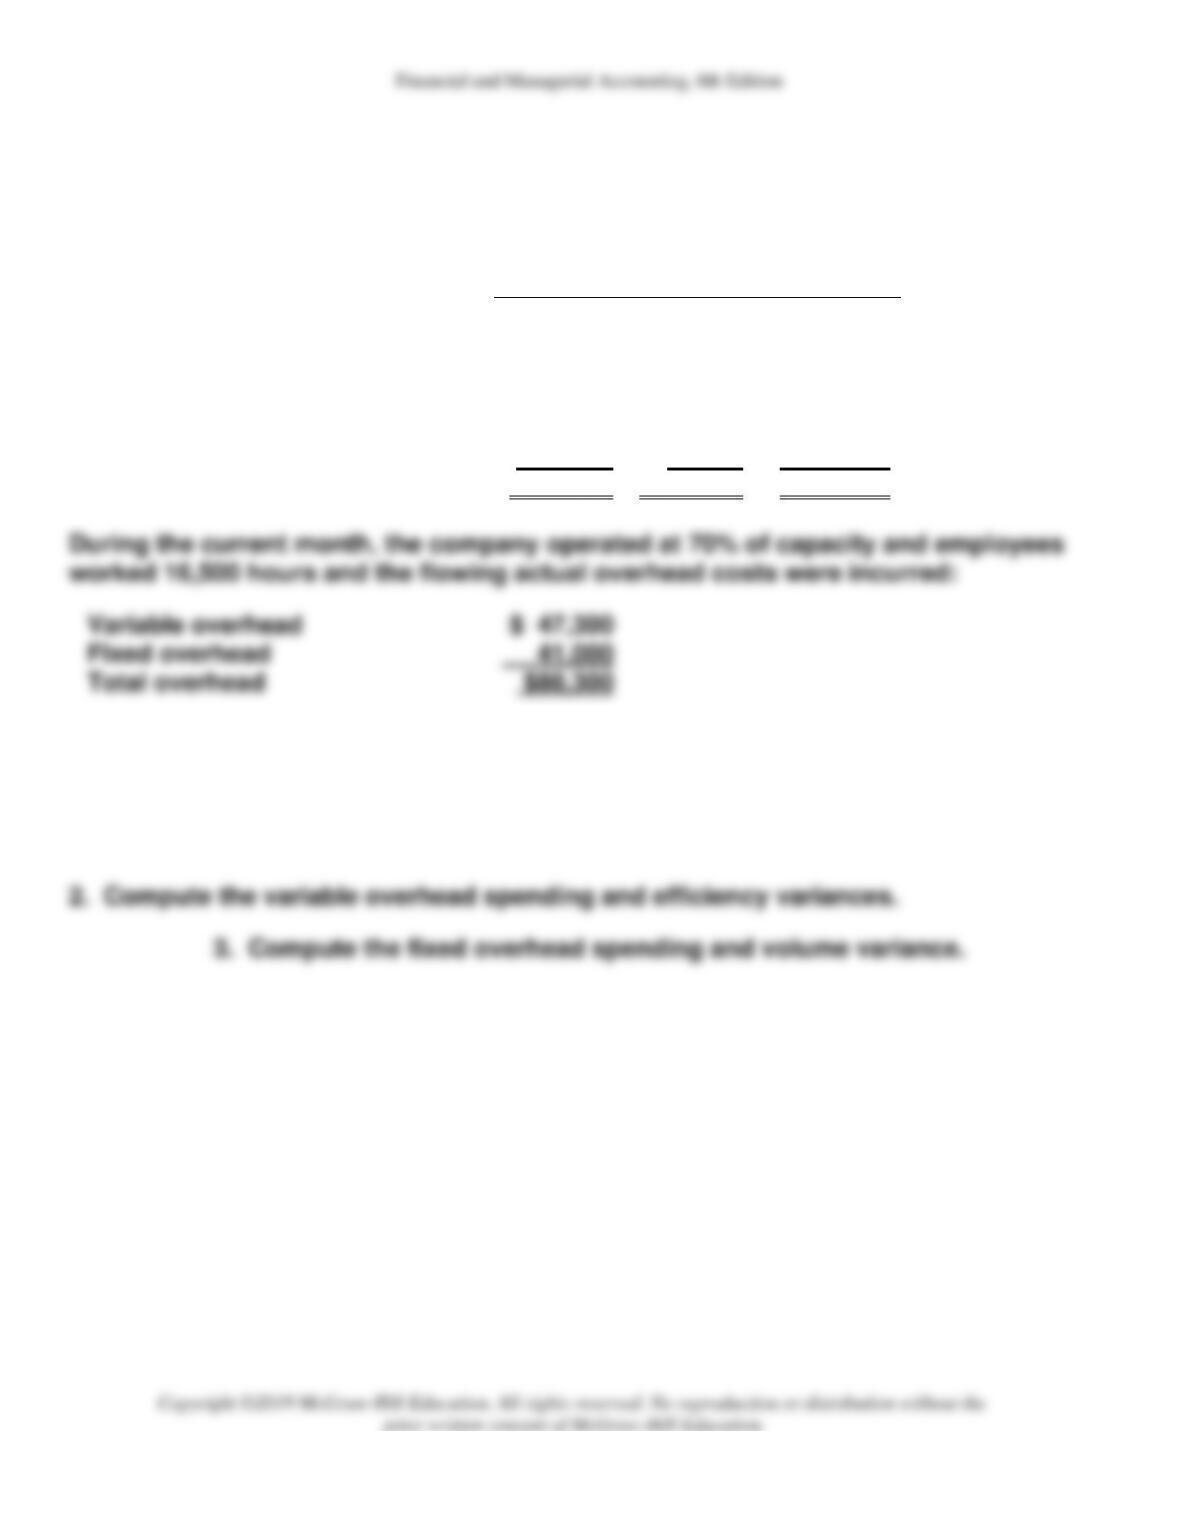
XYZ Company manufactures tables. A standard cost card for the manufacture of one
table shows the following:
Standard Cost per Table:
Direct material: 4 sq. ft. @ $3/sq. ft.
$12
Direct labor: 2 hours @ $8/hr
16
Total prime costs
$28
In November, the company produced 1,000 tables. Actual production costs and
quantities were:
Direct material: 3,900 sq. ft. @ $3.10/sq. ft.
$12
Direct labor: 2,300 hours @ $7.80/hr
16
21-13
Chapter 21 Alternate Demo Problem #2
Atlantic Company has the following monthly flexible budget information based on an
expectation of operating at 80% of the factory’s capacity or 10,000 units produced:
Operating Levels
70%
80%
90%
Budgeted output in units
8,000
10,000
12,000
Budgeted labor (standard hours)
16,000
20,000
24,000
Budgeted overhead
Variable overhead
$ 48,000
$60,000
$ 72,000
Fixed overhead
40,000
40,000
40,000
Total overhead
$ 88,000
$100,000
$112,000
Variable overhead
Fixed overhead
Total overhead
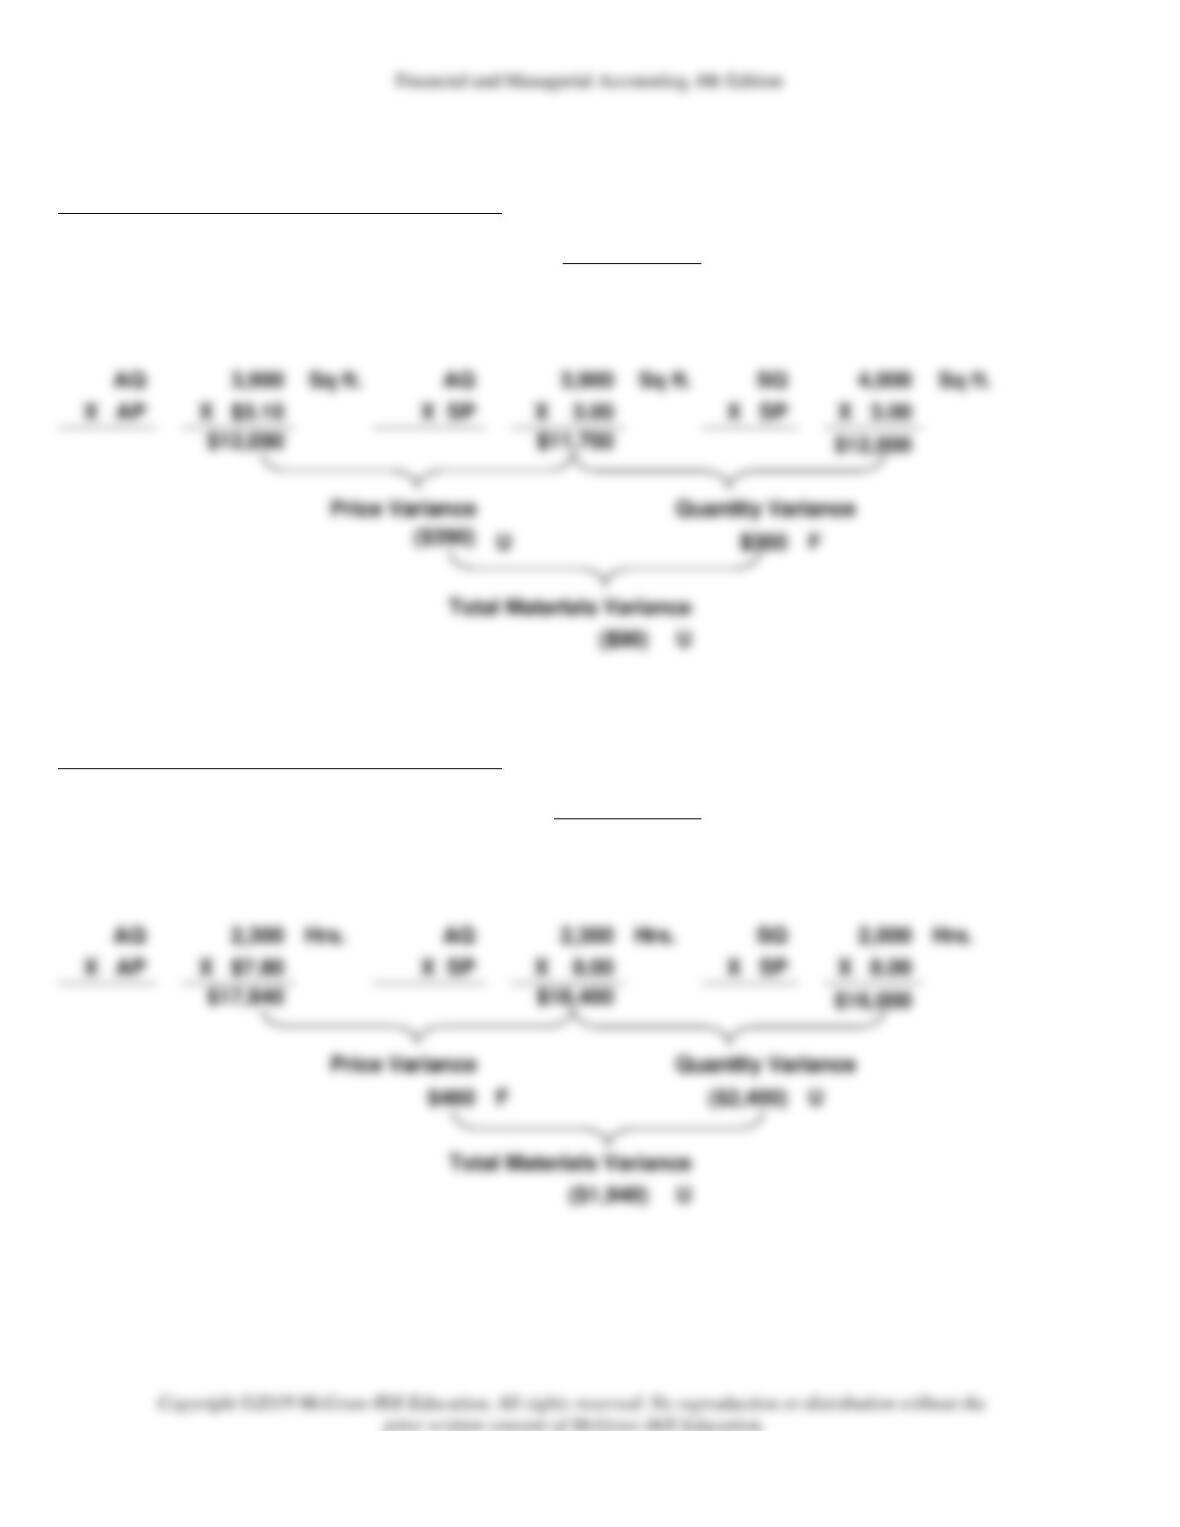
Required:
1. Compute the predetermined overhead rate per direct labor hour for variable
overhead, fixed overhead, and total overhead.
21-14
Chapter 21 Alternate Demo Problem #1: Solution
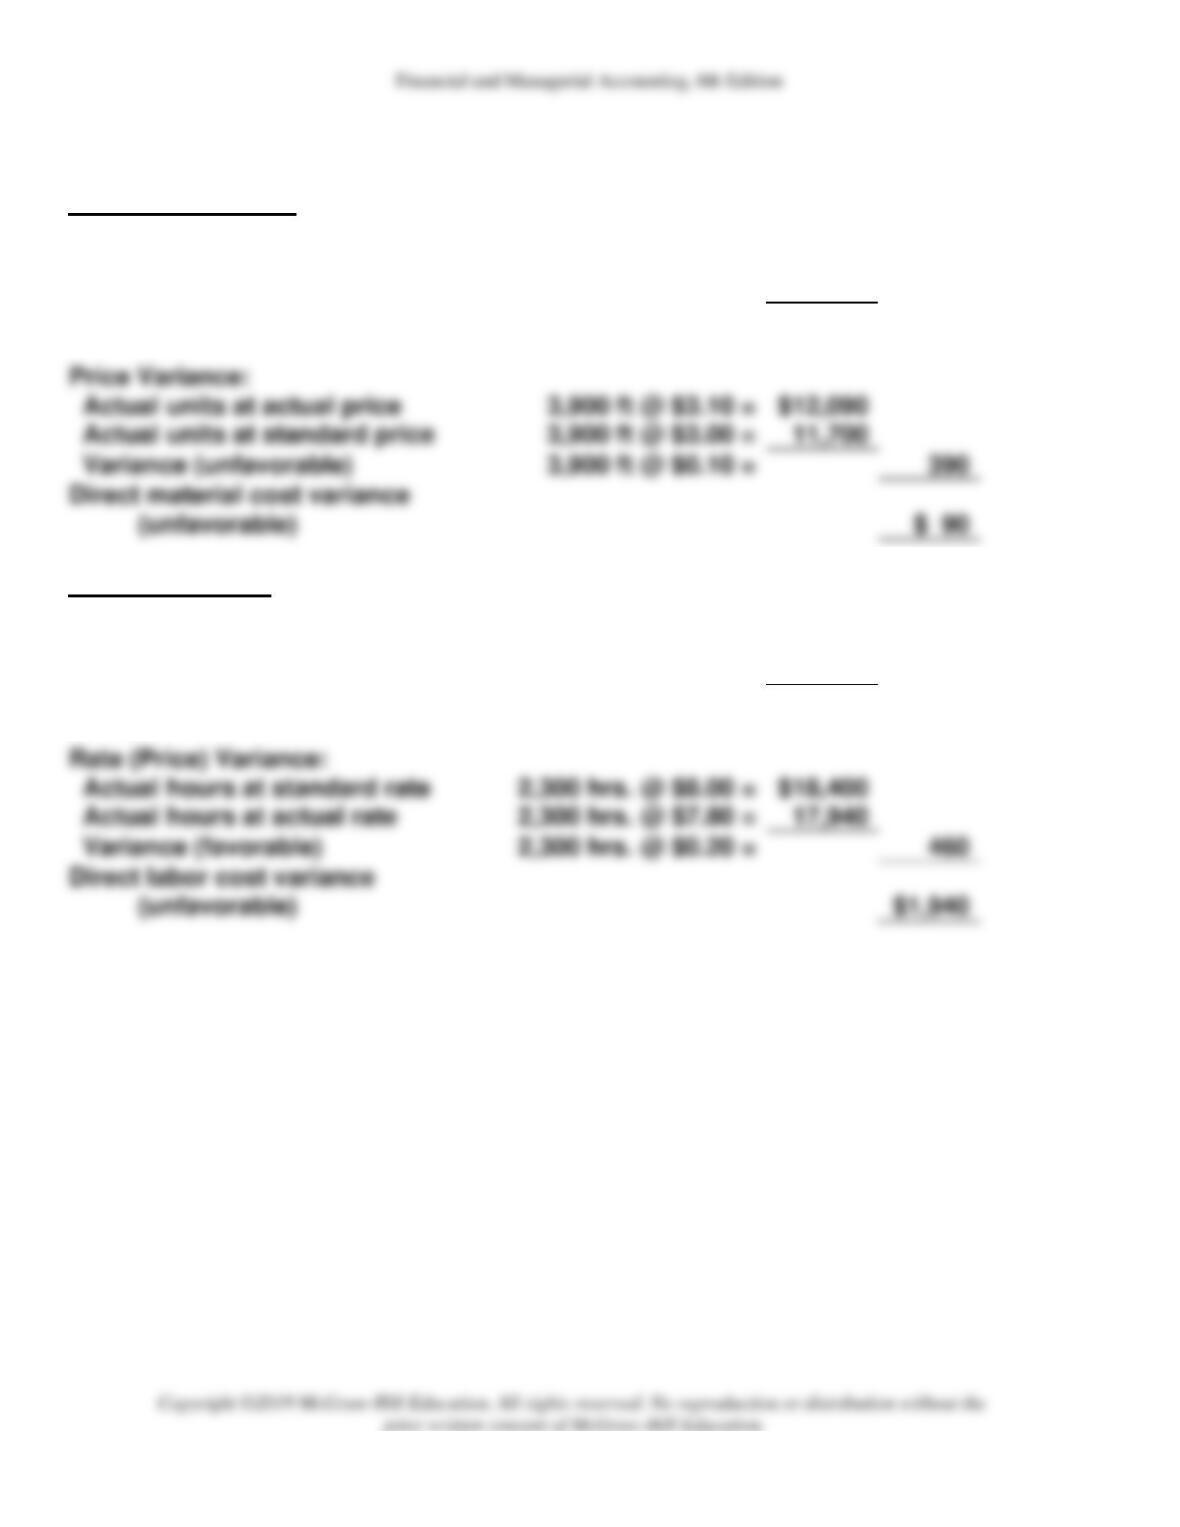
Materials Variances
Units produced……………………………………..
1,000
tables
X std. quantity of materials per unit…………..
X 4
Sq. ft per table
Standard quantity of materials for 1,000 tables
4,000
Sq ft
Labor Variances
Units produced……………………………………..
1,000
tables
X standard direct labor hrs per unit…………..
X 2
hours
Standard quantity of hours for 1,000 tables
2,000
hours
21-15
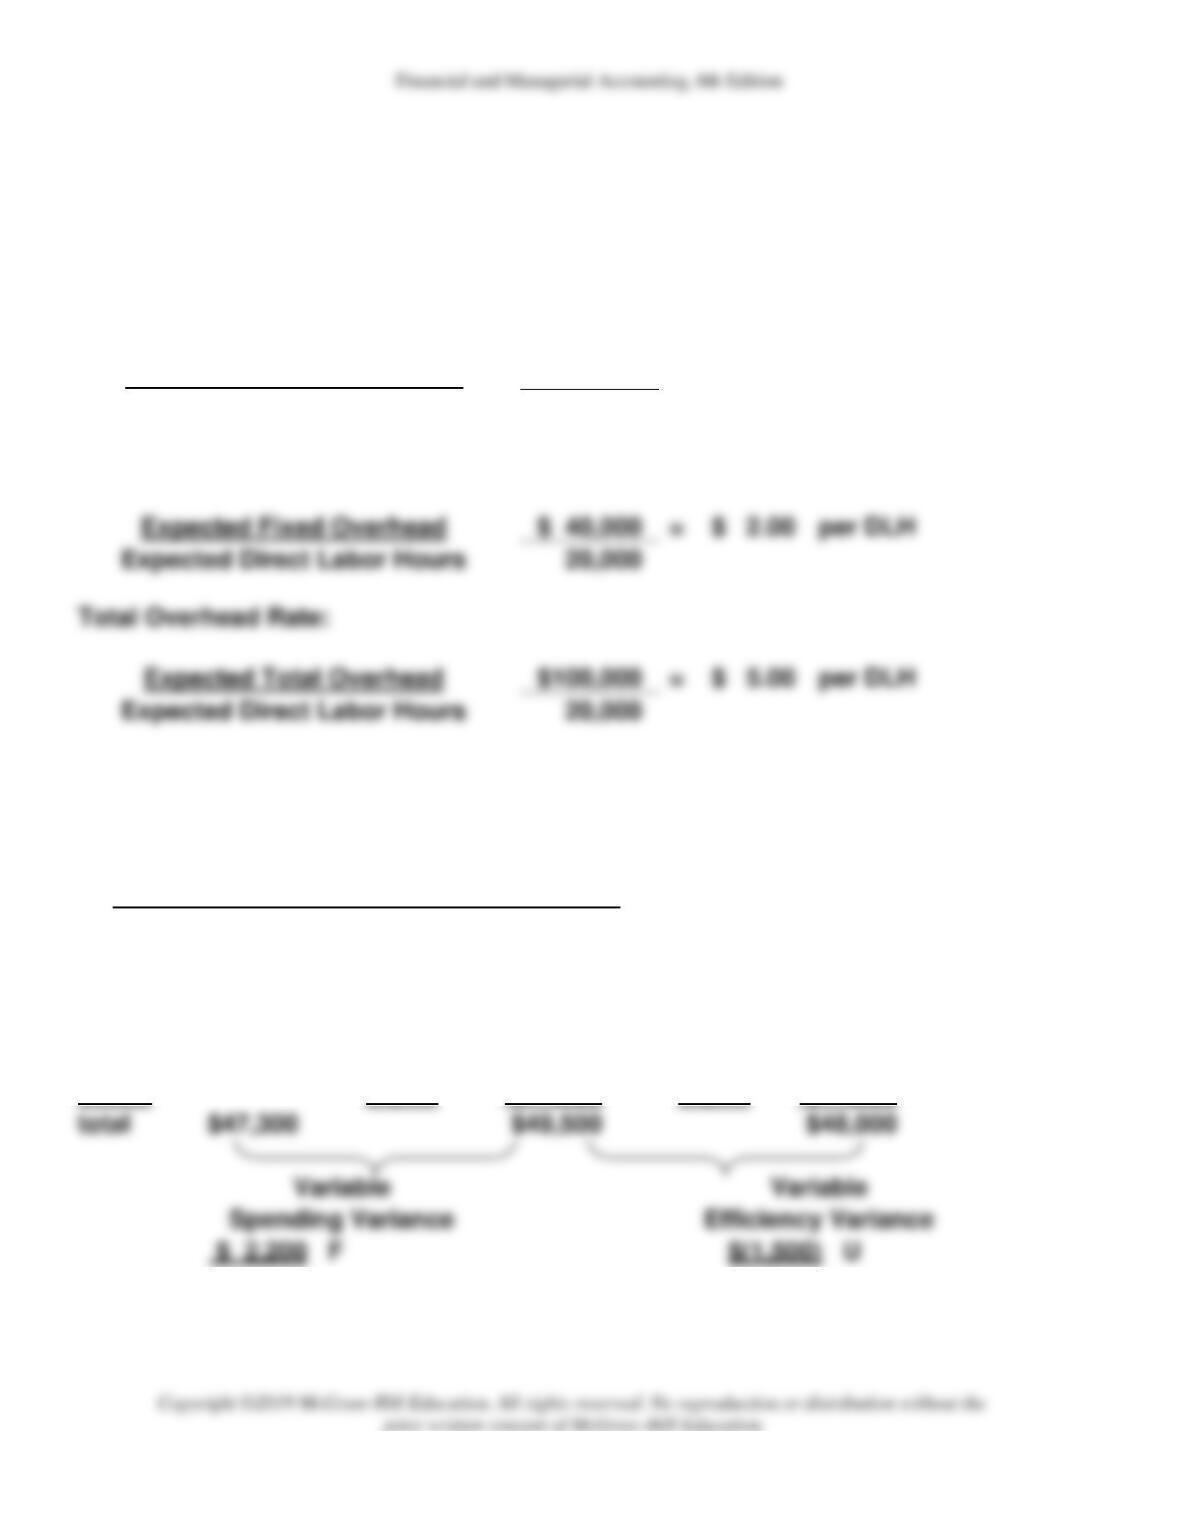
Material Variances:
Quantity Variance:
Standard units at standard price
4,000 ft @ $3.00 =
$12,000
Actual units at standard price
3,900 ft @ $3.00 =
11,700
Variance (favorable)
100 ft @ $3.00 =
$ 300
Price Variance:
Actual units at actual price
3,900 ft @ $3.10 =
$12,090
Actual units at standard price
3,900 ft @ $3.00 =
11,700
Variance (unfavorable)
3,900 ft @ $0.10 =
(unfavorable)
Labor Variances:
Efficiency (Quantity) Variance
Actual hours at standard rate
2,300 hrs. @ $8.00 =
$18,400
Standard hours at standard rate
2,000 hrs. @ $8.00 =
16,000
Variance (unfavorable)
300 hrs. @ $8.00 =
$2,400
Actual hours at standard rate
2,300 hrs. @ $8.00 =
$18,400
Actual hours at actual rate
2,300 hrs. @ $7.80 =
17,940
Variance (favorable)
2,300 hrs. @ $0.20 =
(unfavorable)
$1,940
21-16
Chapter 21 Alternate Demo Problem #2: Solution
1. Compute the predetermined overhead rates
Overhead at operating level expected (80%) or 10,000 units
Variable Overhead Rate:
Expected Variable Overhead
$ 60,000
=
$ 3.00
per DLH
Expected Direct Labor Hours
20,000
Fixed Overhead Rate:
$ 40,000
=
$ 2.00
per DLH
Expected Direct Labor Hours
20,000
Total Overhead Rate:
$100,000
=
$ 5.00
per DLH
Expected Direct Labor Hours
20,000
2. Variable Overhead Variance Computations
Actual Variable
Applied Variable
Overhead
Overhead
AH
AH
16,500
SH
16,000
x AVR
x SVR
$ 3.00
x SVR
$ 3.00
total
$47,300
$49,500
$48,000
F
$(1,500)
U
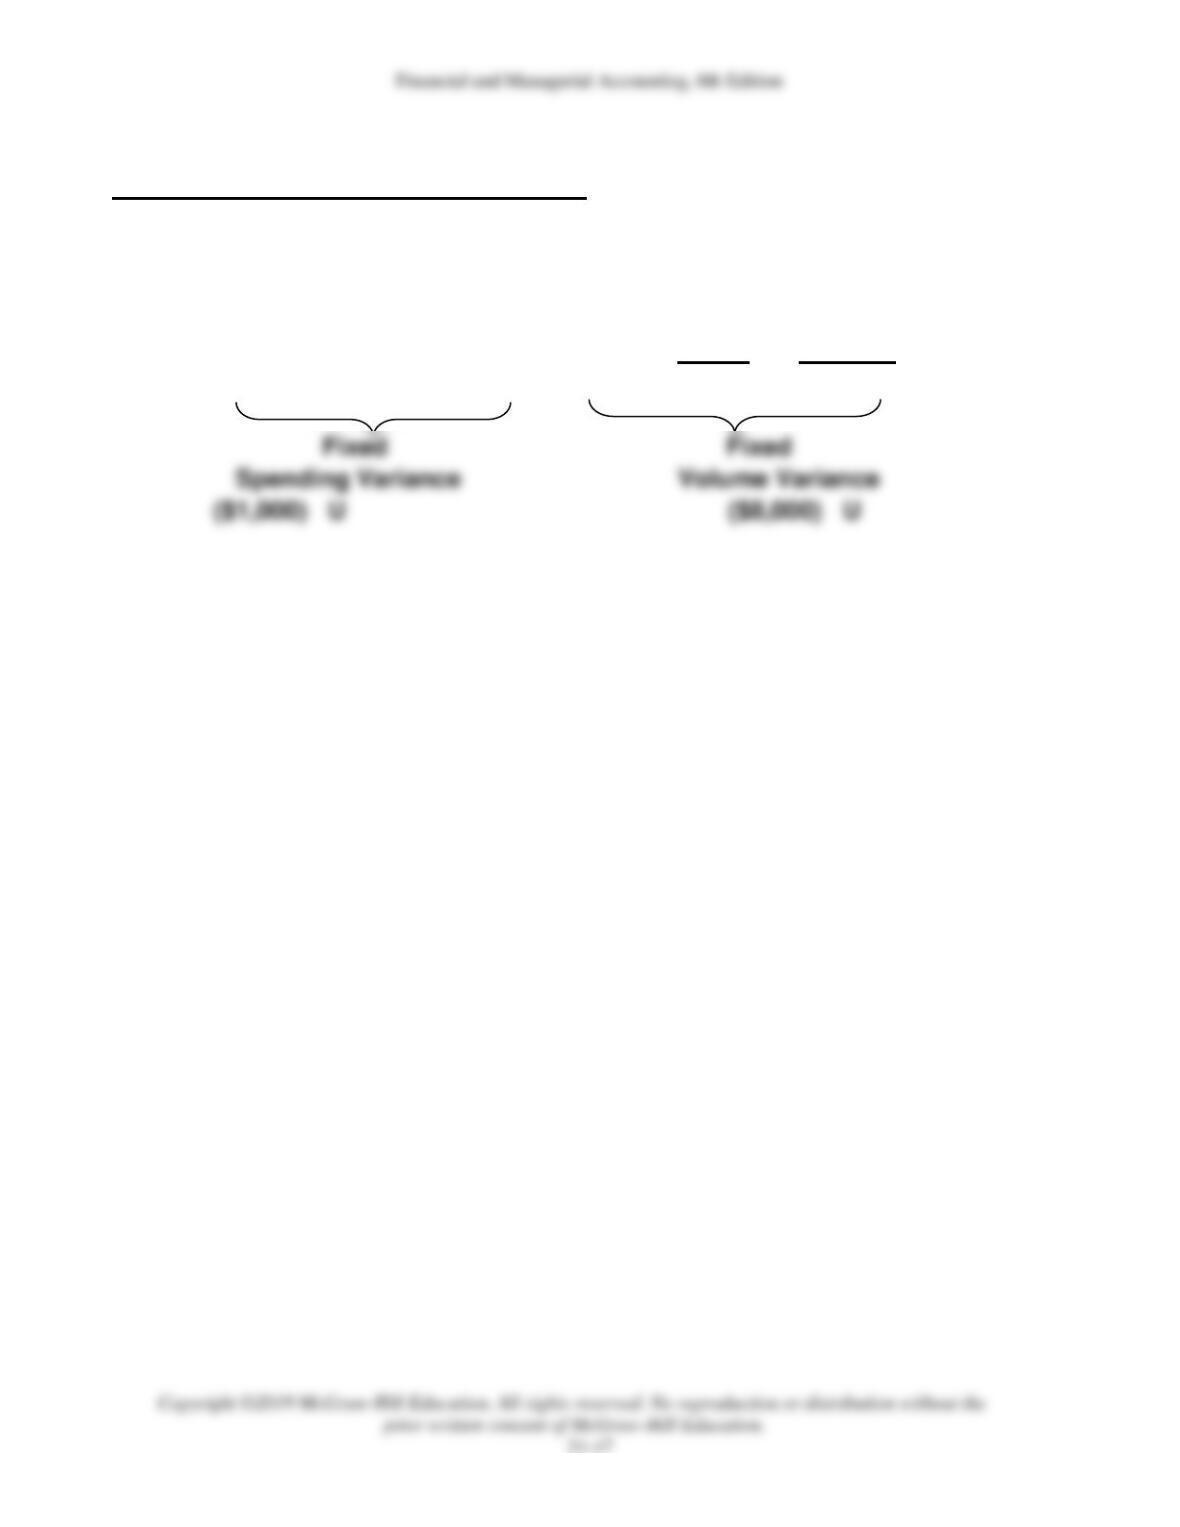
3. Fixed Overhead Variance Computations
Actual Fixed
Applied Fixed
Overhead
Overhead
SH
16,000
From
x SVR
$ 2.00
Given
$41,000
Budget
$40,000
$32,000
Fixed
Spending Variance
U
U