Unlock document.
This document is partially blurred.
Unlock all pages and 1 million more documents.
Get Access
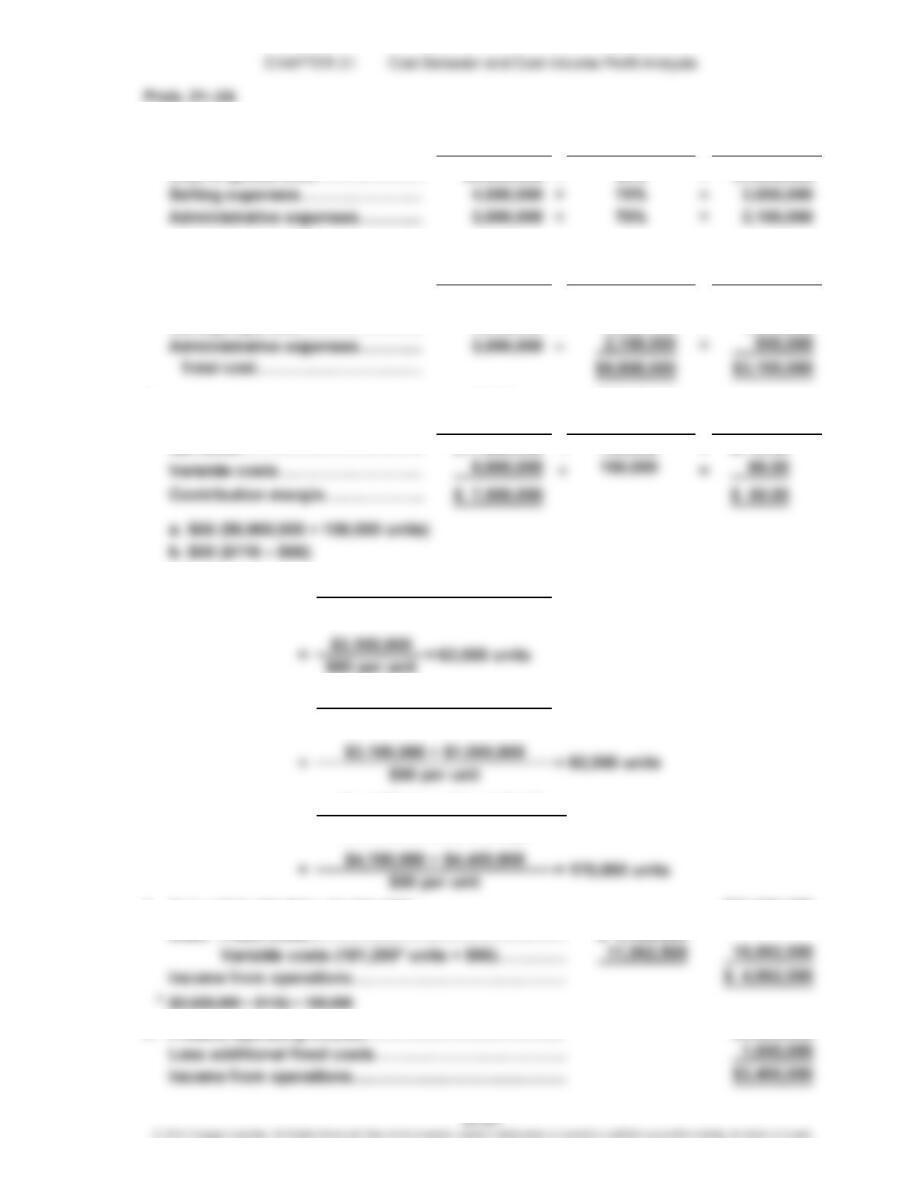
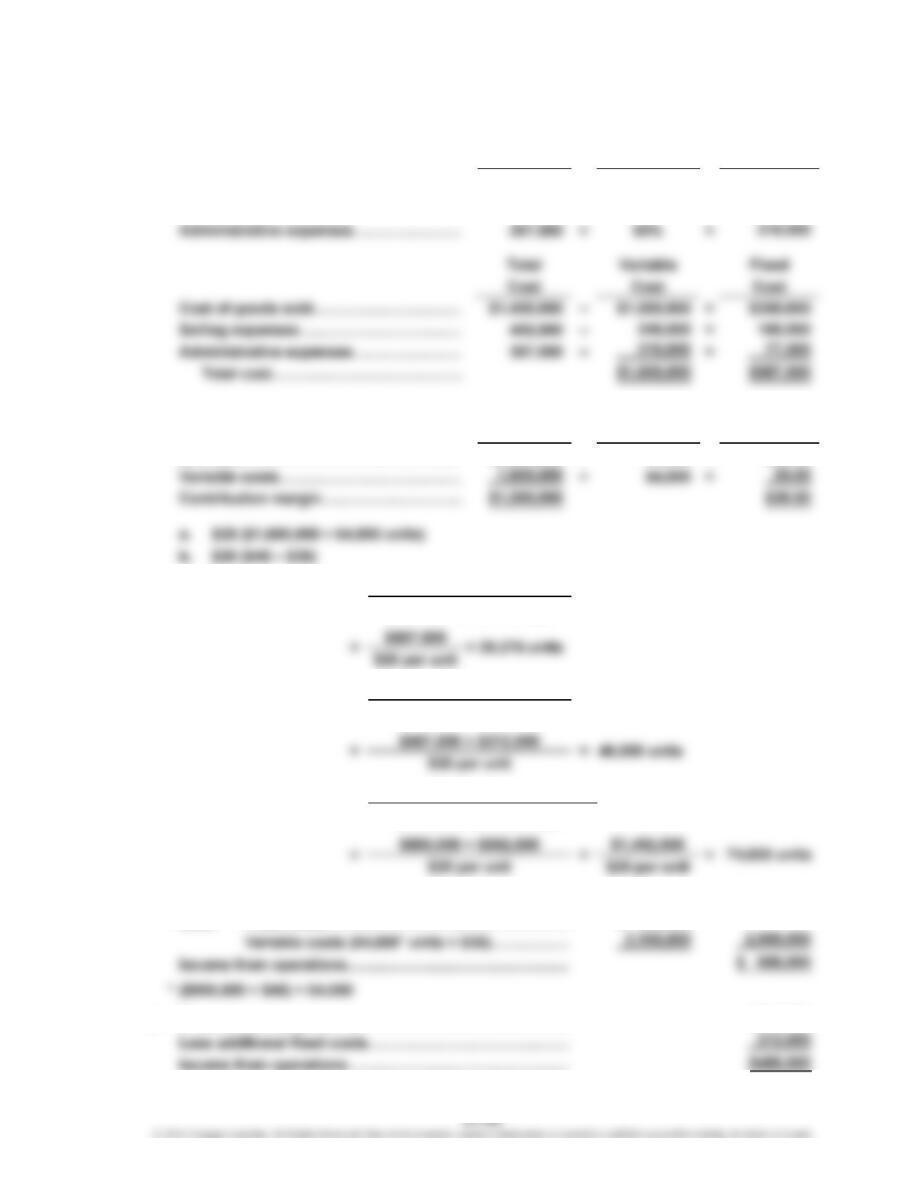
1. Variable Variable
Total Cost Cost Percentage Cost
Cost of goods sold………………
…
$6,000,000 × 80% = $4,800,000
Variable Fixed
Total Cost Cost Cost
Cost of goods sold………………
…
$6,000,000
–
$4,800,000 = $1,200,000
Selling expenses…………………
…
4,000,000 –3,000,000 = 1,000,000
2. Total Number
Amount of Units Per Unit
Net sales……………………………
…
$17,400,000
÷
150,000 = $116.00
$50 per unit
6. Sales ($17,400,000 + $3,625,000)………………………
…
Less: Fixed costs………………………………………… $ 4,100,000
7. Present operating income………………………………
…
Sales (units)
$4,400,000
5.
$21,025,000
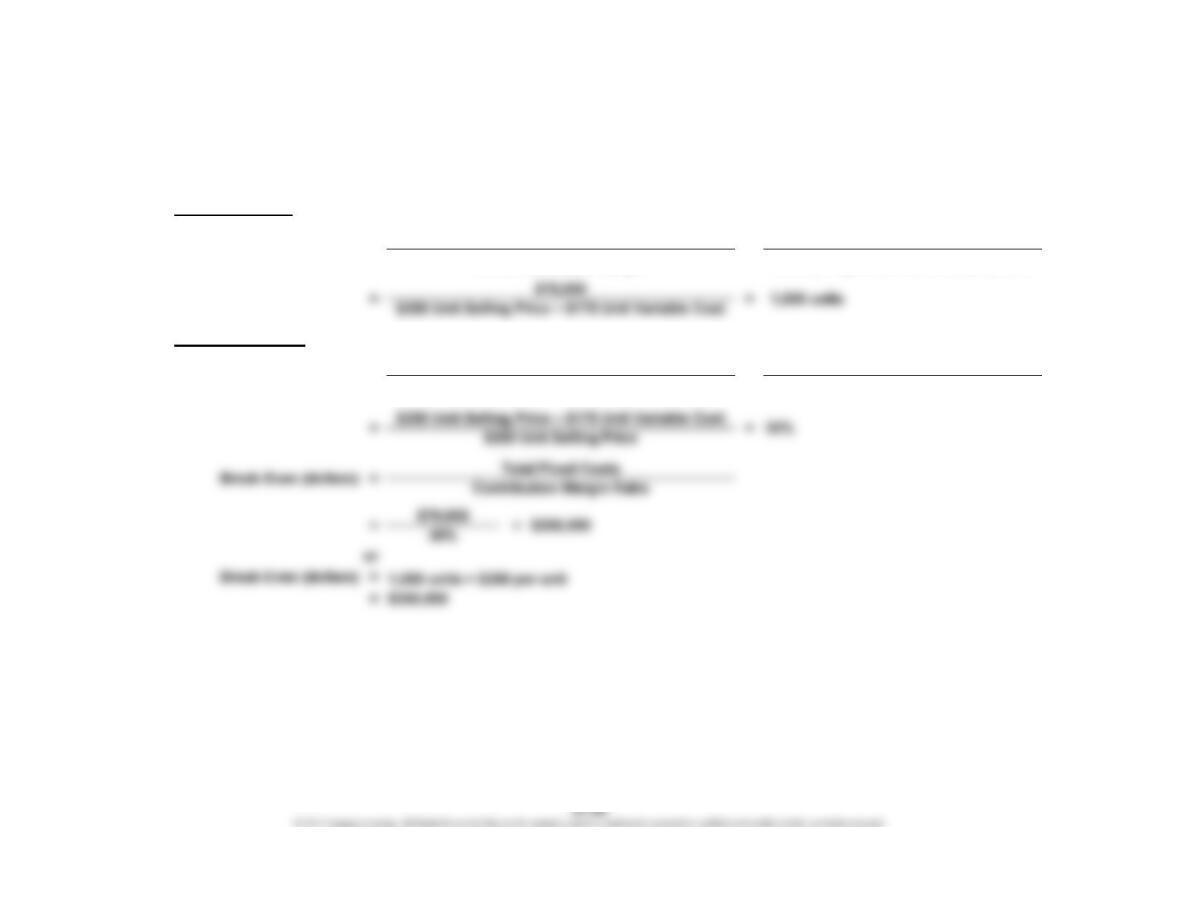
4. Break-Even
Sales (units) =Fixed Costs
Unit Contribution Margin
3. Fixed Costs
Unit Contribution Margin
Break-Even
Sales (units) =
Fixed Costs + Target Profit
Unit Contribution Margin
=
CHAPTER 21 Cost Behavior and Cost-Volume-Profit Analysis
Prob. 21–2A (Concluded)
8. In favor of the proposal is the possibility of increasing income from operations
from $4,400,000 to $4,962,500. However, there are many points against the
proposal, including:
a. The break-even point increases by 20,000 units (from 62,000 to 82,000).
CHAPTER 21 Cost Behavior and Cost-Volume-Profit Analysis
Prob. 21–3A
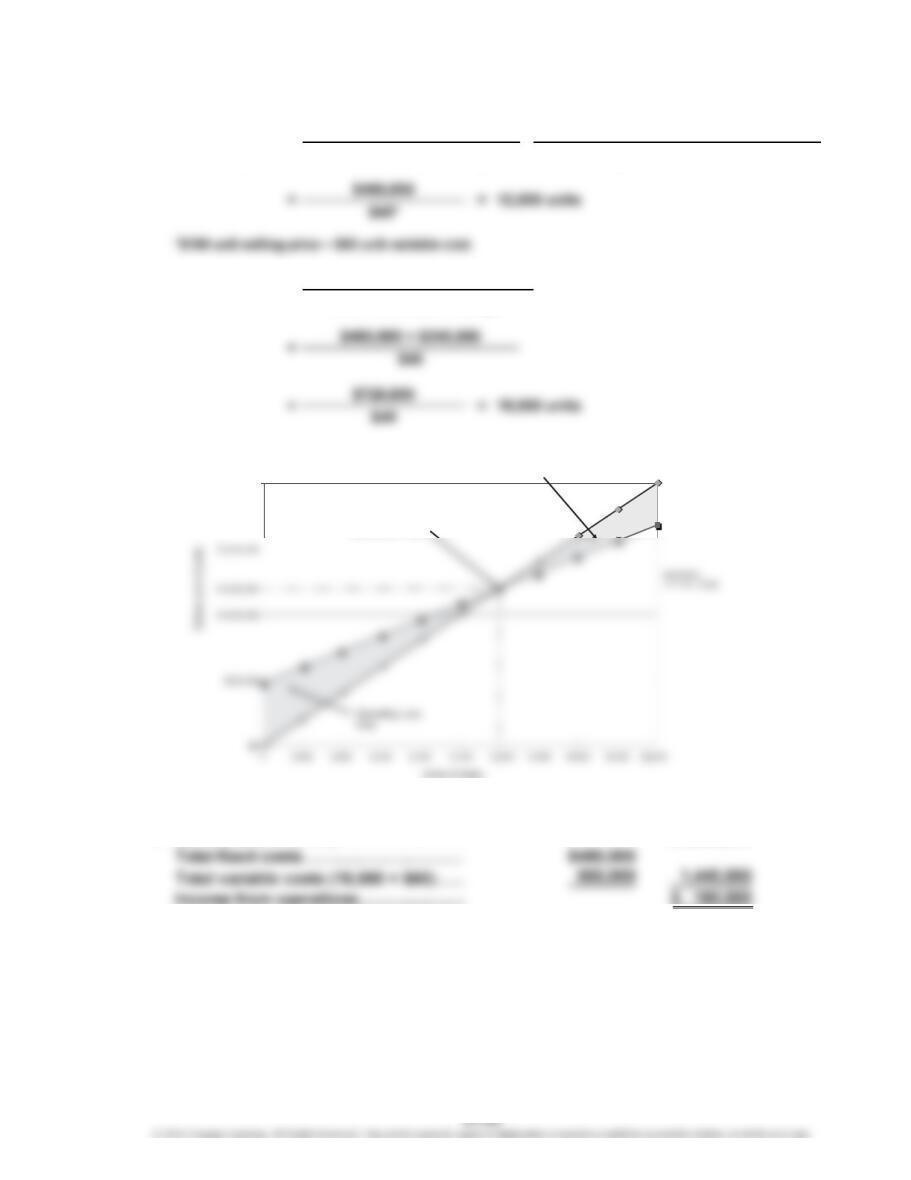
Break-Even
Sales (units)
3.
4. Sales (16,000 × $100)…………………… $1,600,000
1. = Total Fixed Costs
Unit Contribution Margin
2. = Fixed Costs + Target Profit
Unit Contribution Margin
Sales (units)
=Total Fixed Costs
Unit Selling Price – Unit Variable Cost
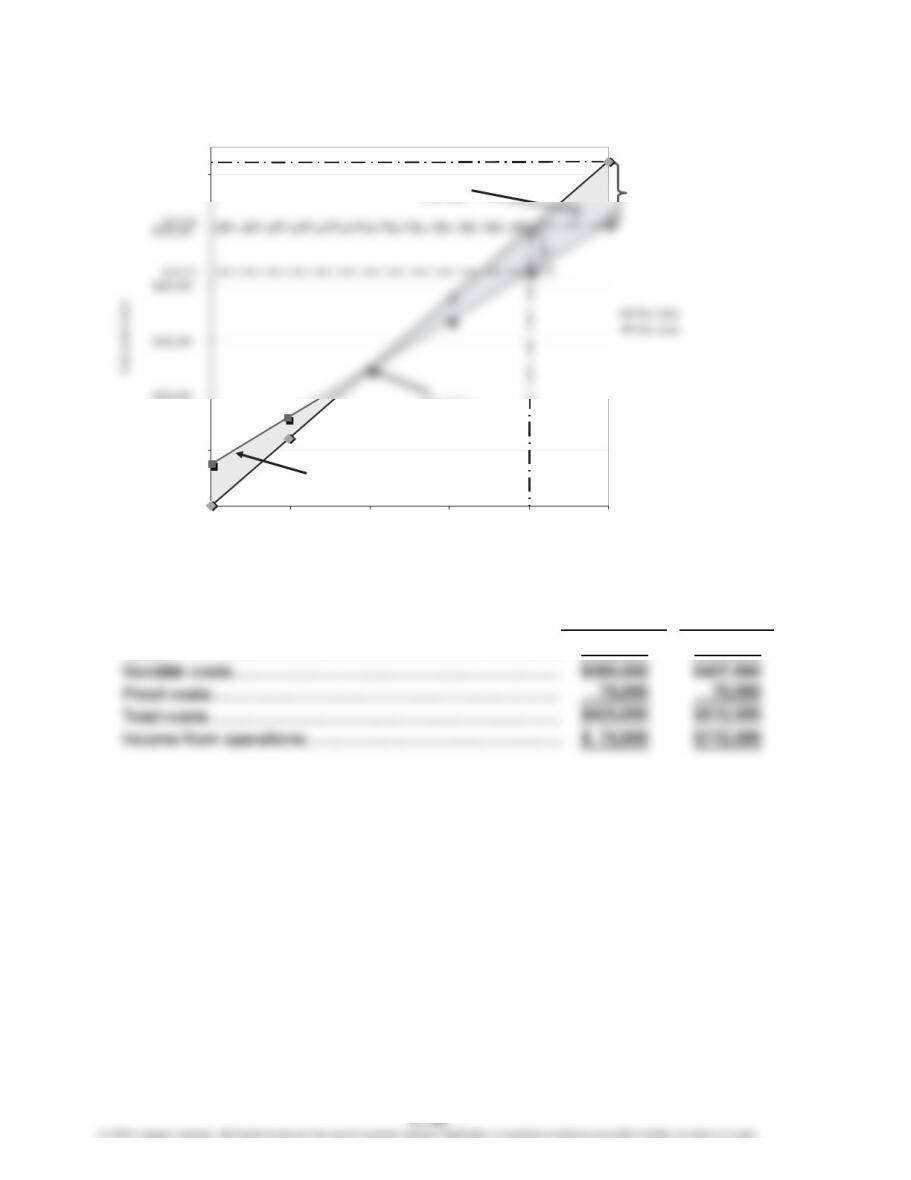
$2,000,000
Operating Profit Area
Break-Even Point
CHAPTER 21 Cost Behavior and Cost-Volume-Profit Analysis
Prob. 21–4A
1.
$600,000
$700,000
Operating
Profit Area
CHAPTER 21 Cost Behavior and Cost-Volume-Profit Analysis
Prob. 21–4A (Continued)
1. Break-Even Units:
Break-Even Dollars:
Contribution Margin Ratio = Unit Contribution Margin =Unit Selling Price – Unit Variable Cost
Unit Selling Price Unit Selling Price
Break-Even Sales (units) = Total Fixed Costs =Total Fixed Costs
Unit Contribution Margin Unit Selling Price – Unit Variable Cost
CHAPTER 21 Cost Behavior and Cost-Volume-Profit Analysis
Prob. 21–4A (Continued)
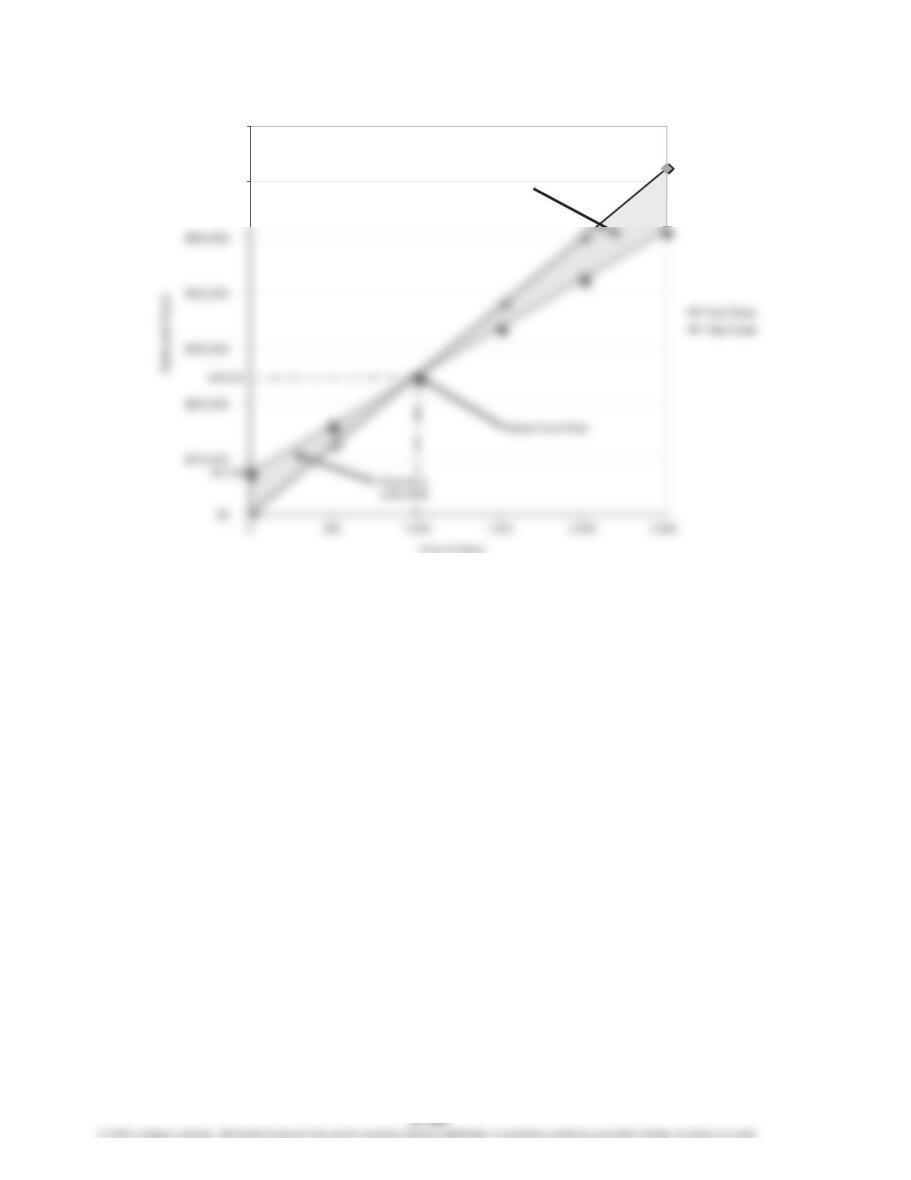
2.
Units sold: $500,000 ÷ $250 per unit = 2,000 units
a. b.
2,000 units 2,500 units
Sales………………………………………………………………
…
$500,000 $625,000
$0
$100,000
$600,000
0 500 1,000 1,500 2,000 2,500
Units of Sales
Operating
Profit Area
Break-Even
Point
Operating Loss
Area
$625,000
$75,000
CHAPTER 21 Cost Behavior and Cost-Volume-Profit Analysis
Prob. 21–4A (Continued)
3.
$600,000
$700,000
Operating
Profit Area
CHAPTER 21 Cost Behavior and Cost-Volume-Profit Analysis
Prob. 21–4A (Continued)
3. Break-Even Units:
Break-Even Dollars:
Contribution Margin Ratio = Unit Contribution Margin =Unit Selling Price – Unit Variable Cost
Unit Selling Price Unit Selling Price
Break-Even Sales (units) = Total Fixed Costs =Total Fixed Costs
Unit Contribution Margin Unit Selling Price – Unit Variable Cost
CHAPTER 21 Cost Behavior and Cost-Volume-Profit Analysis
Prob. 21–4A (Concluded)
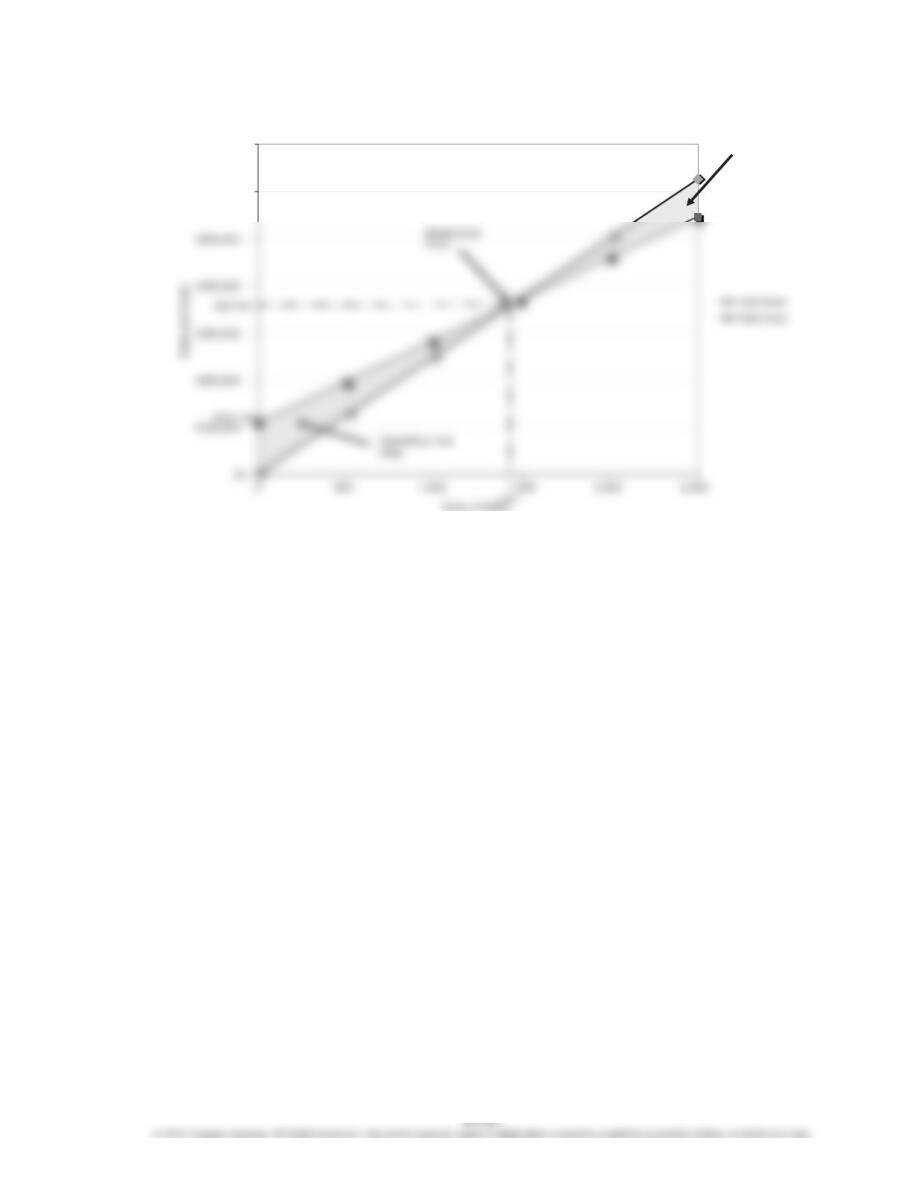
4.
a. b.
2,000 units 2,500 units
Sales………………………………………………………………
…
$500,000 $625,000
$0
$100,000
$200,000
$700,000
0 500 1,000 1,500 2,000 2,500
Sales and Costs
Units of Sales
Operating
Profit Area
Break-Even
Point
Operating
Loss Area
$108,750
CHAPTER 21 Cost Behavior and Cost-Volume-Profit Analysis
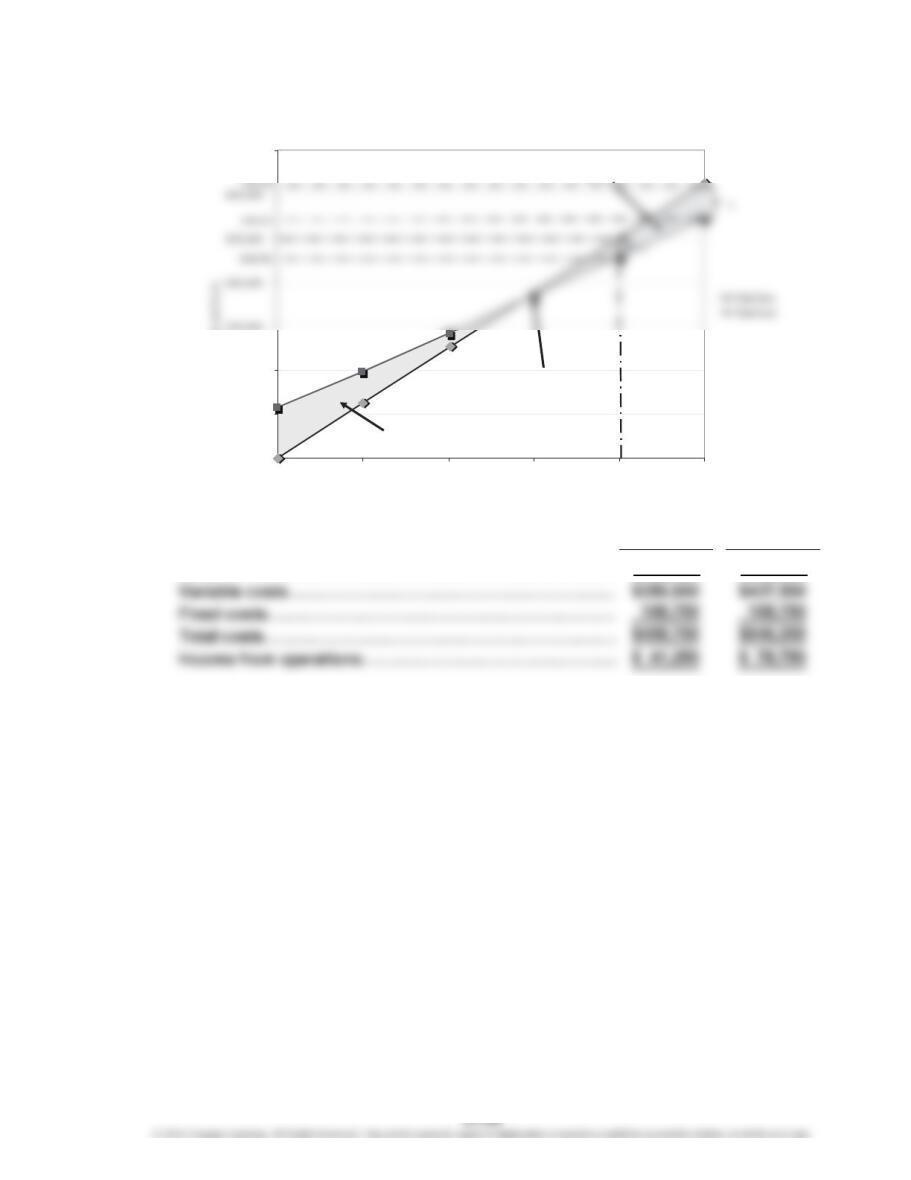
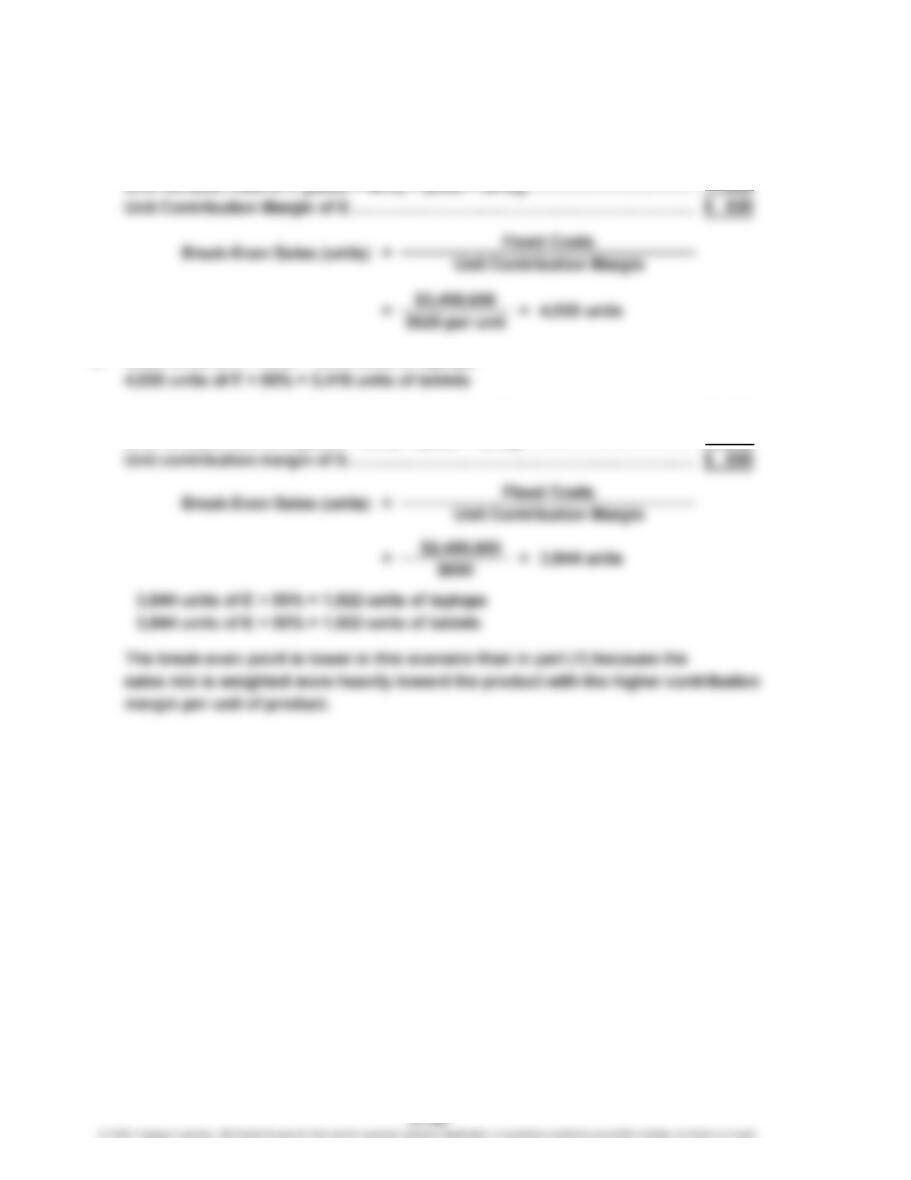
Prob. 21–5A
(Overall product is labeled E.)
1. Unit Selling Price of E [($1,600 × 40%) + ($850 × 60%)]…………………………
…
$1,150
530
2. 4,030 units of E × 40% = 1,612 units of laptops
3. Unit selling price of E [($1,600 × 50%) + ($850 × 50%)]…………………………
…
$1,225
Unit variable cost of E [($800 × 50%) + ($350 × 50%)]…………………………
…
575
CHAPTER 21 Cost Behavior and Cost-Volume-Profit Analysis
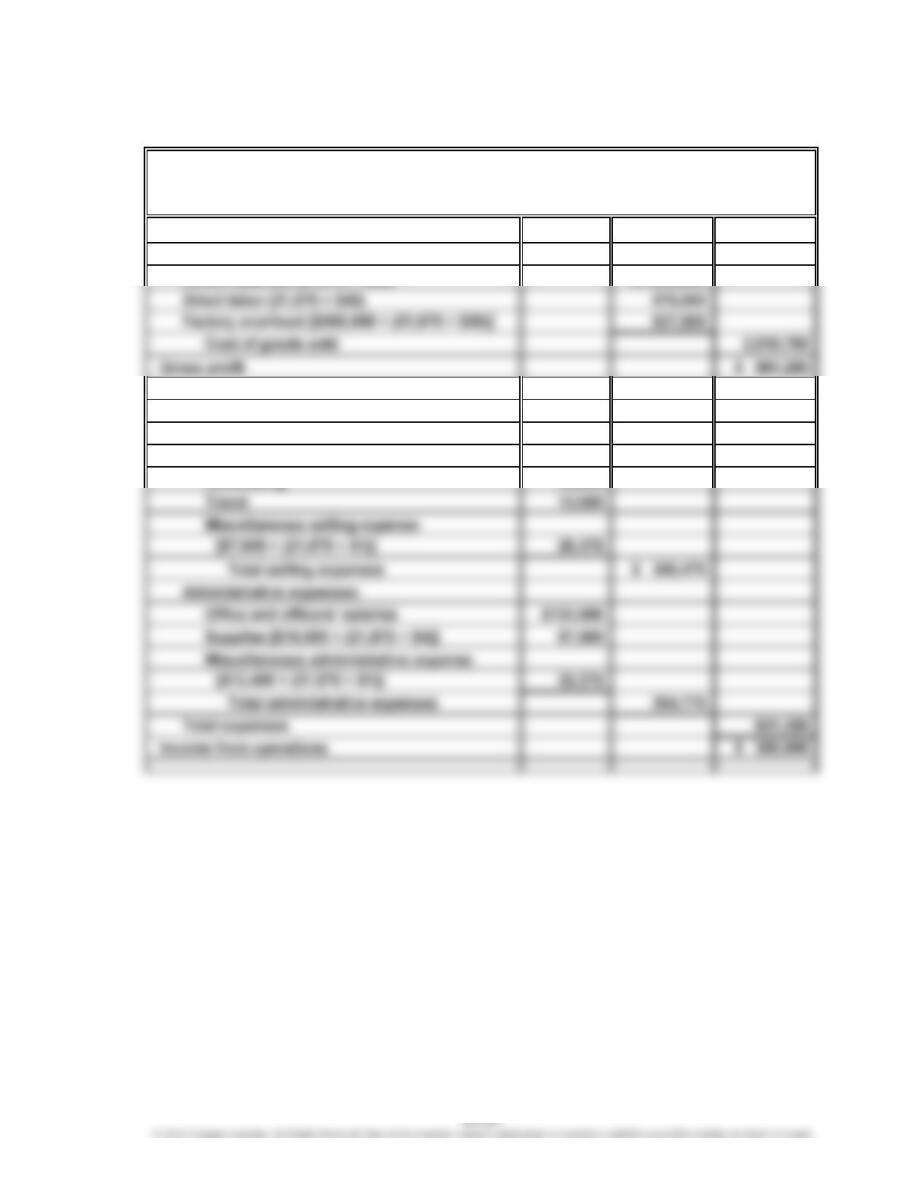
Prob. 21–6A
1.
Sales (21,875 × $160) $3,500,000
Cost of goods sold:
Direct materials (21,875 × $46) $1,006,250
Expenses:
Selling expenses:
Sales salaries and commissions
[$110,000 + (21,875 × $8)] $285,000
Advertising 40,000
WOLSEY INDUSTRIES INC.
Estimated Income Statement
For the Year Ended December 31, 2016
CHAPTER 21 Cost Behavior and Cost-Volume-Profit Analysis
Prob. 21–6A (Continued)
$525,000
$160 – $120
=Fixed Costs
Unit Contribution Margin
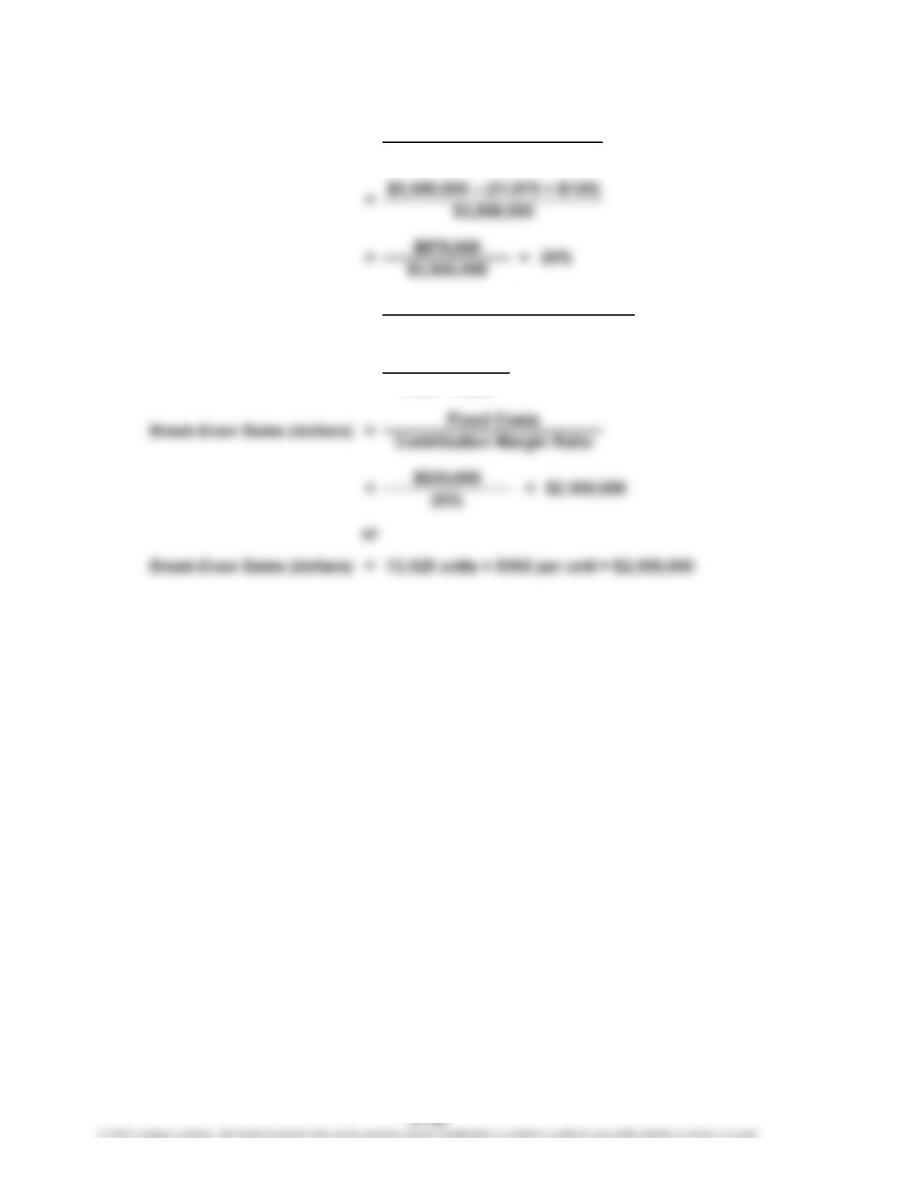
2. Contribution Margin Ratio = Sales – Variable Costs
Sales
==
3. Break-Even Sales (units)
13,125 units
CHAPTER 21 Cost Behavior and Cost-Volume-Profit Analysis
Prob. 21–6A (Concluded)
4.
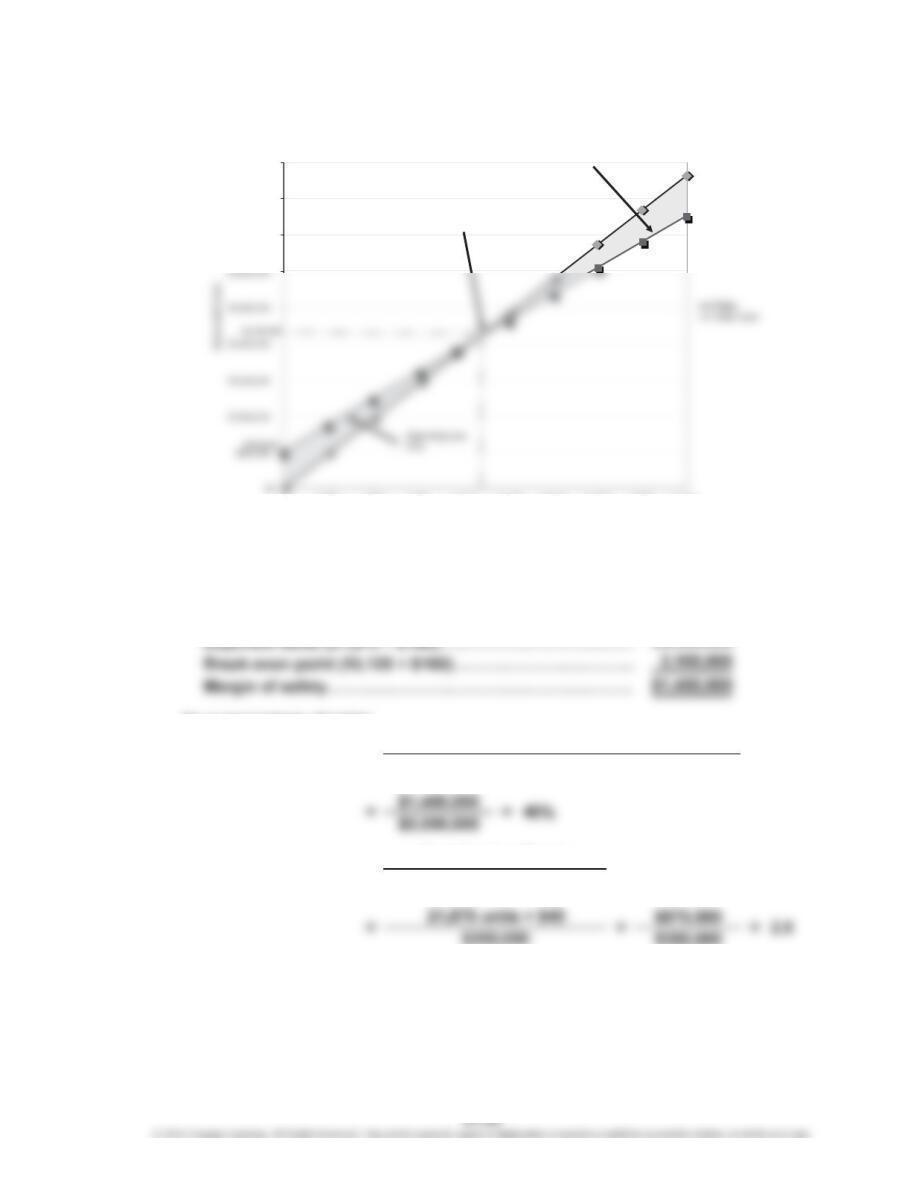
5. Margin of safety:
In dollars:
$3,500,000
As a percentage of sales:
=Margin of Safety Sales – Sales at Break-Even Point
Sales
Contribution Margin
Income from Operations
6. Operating Leverage =
$3,500,000
$4,000,000
$4,500,000
0 3,000 6,000 9,000 12,000 15,000 18,000 21,000 24,000 27,000
Units
Operating Profit
Area
Break-Even Point
13,125
CHAPTER 21 Cost Behavior and Cost-Volume-Profit Analysis
Prob. 21–1B
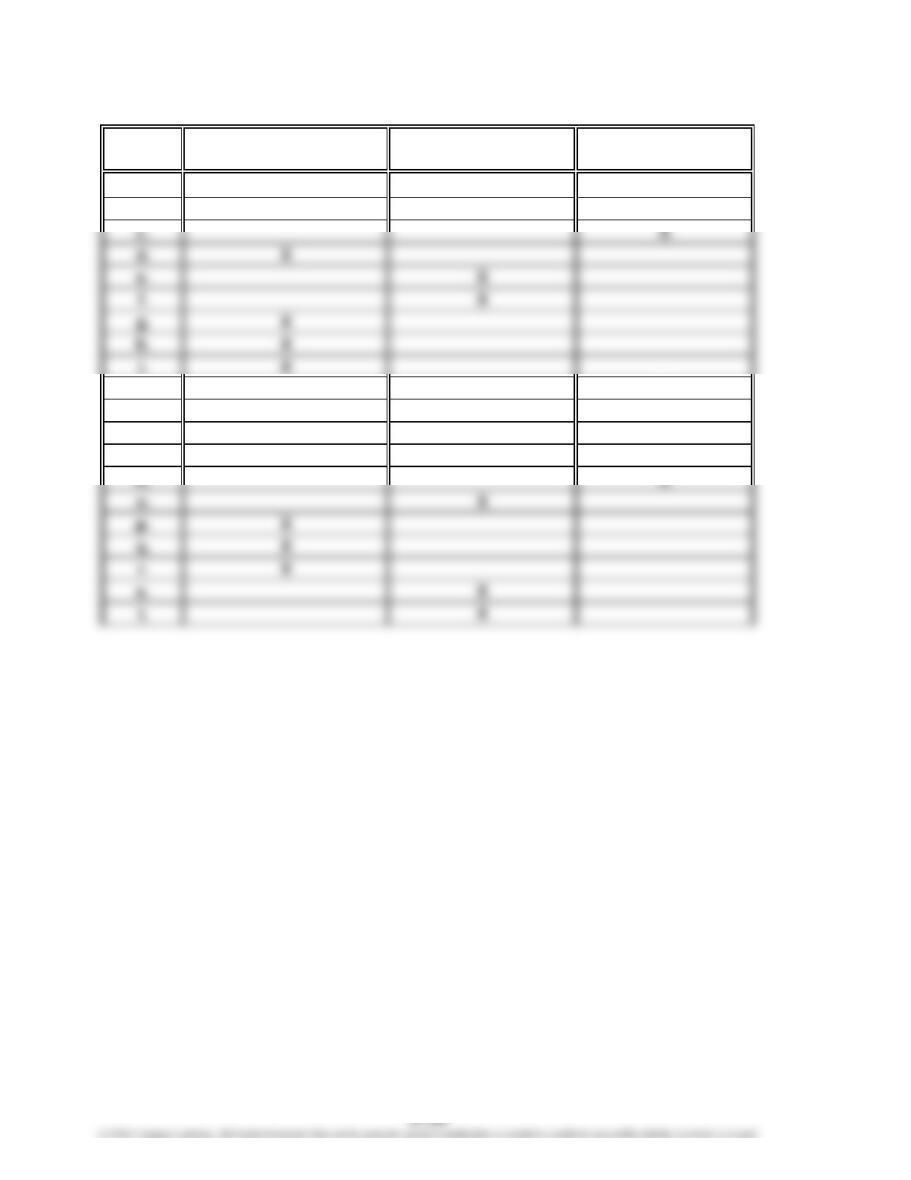
Fixed Variable Mixed
Cost Cost Cost Cost
a. X
b. X
j. X
k. X
l. X
m. X
CHAPTER 21 Cost Behavior and Cost-Volume-Profit Analysis
Prob. 21–2B
1. Total Variable Cost Variable
Cost Percentage Cost
Cost of goods sold…………………………
…
$1,400,000 × 75% = $1,050,000
Selling expenses…………………………… 400,000 × 60% = 240,000
2. Number
Total Amount of Units Per Unit
Net sales……………………………………
…
$2,880,000 ÷ 64,000 =$45.00
6. Sales ($2,880,000 + $900,000)………………………………
…
Less: Fixed costs…………………………………………
…
$ 800,000
7. Present operating income……………………………………
…
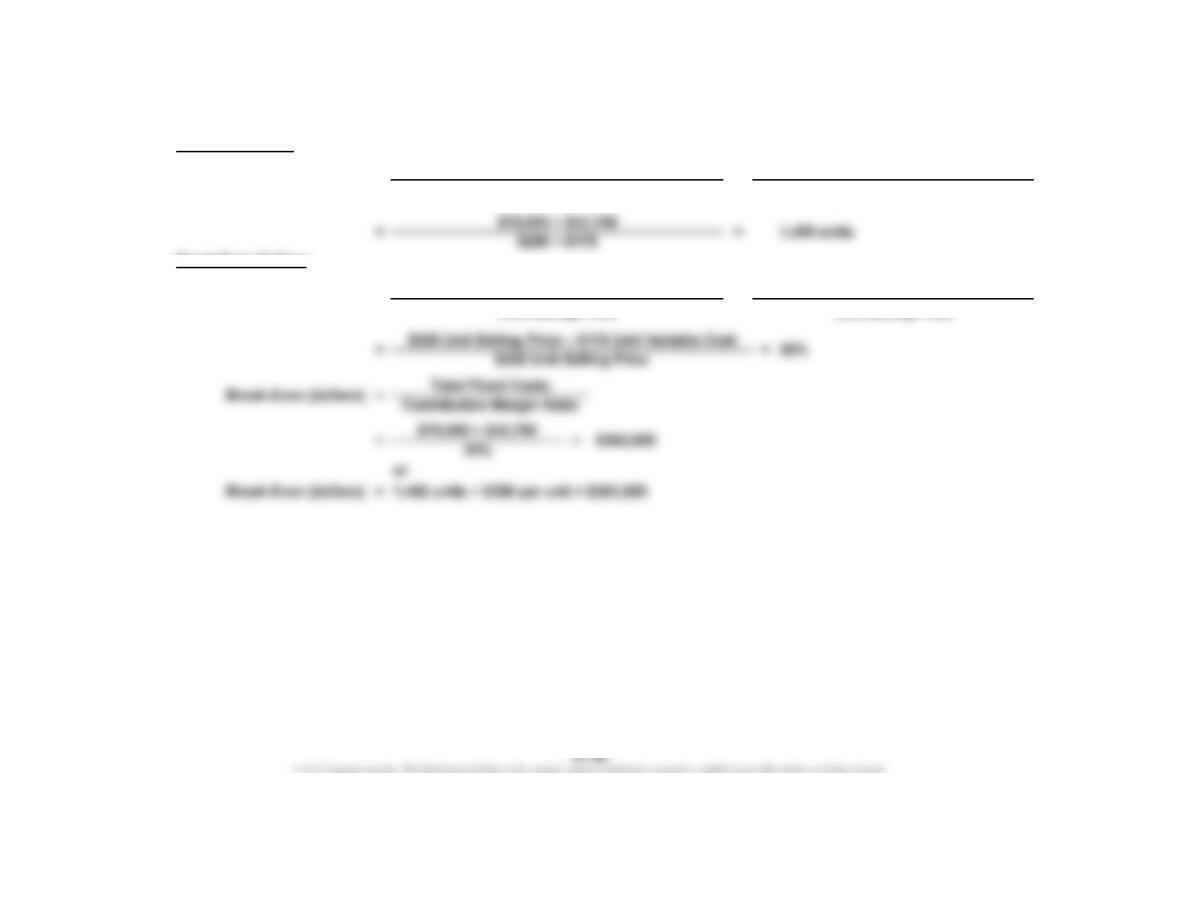
5. Unit Contribution Margin
Break-Even
Sales (units)
$692,500
Sales (units)
=
=
3. Fixed Costs
Unit Contribution Margin
4. Break-Even
Sales (units) =
Fixed Costs
Unit Contribution Margin
$3,780,000
Fixed Costs + Target Profit
CHAPTER 21 Cost Behavior and Cost-Volume-Profit Analysis
Prob. 21–2B (Concluded)
8. In favor of the proposal is the possibility of increasing income from operations
from $692,500 to $880,000. However, there are many points against the
proposal, including:
a. The break-even point increases by 10,625 units (from 29,375 to 40,000).


