An asterisk (*) will appear to the right of an incorrect entry.
1.
Sales
Cost of goods sold:
Direct materials
Direct labor
Factory overhead
Cost of goods sold
Gross profit
Expenses:
Selling expenses
Sales salaries and commissions
Advertising
Travel
Miscellaneous selling expense
Total selling expenses
Administrative expenses:
Office and officers’ salaries
Supplies
Miscellaneous administrative expense
Total administrative expenses
Total expenses
Income from operations
2.
Contribution margin ratio:
Sales
Variable costs
Contribution margin
Sales
Contribution margin ratio
3.
Break-even sales:
Fixed costs
Unit contribution margin
Break-even sales (units)
Sale price
Break-even sales (dollars)
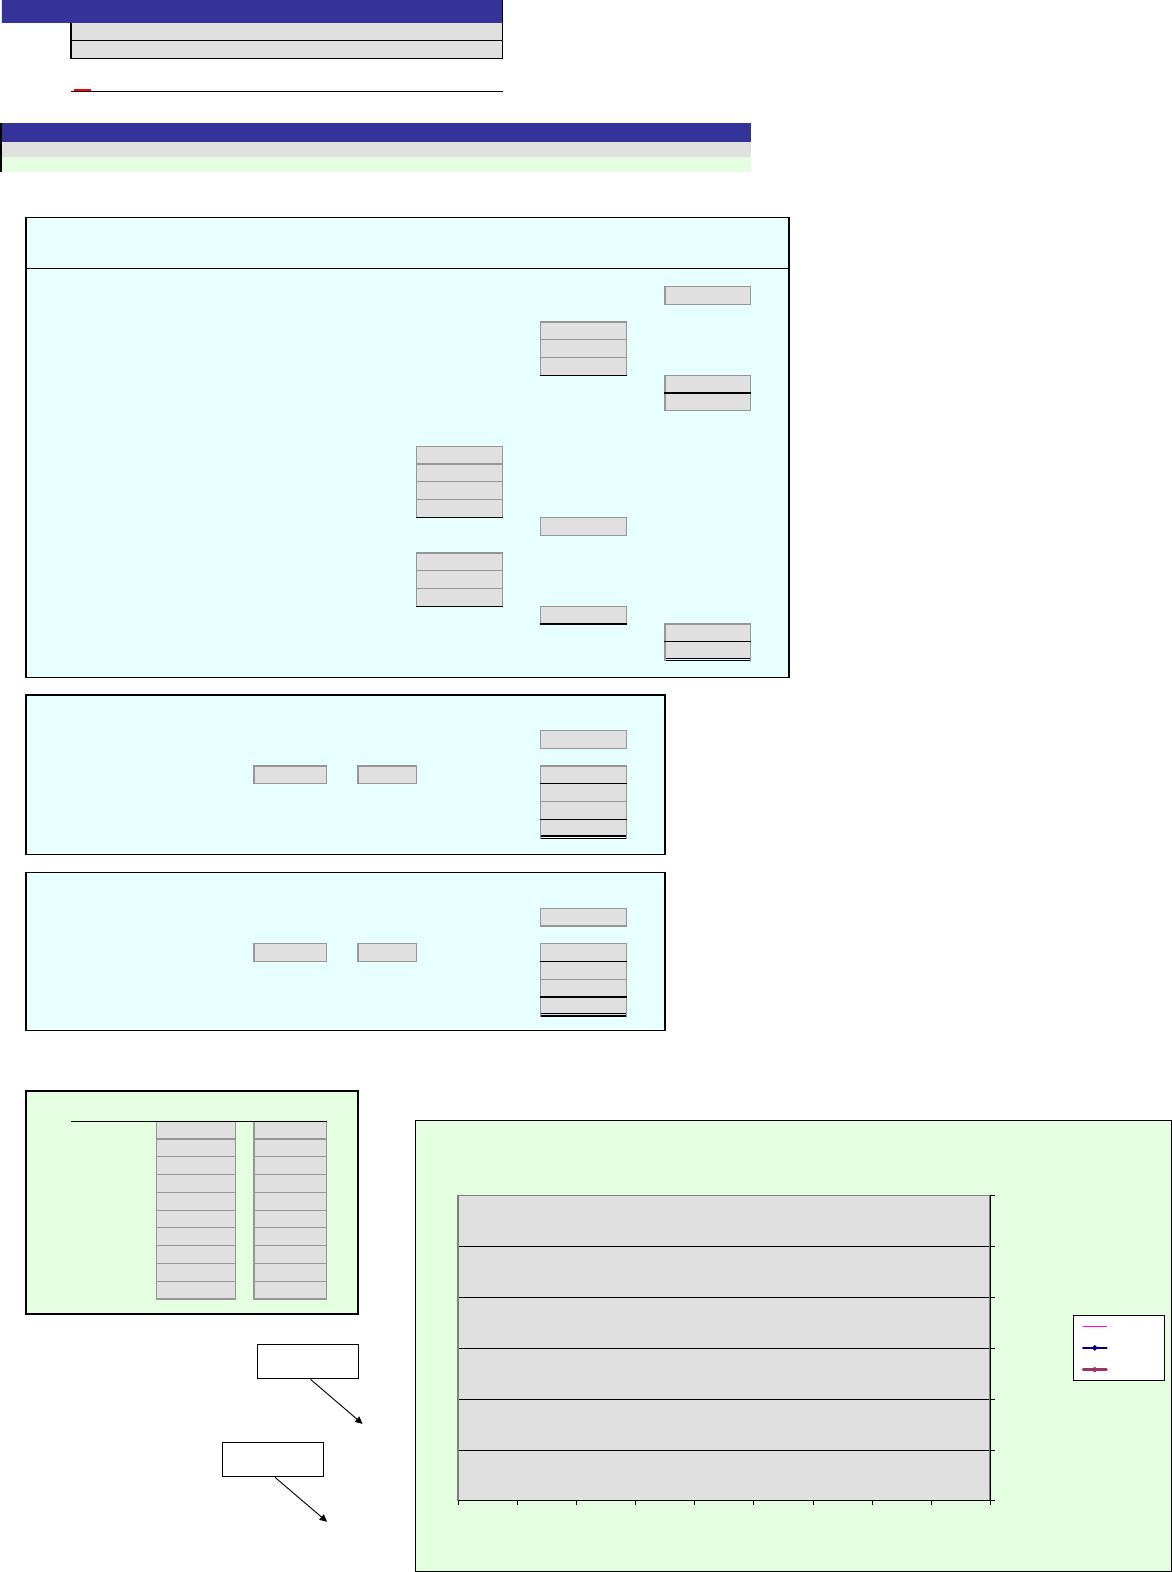
4. For each unit level of sales, enter the total sales dollars and total costs. The chart at right will be plotted as you enter the amounts.
After all points are plotted, grab and move the labels provided at the left to identify each area.
Units Sales $ Costs $
0
3,000
6,000
9,000
12,000
15,000
18,000
21,000
24,000
27,000
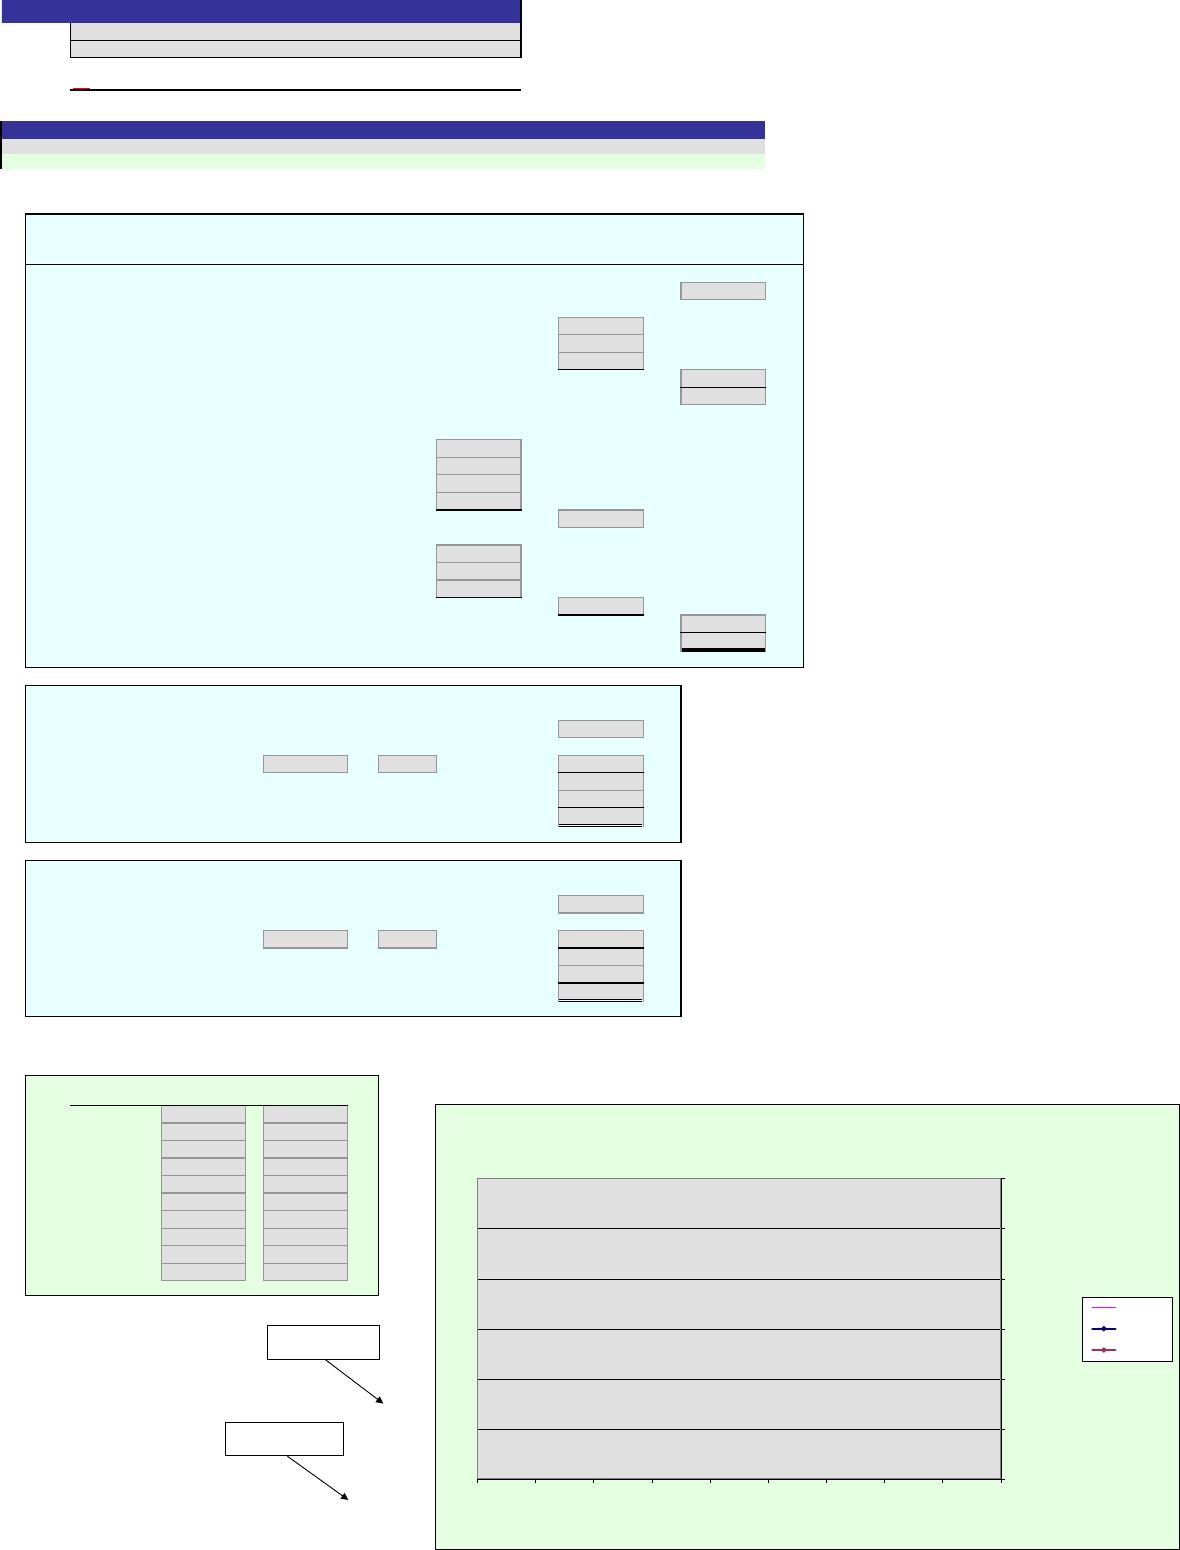
Problem 21-6A
Name:
Section:
Units Unit Variable Cost
Sale Price – Unit Variable Cost
WOLSEY INDUSTRIES INC.
Estimated Income Statement
For the Year Ended December 31, 2016
0%
Cells with non-gray backgrounds are protected and cannot be edited.
[Key code here]
Answers are entered in the cells with gray backgrounds.
Score:
Key Code:
Instructions
$-
$0
$0
$1
$1
$1
$1
0 3,000 6,000 9,000 12,000 15,000 18,000 21,000 24,000 27,000
Sales and Costs
Units
Cost-Volume-Profit Chart
Sales $
Costs $
Break-Even
Point
Operating Profit
Area
5.
Margin of safety:
Sale Price Units
Expected sales
Break-even point
Margin of safety (in dollars)
Expected sales
Margin of safety (as a percentage of sales)
6.
Operating leverage:
Unit CM $ Units
Contribution margin
Income from operations
Operating leverage
An asterisk (*) will appear to the right of an incorrect entry.
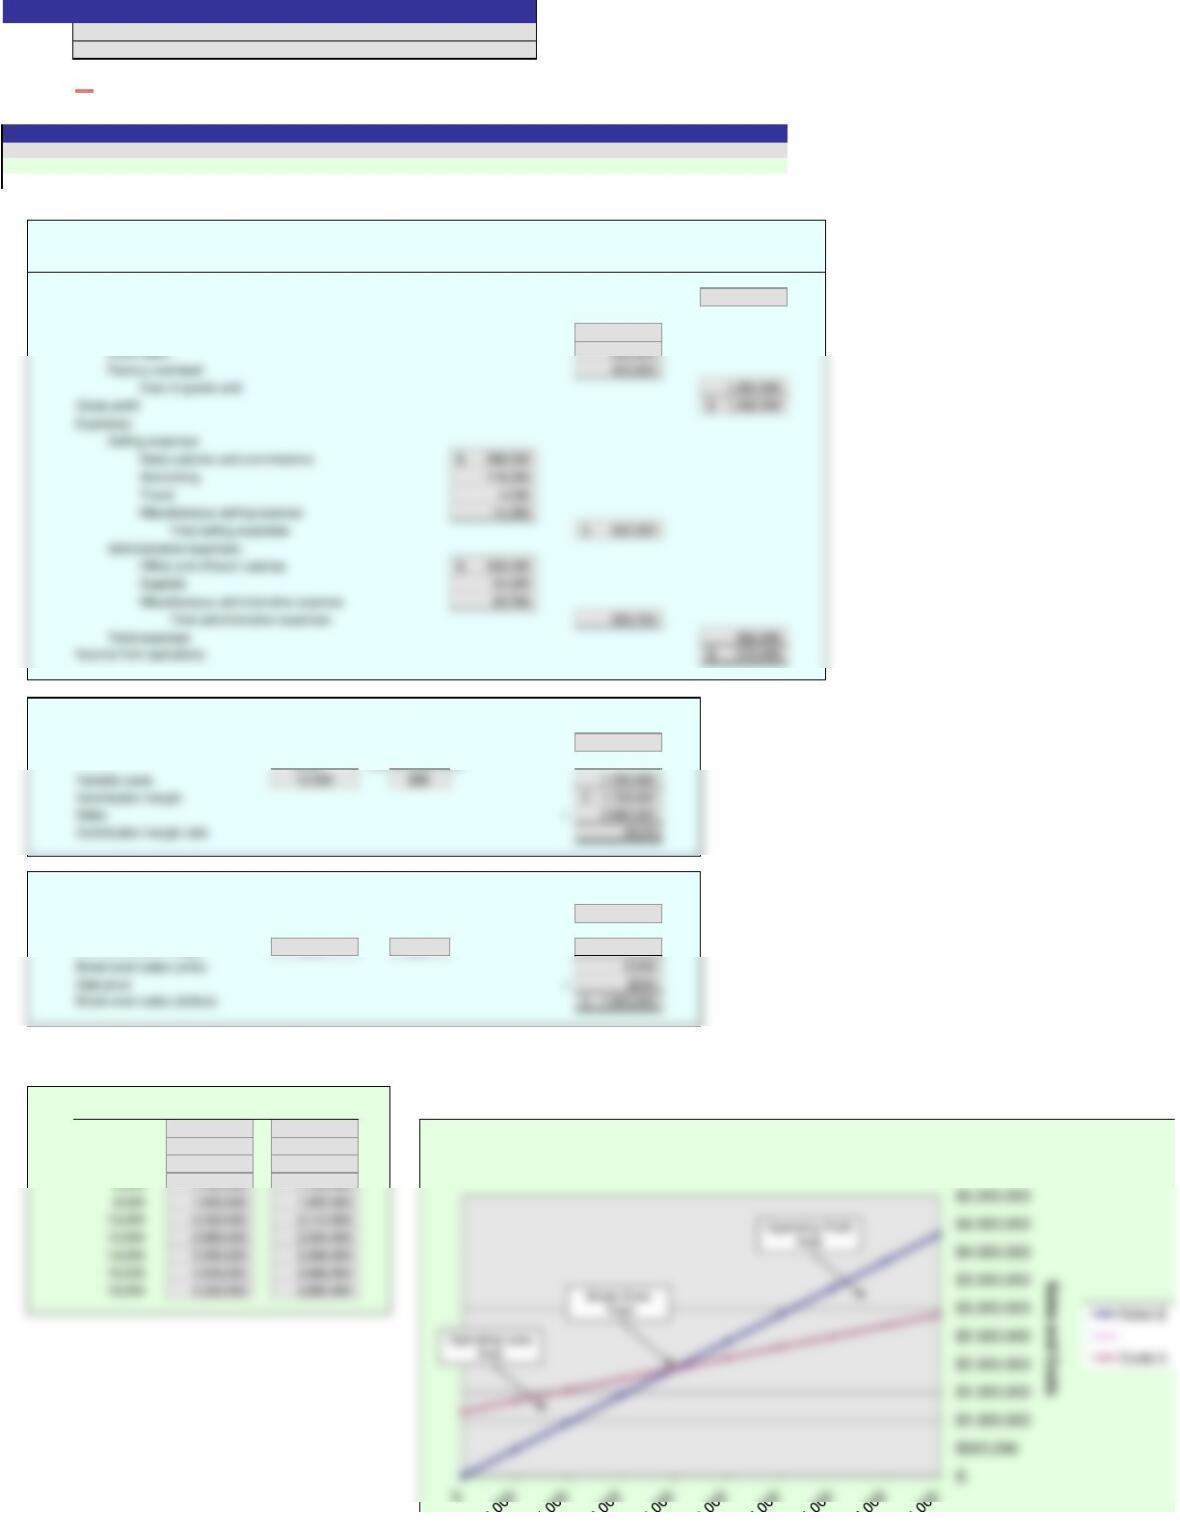
1.
Sales 3,500,000$
Cost of goods sold:
Direct materials 1,006,250$
Gross profit 981,250$
Expenses:
Selling expenses
Sales salaries and commissions
285,000$
Miscellaneous selling expense
Administrative expenses:
Office and officers’ salaries
132,000$
Miscellaneous administrative expense
2.
Contribution margin ratio:
Sales 3,500,000$
Variable costs 21,875 $120 2,625,000
3.
Break-even sales:
Fixed costs 525,000$
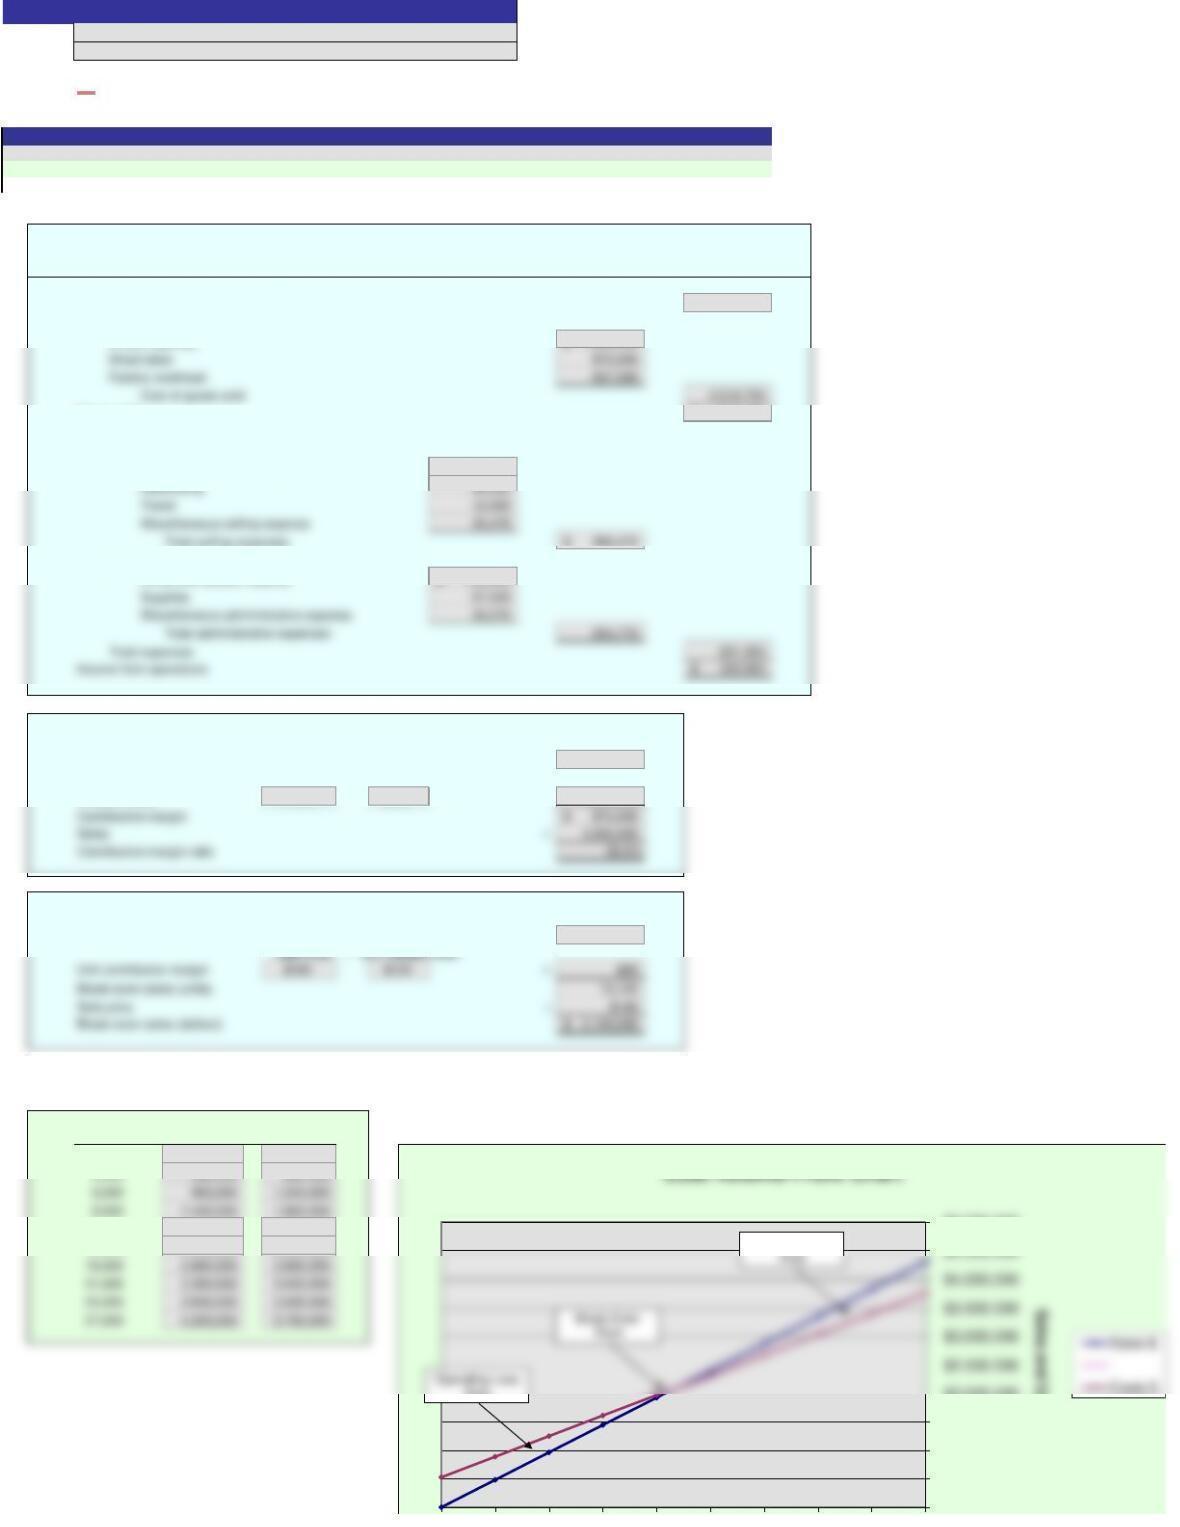
4. For each unit level of sales, enter the total sales dollars and total costs. The chart at right will be plotted as you enter the amounts.
After all points are plotted, grab and move the labels provided at the left to identify each area.
Units Sales $ Costs $
0 –$ 525,000$
12,000 1,920,000 1,965,000
15,000 2,400,000 2,325,000
Name:
Section:
WOLSEY INDUSTRIES INC.
Estimated Income Statement
For the Year Ended December 31, 2016
Cells with non-gray backgrounds are protected and cannot be edited.
Score:
Instructions
Answers are entered in the cells with gray backgrounds.
Units Unit Variable Cost
Problem 21-6A
Solution
ON
$-
$500,000
$1,000,000
$1,500,000
$2,000,000
$5,000,000
Area
Operating Profit
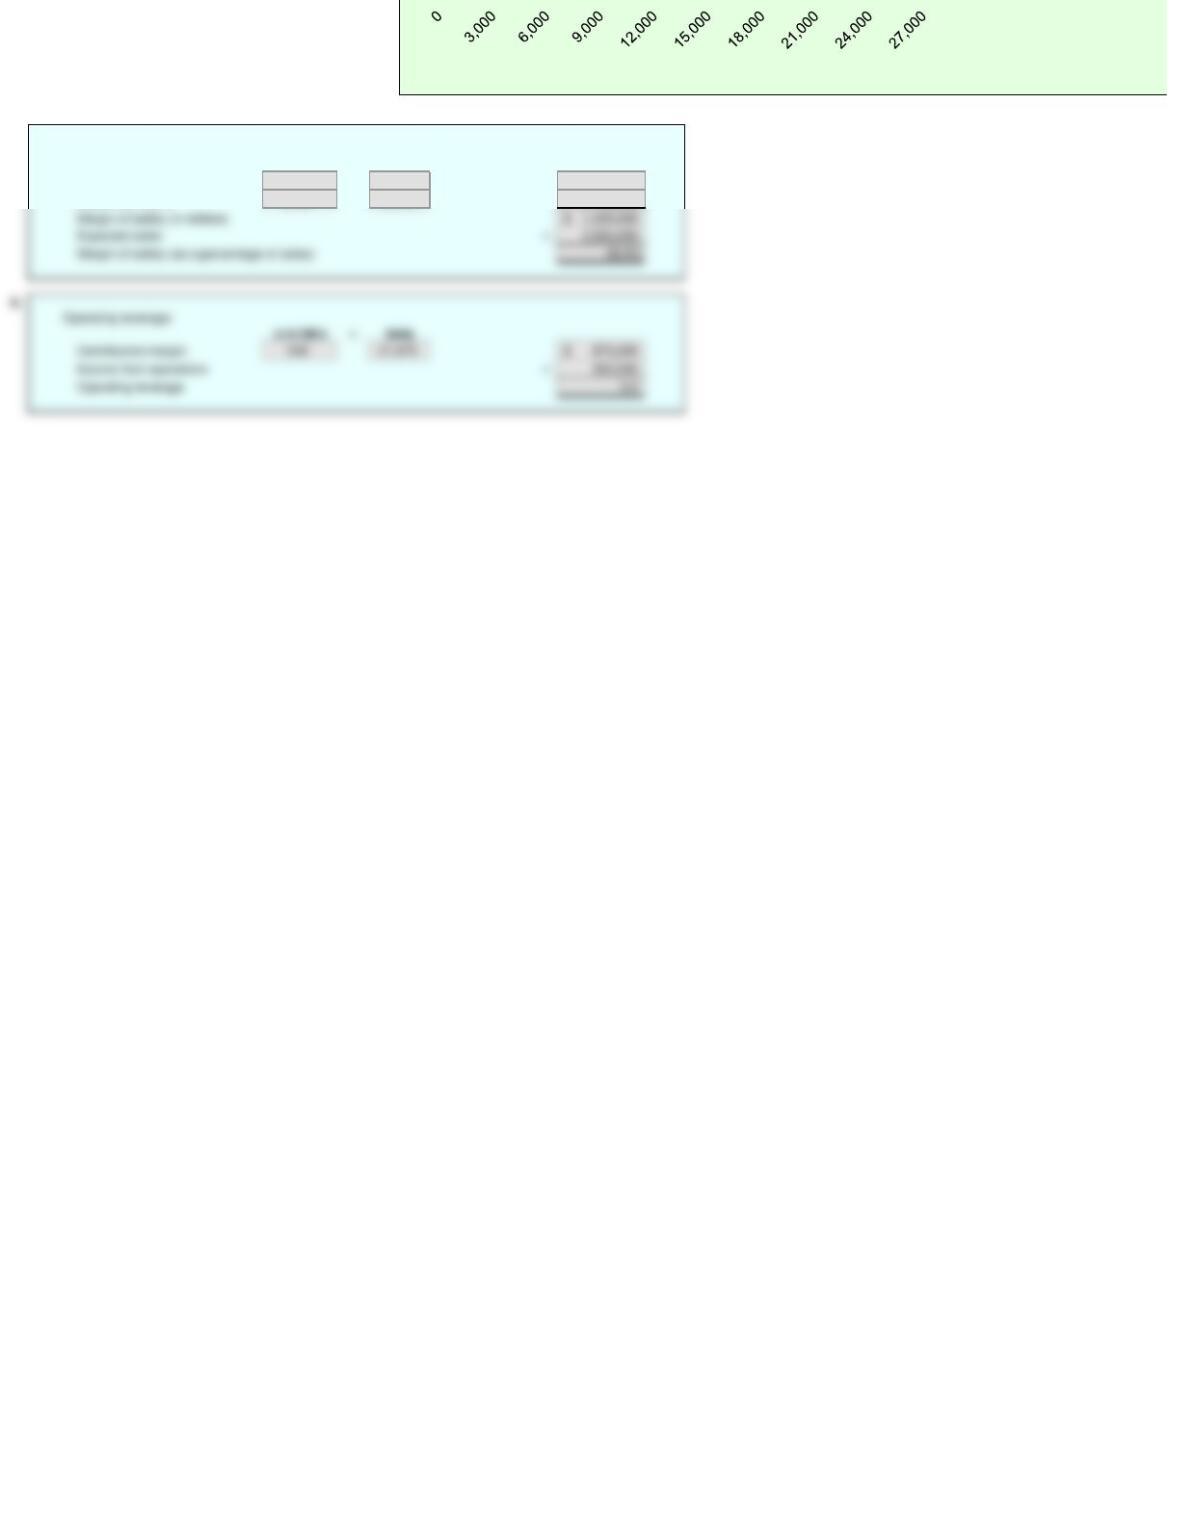
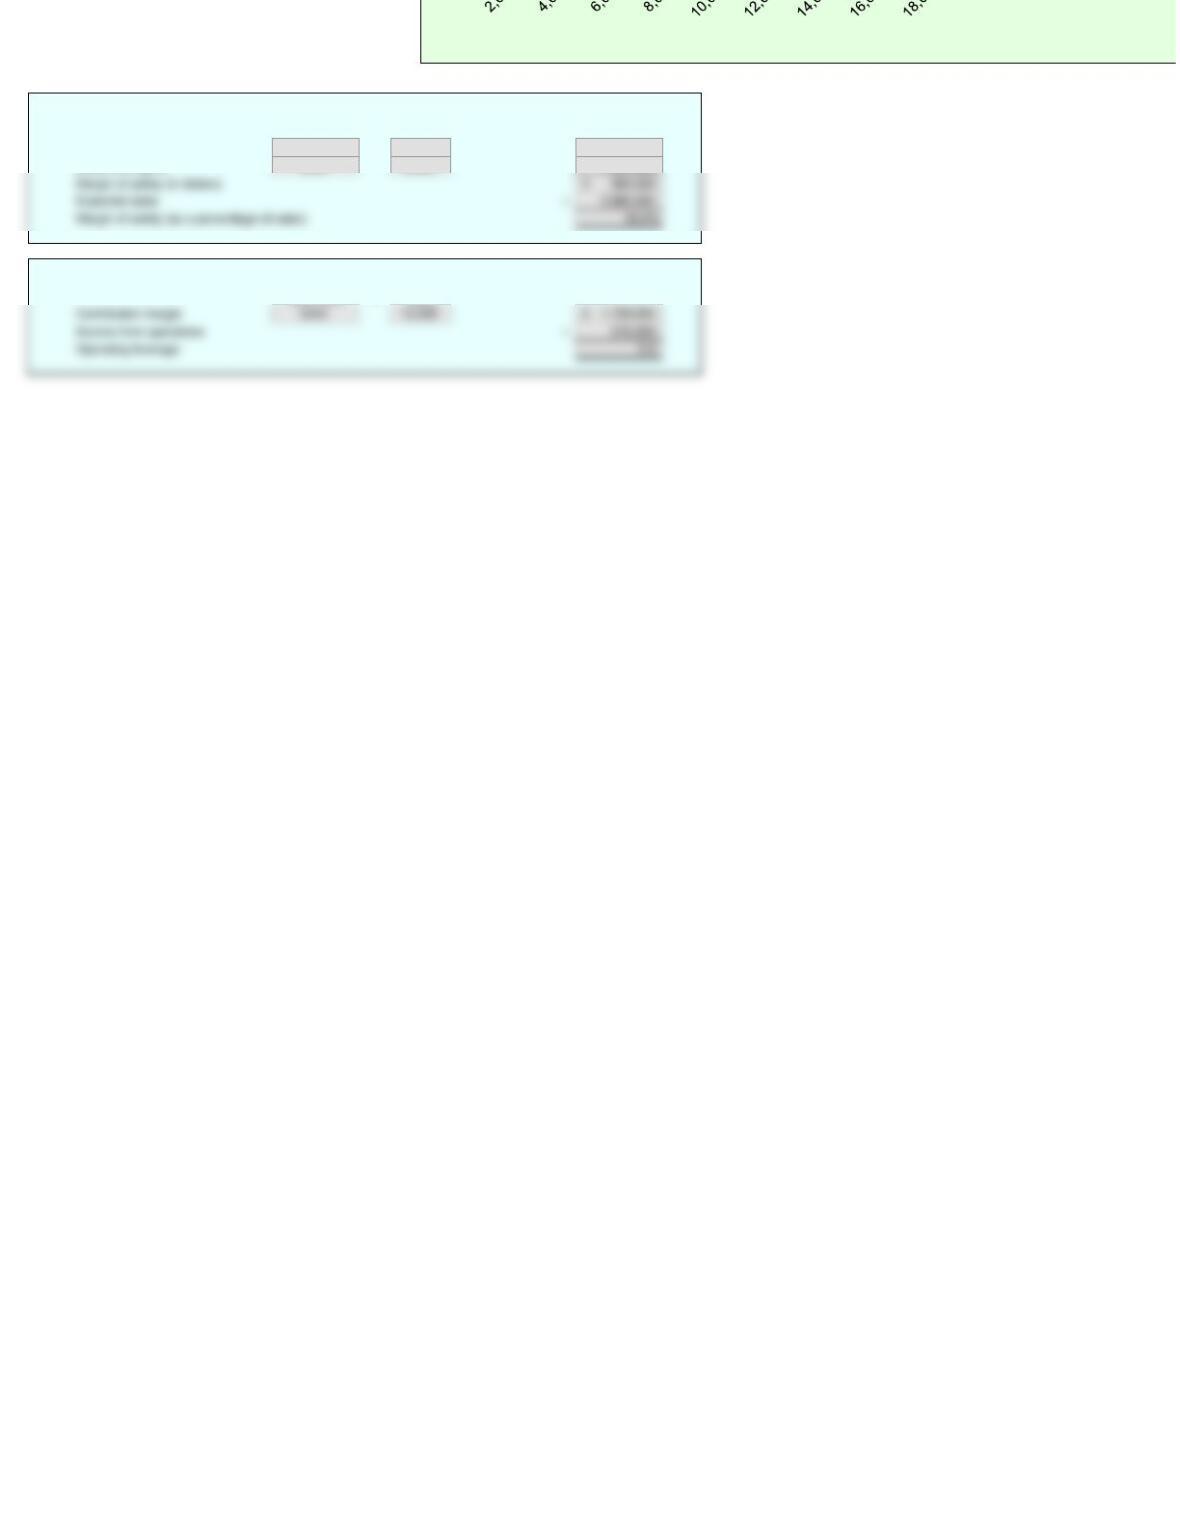
5.
Margin of safety:
Sale Price Units
Expected sales $160 21,875 3,500,000$
Break-even point $160 13,125 2,100,000
$-
Units
6.
An asterisk (*) will appear to the right of an incorrect entry.
1.
Sales
Cost of goods sold:
Direct materials
Direct labor
Factory overhead
Cost of goods sold
Gross profit
Expenses:
Selling expenses
Sales salaries and commissions
Advertising
Travel
Miscellaneous selling expense
Total selling expenses
Administrative expenses:
Office and officers’ salaries
Supplies
Miscellaneous administrative expense
Total administrative expenses
Total expenses
Income from operations
2.
Contribution margin ratio:
Sales
Variable costs
Contribution margin
Sales
Contribution margin ratio
3.
Break-even sales:
Fixed costs
Unit contribution margin
Break-even sales (units)
Sale price
Break-even sales (dollars)
4. For each unit level of sales, enter the total sales dollars and total costs. The chart at right will be plotted as you enter the amounts.
After all points are plotted, grab and move the labels provided at the left to identify each area.
Units Sales $ Costs $
0
2,000
4,000
6,000
8,000
10,000
12,000
14,000
16,000
18,000
Sale Price – Unit Variable Cost
BELMAIN CO.
Estimated Income Statement
For the Year Ended December 31, 2016
0%
Cells with non-gray backgrounds are protected and cannot be edited.
[Key code here]
Answers are entered in the cells with gray backgrounds.
Score:
Problem 21-6B
Name:
Section:
Units Unit Variable Cost
Key Code:
Instructions
$-
$0
$0
$1
$1
$1
$1
0 2,000 4,000 6,000 8,000 10,000 12,000 14,000 16,000 18,000
Sales and Costs
Units
Cost-Volume-Profit Chart
Sales $
Costs $
Break-Even
Point
Operating Profit Area
5.
Margin of safety:
Sale Price Units
Expected sales
Break-even point
Margin of safety (in dollars)
Expected sales
Margin of safety (as a percentage of sales)
6.
Operating leverage:
Unit CM $ Units
Contribution margin
Income from operations
Operating leverage
An asterisk (*) will appear to the right of an incorrect entry.
1.
Sales 2,880,000$
Cost of goods sold:
Direct materials 600,000$
2.
Contribution margin ratio:
Sales 2,880,000$
3.
Break-even sales:
Fixed costs 1,152,000$
Unit contribution margin $240 $96 $144
4. For each unit level of sales, enter the total sales dollars and total costs. The chart at right will be plotted as you enter the amounts.
After all points are plotted, grab and move the labels provided at the left to identify each area.
Units Sales $ Costs $
0 –$ 1,152,000$
2,000 480,000 1,344,000
4,000 960,000 1,536,000
Units Unit Variable Cost
Problem 21-6B
Solution
ON
Key Code:
Sale Price – Unit Variable Cost
Name:
Section:
BELMAIN CO.
Estimated Income Statement
For the Year Ended December 31, 2016
Cells with non-gray backgrounds are protected and cannot be edited.
Score:
Instructions
Answers are entered in the cells with gray backgrounds.
Cost-Volume-Profit Chart
Administrative expenses:
5.
Margin of safety:
Sale Price Units
Expected sales $240 12,000 2,880,000$
Break-even point $240 8,000 1,920,000
6.
Operating leverage:
Unit CM $ Units
Units