1. Total variable costs change in proportion to changes in the level of activity. Unit variable
2. a. Variable costs
b. Variable costs
3. Total fixed cost remains the same regardless of changes in the level of activity. Fixed cost per unit
4. Mixed costs are costs that have characteristics of both a variable and a fixed cost. The high-low
method uses the highest and lowest activity levels and their related costs to estimate the variable
5. a. No impact on the contribution margin.
6. A high contribution margin ratio, coupled with idle capacity, indicates a potential for increased
income from operations if additional sales can be made. A large percentage of each additional
8. Austin Company had lower fixed costs and a higher percentage of variable costs to sales than
9. The individual products are treated as components of one overall enterprise product. These
10. Operating leverage measures the relationship between a company’s contribution margin
and income from operations. The difference between contribution margin and income fro
m
operations is fixed costs. Thus, companies with high fixed costs will normally have a high
CHAPTER 21
COST BEHAVIOR AND COST-VOLUME-PROFIT ANALYSIS
DISCUSSION QUESTIONS
21-1
CHAPTER 21 Cost Behavior and Cost-Volume-Profit Analysis
PE 21–1A
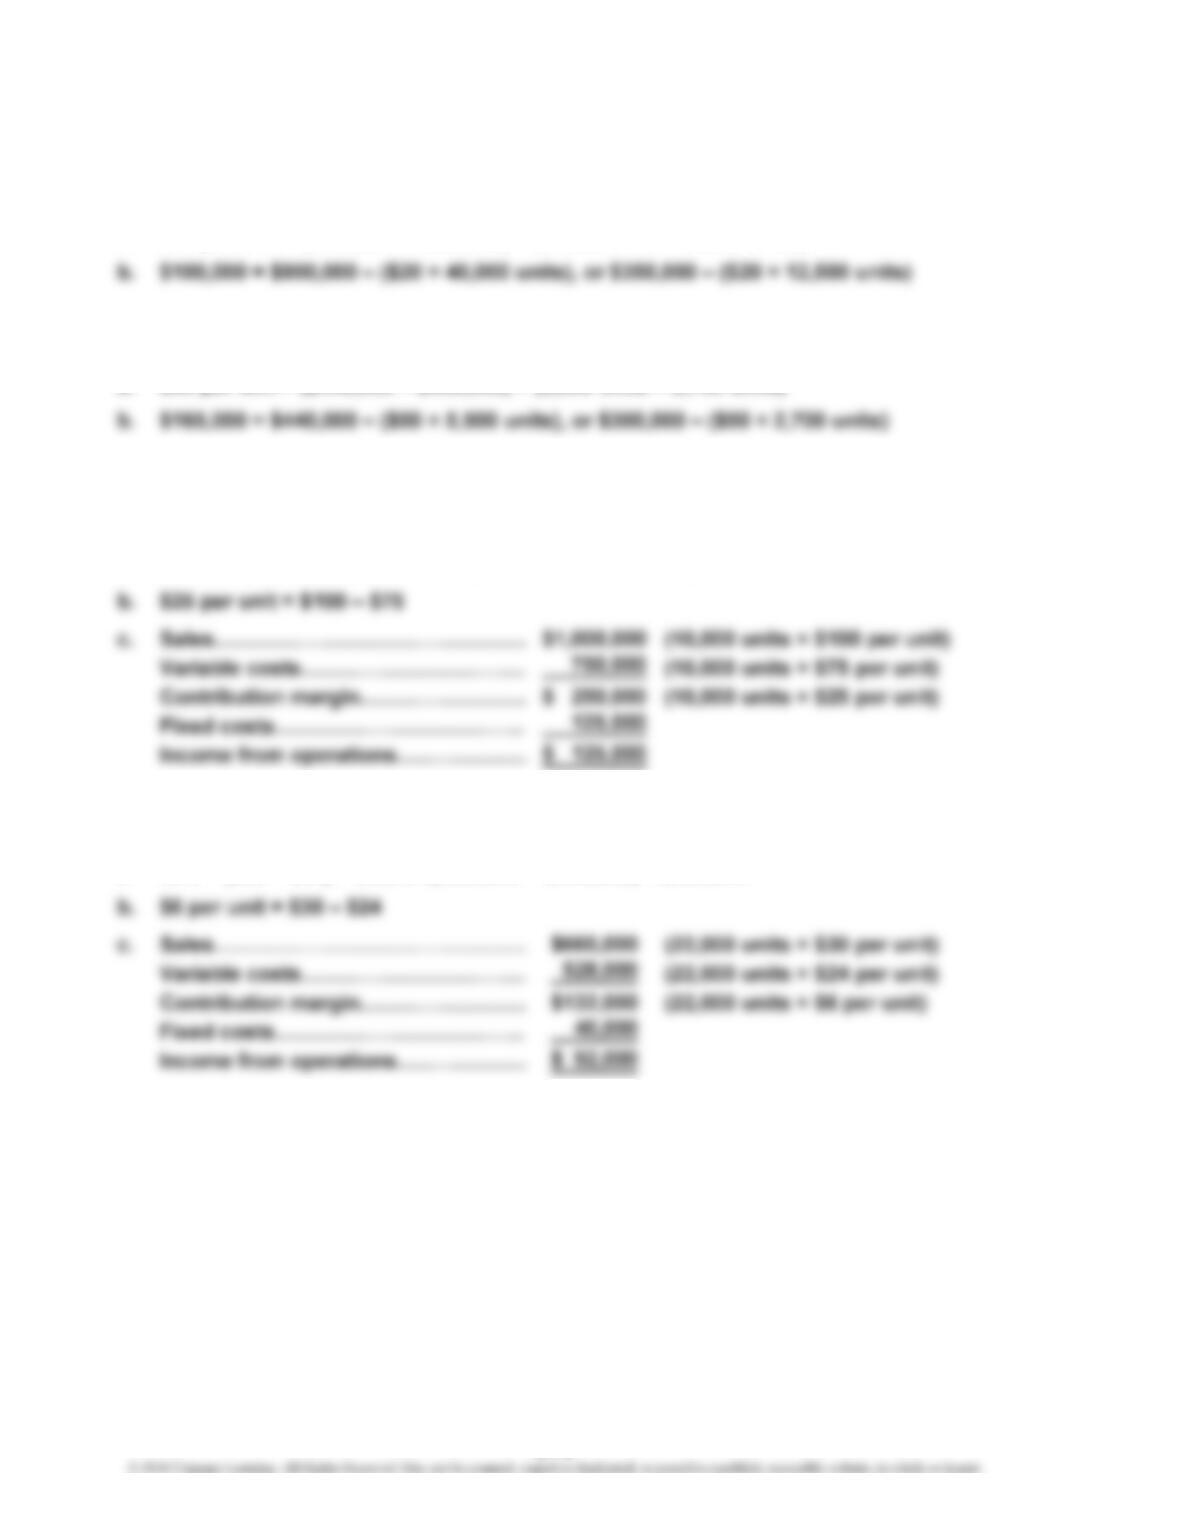
a. $20 per unit = ($900,000 – $350,000) ÷ (40,000 units – 12,500 units)
PE 21–1B
a. $50 per unit = ($440,000 – $300,000) ÷ (5,500 units – 2,700 units)
PE 21–2A
a. 25.0% = ($100 – $75) ÷ $100, or ($1,000,000 – $750,000) ÷ $1,000,000
PE 21–2B
a. 20% = ($30 – $24) ÷ $30, or ($660,000 – $528,000) ÷ $660,000
PRACTICE EXERCISES
21-2
CHAPTER 21 Cost Behavior and Cost-Volume-Profit Analysis
PE 21–3A
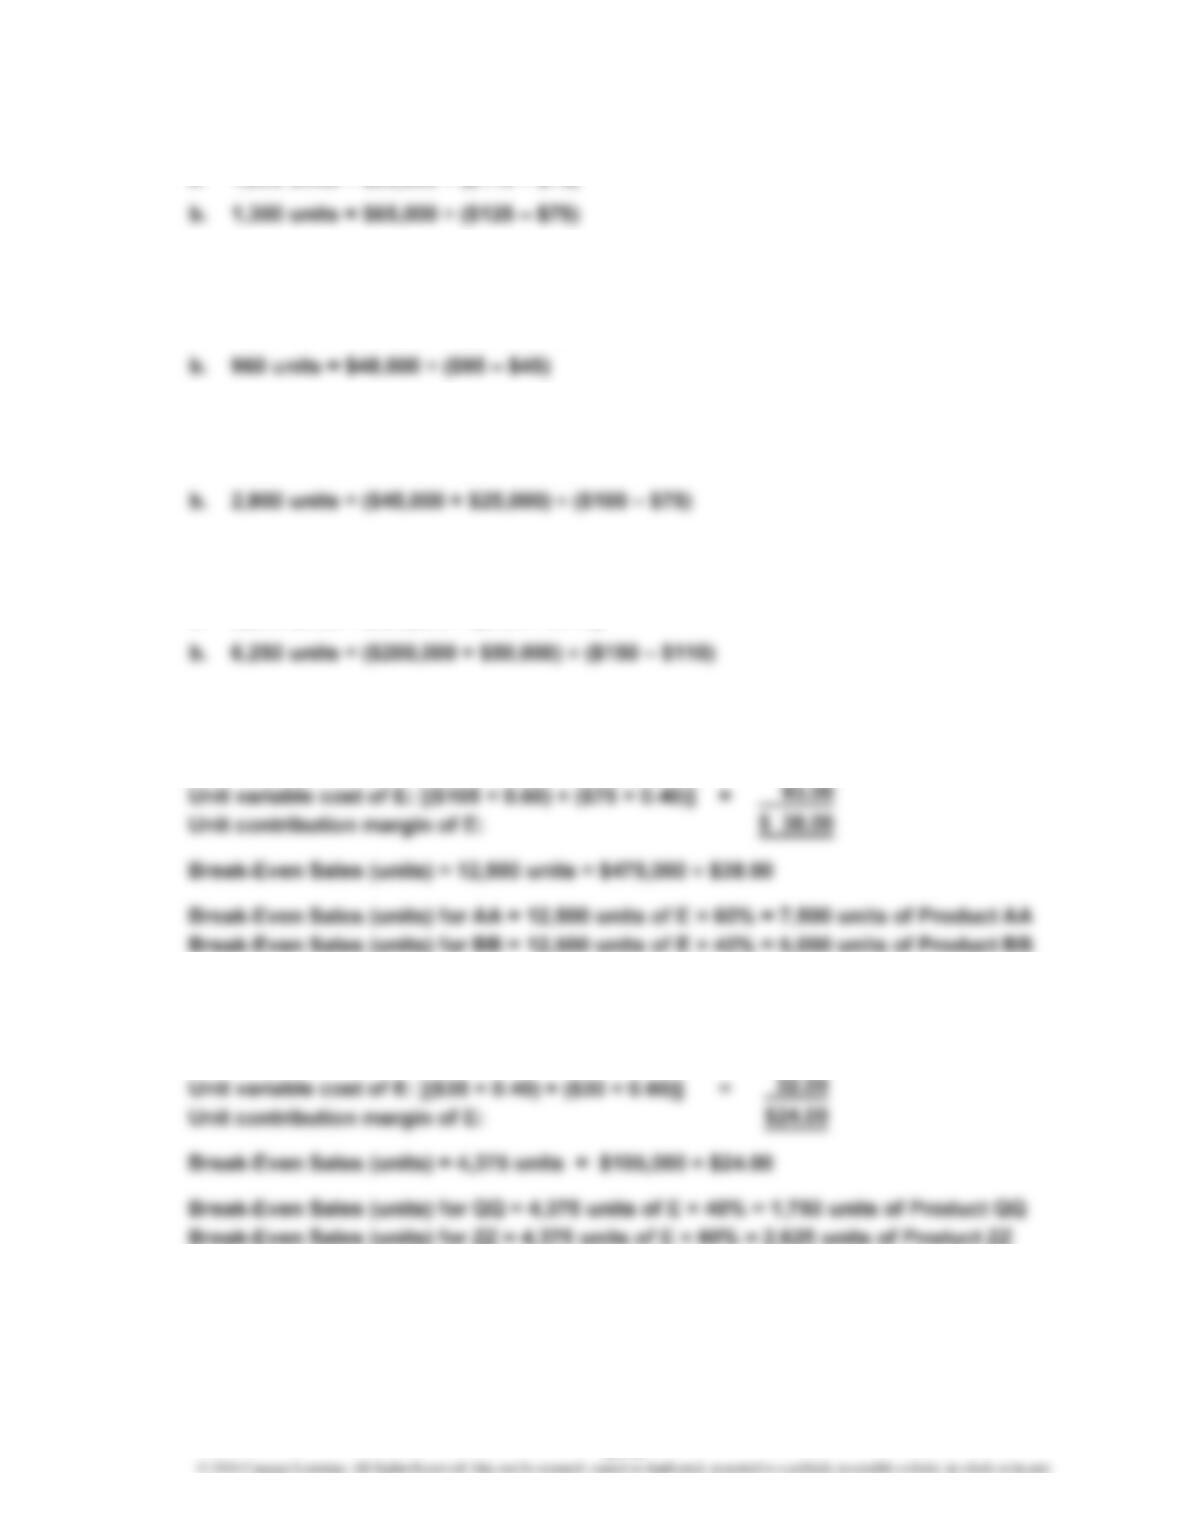
a. 1,625 units = $65,000 ÷ ($115 – $75)
PE 21–3B
a. 1,600 units = $48,000 ÷ ($75 – $45)
PE 21–4A
a. 1,800 units = $45,000 ÷ ($100 – $75)
PE 21–4B
a. 5,000 units = $200,000 ÷ ($150 – $110)
PE 21–5A
Unit selling price of E: [($145 × 0.60) + ($110 × 0.40)] = $131.00
PE 21–5B
Unit selling price of E: [($50 × 0.40) + ($60 × 0.60)] = $56.00
21-3
PE 21–6A
PE 21–6B
PE 21–7A
PE 21–7B
21-4
CHAPTER 21 Cost Behavior and Cost-Volume-Profit Analysis
Ex. 21–1
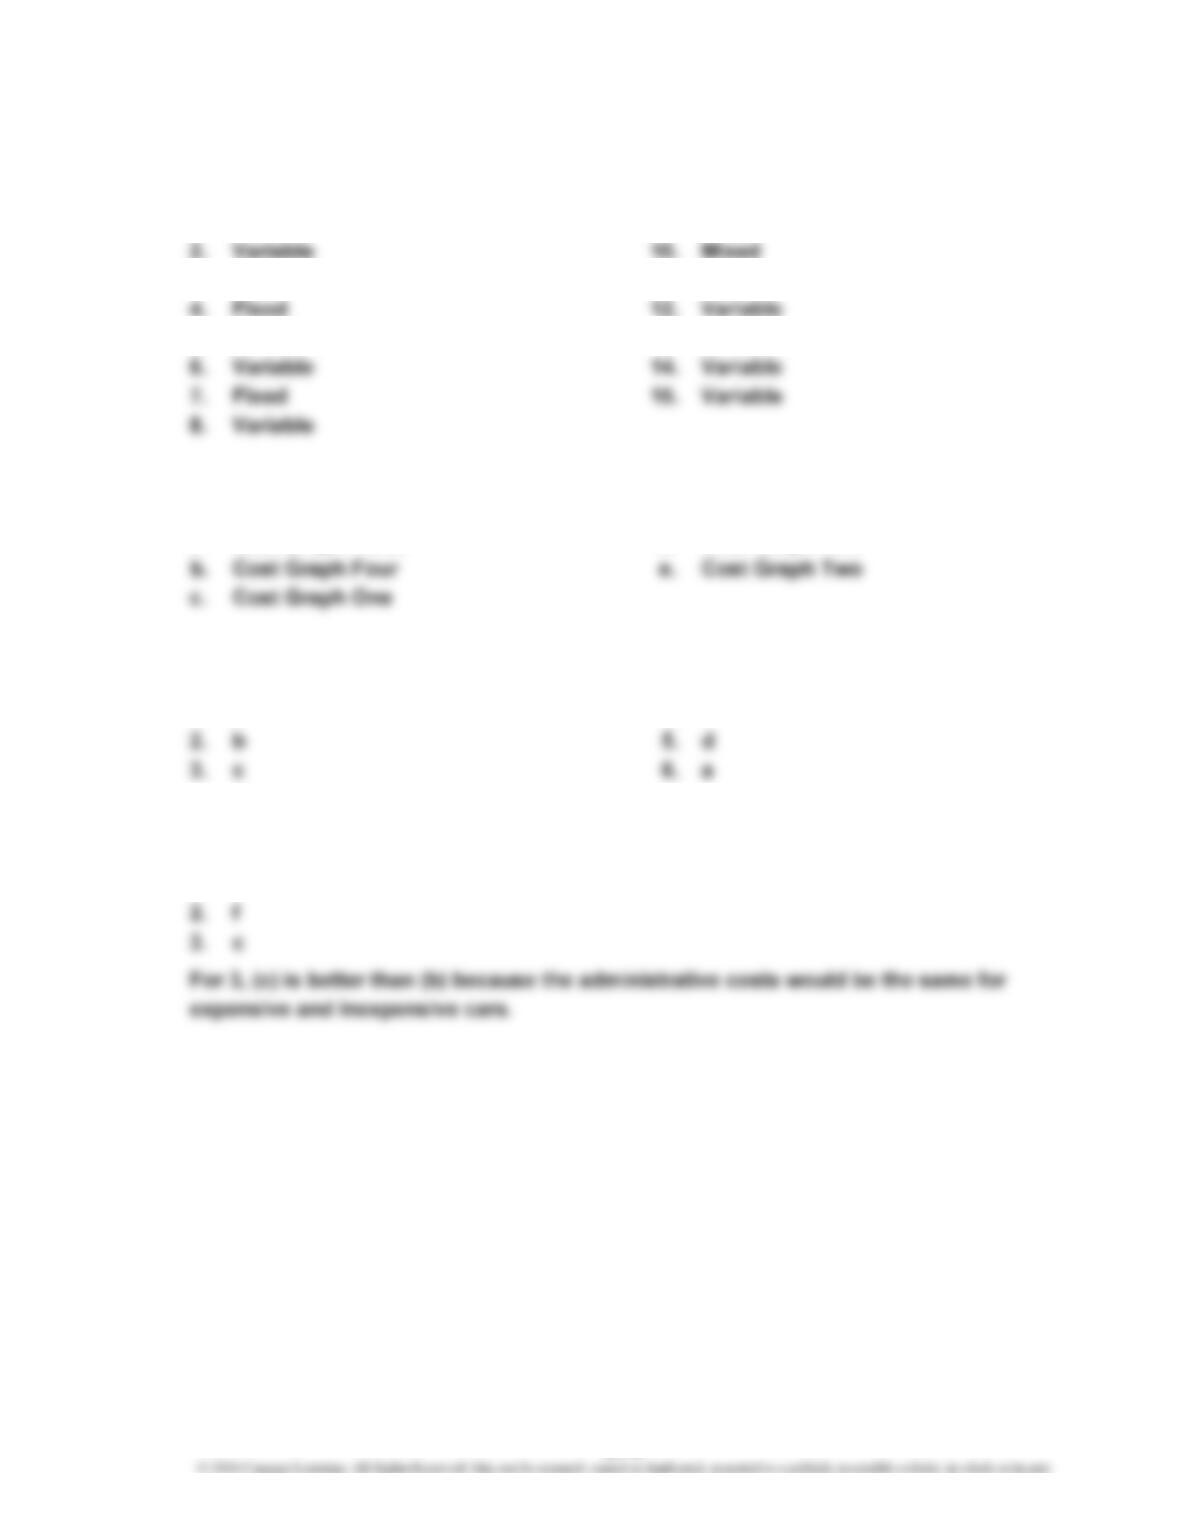
1. Variable 9. Mixed
3. Fixed 11. Fixed
5. Variable 13. Variable
Ex. 21–2
a. Cost Graph Three d. Cost Graph Two
Ex. 21–3
1. e 4. f
Ex. 21–4
1. e
EXERCISES
21-5
CHAPTER 21 Cost Behavior and Cost-Volume-Profit Analysis
Ex. 21–5
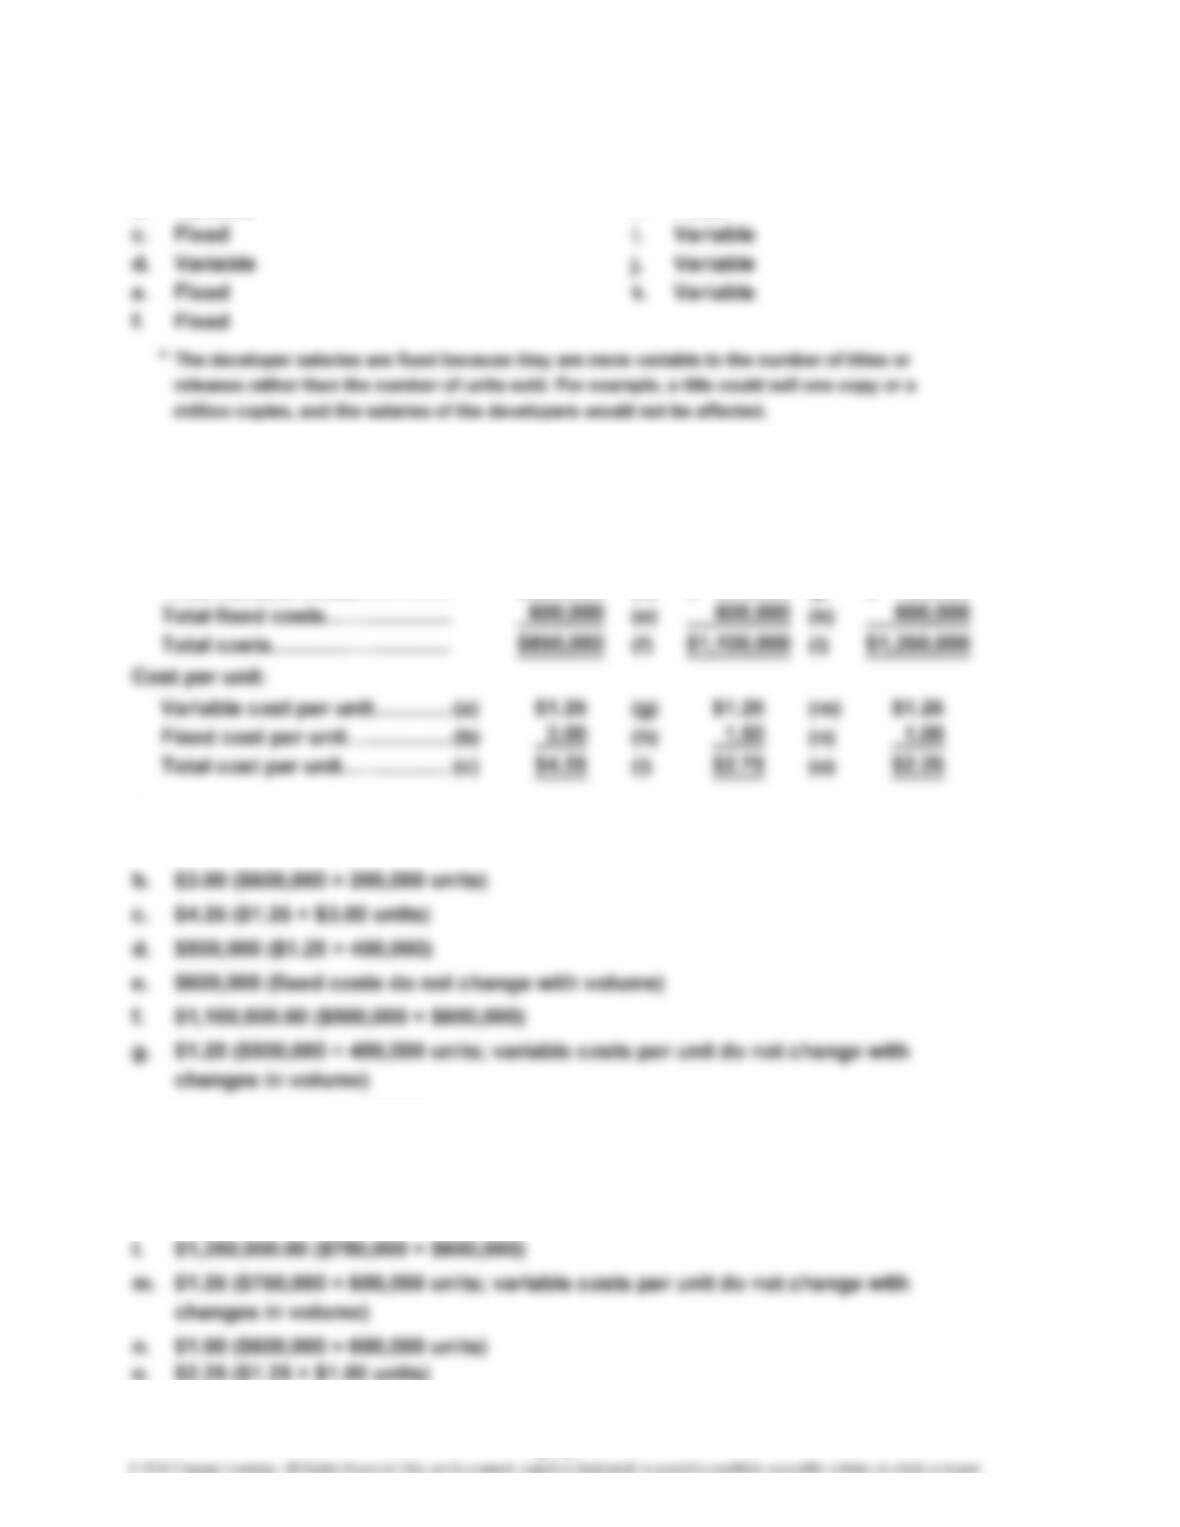
a. Variable g. Fixed*
b. Variable h. Fixed
Ex. 21–6
Components produced…………
…
200,000 400,000 600,000
Total costs:
Total variable costs…………
…
$250,000 (d) $ 500,000 (j) $ 750,000
Supporting calculations:
a. $1.25 ($250,000 ÷ 200,000 units)
h. $1.50 ($600,000 ÷ 400,000 units)
i.
j. $750,000 ($1.25 × 600,000 units)
k. $600,000 (fixed costs do not change with volume)
o.
$2.75 ($1.25 + $1.50 units)
21-6
CHAPTER 21 Cost Behavior and Cost-Volume-Profit Analysis
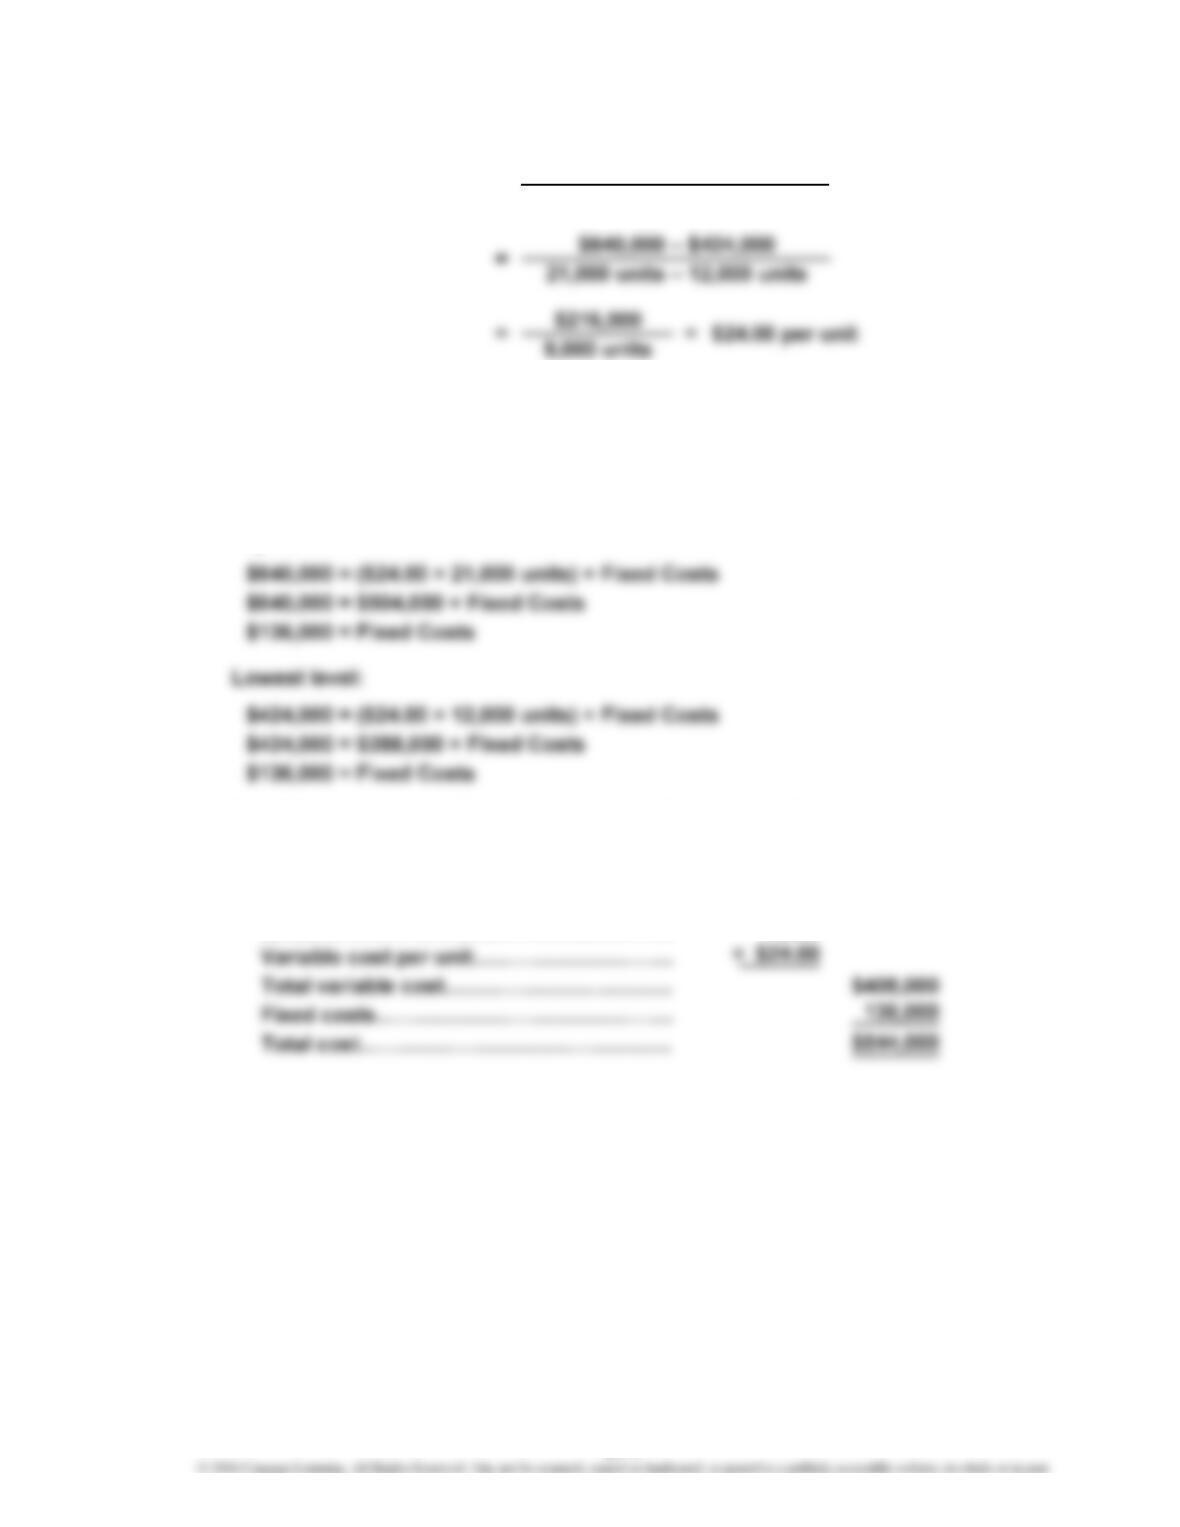
Ex. 21–7
The fixed cost can be determined by subtracting the estimated total variable
cost from the total cost at either the highest or lowest level of production, as
follows:
Total Cost = (Variable Cost per Unit × Units Produced) + Fixed Costs
Highest level:
b. Total Cost = (Variable Cost per Unit × Units Produced) + Fixed Costs
Total cost for 12,000 units:
Variable cost:
Units……………………………………………
…
17,000
…
=Variable Cost per Unita.
Difference in Total Costs
Difference in Units Produced
21-7
CHAPTER 21 Cost Behavior and Cost-Volume-Profit Analysis
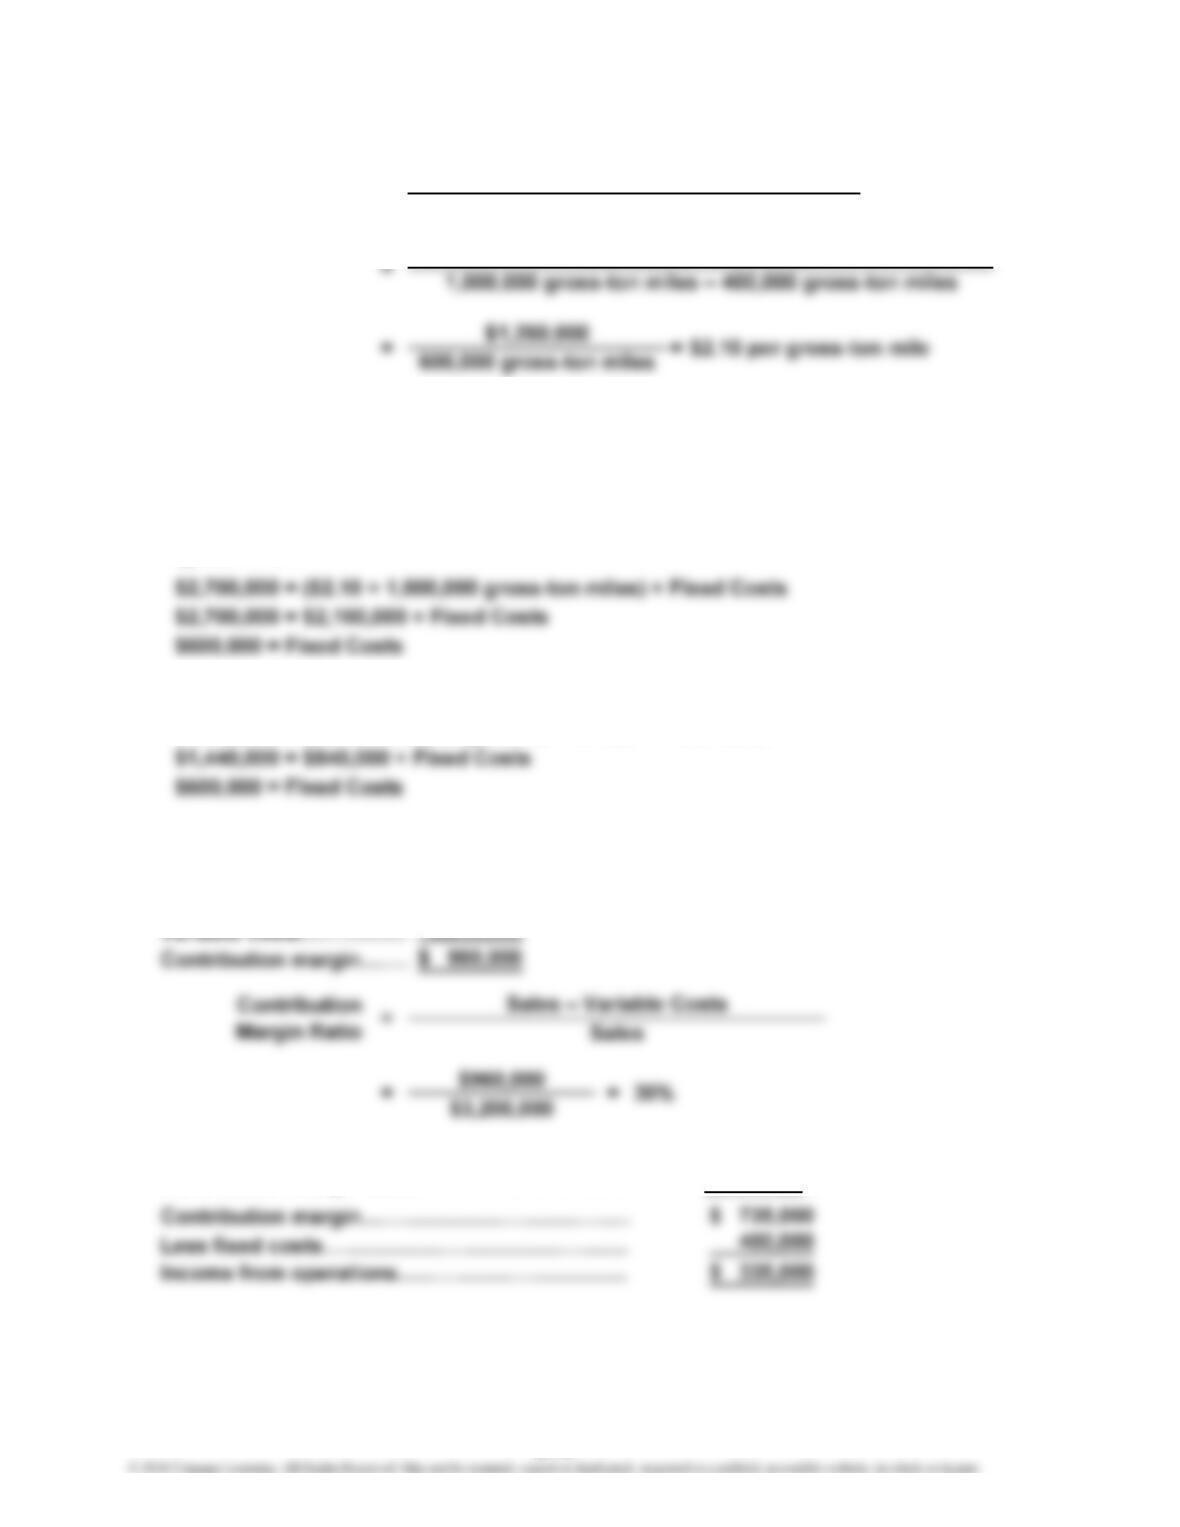
Ex. 21–8
The fixed costs can be determined by subtracting the estimated total variable
cost from the total cost at either the highest or lowest level of gross-ton mile,
as follows:
Total Cost = (Variable Cost per Gross-Ton Mile × Gross-Ton Miles) + Fixed Costs
Highest level:
Lowest level:
$1,440,000 = ($2.10 × 400,000 gross-ton miles) + Fixed Costs
Ex. 21–9
a. Sales………………………
…
$3,200,000
…
b. Sales…………………………………………………
…
Contribution margin ratio………………………………
…
…
Difference in Gross-Ton Miles
Difference in Total Costs
$2,700,000 – $1,440,000
=
Variable Cost per
Gross-Ton Mile
$2,100,000
35%
×
21-8
CHAPTER 21 Cost Behavior and Cost-Volume-Profit Analysis
Ex. 21–10
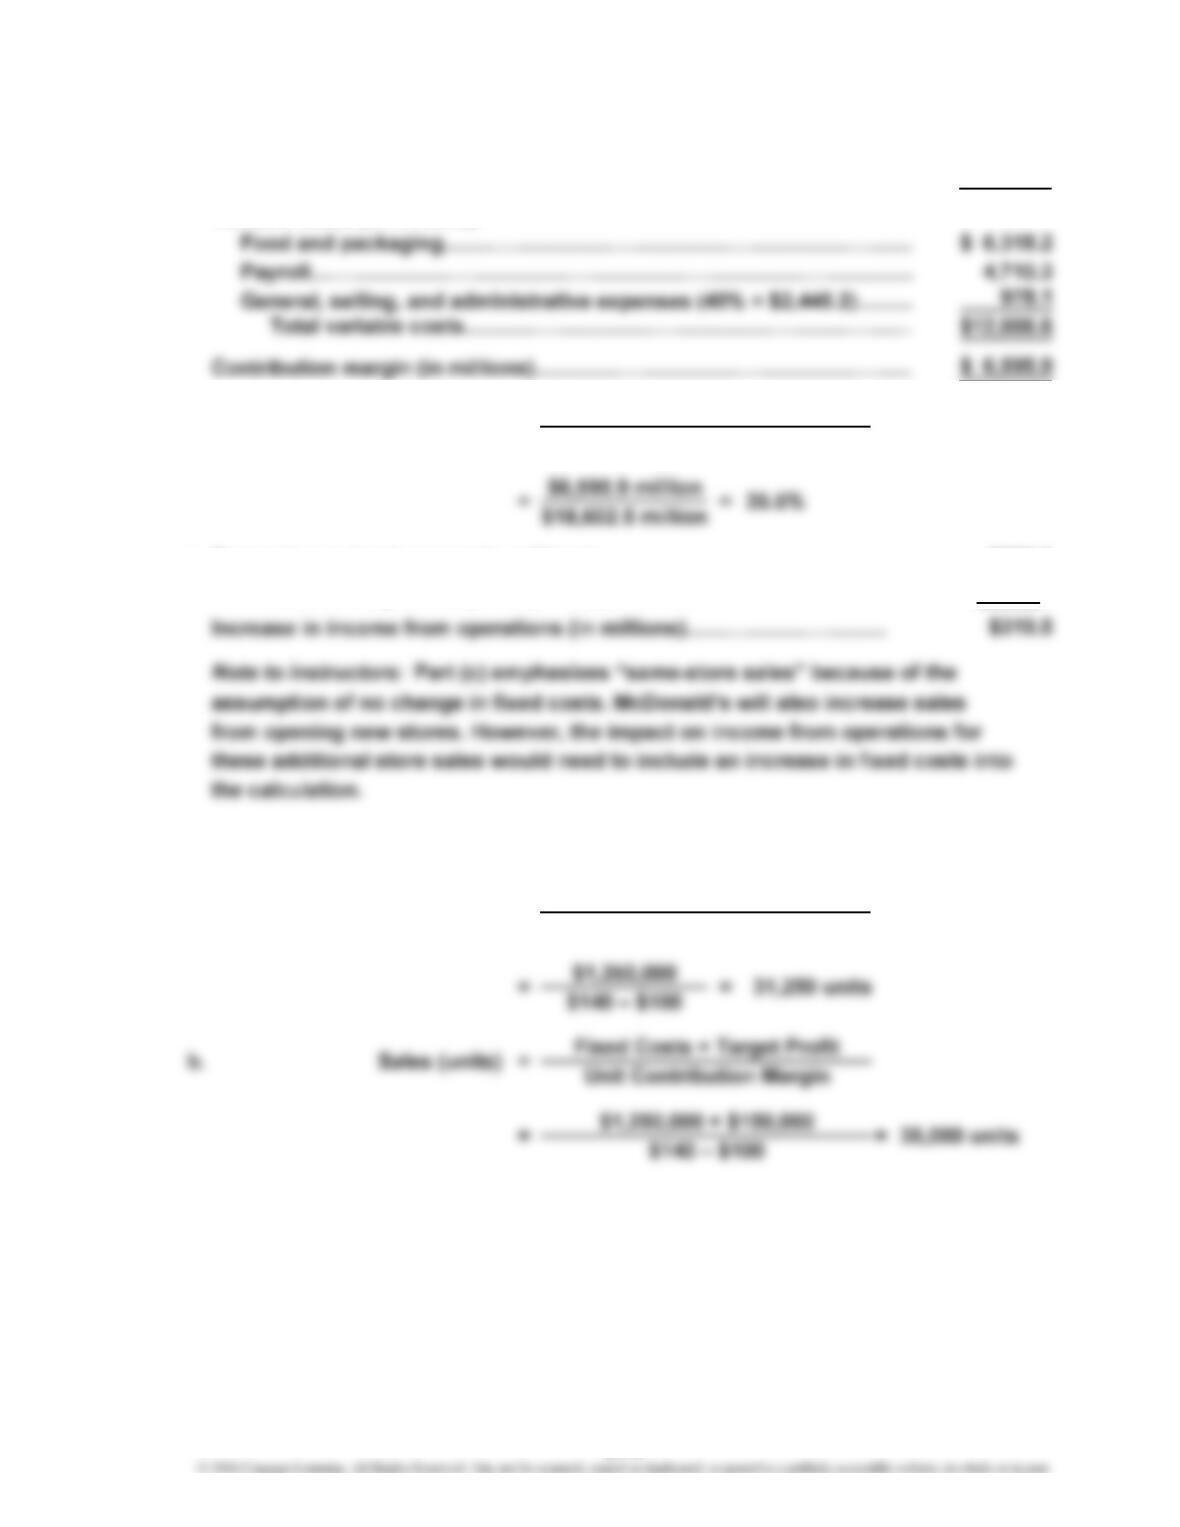
a. Sales (in millions)…………………………………………………………………
…
$18,602.5
Variable costs (in millions):
c. Same-store sales increase (in millions)……………………………………
Contribution margin ratio [from part (b)]…………………………………
…
Ex. 21–11
Sales – Variable Costs
Sales
b. =Contribution Margin Ratio
$900.0
35.5%
a. Break-Even Sales (units) = Fixed Costs
Unit Contribution Margin
×
21-9
…
CHAPTER 21 Cost Behavior and Cost-Volume-Profit Analysis
Ex. 21–12
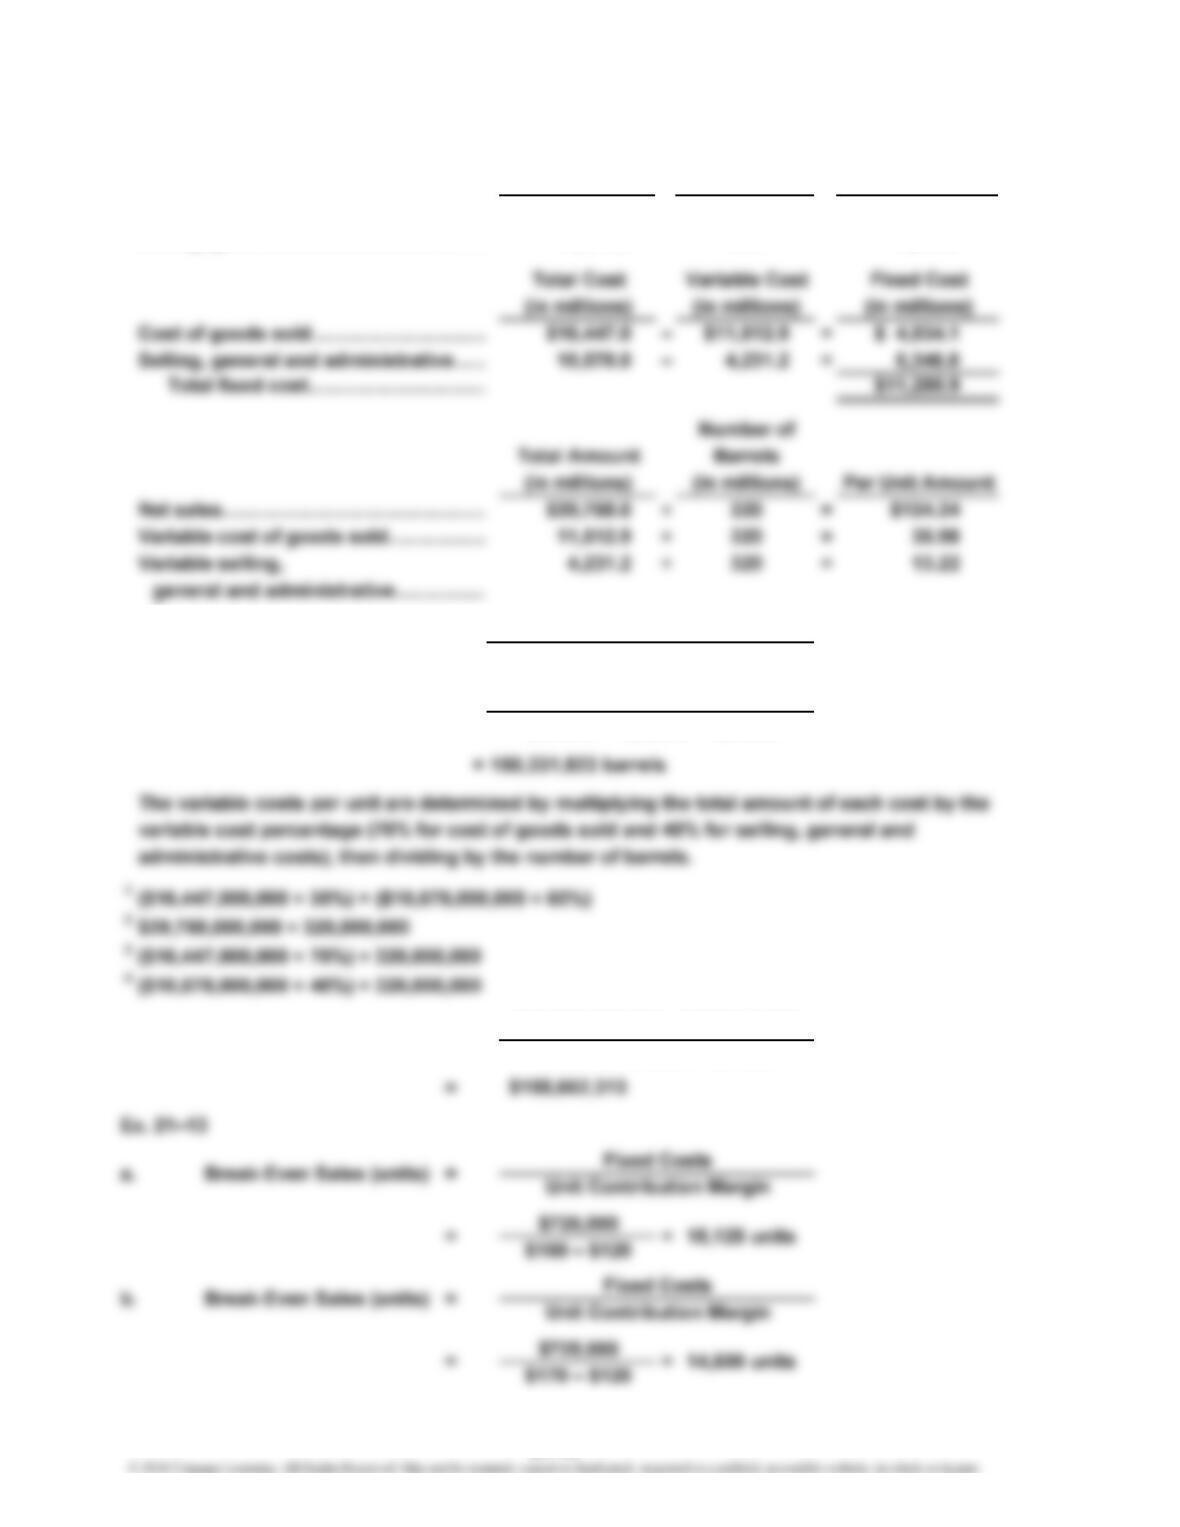
Total Cost Variable Cost Variable Cost
(in millions) Percentage (in millions)
Cost of goods sold………………………
…
$16,447.0 × 70% = $11,512.9
Selling, general and administrative…
…
10,578.0 × 40% = 4,231.2
.
.
$11,280,900,000
$124.24 – $35.98 – $13.22
Break-Even Sales (units) =
a
.
Break-Even Sales (units) = Fixed Costs
Unit Contribution Margin
$11,280,900,000 + $400,000,000
$124.24 – $35.98 – $13.22
b
.
=
1
342
21-10
…
…
…
CHAPTER 21 Cost Behavior and Cost-Volume-Profit Analysis
Ex. 21–14
Ex. 21–15
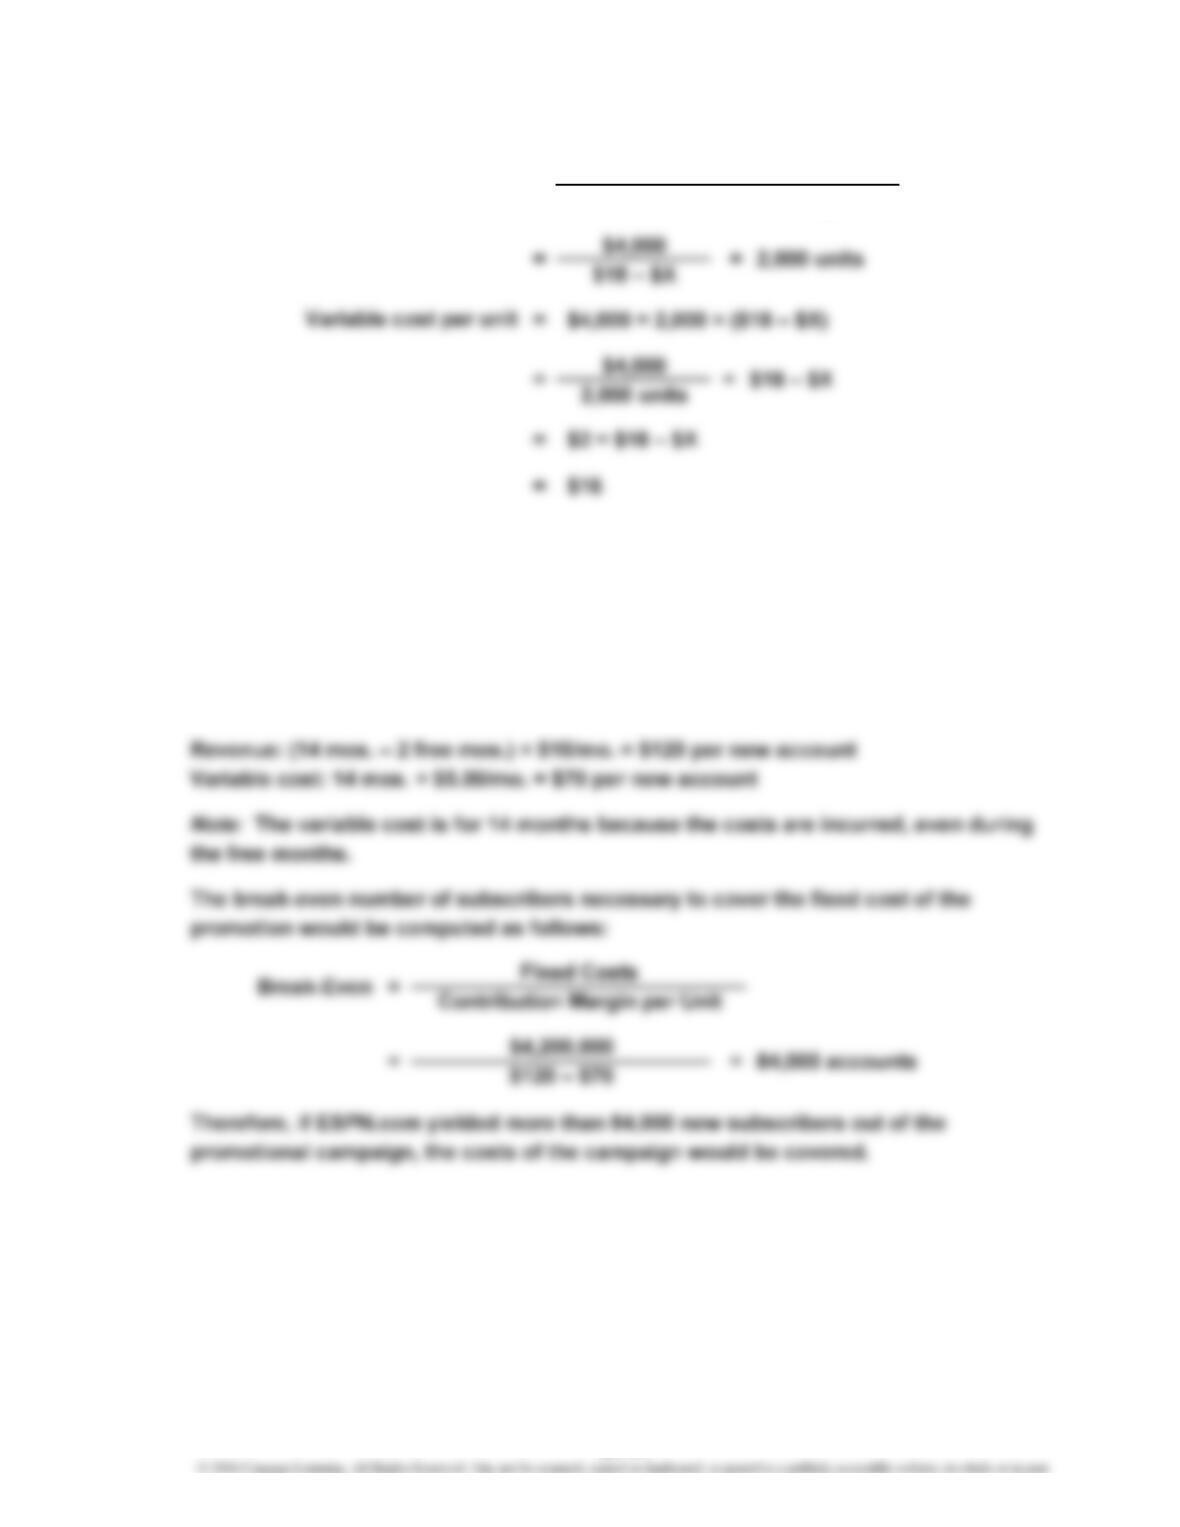
The cost of the promotional campaign is the fixed cost in this analysis because
we’re trying to determine the break-even adoption rate of the campaign.
The contribution margin earned per new subscriber is essentially the revenue
earned less the variable cost over the 14-month subscription period.
Unit Contribution Margin
=Break-Even Sales (units)
Fixed Costs
21-11
CHAPTER 21 Cost Behavior and Cost-Volume-Profit Analysis
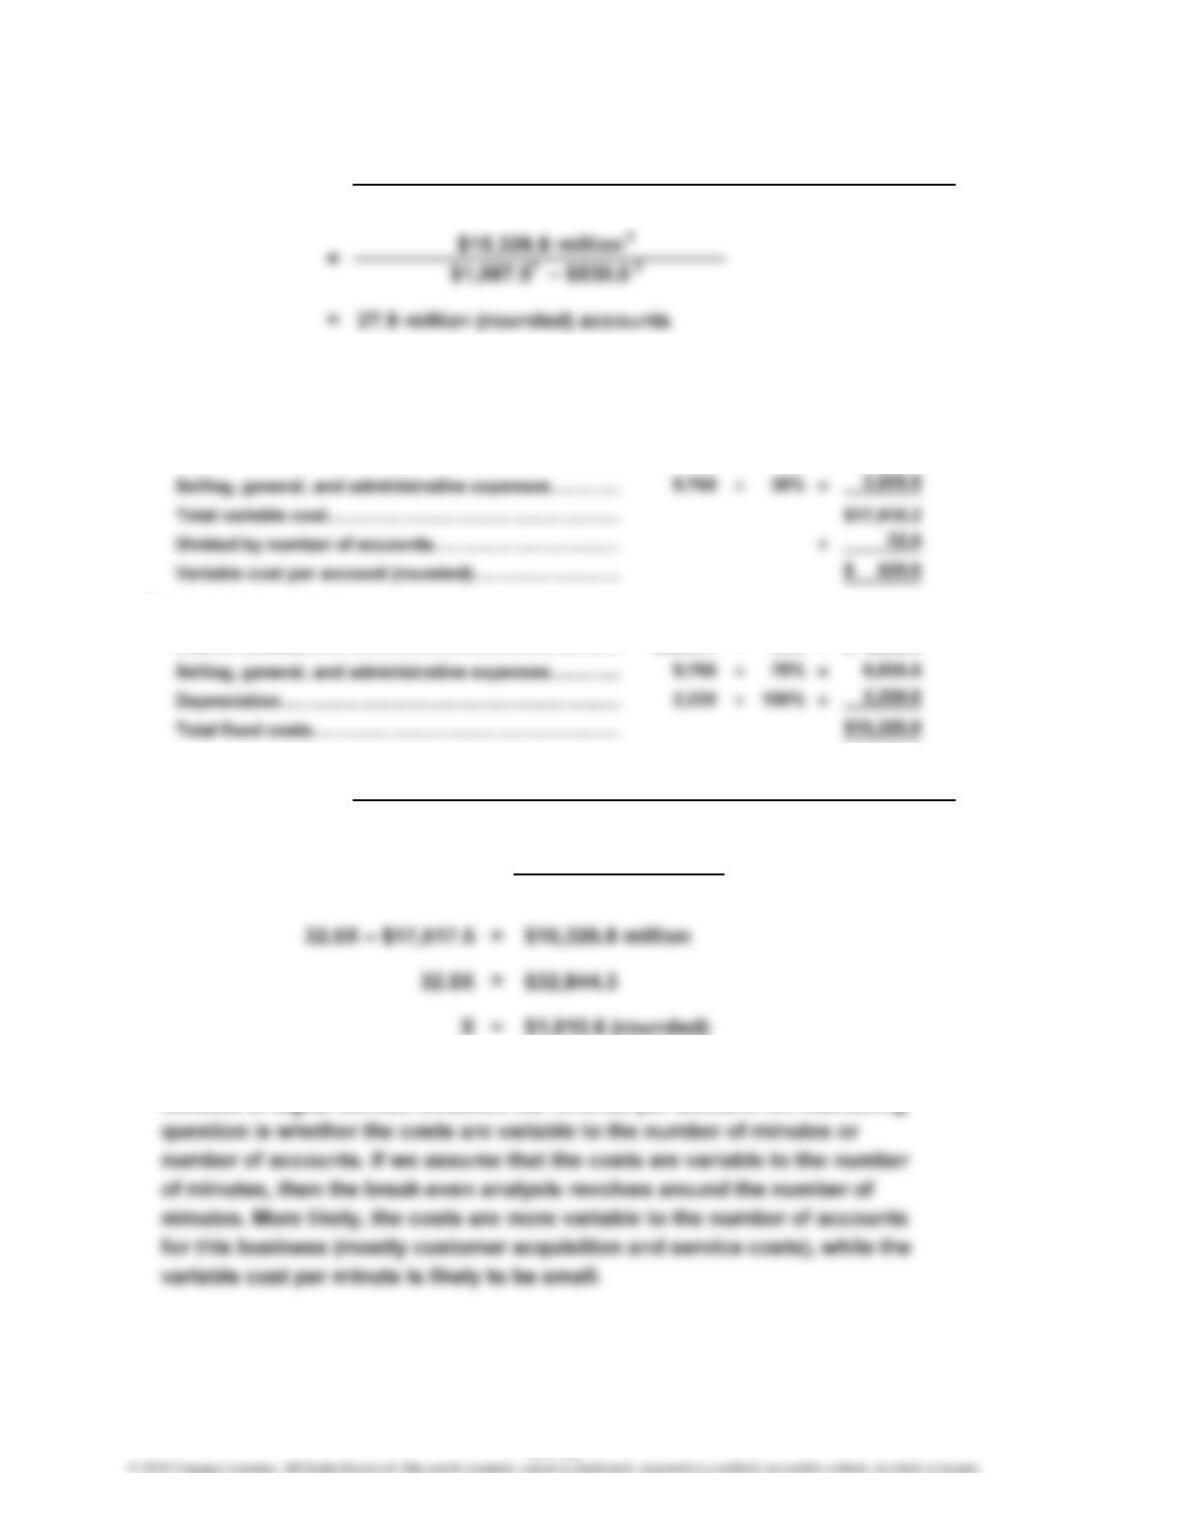
Ex. 21–16
1
Revenue per account (in millions):
$35,345 million ÷ 32.5 million = $1,087.5 (rounded)
2
Variable cost per account (in millions, except variable cost per account):
Cost of revenue………………………………………………
…
$20,841 × 70% = $14,588.7
3
Fixed costs (in millions):
Cost of revenue………………………………………………
…
$20,841 × 30% = $ 6,252.3
Note to Instructors: The rate charged per minute and the number of average
minutes of digital service influence the revenue per account. An interesting
=
$15,326.8 million
X – $539.0
Revenue per Account – Variable Cost per Account
Fixed Cost
Revenue per Account – Variable Cost per Account
=32.5 million accounts
b. Break-Even =
Fixed Costs
a.
Break-Even
21-12
CHAPTER 21 Cost Behavior and Cost-Volume-Profit Analysis
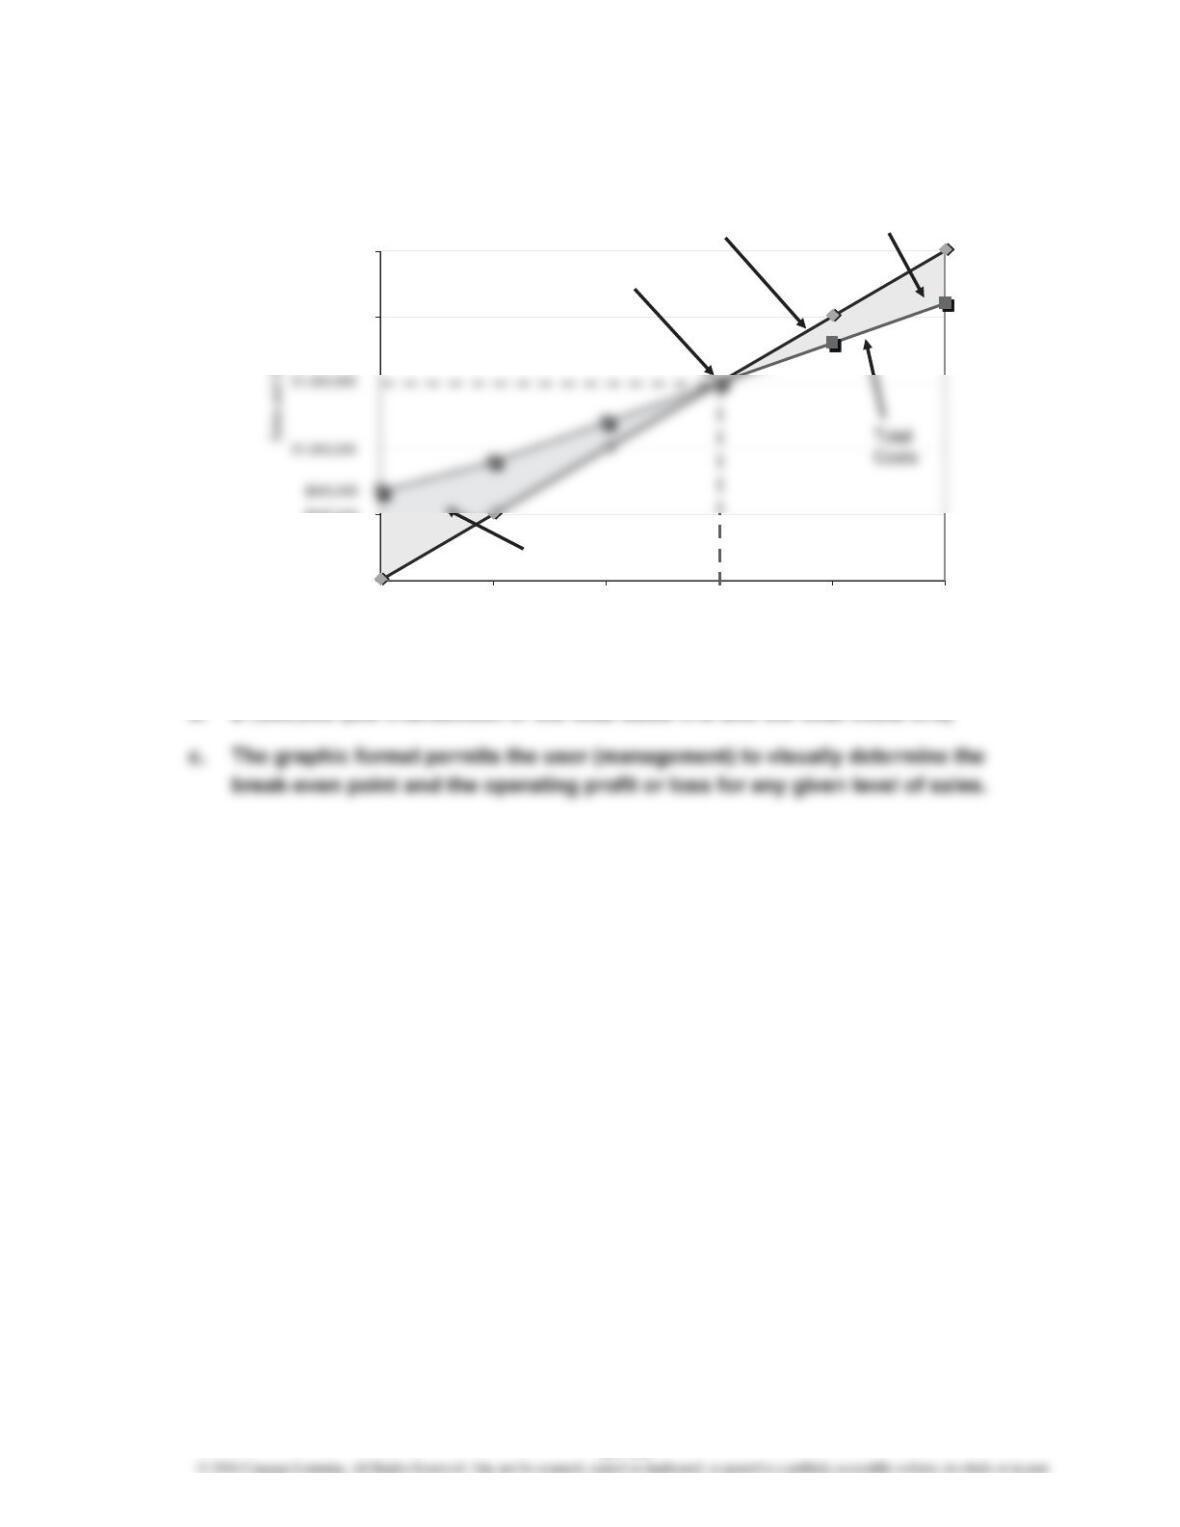
Ex. 21–17
a.
b. $1,500,000 (the intersection of the total sales line and the total costs line)
$0
$500,000
$2,000,000
$2,500,000
0 4,000 8,000 12,000 16,000 20,000
Units of Sales
Break-
Even Point
Operating
Profit Area Total Sales Line
Operating
Loss Area
21-13
CHAPTER 21 Cost Behavior and Cost-Volume-Profit Analysis
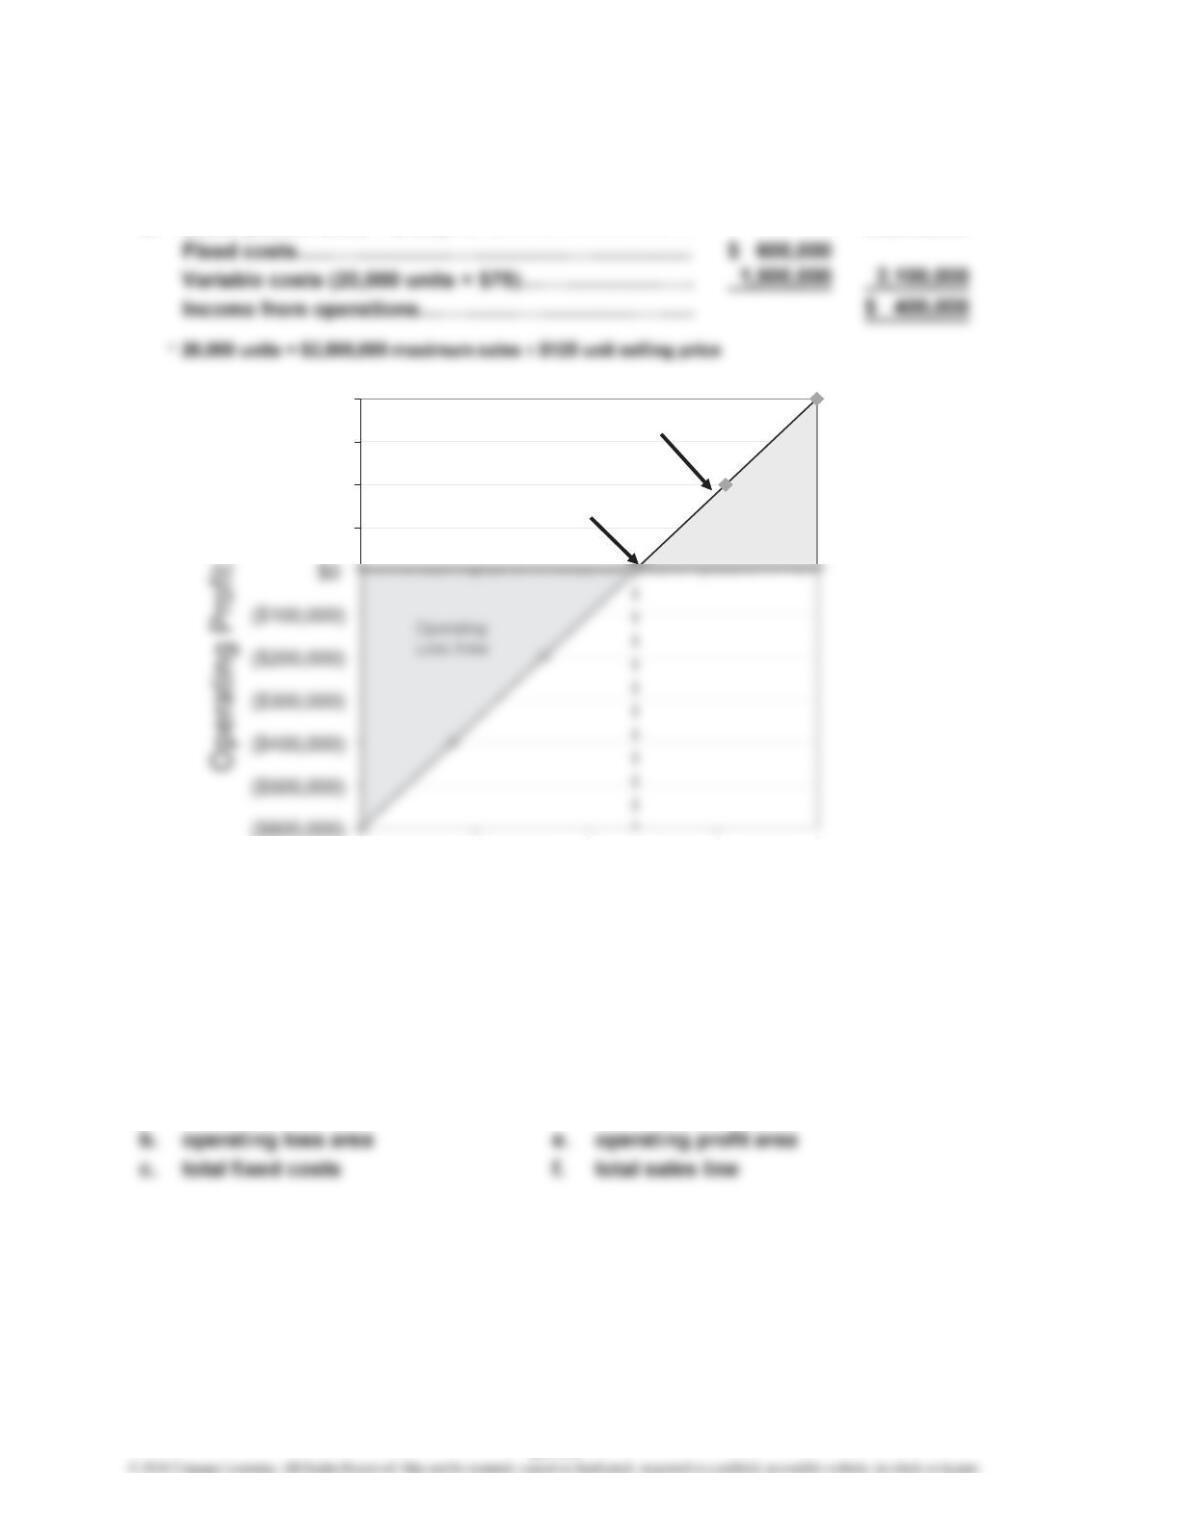
Ex. 21–18
a. $600,000 (total fixed costs)
b. Sales (20,000 units × $125)……………………………… $2,500,000
c.
d. 12,000 units (the intersection of the profit line and the horizontal axis)
Ex. 21–19
Cost-volume-profit chart
a. break-even point d. total costs line
*
$100,000
$200,000
$300,000
$400,000
0 5,000 10,000 15,000 20,000
Units of Sales
Break-Even
Point
Operating
Profit Area
Profit Line
12,000
21-14
CHAPTER 21 Cost Behavior and Cost-Volume-Profit Analysis
Ex. 21–20
Profit-volume chart
a. break-even point
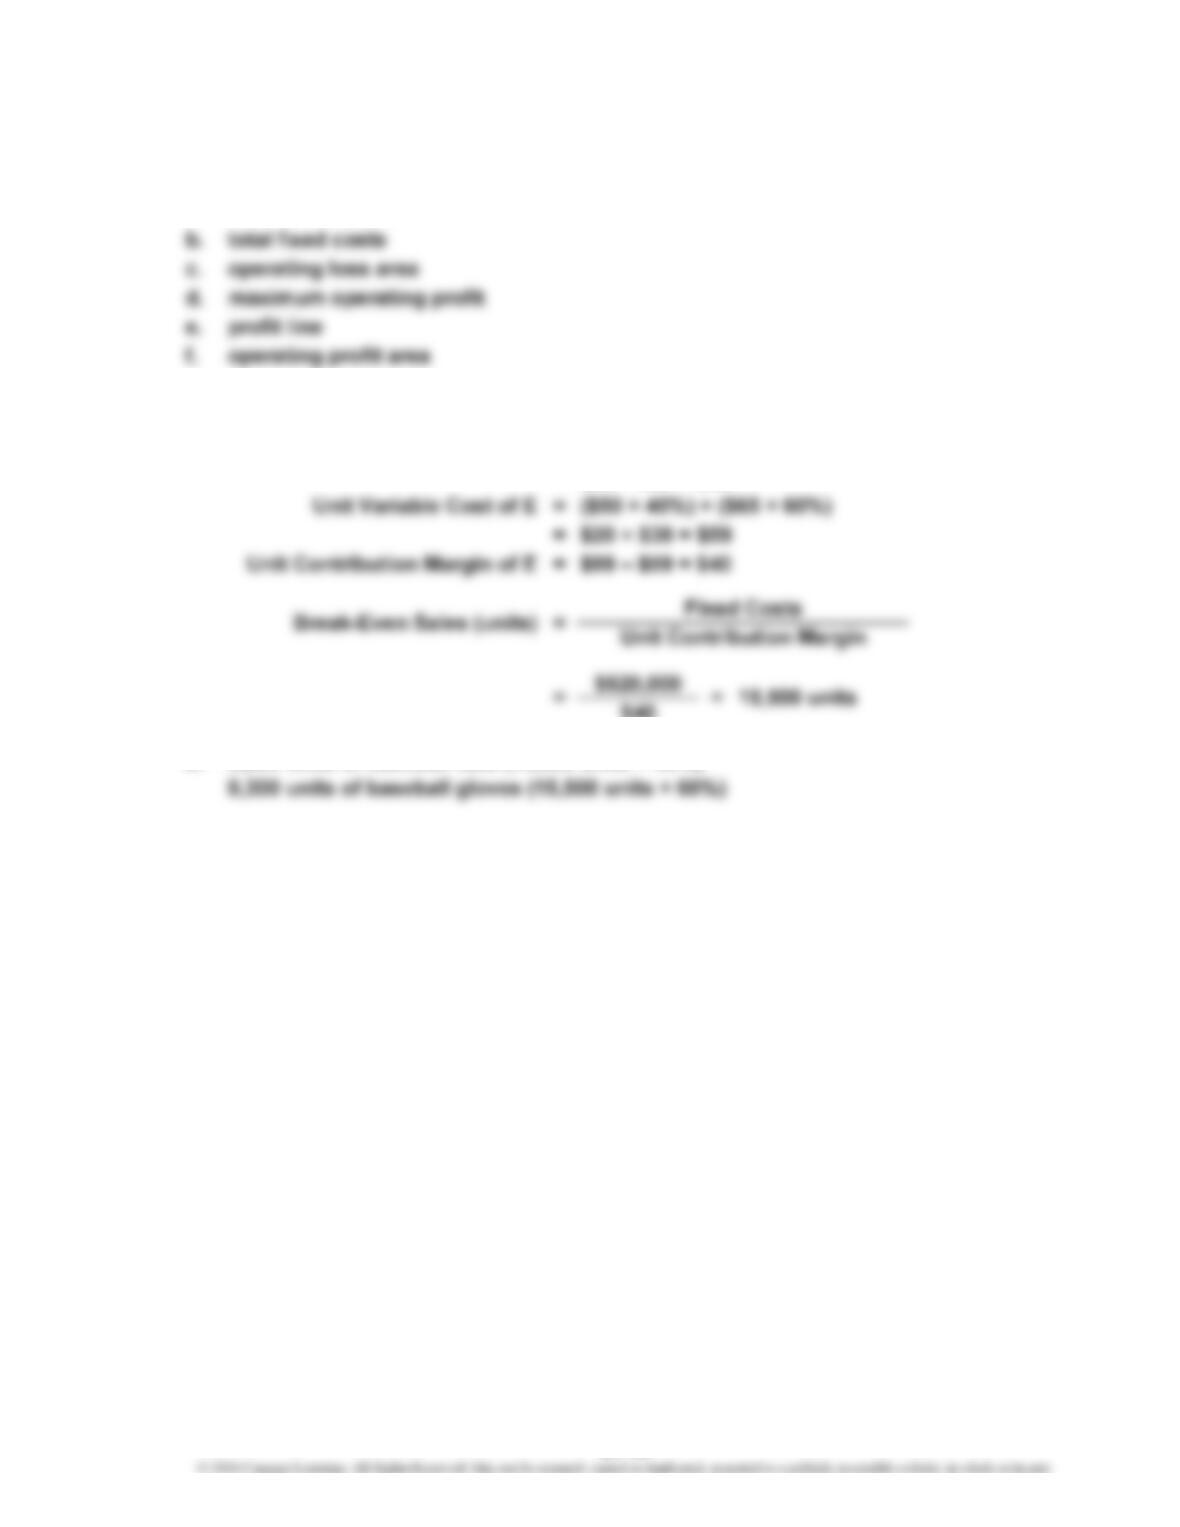
Ex. 21–21
a. Unit Selling Price of E = ($90 × 40%) + ($105 × 60%)
= $36 + $63 = $99
$40
b. 6,200 units of baseball bats (15,500 units × 40%)
21-15
CHAPTER 21 Cost Behavior and Cost-Volume-Profit Analysis
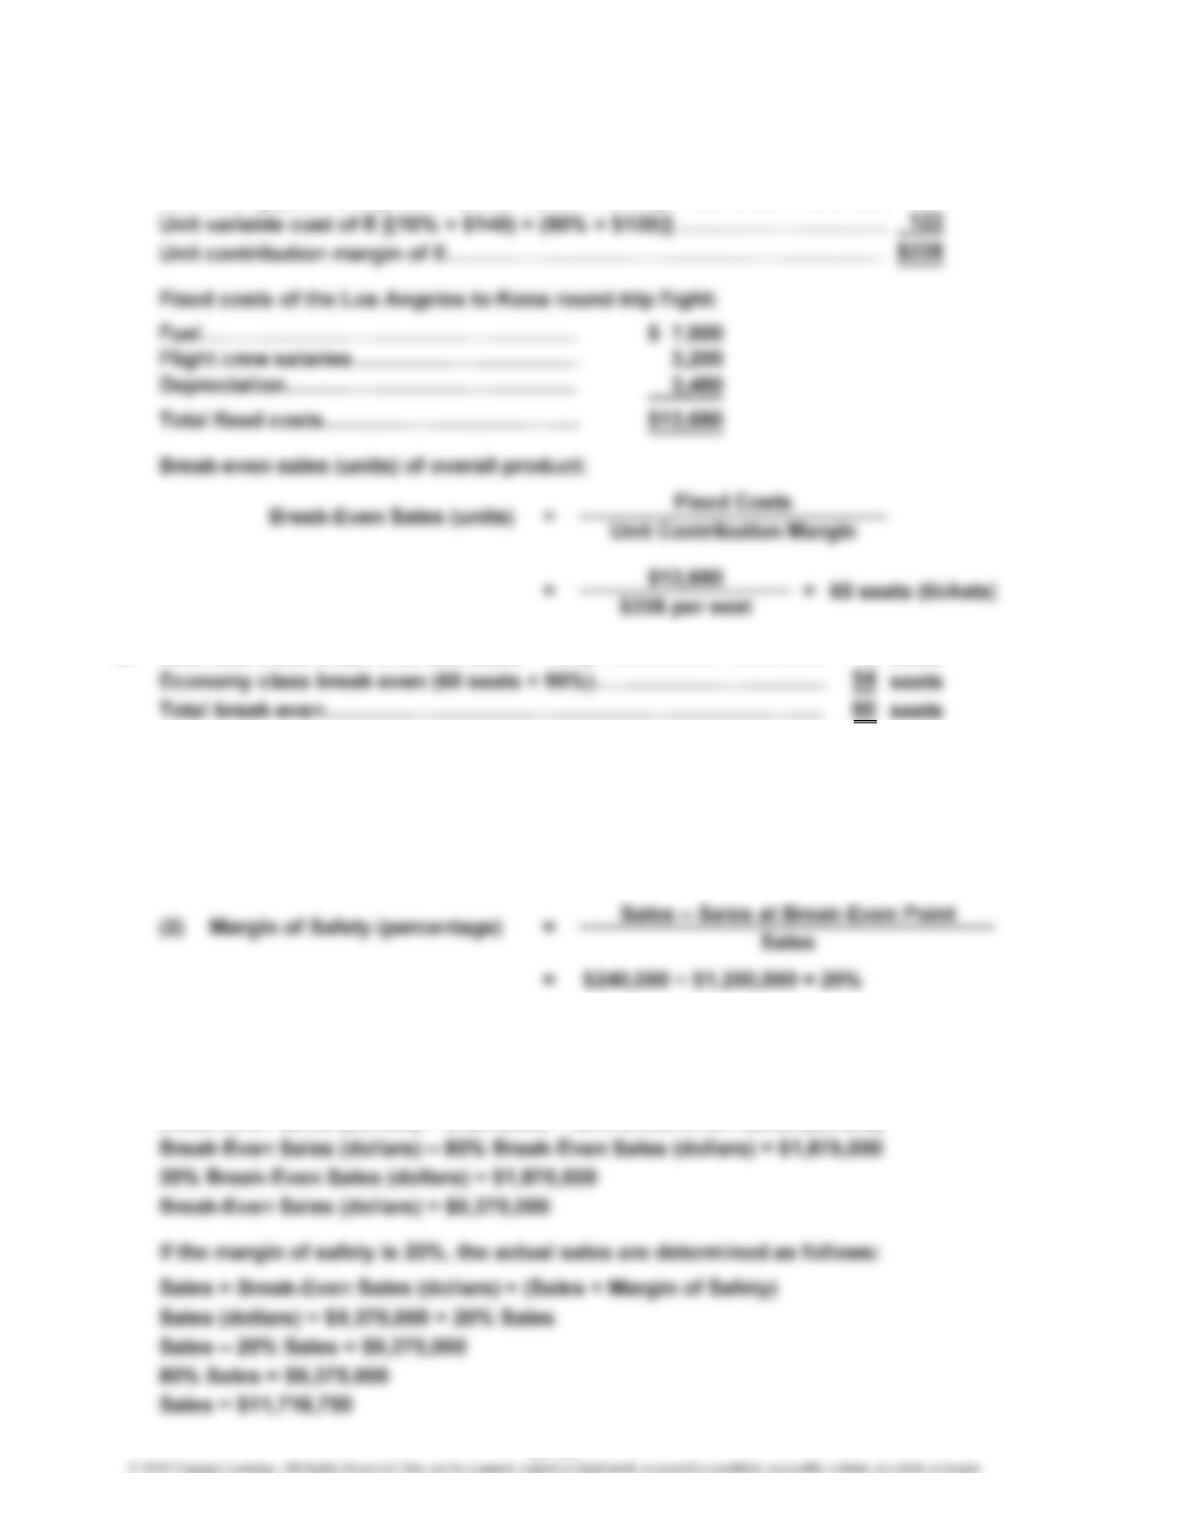
Ex. 21–22
a. Unit contribution margin of overall product (E):
Unit selling price of E [(10% × $800) + (90% × $300)]…………………………
…
$350
b. Business class break-even (60 seats × 10%)……………………………
…
6seats
Ex. 21–23
a. (1) Margin of Safety (dollars) = Sales – Sales at Break-Even Point
= $1,200,000 – $960,000 = $240,000
b. The break-even point (S) is determined as follows:
Break-Even Sales (dollars) = Total Fixed Costs + Total Variable Costs (at Break-Even)
Break-Even Sales (dollars) = Total Fixed Costs + 80% Break-Even Sales (dollars)
Break-Even Sales (dollars) = $1,875,000 + 80% Break-Even Sales (dollars)
21-16
CHAPTER 21 Cost Behavior and Cost-Volume-Profit Analysis
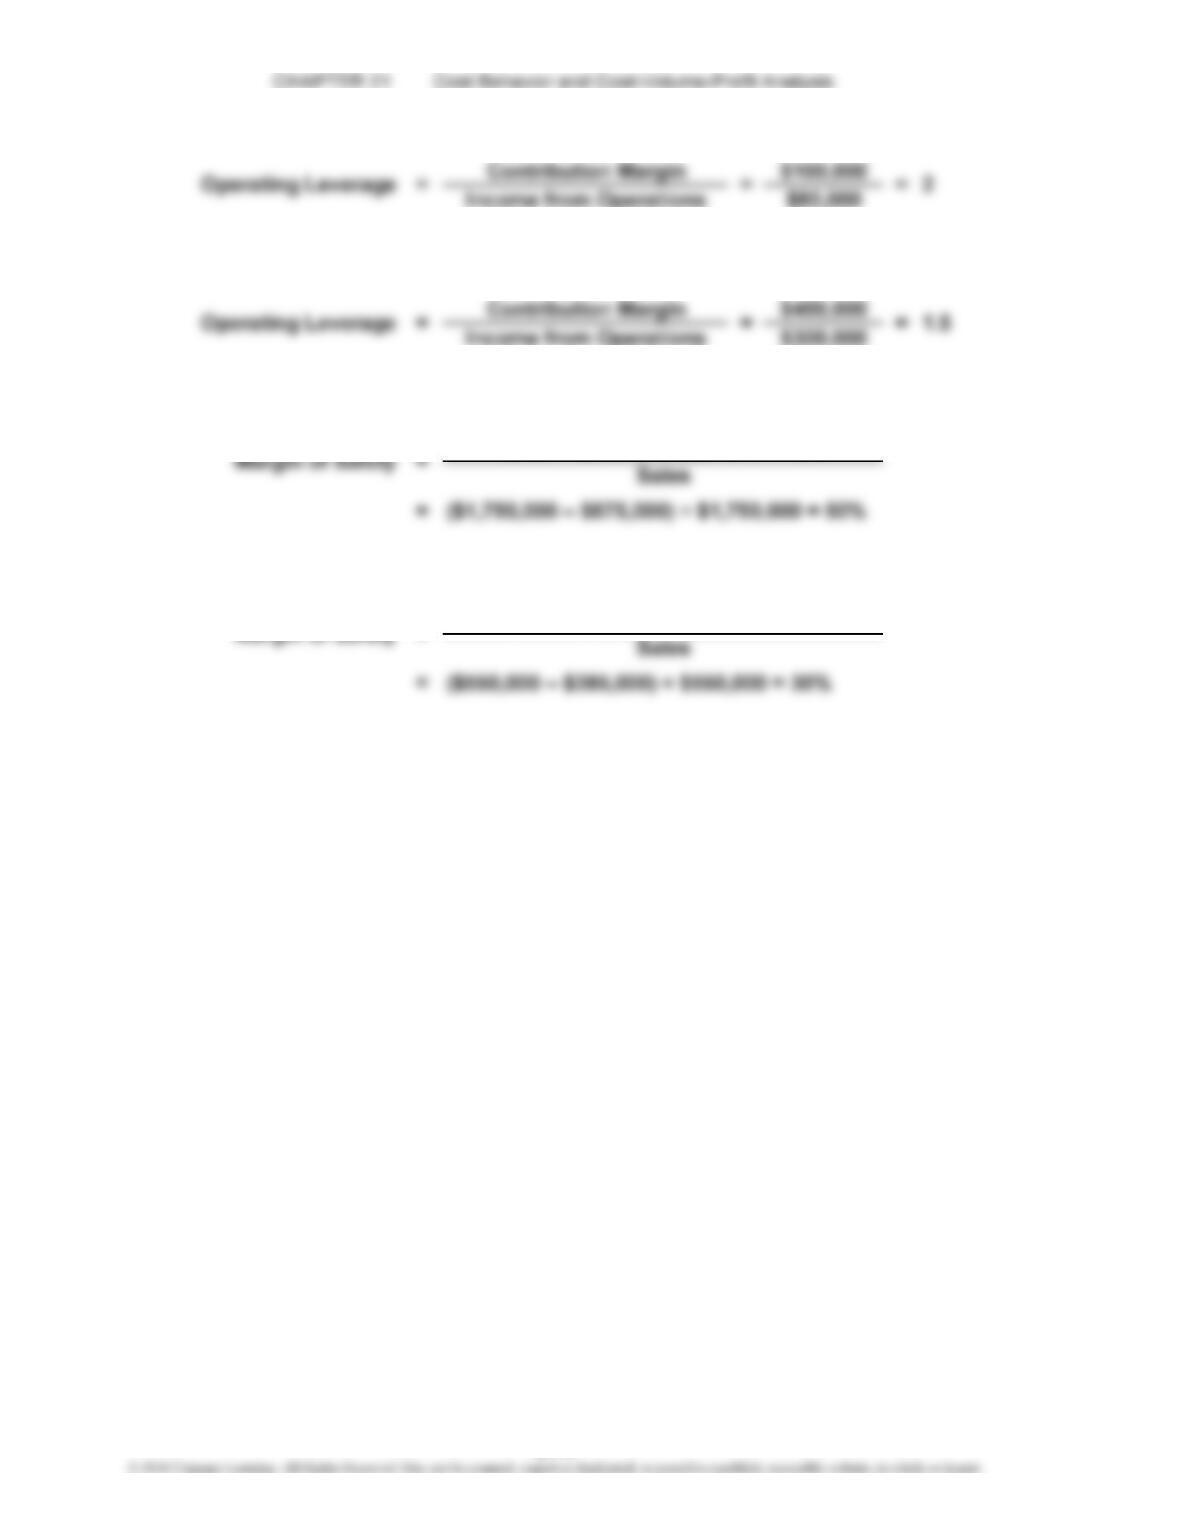
Ex. 21–24
If 420,000 units are sold and sales at the break-even point are 472,500 units,
Ex. 21–25
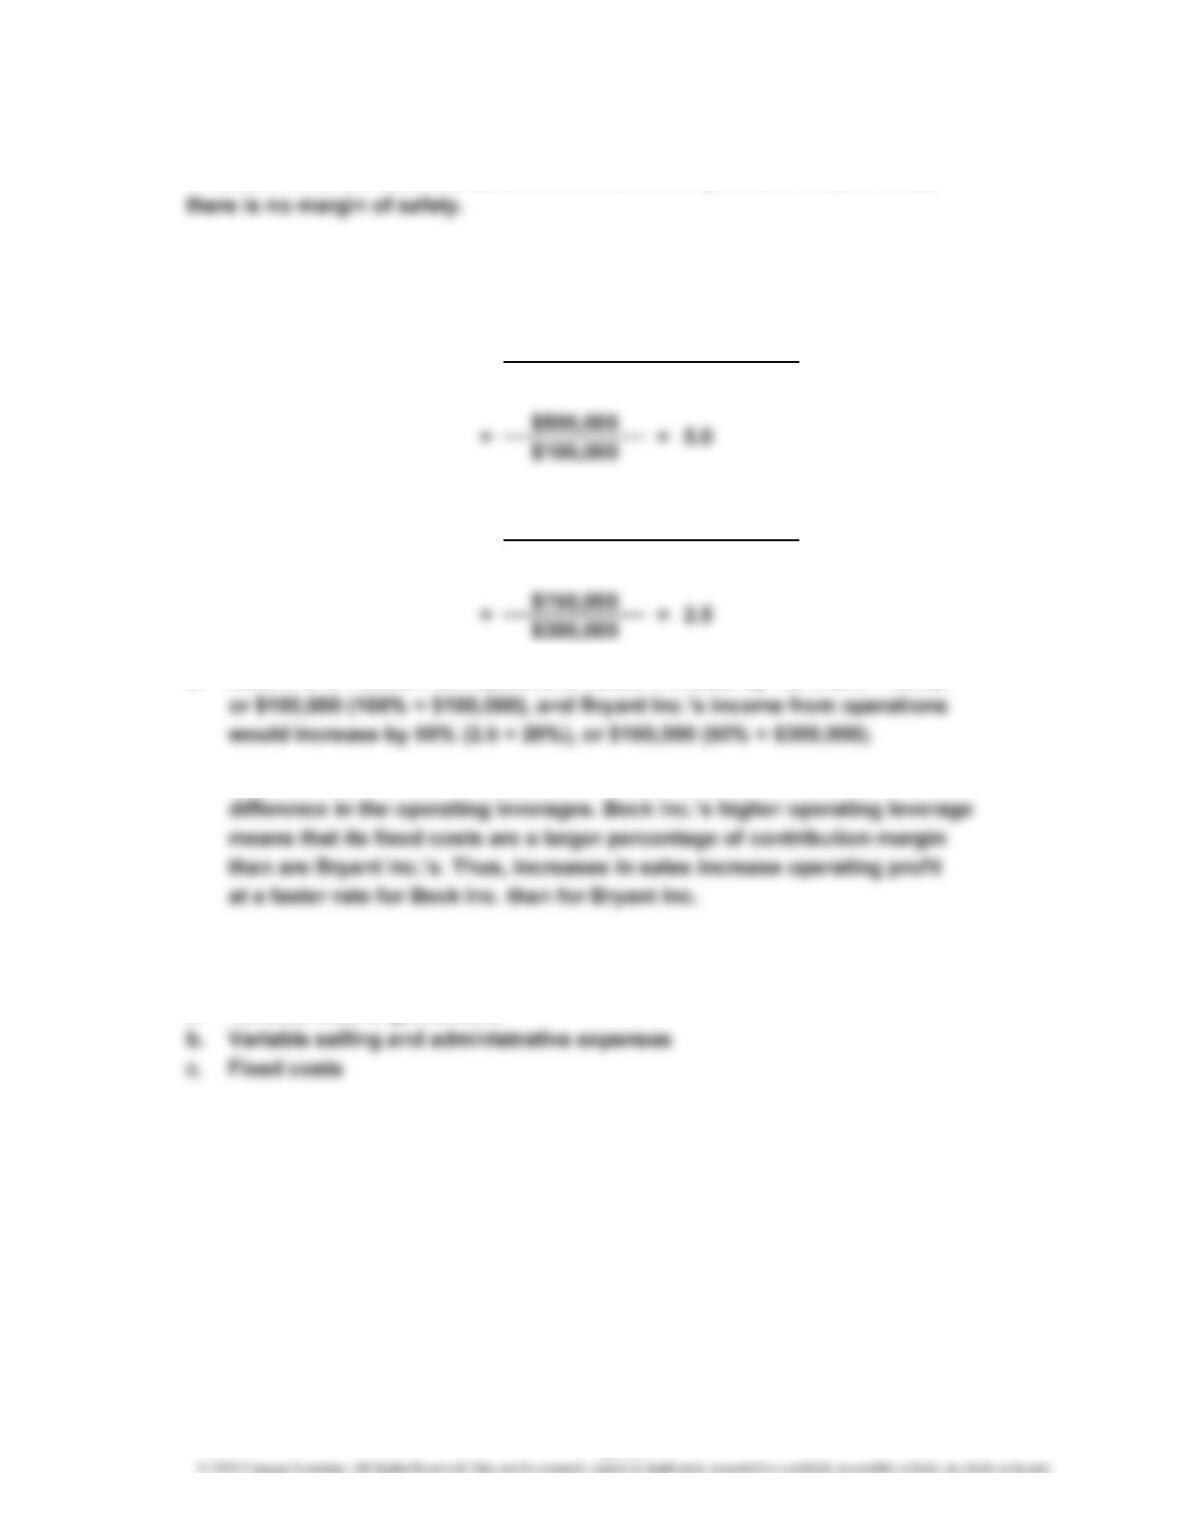
a. Beck Inc.:
Bryant Inc.:
b. Beck Inc.’s income from operations would increase by 100% (5.0 × 20%),
c. The difference in the increases of income from operations is due to the
Ex. 21–26
a. Variable cost of goods sold
Contribution Margin
Income from Operations
=
Contribution Margin
Income from Operations
Operating Leverage
Operating Leverage =
21-17
CHAPTER 21 Cost Behavior and Cost-Volume-Profit Analysis
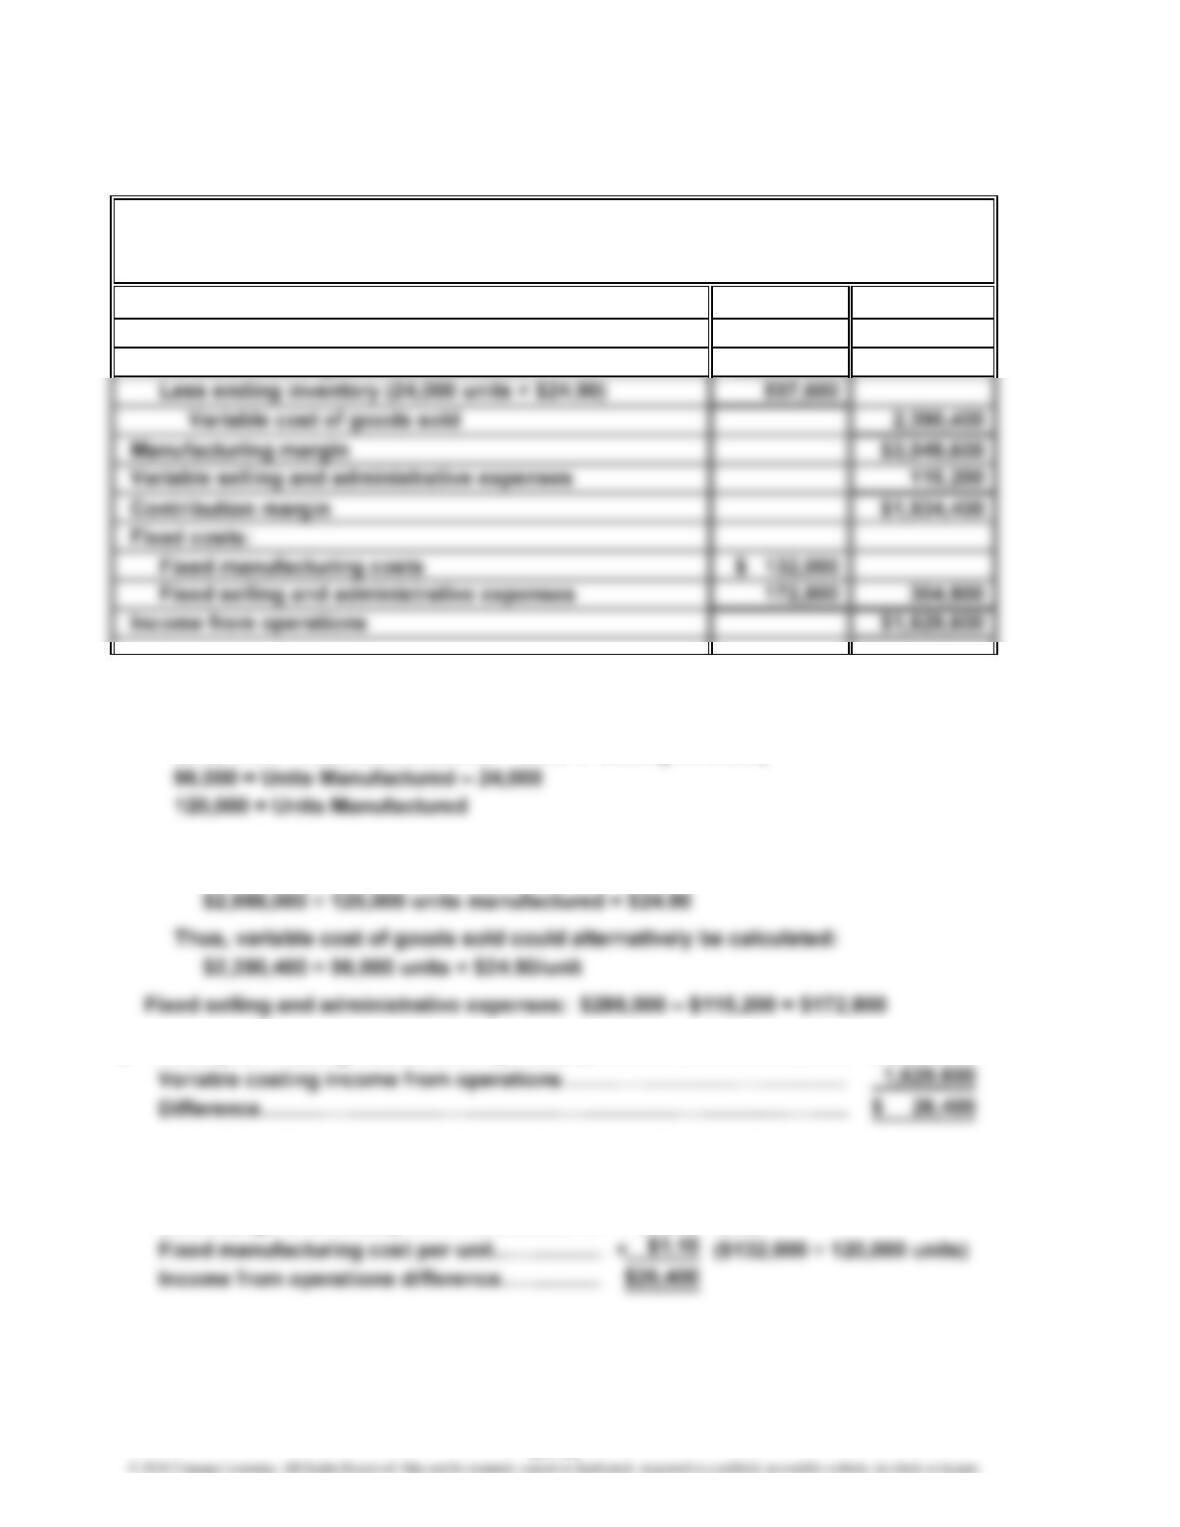
Ex. 21–27
a.
Sales $4,440,000
Variable cost of goods sold:
Variable cost of goods manufactured $2,988,000
Computations:
Variable cost of goods manufactured: $3,120,000 – $132,000 = $2,988,000
Units Sold = Units Manufactured – Units in Ending Inventory
Unit cost of ending inventory:
Variable cost of goods manufactured per unit:
b. Absorption costing income from operations………………………………
…
$1,656,000
Note: The difference between the two income numbers can be reconciled
as follows:
Unit change in inventory………………………
…
24,000 units
RHYS COMPANY
Income Statement—Variable Costing
For the Month Ended July 31, 2016
21-18
CHAPTER 21 Cost Behavior and Cost-Volume-Profit Analysis
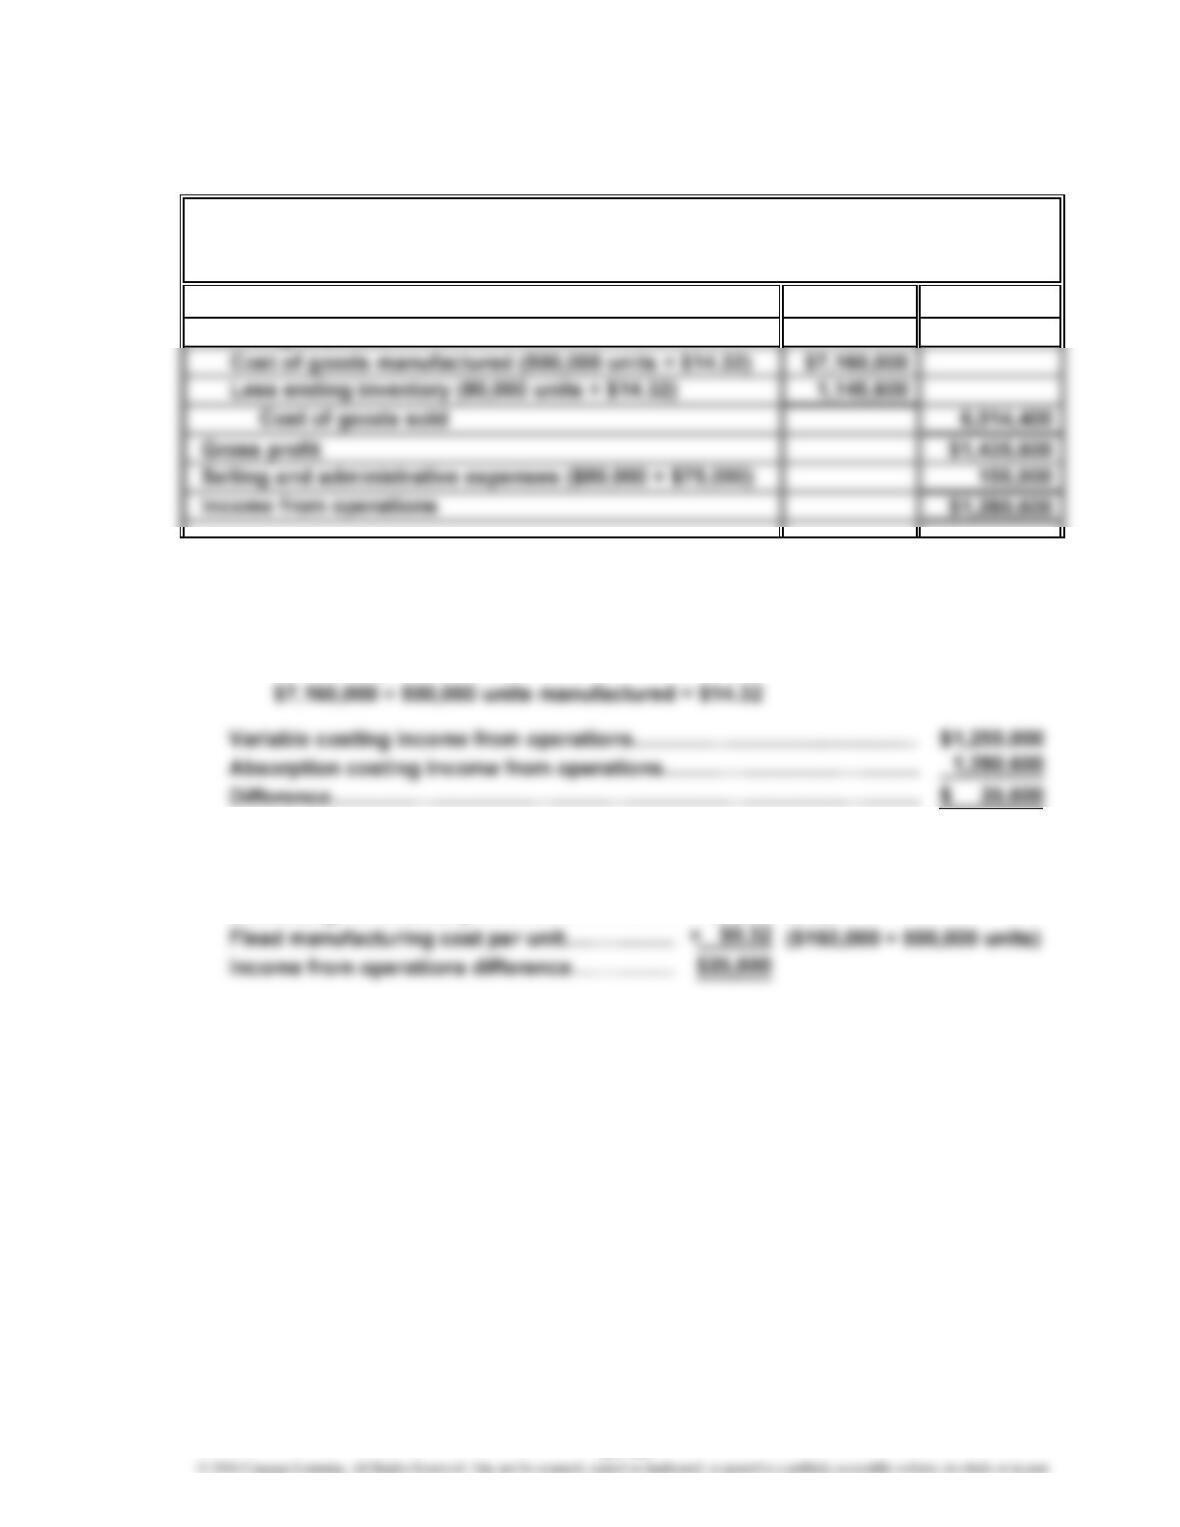
Ex. 21–28
a.
Sales $7,450,000
Cost of goods sold:
Computations:
Cost of goods manufactured: $7,000,000 + $160,000 = $7,160,000
Unit cost of ending inventory:
Total cost of goods manufactured:
b. Note: The difference between the two income numbers can be reconciled
as follows:
Unit change in inventory………………………
…
80,000 units
TUDOR MANUFACTURING CO.
Income Statement—Absorption Costing
For the Month Ended June 30, 2016
21-19
CHAPTER 21 Cost Behavior and Cost-Volume-Profit Analysis
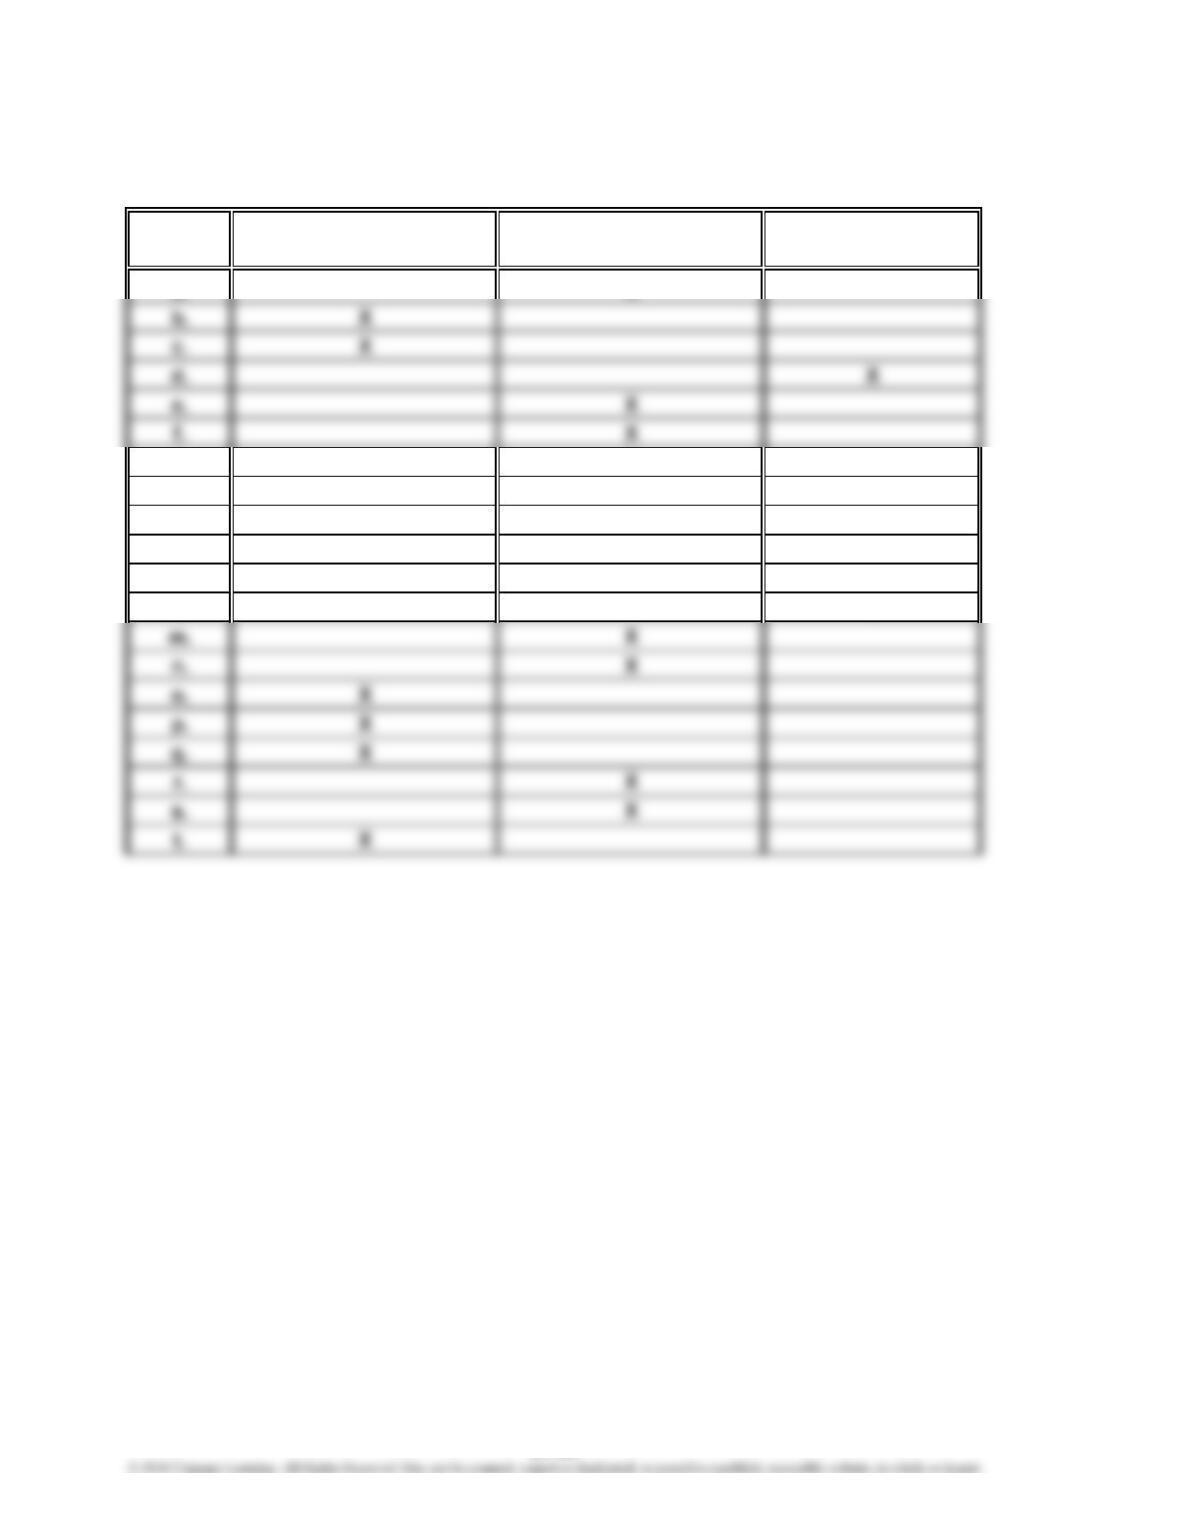
Prob. 21–1A
Fixed Variable Mixed
Cost Cost Cost Cost
a. X
g. X
h. X
i. X
j. X
k. X
l. X
PROBLEMS
21-20