1167
Exercise 21-22 (25 minutes)
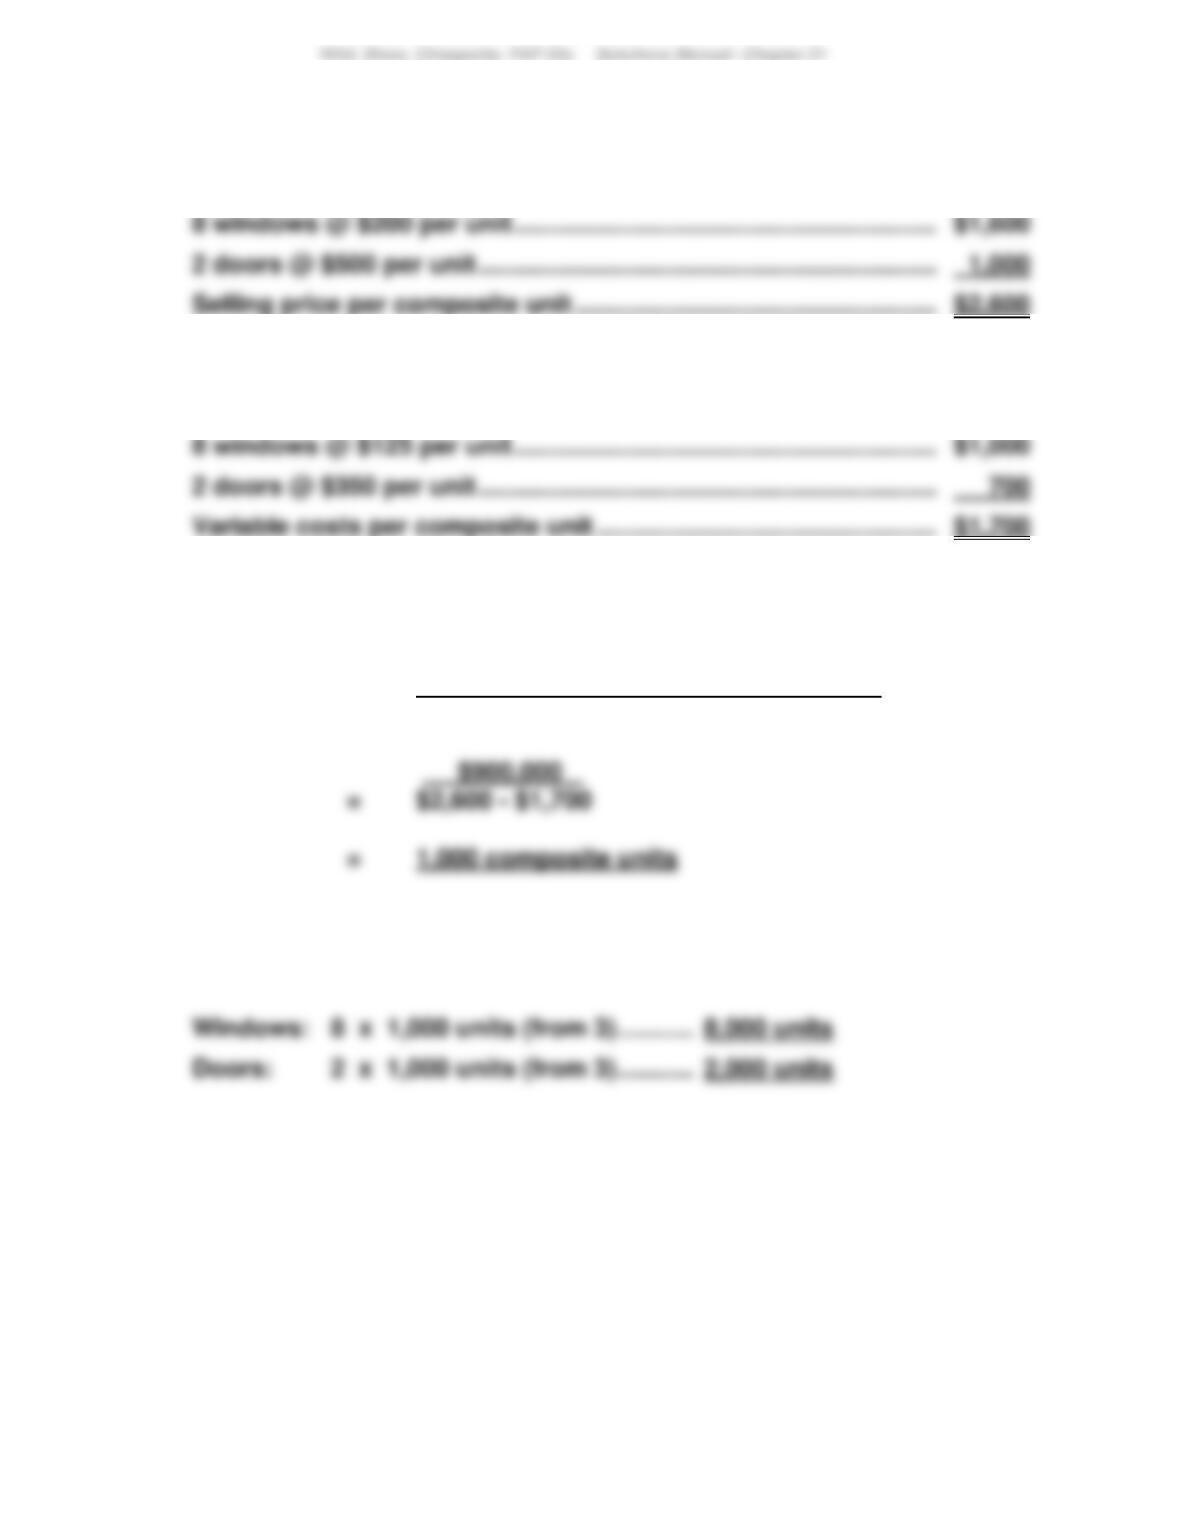
1. Selling price per composite unit
2. Variable costs per composite unit
3. Break-even point in composite units
Fixed costs .
= Contribution margin per composite unit
4. Unit sales of windows and doors at break-even point
1168
Exercise 21-23 (25 minutes)
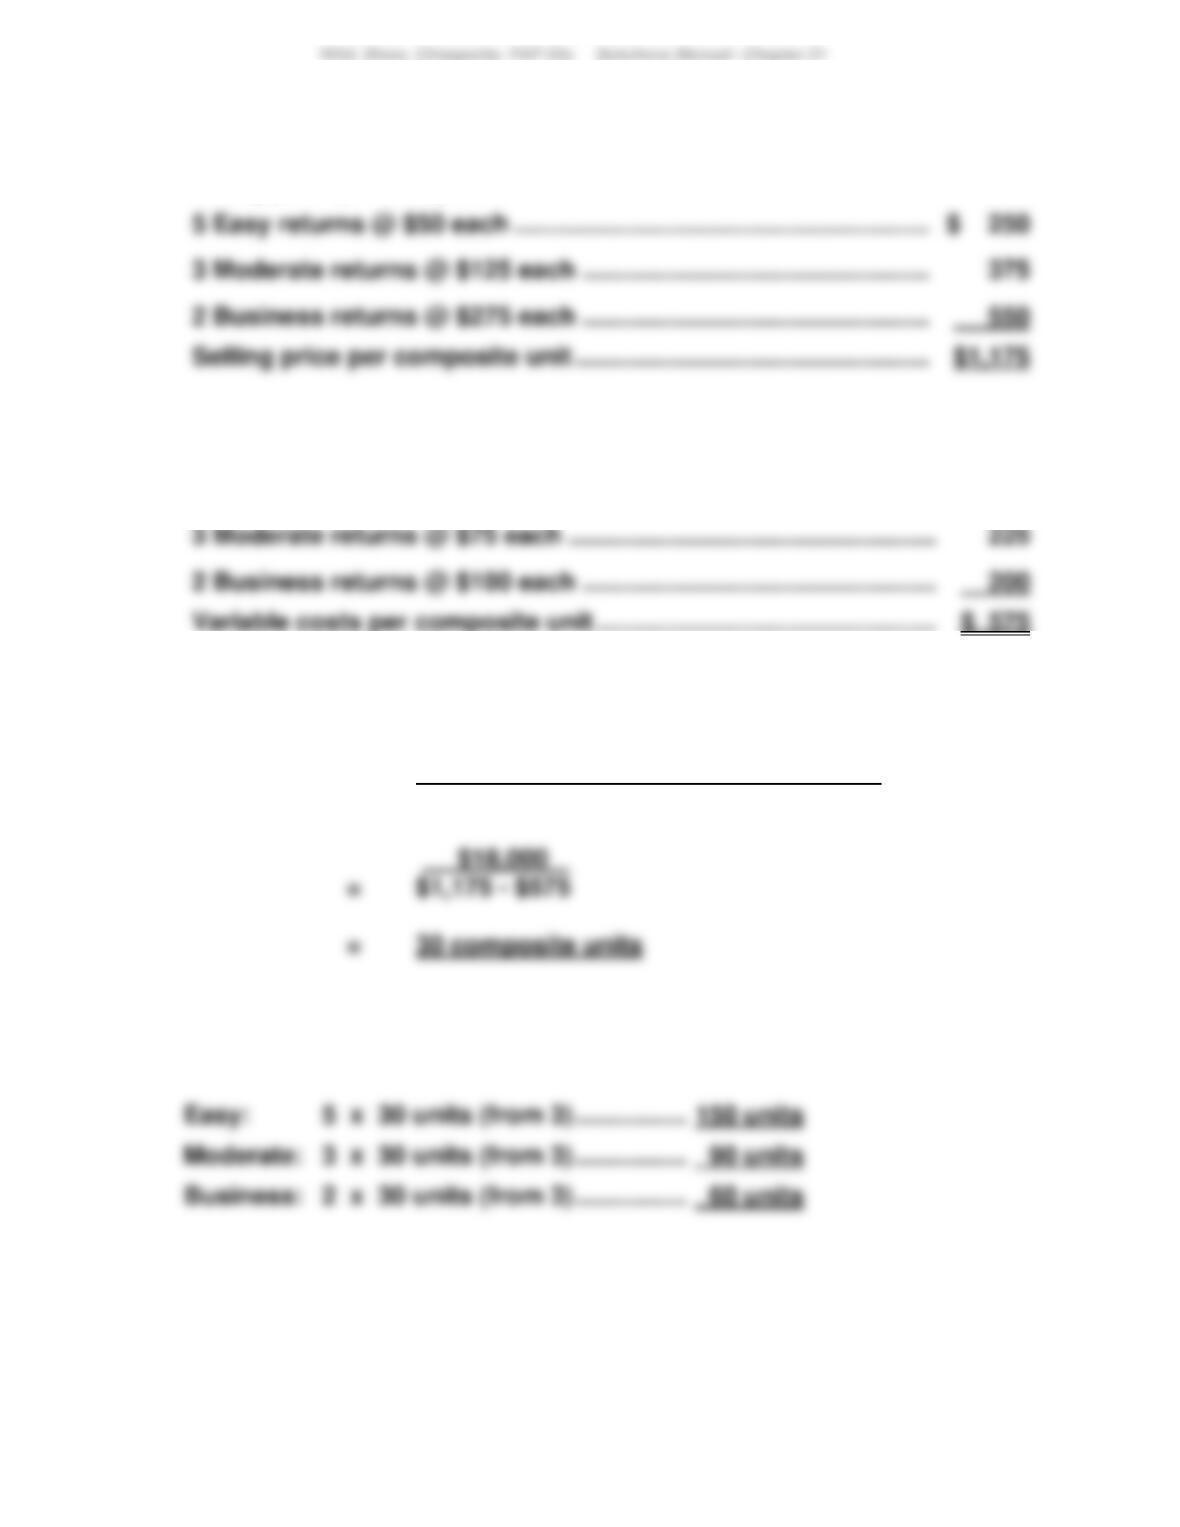
1. Selling price per composite unit
5 Easy returns @ $50 each …………………………………………………….
2. Variable costs per composite unit
5 Easy returns @ $30 each …………………………………………………….
$ 150
3. Break-even point in composite units
Fixed costs .
= Contribution margin per composite unit
4. Unit sales of Easy, Moderate, and Business returns at break-even point
1169
Exercise 21-24 (30 minutes)
Instructor note: This exercise is solved in 3 steps
Step 1.
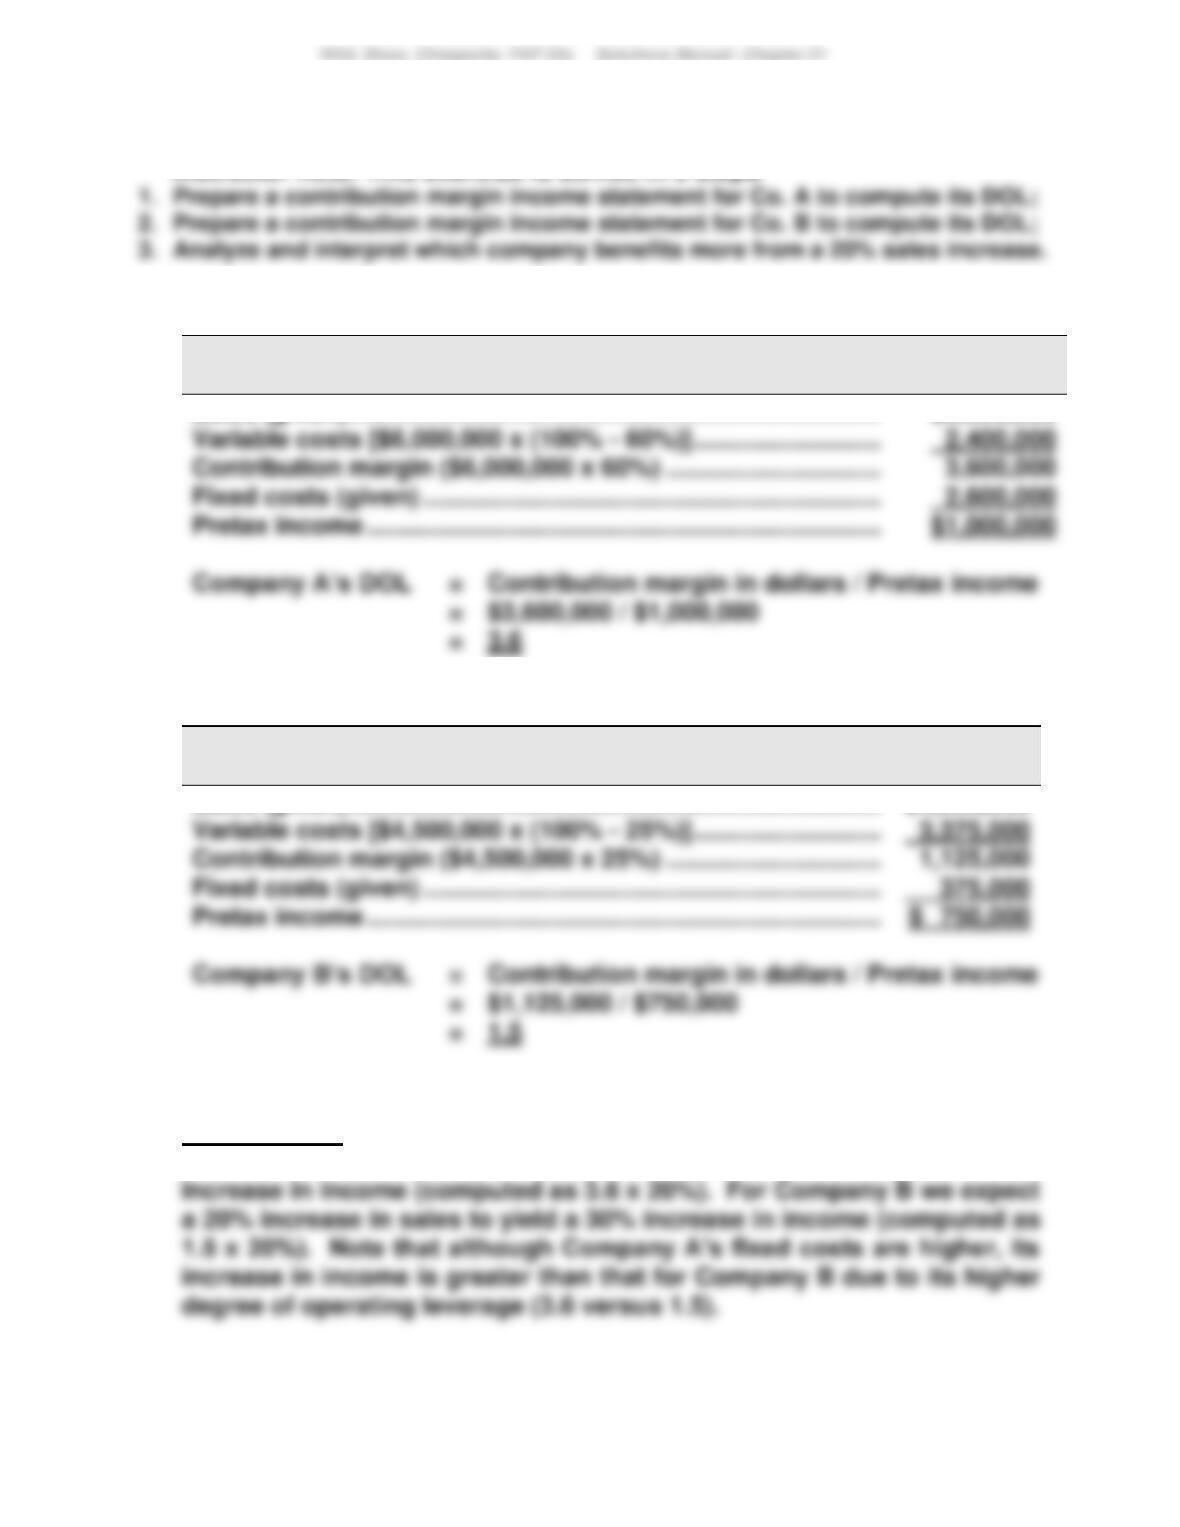
Company A
Contribution Margin Income Statement
Sales (given)…………………………………………………………………..
$6,000,000
Variable costs [$6,000,000 x (100% – 60%)] ………………………
Fixed costs (given) …………………………………………………………
Pretax income ………………………………………………………………..
$1,000,000
$3,600,000 / $1,000,000
Step 2.
Company B
Contribution Margin Income Statement
Sales (given)…………………………………………………………………..
$4,500,000
Variable costs [$4,500,000 x (100% – 25%)] ………………………
Fixed costs (given) …………………………………………………………
Pretax income ………………………………………………………………..
$1,125,000 / $750,000
Step 3.
Interpretation: Company A benefits more from a 20% increase in sales.
This is because we expect a 20% increase in sales to yield a 72%
1170
Exercise 21-25 (10 minutes)
1. Degree of operating leverage = Total contribution margin
Pretax income
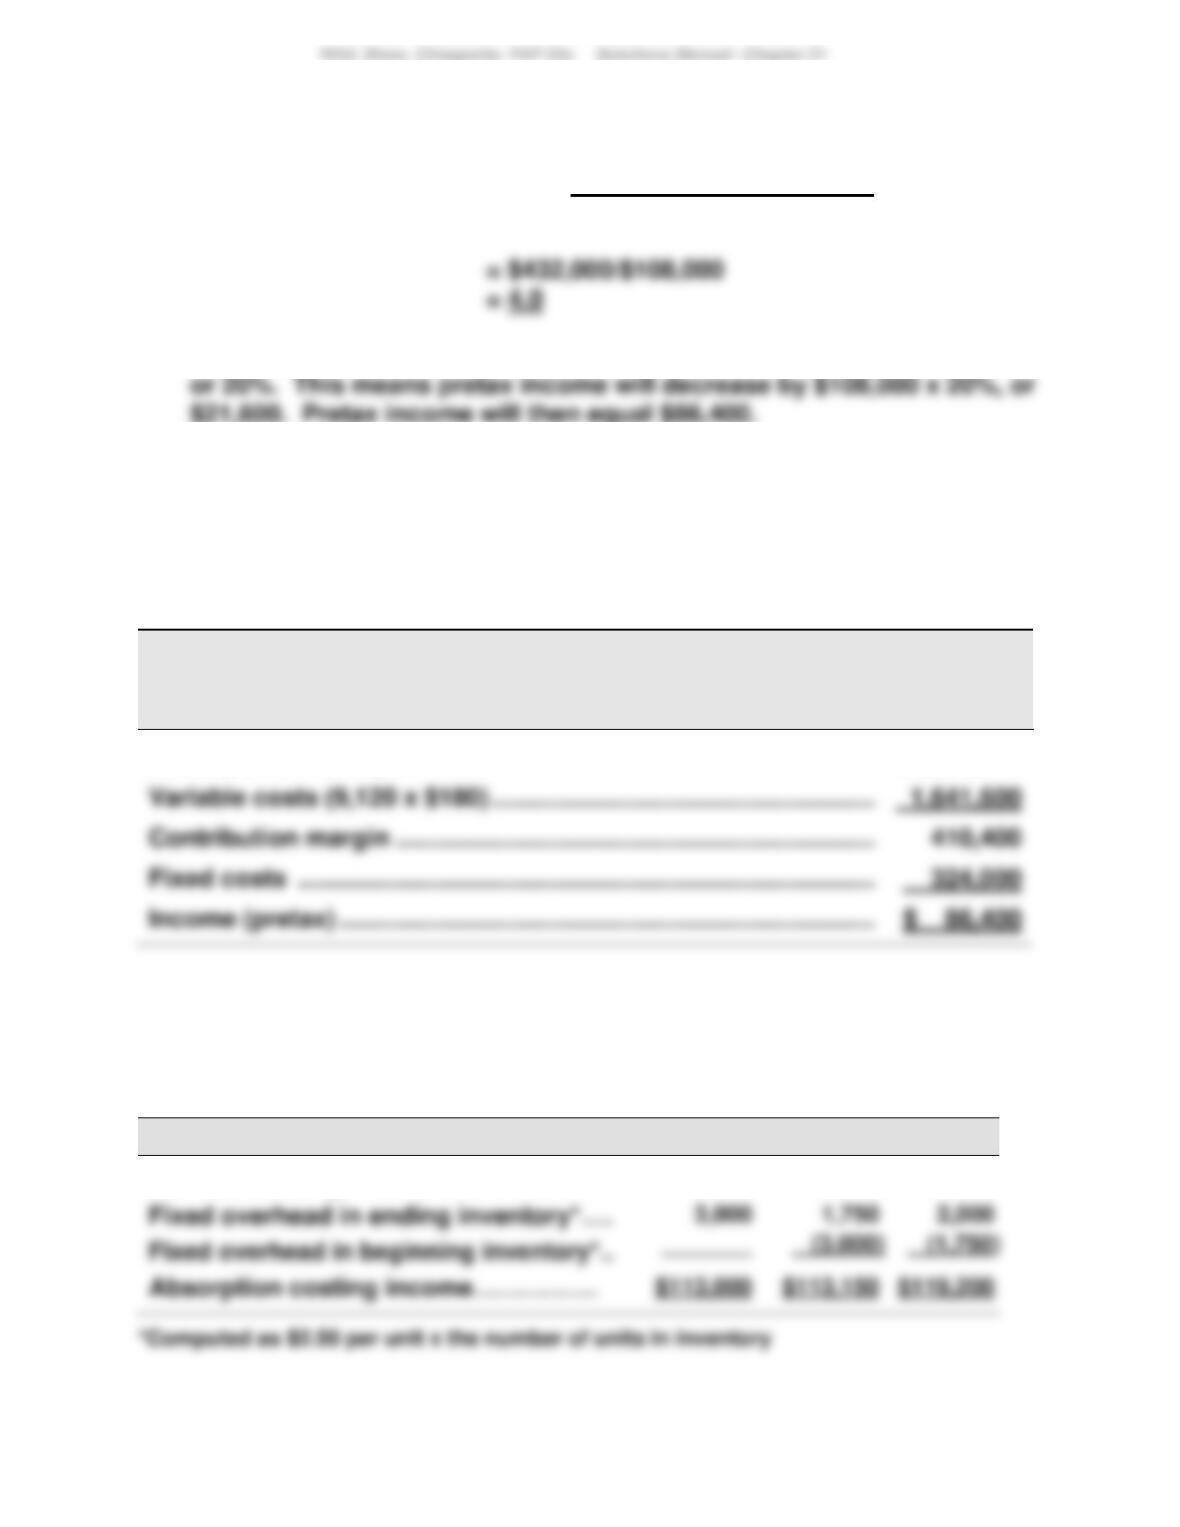
2. If sales decrease by 5%, then pretax income will decrease by 4.0 x 5%,
3. If sales decrease by 5%, a total of 9,120 (computed as 9,600 x 95%)
units will be sold.
Contribution margin income statement, assuming 5% sales decrease:
HUDSON CO.
Forecasted Contribution Margin Income Statement
For Year Ended December 31, 2018
Sales (9,120 x $225) …………………………………………………………………
$2,052,000
Fixed costs …………………………..………………………………………………..
Exercise 21-26 (15 minutes)
Reconciliation of variable costing income to absorption costing income:
Year 1
Year 2
Year 3
Variable costing income…………………
$110,000
$114,400
$118,950
1171
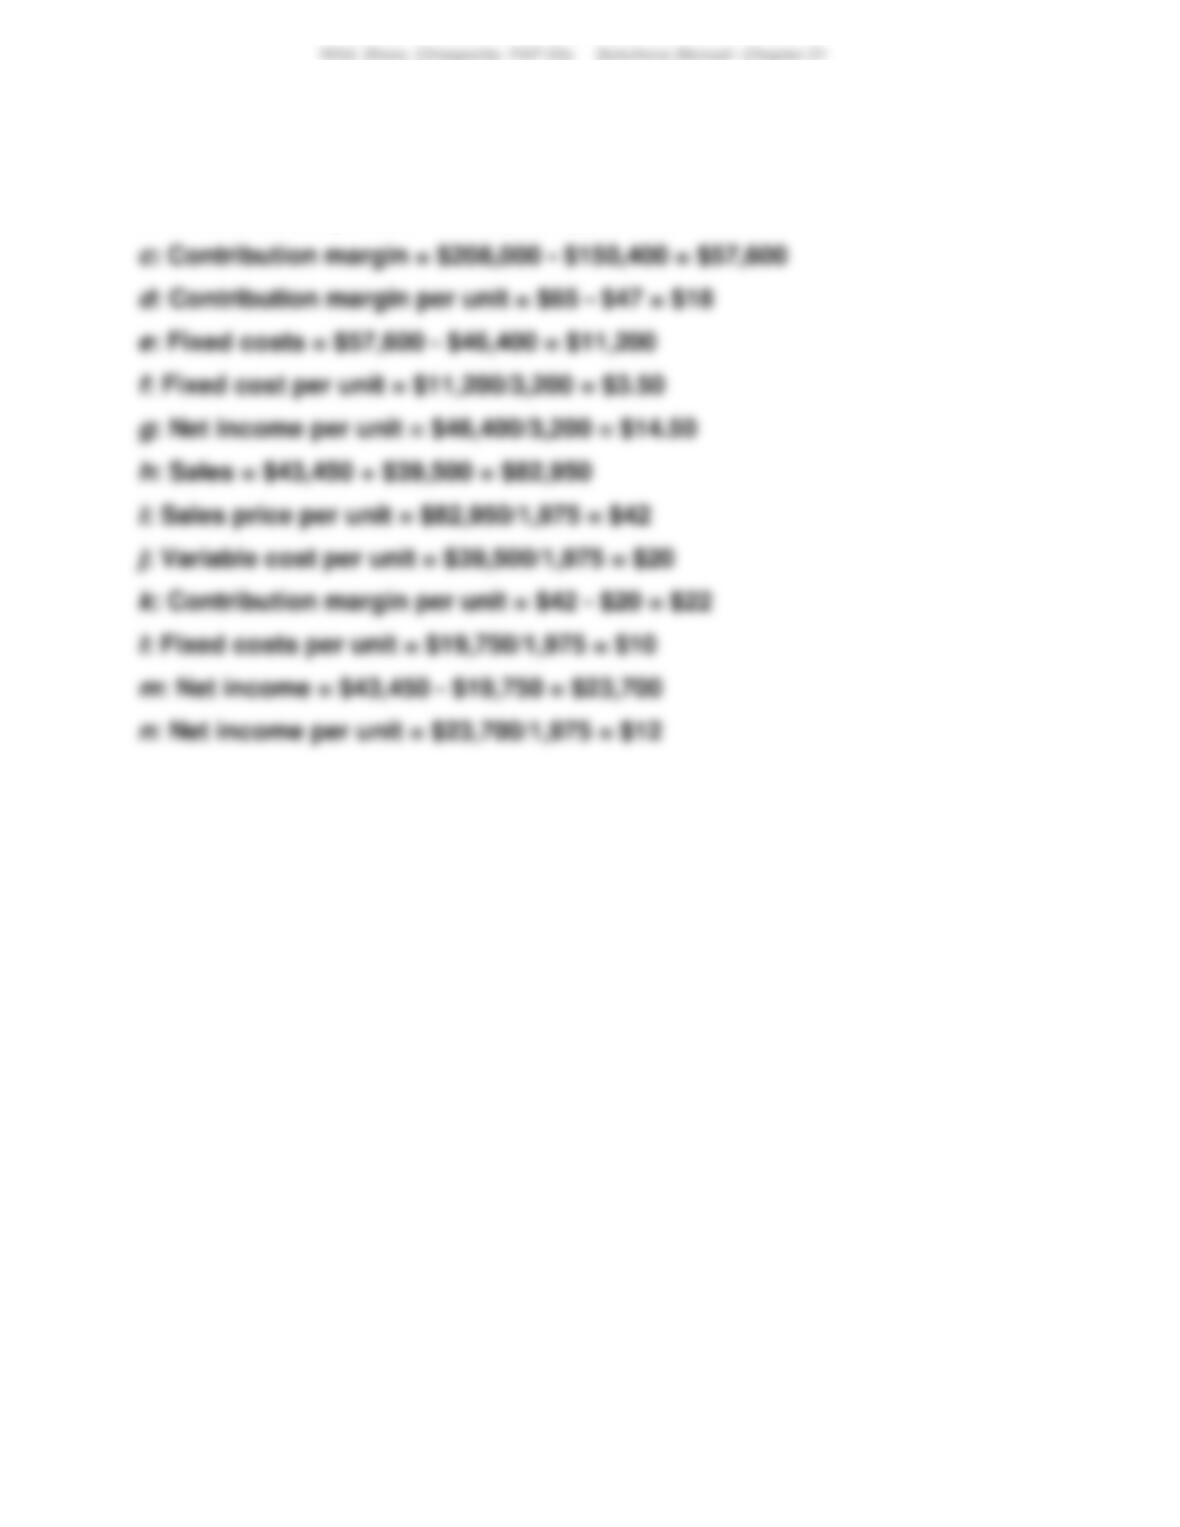
Exercise 21-27 (15 minutes)
a: Units sold = $208,000/$65 = 3,200
b: Variable cost per unit = $150,400/3,200 = $47
Wild, Shaw, Chiappetta, FAP 23e Solutions Manual: Chapter 21
1172
PROBLEM SET A
Problem 21-1A (25 minutes)
Parts 1 and 2
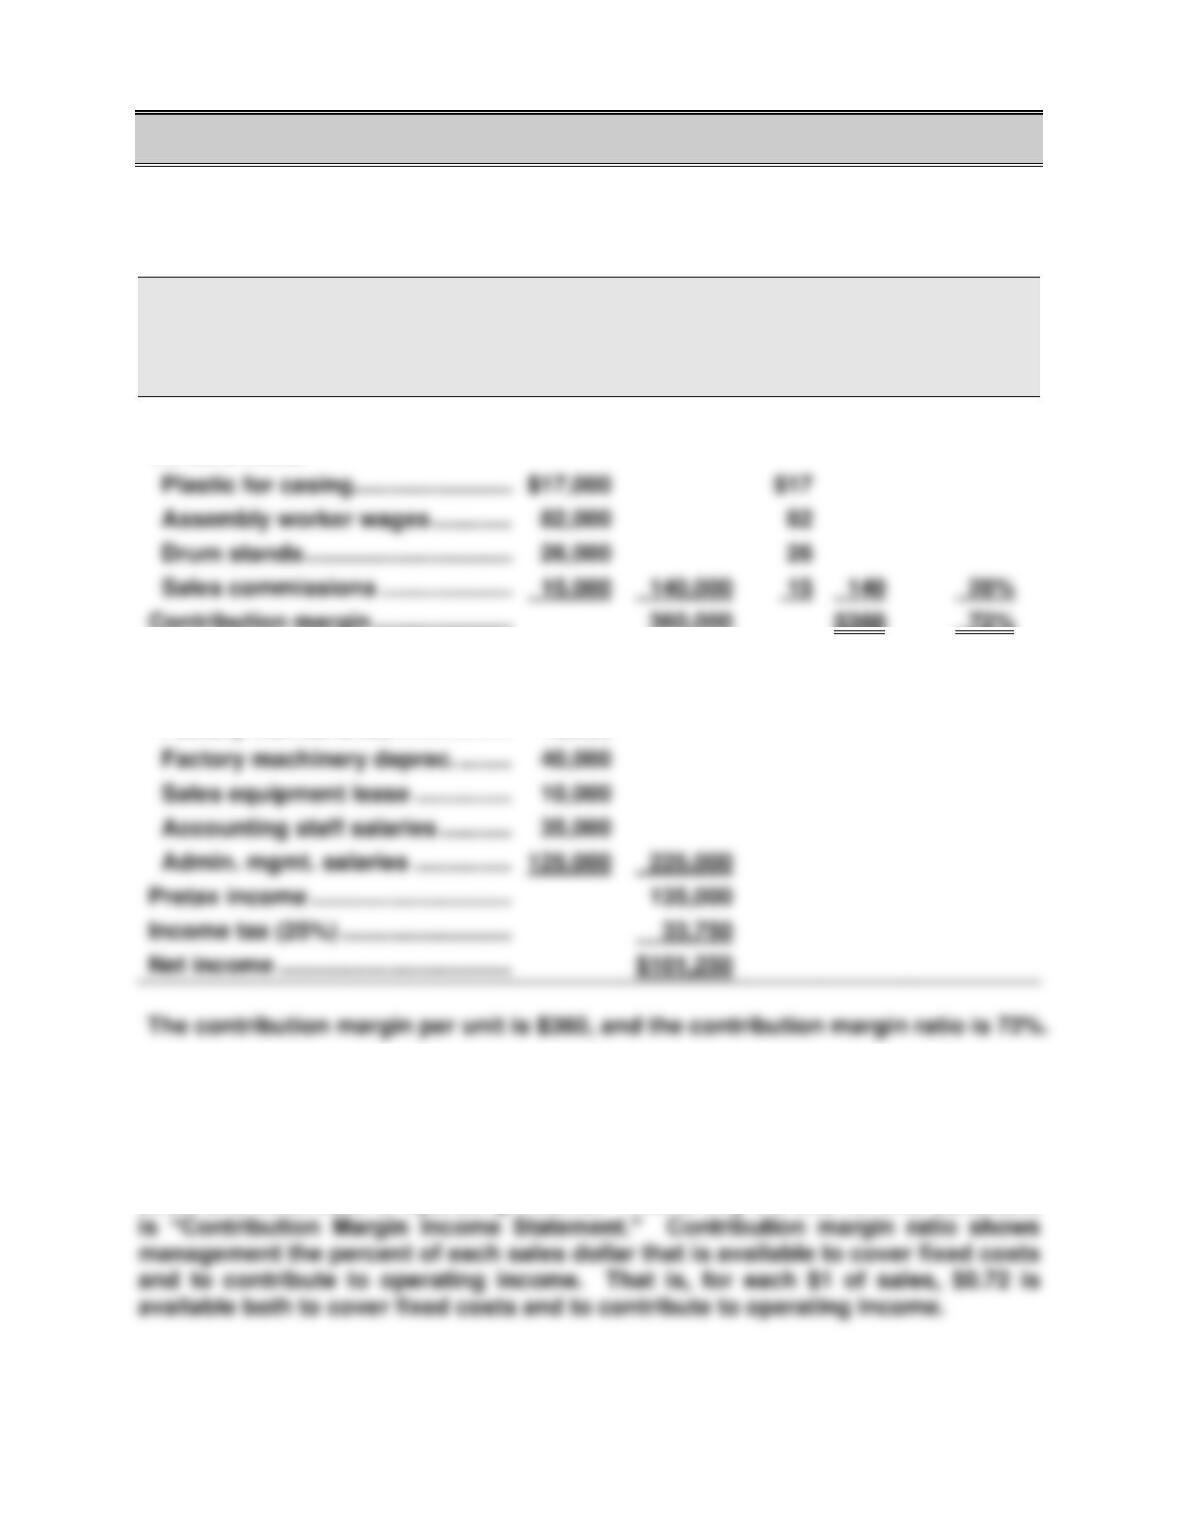
Tight Drums Company
Contribution Margin Income Statement
For Year Ended December 31, 2017
(1,000 units) Per unit % of sales
Sales ($500 x 1,000) ……………………….
$500,000
$500
100%
Variable costs
Contribution margin ………………………
360,000
$360
72%
Fixed costs
Taxes on factory …………………………..
5,000
Factory maintenance ……………………..
10,000
Accounting staff salaries ……………….
35,000
Pretax income …………………………..
135,000
Income tax (25%) …………………………..
Net income ……………………………………..
$101,250
Part 3 Analysis Component
Contribution margin shows how much of total sales are available to cover fixed
costs and contribute to operating income. This is why the title for this statement
Assembly worker wages ………………..
82,000
28%
1173
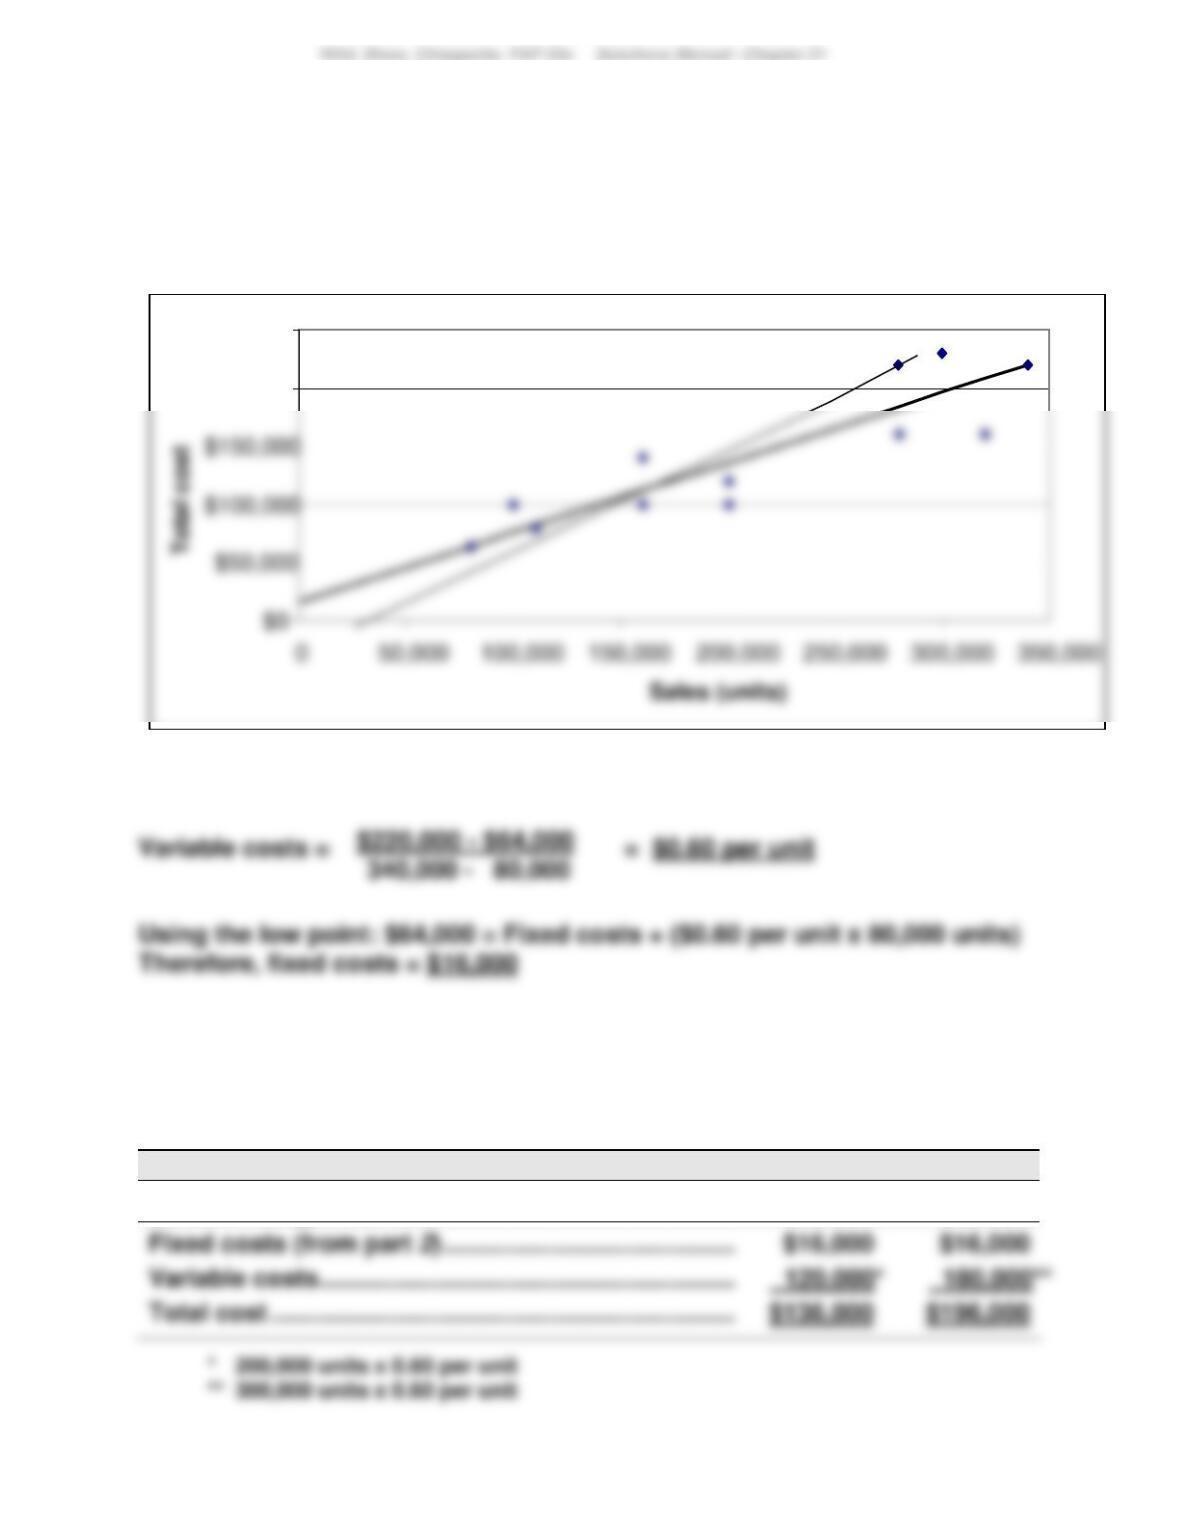
Problem 21-2A (45 minutes)
Parts 1 and 2
The scatter diagram and its estimated line of cost behavior appear below.
Part 2 – Calculation of variable and fixed costs
Part 3
The estimates in Part 2 can be used to predict the total costs that will be
incurred at sales levels of 200,000 and 300,000 units.
Predictions
Sales units (given) …………………………………………………
200,000
300,000
$200,000
$250,000
Alden Co.
1174
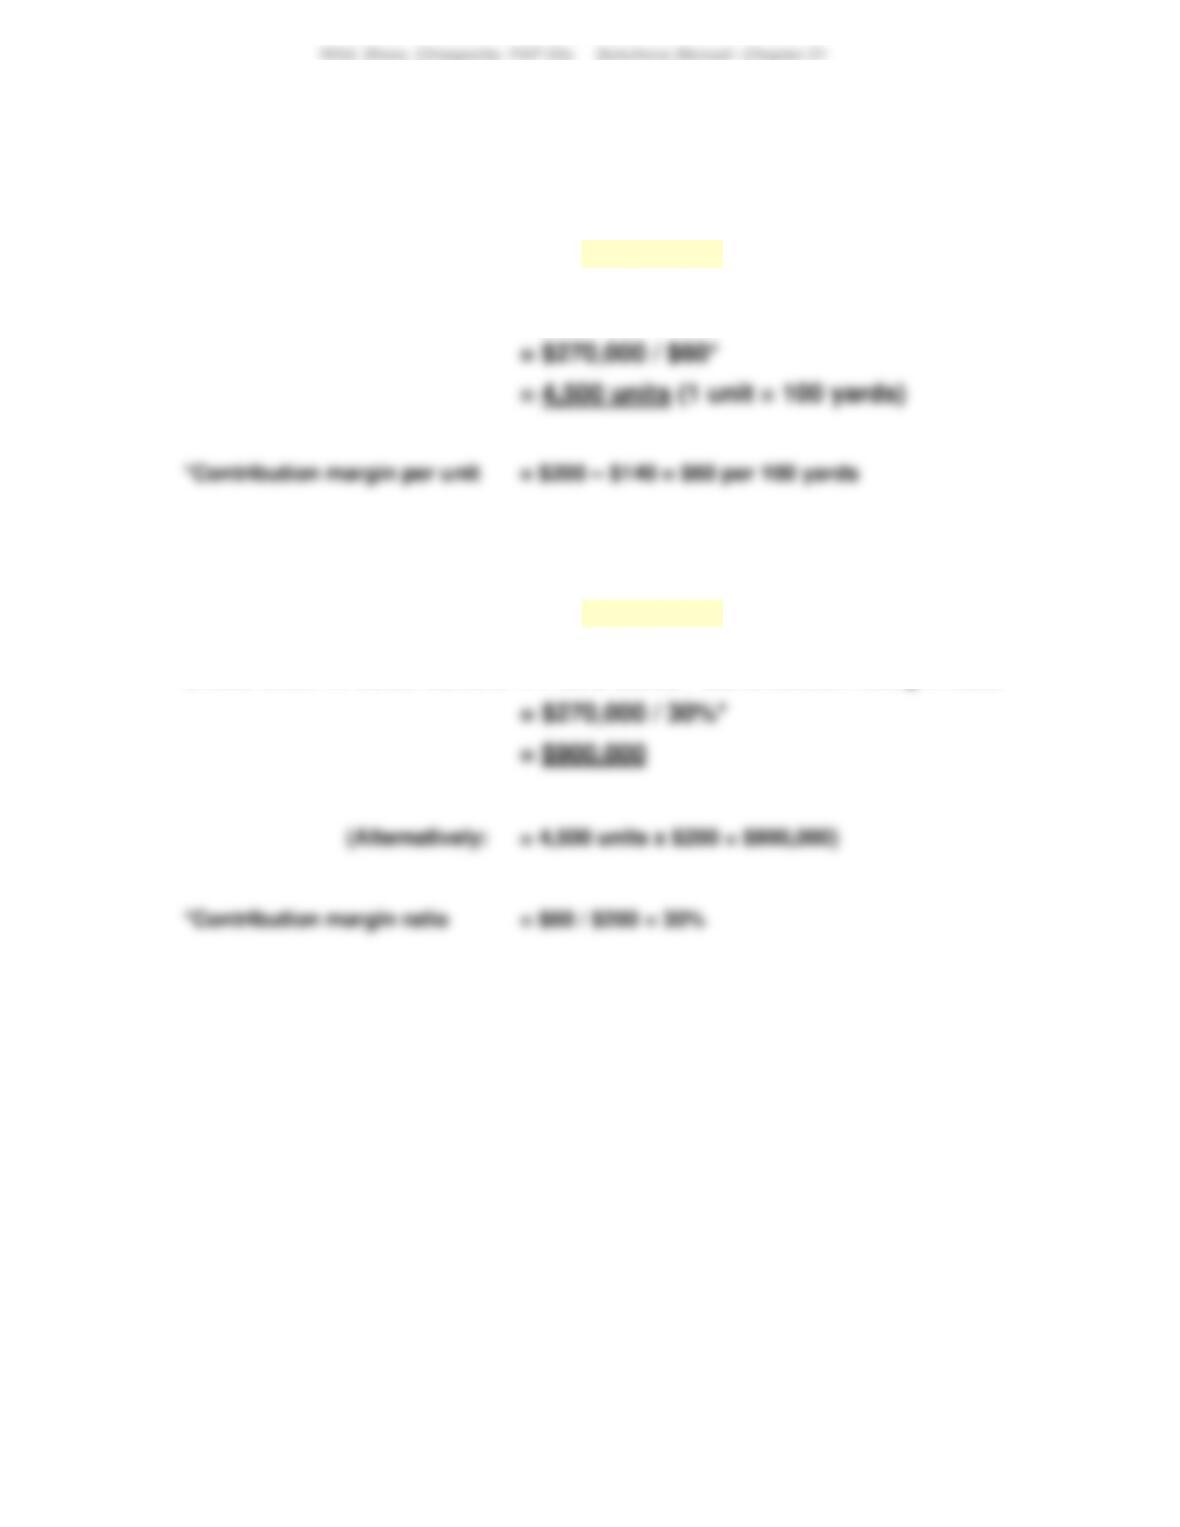
Problem 21-3A (40 minutes)
Part 1
(a) Instructor note: Use the equation in Exhibit 21.11
Break-even in sales units = Fixed costs / Contribution margin per unit
(b) Instructor note: Use the equation in Exhibit 21.12
Break-even in sales dollars = Fixed costs / Contribution margin ratio
1175
Problem 21-3A (Continued)
Part 2
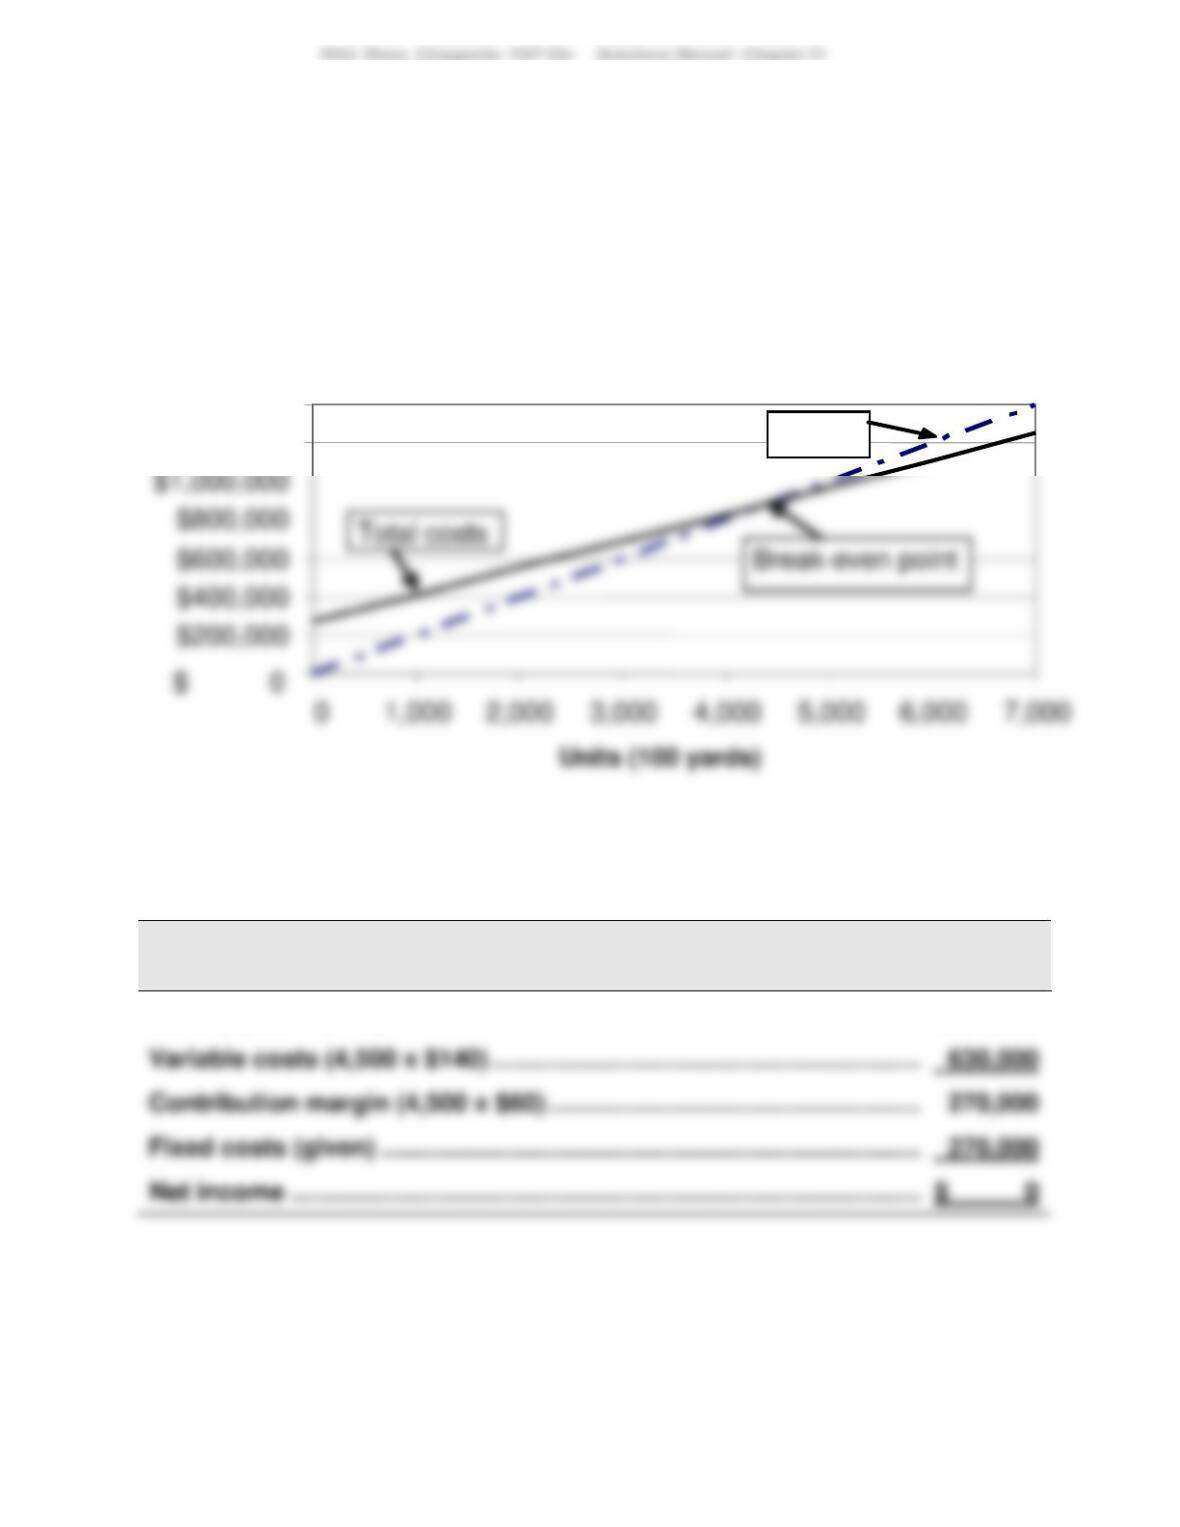
CVP Chart for Praveen Company
Part 3
PRAVEEN CO.
Contribution Margin Income Statement (at Break-Even) — Product XT
Sales (4,500 x $200) ……………………………………………………….…………..
$900,000
Variable costs (4,500 x $140) ………………………………………………………
$1,200,000
$1,400,000
Sales
1176
Problem 21-4A (75 minutes)
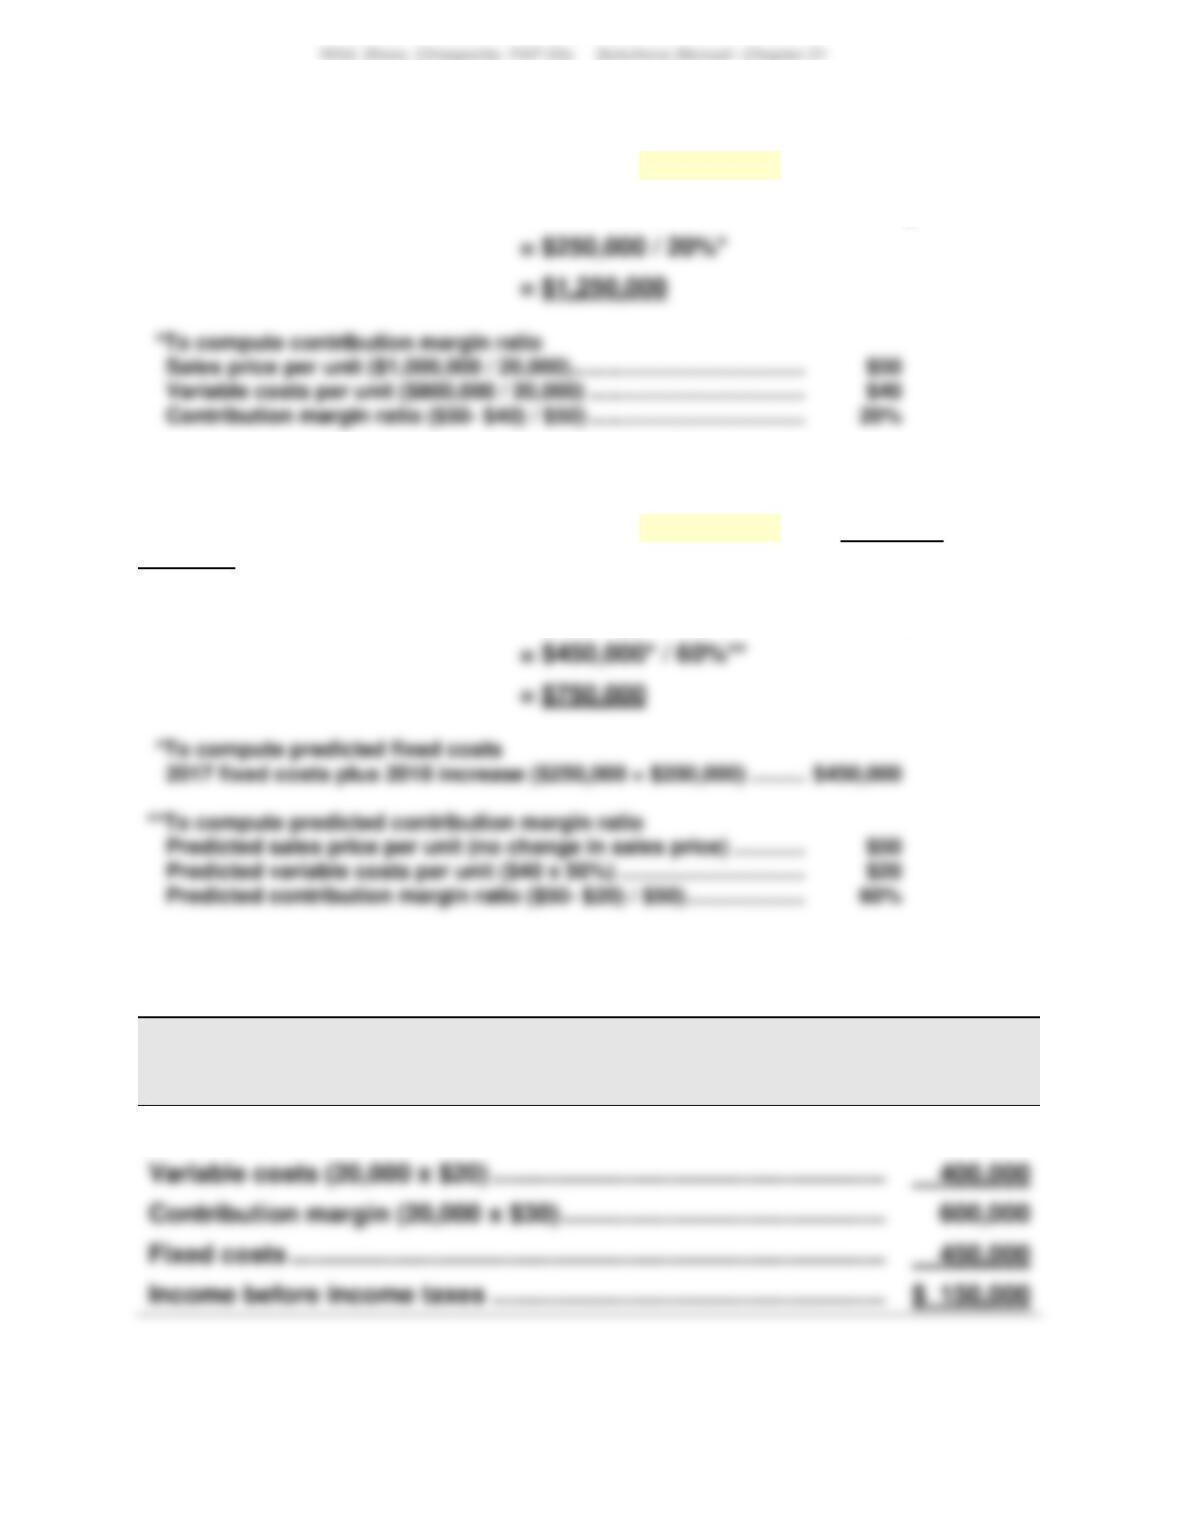
Part 1 Instructor note: Use the equation in Exhibit 21.12
2017 break-even in sales dollars = Fixed costs / Contribution margin ratio
Part 2 Instructor note: Use the equation in Exhibit 21.12 with predicted
numbers
2018 break-even in sales dollars = Fixed costs / Contribution margin ratio
Part 3
ASTRO COMPANY
Forecasted Contribution Margin Income Statement
For Year Ended December 31, 2018
Sales (20,000 x $50) ……………………………………………………….………..
$1,000,000
Income before income taxes ……………………………………………………
1177
Problem 21-4A (Continued)
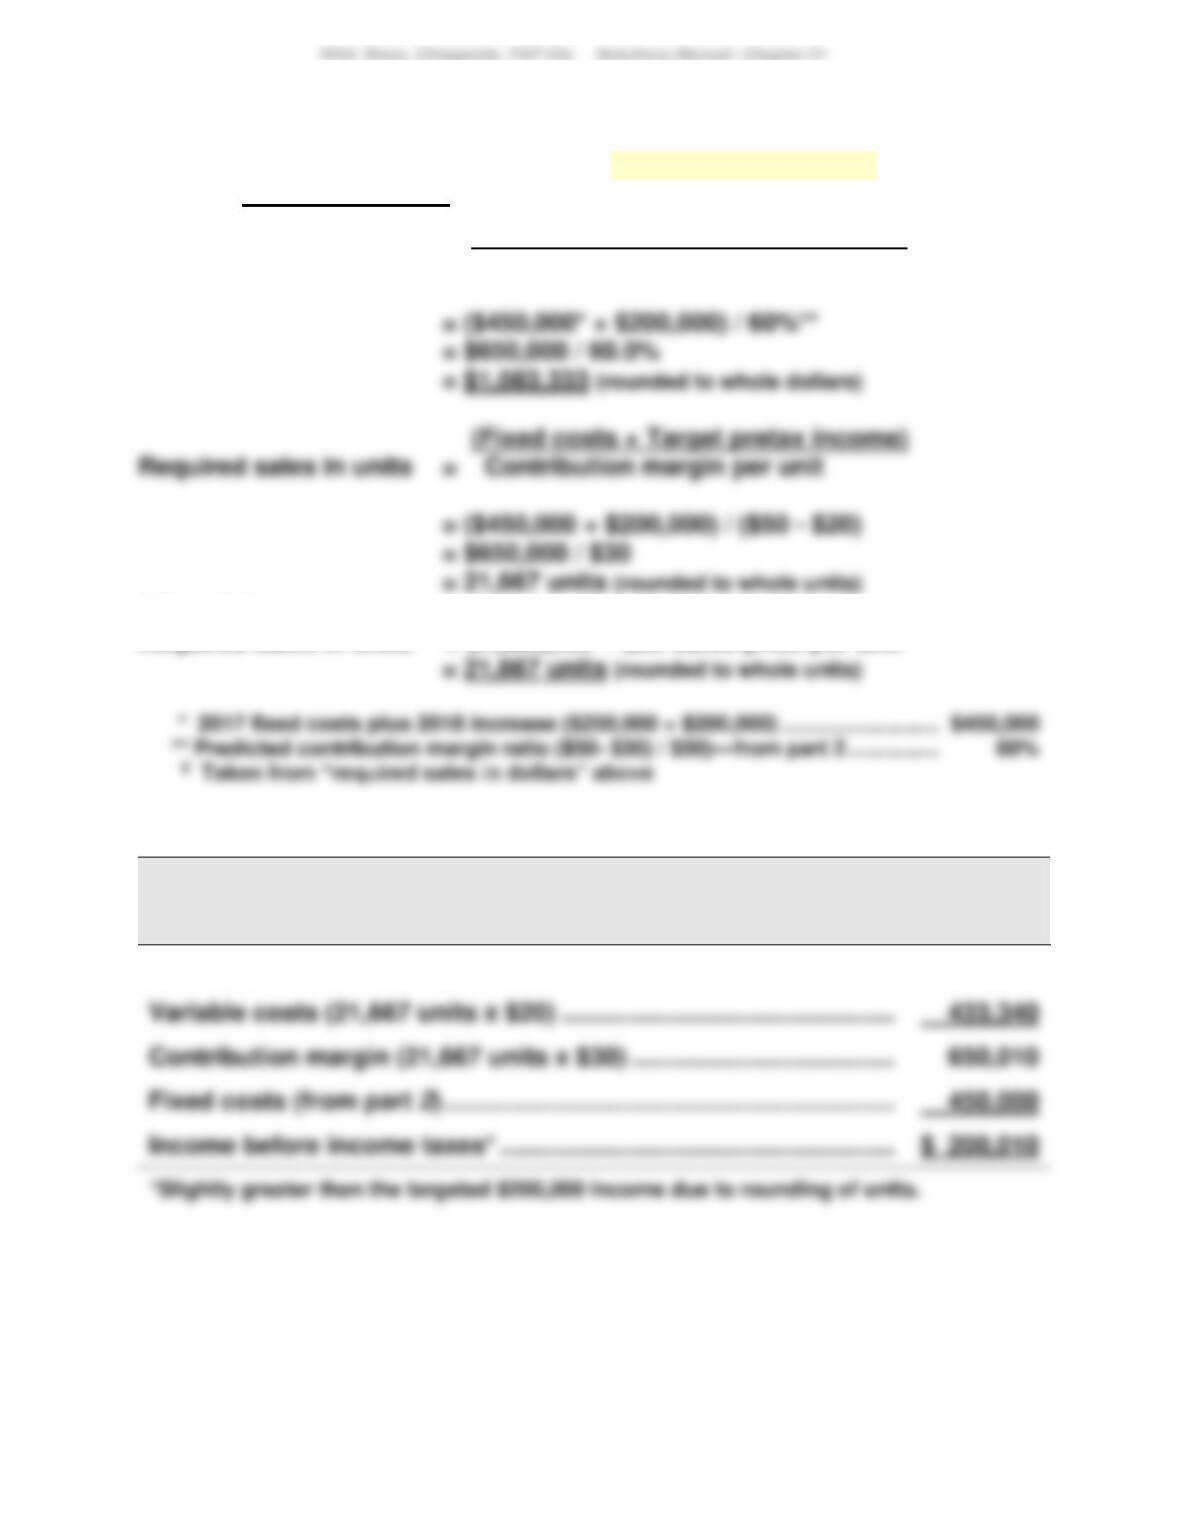
Part 4 Instructor note: Use equations in Exhibits 21.22 and 21.23 with
predicted numbers
(Fixed costs + Target pretax income)
Required sales in dollars = Contribution margin ratio
Alternately:
Required sales in units = $1,083,333† / $50 Sales price per unit
Part 5
ASTRO COMPANY
Forecasted Contribution Margin Income Statement
For Year Ended December 31, 2018
Sales (21,667 units x $50) ……………………………………………………….
$1,083,350
Fixed costs (from part 2) ……………………………………………………………
Income before income taxes* …………………………………………………….
Problem 21-5A (65 minutes)
Part 1 Instructor note: Use the equation in Exhibit 21.12
Break-even in dollar sales = Fixed costs / Contribution margin ratio
Product T:
= $125,000 / 20%*
*To compute contribution margin ratio
Sales price per unit
Product T ($2,000,000 / 50,000) ……………………………………………………….
__T__
$40
__O__
Part 2
Forecasted contribution margin income statements for each product
assuming sales declines to 30,000 units with no change in unit sales price
HENNA CO.
Forecasted Contribution Margin Income Statement
Product T
Product O
Sales* …………………………………………………………………
$1,200,000
$1,200,000
Variable costs** …………………………………………………..
960,000
150,000
Fixed costs ……………………………………………………….
125,000
36,800
1179
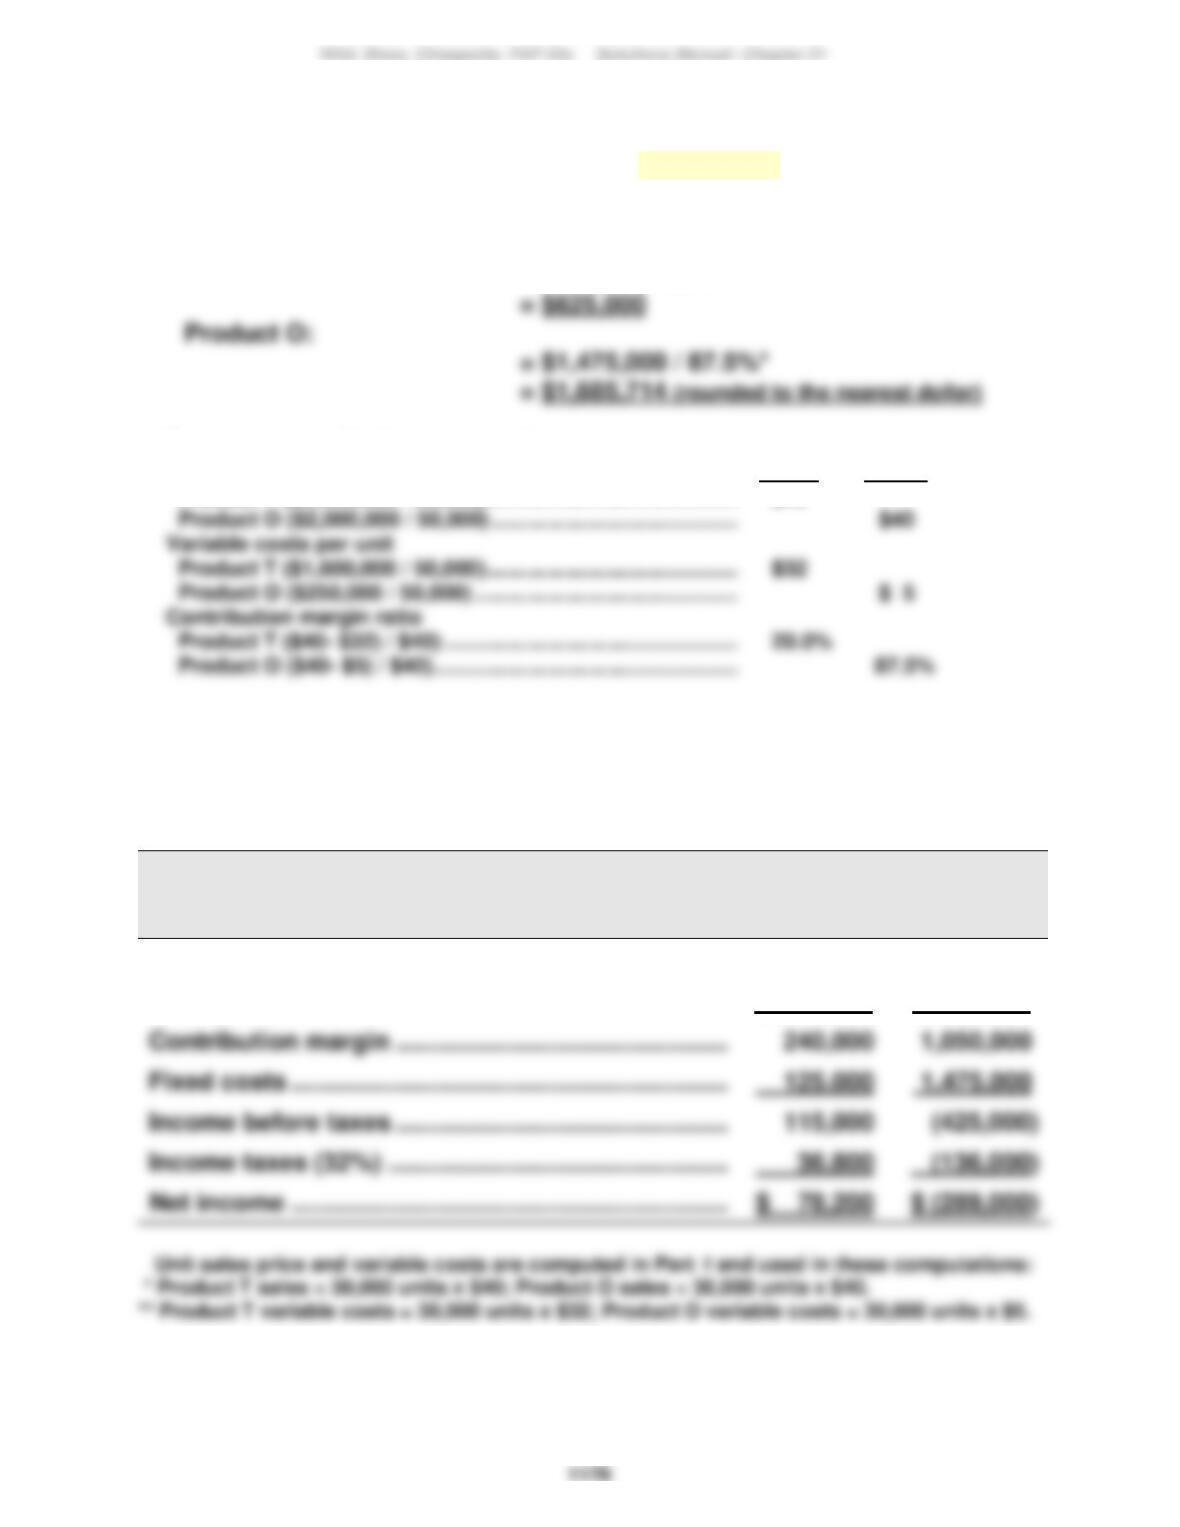
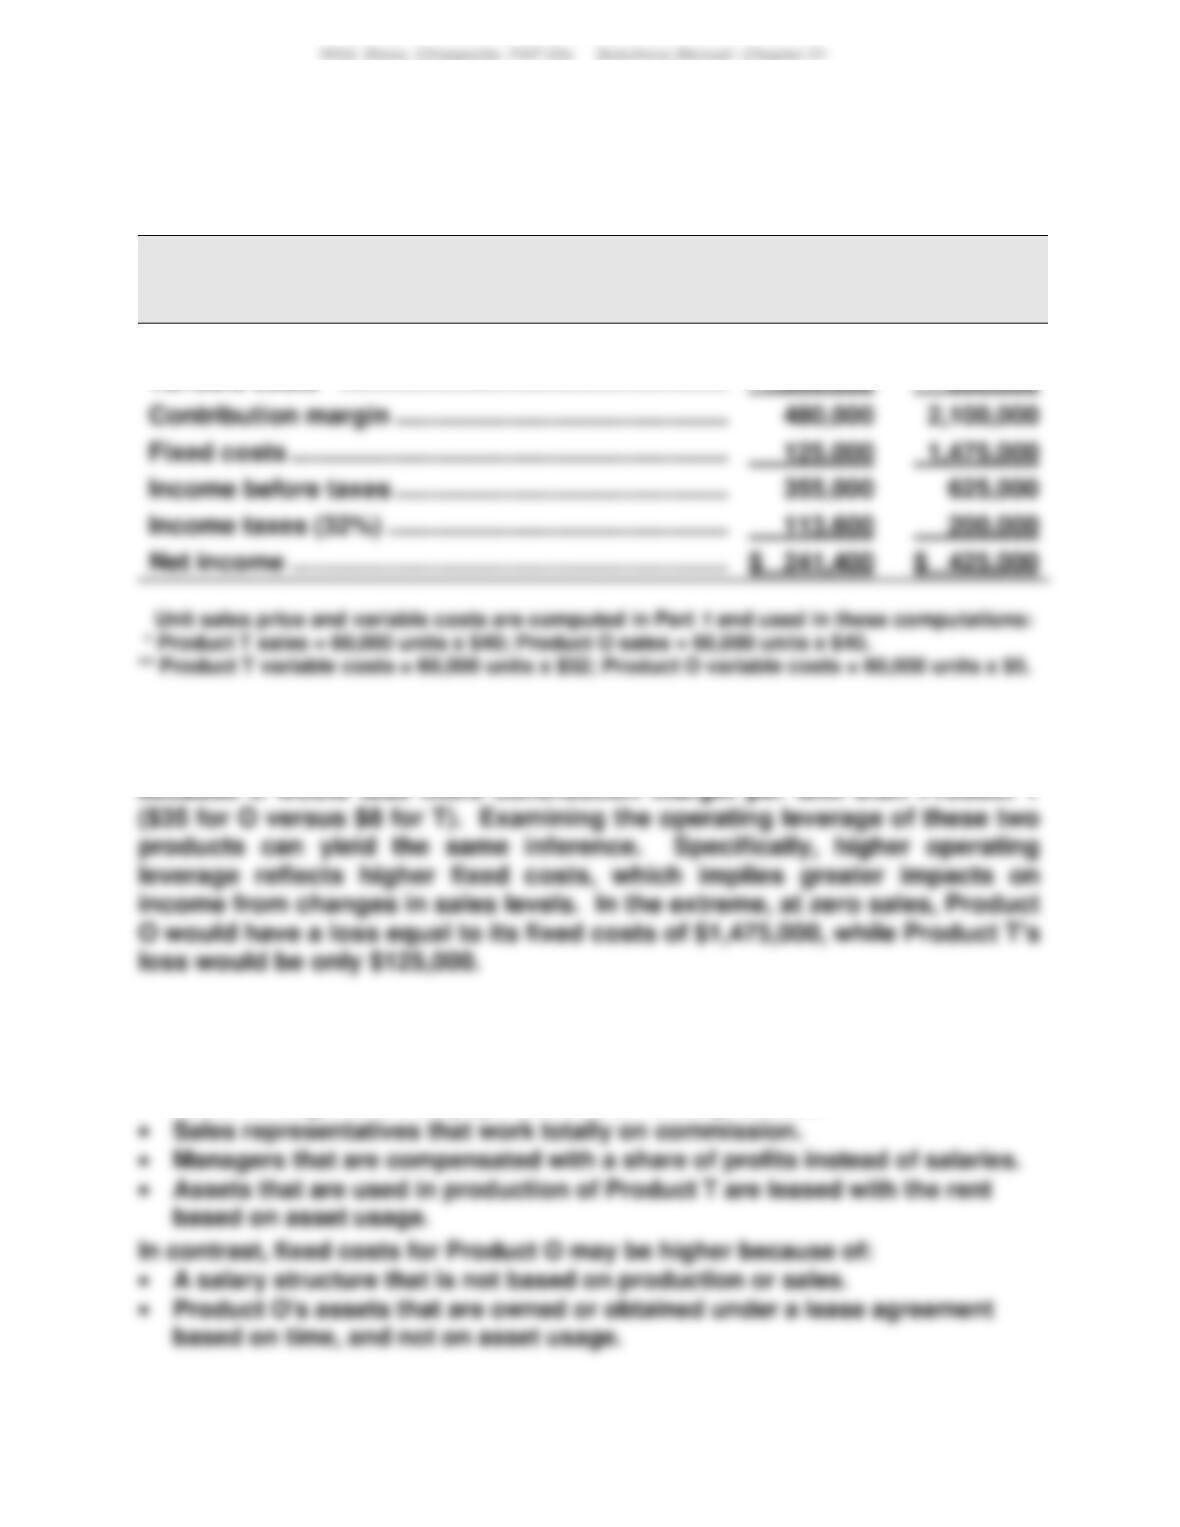
Problem 21-5A (Continued)
Part 3 Forecasted contribution margin income statements for each product
assuming sales increase to 60,000 units with no change in unit sales price
HENNA CO.
Forecasted Contribution Margin Income Statement
Product T
Product O
Sales* …………………………………………………………………
$2,400,000
$2,400,000
Variable costs** …………………………………………………..
1,920,000
300,000
Fixed costs ……………………………………………………….
125,000
1,475,000
Income before taxes ……………………………………………
113,600
200,000
Part 4
If sales were to greatly decrease, Product O would suffer the greater loss
Part 5
Factors that could cause Product T to have lower fixed costs might include:
• Labor arrangement that pays workers for units produced.
1180
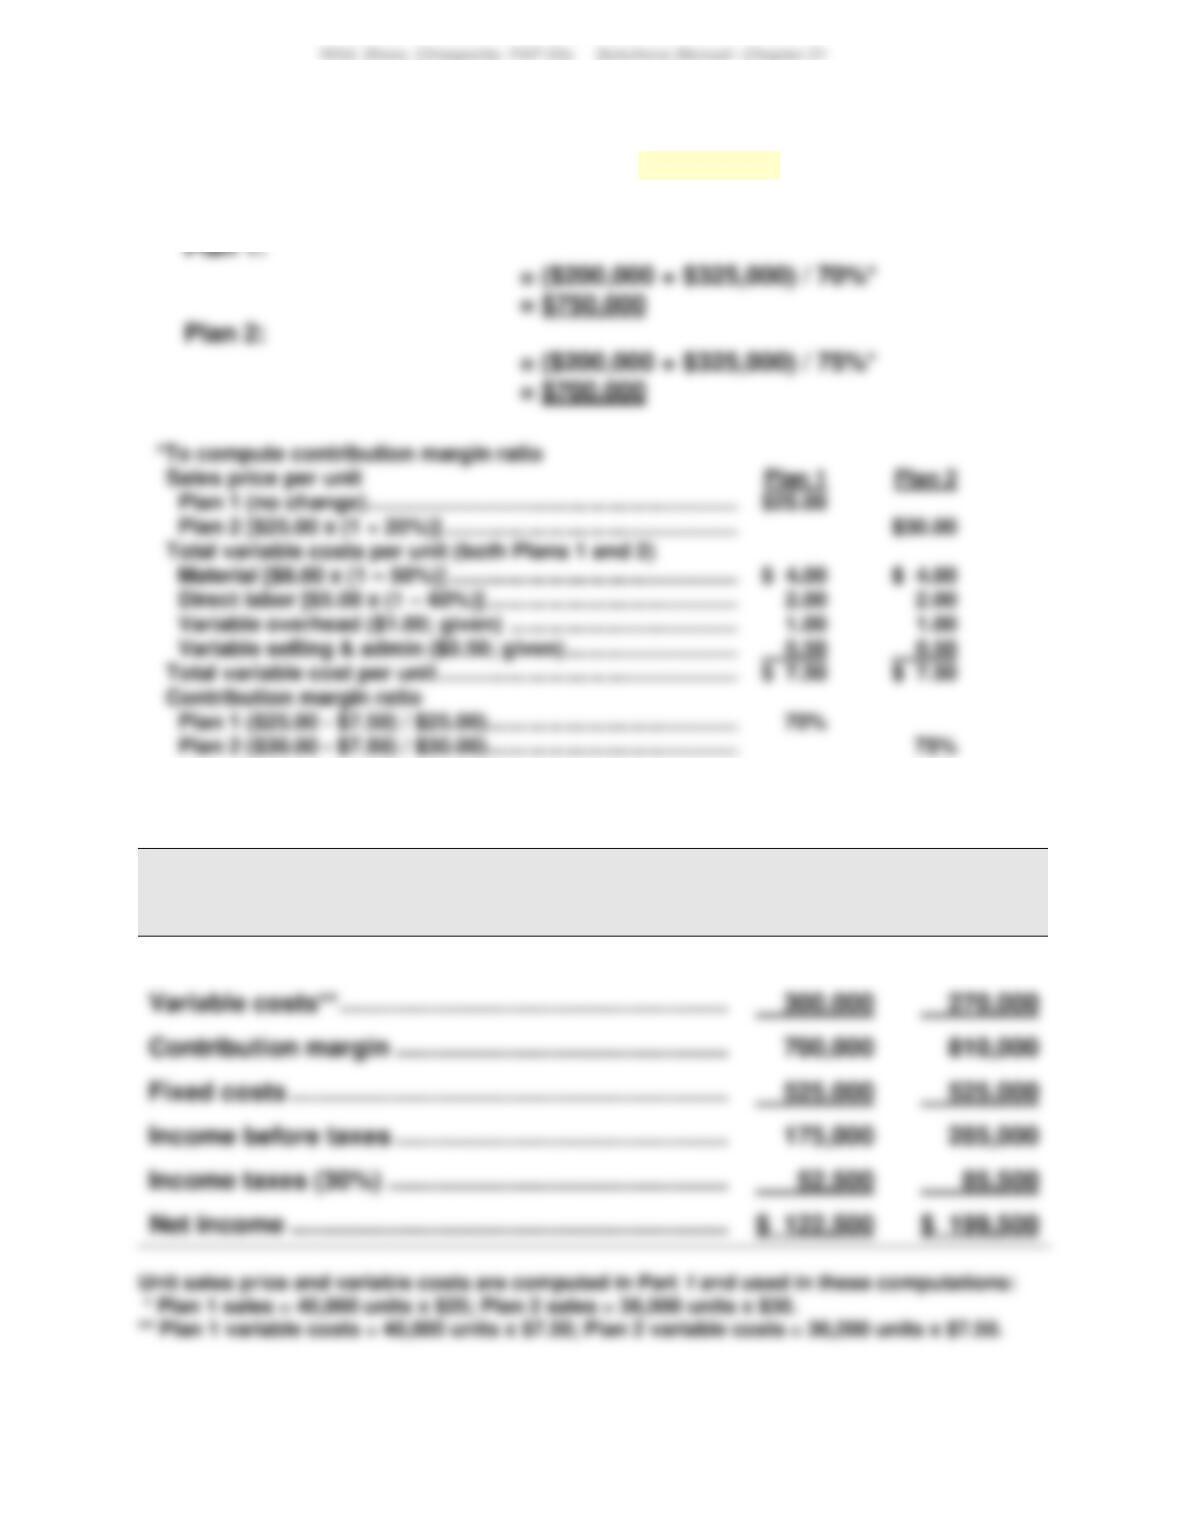
Problem 21-6A (45 minutes)
Part 1 Instructor note: Use the equation in Exhibit 21.12
Break-even in dollar sales = Fixed costs / Contribution margin ratio
Part 2
BURCHARD CO.
Forecasted Contribution Margin Income Statement
Plan 1
Plan 2
Sales* …………………………………………………………………
$1,000,000
$1,080,000
Problem 21-7A (50 minutes)
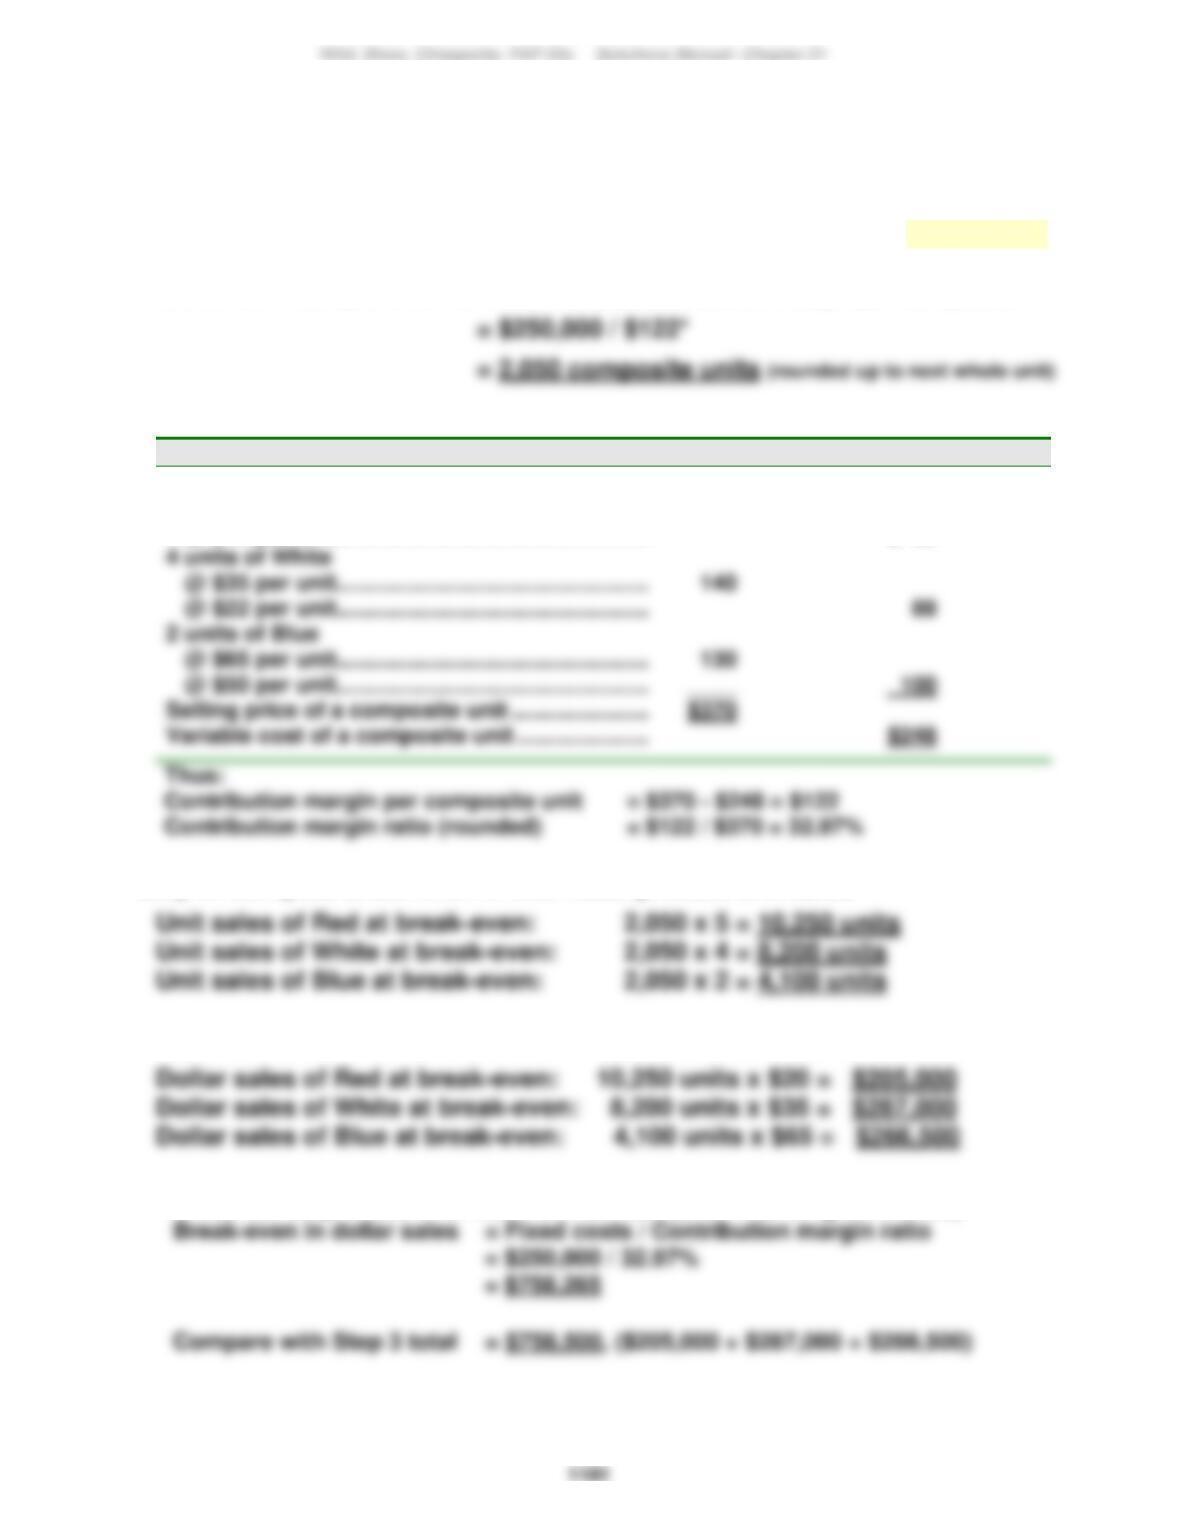
Part 1 BREAK–EVEN ANALYSIS ASSUMING USE OF SAME MATERIALS
Step 1: Compute break-even in composite units—Use equation in Exhibit 21.29
Break-even in composite units = Fixed costs/Contribution margin per composite unit
*To compute the contribution margin per composite unit
Unit Sales Price
Unit Variable Costs
5 units of Red
@ $20 per unit…………………………………………..
@ $12 per unit…………………………………………..
$100
$ 60
2 units of Blue
Step 2: Compute break-even in individual product unit sales
Step 3: Compute break-even in individual product dollar sales
Crossfoot Step 3 total with that from formula ($235 rounding difference):
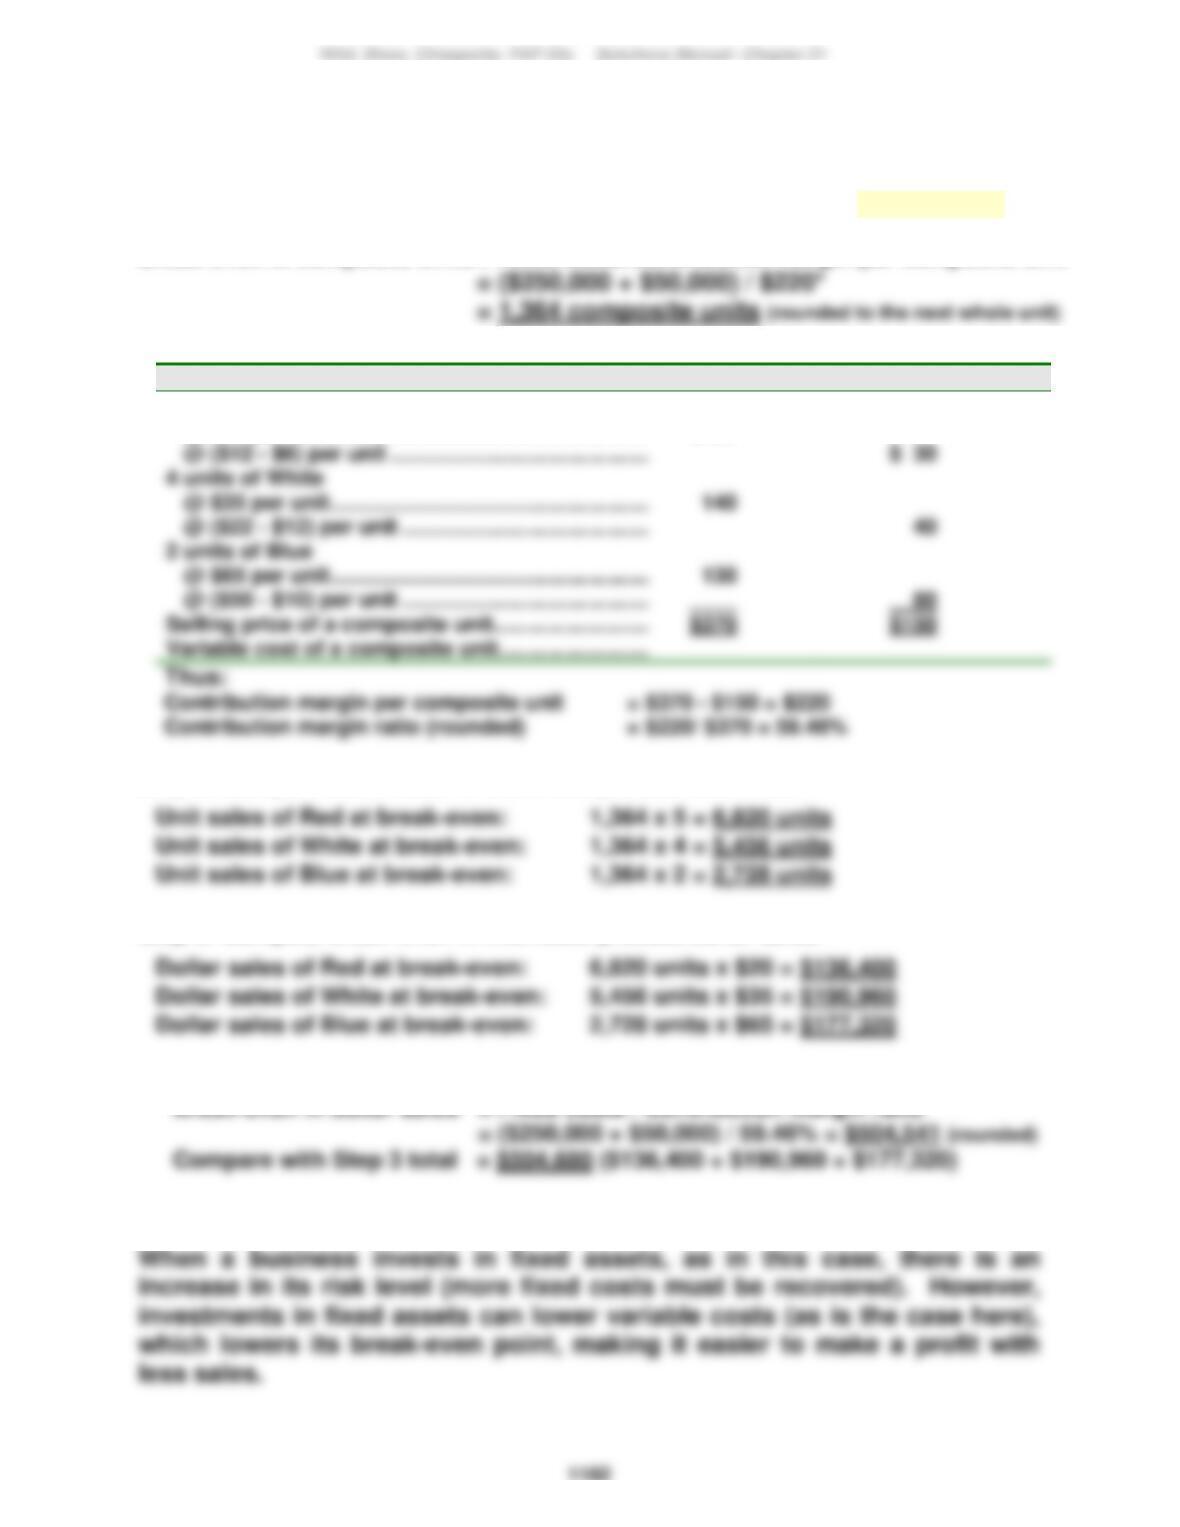
Problem 21-7A (Continued)
Part 2 BREAK–EVEN ANALYSIS ASSUMING USE OF NEW MATERIALS
Step 1: Compute break-even in composite units—Use equation in Exhibit 21.29
Break-even in composite units = Fixed costs/Contribution margin per composite unit
*To compute the contribution margin per composite unit
Unit Sales Price
Unit Variable Costs
4 units of White
5 units of Red
@ $20 per unit ……………………………………………..
$100
Step 2: Compute break-even in individual product unit sales
Step 3: Compute break-even in individual product dollar sales
Crossfoot Step 3 total with that from formula ($139 rounding difference):
Part 3
Wild, Shaw, Chiappetta, FAP 23e Solutions Manual: Chapter 21
1183
PROBLEM SET B
Problem 21-1B (25 minutes)
Parts 1 and 2
Gilmore Company
Contribution Margin Income Statement
For Year Ended December 31, 2017
(12,000 units) Per unit % of sales
Sales ($18 x 12,000) ………………………..
$216,000
$18.000
100.00%
Variable costs
Plastic for CD sets ………………………..
$ 1,500
$0.125
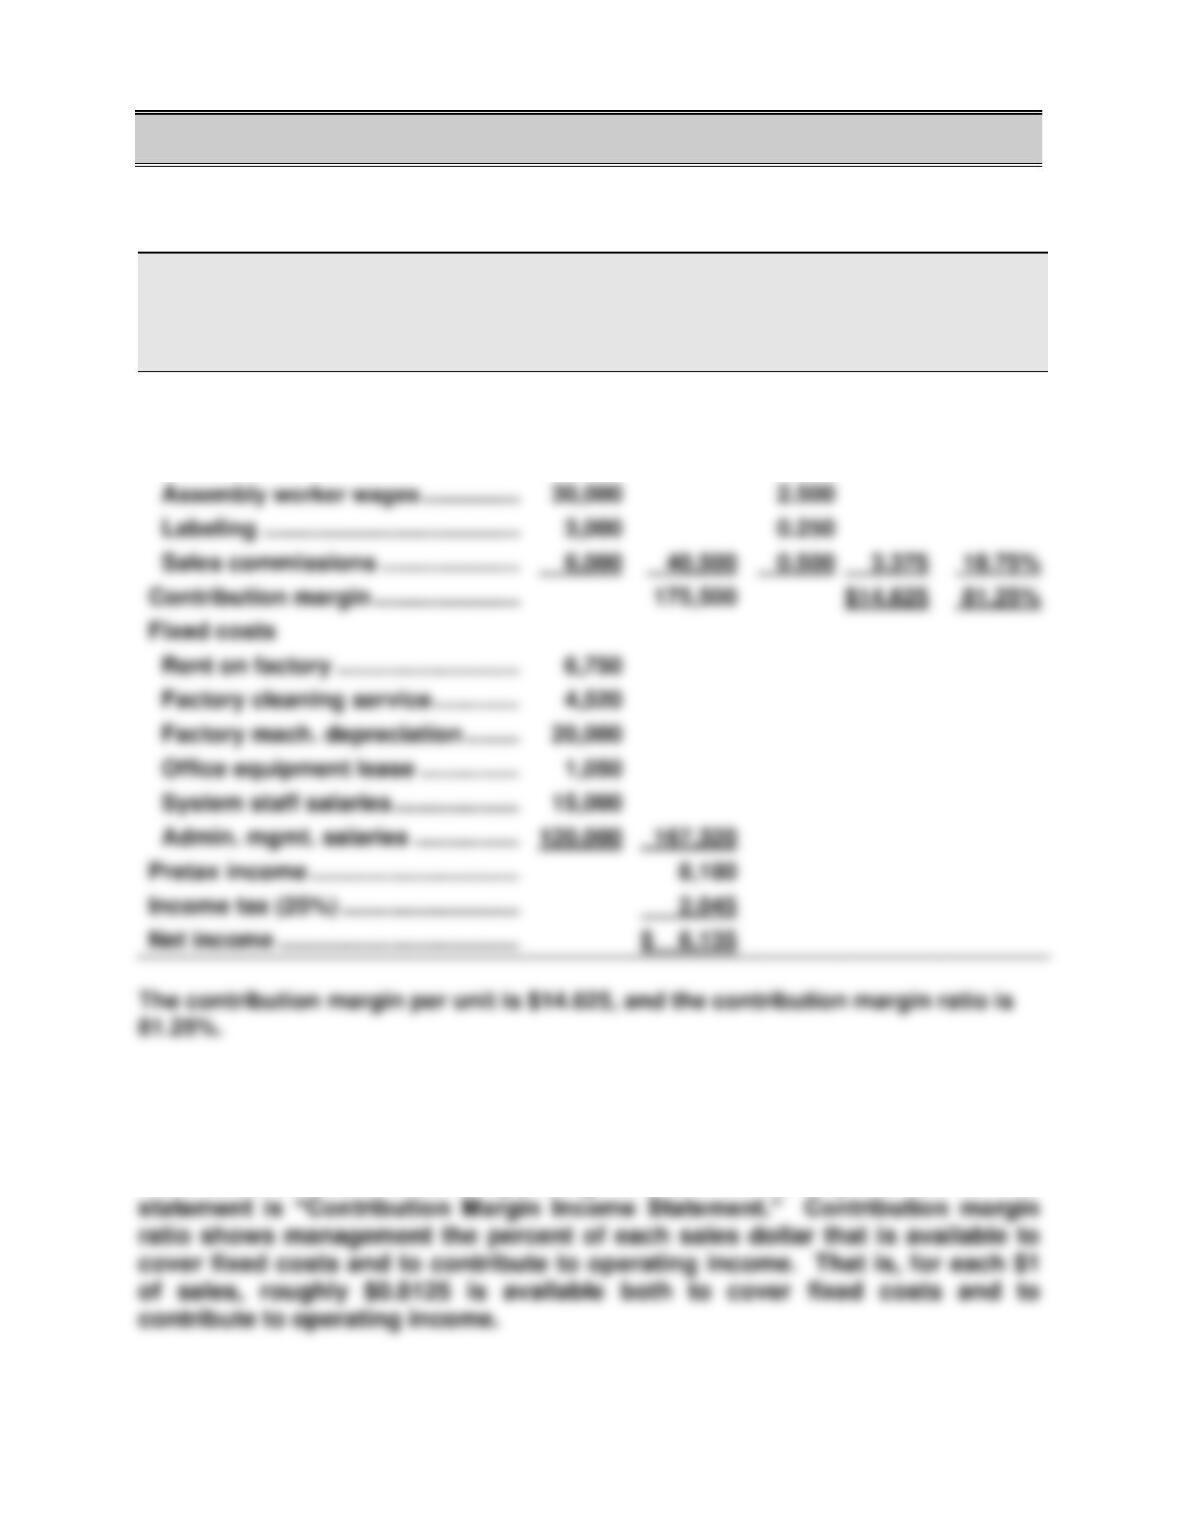
Part 3 Analysis Component
Contribution margin shows how much of total sales are available to cover
fixed costs and contribute to operating income. This is why the title for this
Assembly worker wages …………………
Sales commissions ………………………
Contribution margin ……………………….
$14.625
Fixed costs
Pretax income ………………………………….
Income tax (25%) …………………………..
Net income ………………………………………