1. Total variable costs change in proportion to changes in the level of activity. Unit variable
costs remain the same regardless of the level of activity.
2. a. Variable costs
b. Variable costs
3. Total fixed cost remains the same regardless of changes in the level of activity. Fixed cost per unit
decreases as the activity level increases and increases as the activity level decreases.
5. a. No impact on the contribution margin.
b
7. Decreases in unit variable costs, such as a decrease in the unit cost of direct materials, will
decrease the break-even point.
8. Austin Company had lower fixed costs and a higher percentage of variable costs to sales than
did Hill Company. Such a situation resulted in a lower break-even point for Austin Company.
9. The individual products are treated as components of one overall enterprise product. These
components are weighted by the sales mix percentages when determining the contribution
margin. Therefore, the sales mix affects the contribution margin and thus the break-even
p
oint.
CHAPTER 21
COST-VOLUME-PROFIT ANALYSIS
DISCUSSION QUESTIONS
CHAPTER 21 Cost-Volume-Profit Analysis
PE 21-1A
PE 21-1B
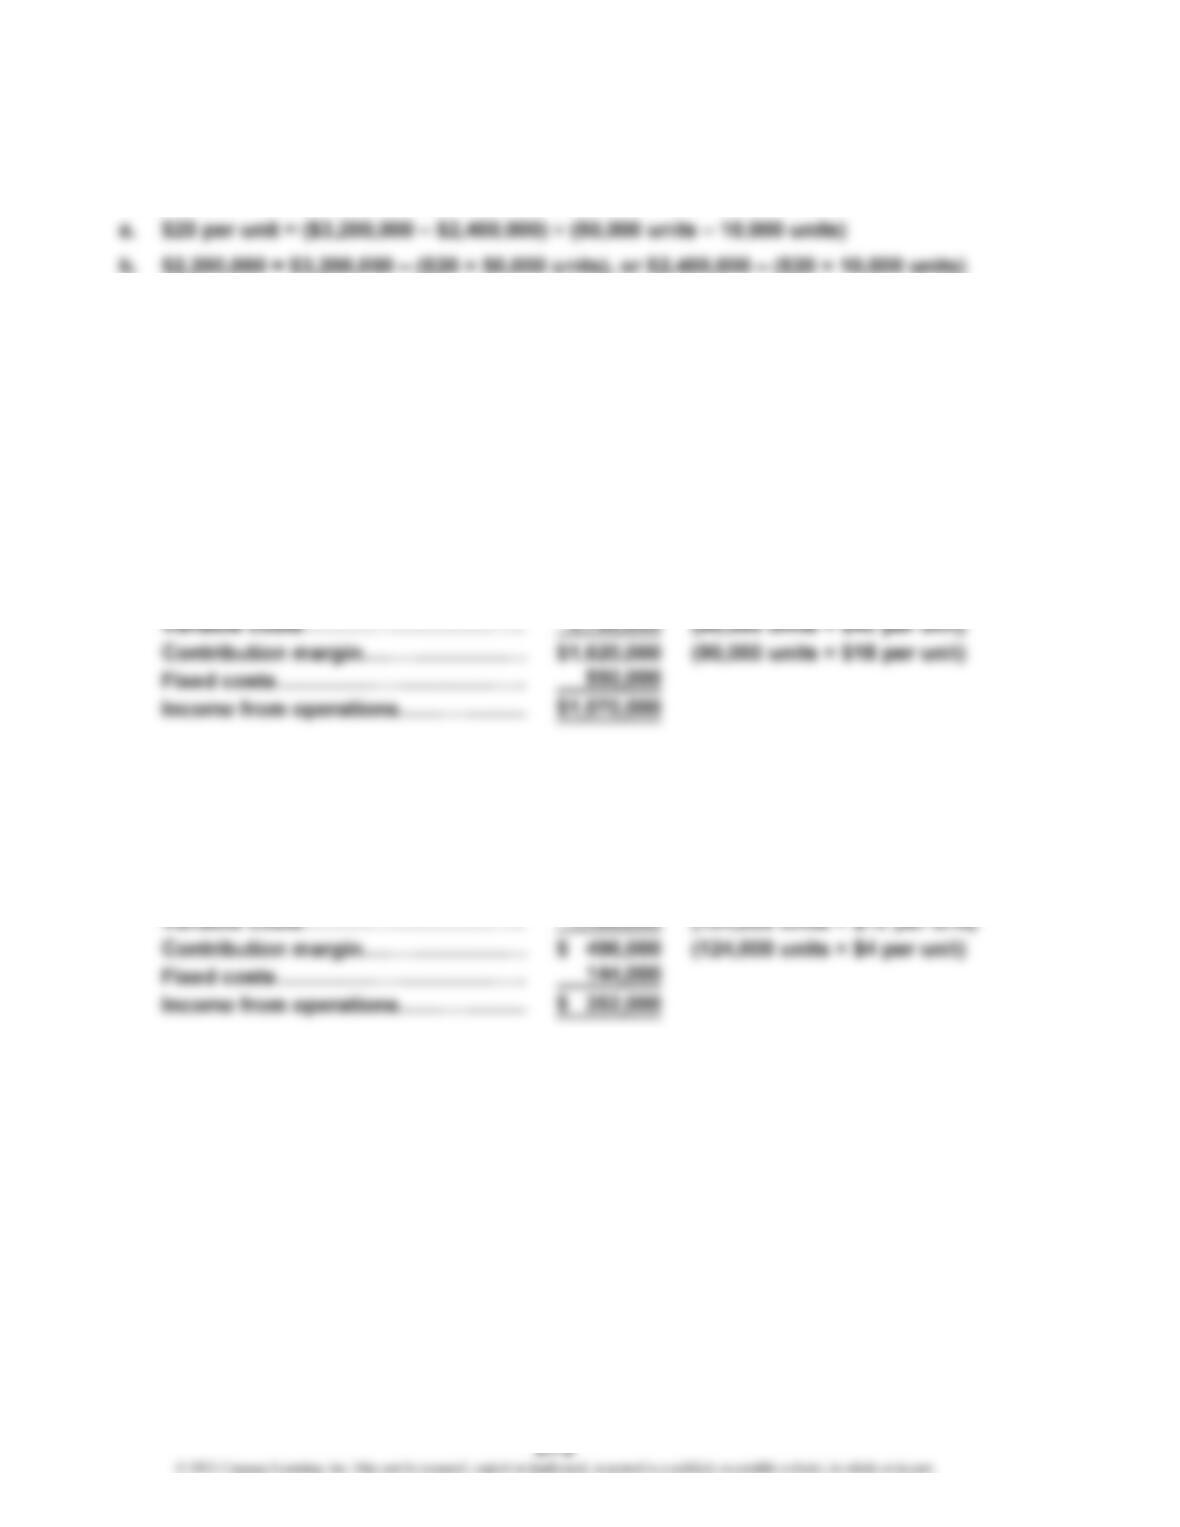
a. $16 per unit = ($551,000 – $495,000) ÷ (6,600 units – 3,100 units)
b. $445,400 = $551,000 – ($16 × 6,600 units), or $495,000 – ($16 × 3,100 units)
PE 21-2A
a. 30.0% = ($60 – $42) ÷ $60, or ($5,400,000 – $3,780,000) ÷ $5,400,000
b. $18 per unit = $60 – $42
c. Sales……………………………………… $5,400,000 (90,000 units × $60 per unit)
PE 21-2B
a. 25% = ($16 – $12) ÷ $16, or ($1,984,000 – $1,488,000) ÷ $1,984,000
b. $4 per unit = $16 – $12
c. Sales……………………………………… $1,984,000 (124,000 units × $16 per unit)
PRACTICE EXERCISES
CHAPTER 21 Cost-Volume-Profit Analysis
PE 21-3A
PE 21-3B
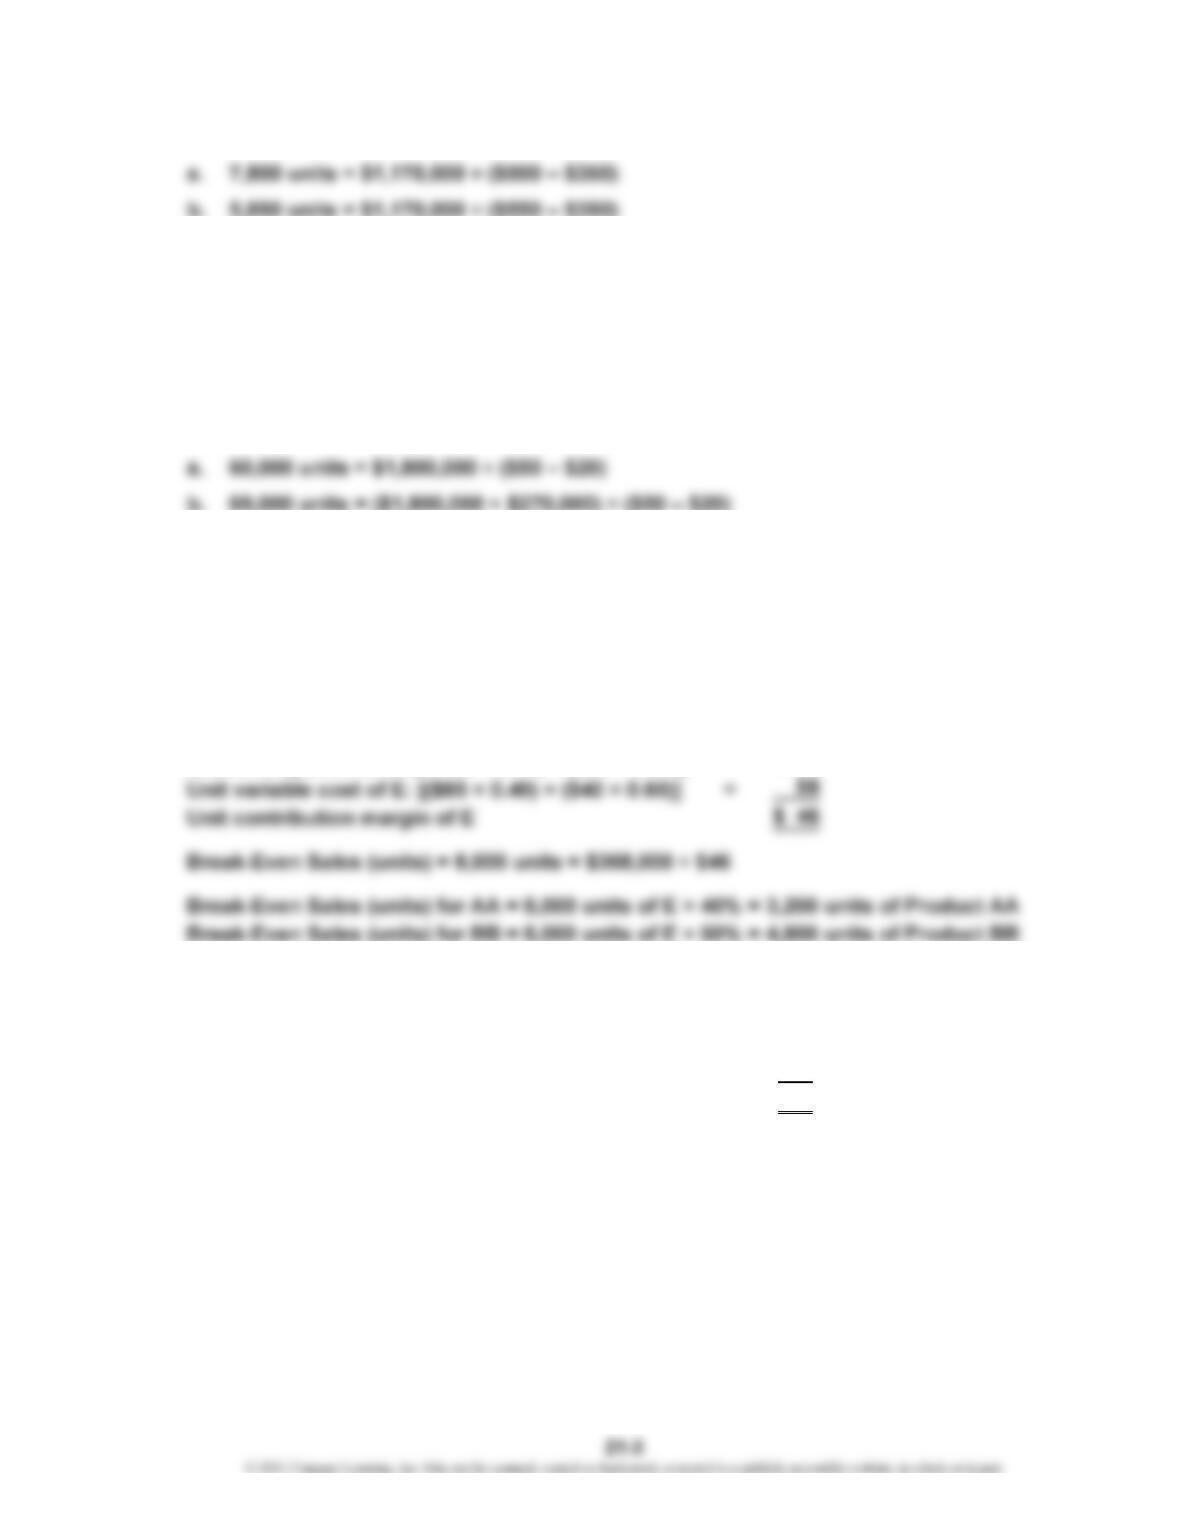
a. 2,600 units = $65,000 ÷ ($90 – $65)
b. 1,625 units = $65,000 ÷ ($105 – $65)
PE 21-4A
PE 21-4B
a. 3,600 units = $180,000 ÷ ($220 – $170)
b. 4,720 units = ($180,000 + $56,000) ÷ ($220 – $170)
PE 21-5A
Unit selling price of E: [($125 × 0.40) + ($90 × 0.60)] = $104
PE 21-5B
Unit selling price of E: [($40 × 0.70) + ($60 × 0.30)] = $46
Unit variable cost of E: [($15 × 0.70) + ($25 × 0.30)] = 18
Unit contribution margin of E $28
Break-Even Sales (units) = 16,400 units = $459,200 ÷ $28
Break-Even Sales (units) for QQ = 16,400 units of E × 70% = 11,480 units of Product QQ
Break-Even Sales (units) for ZZ = 16,400 units of E × 30% = 4,920 units of Product ZZ
CHAPTER 21 Cost-Volume-Profit Analysis
PE 21-6A
PE 21-6B
Contribution Margin $352,000
Income from Operations $220,000
PE 21-7A
PE 21-7B
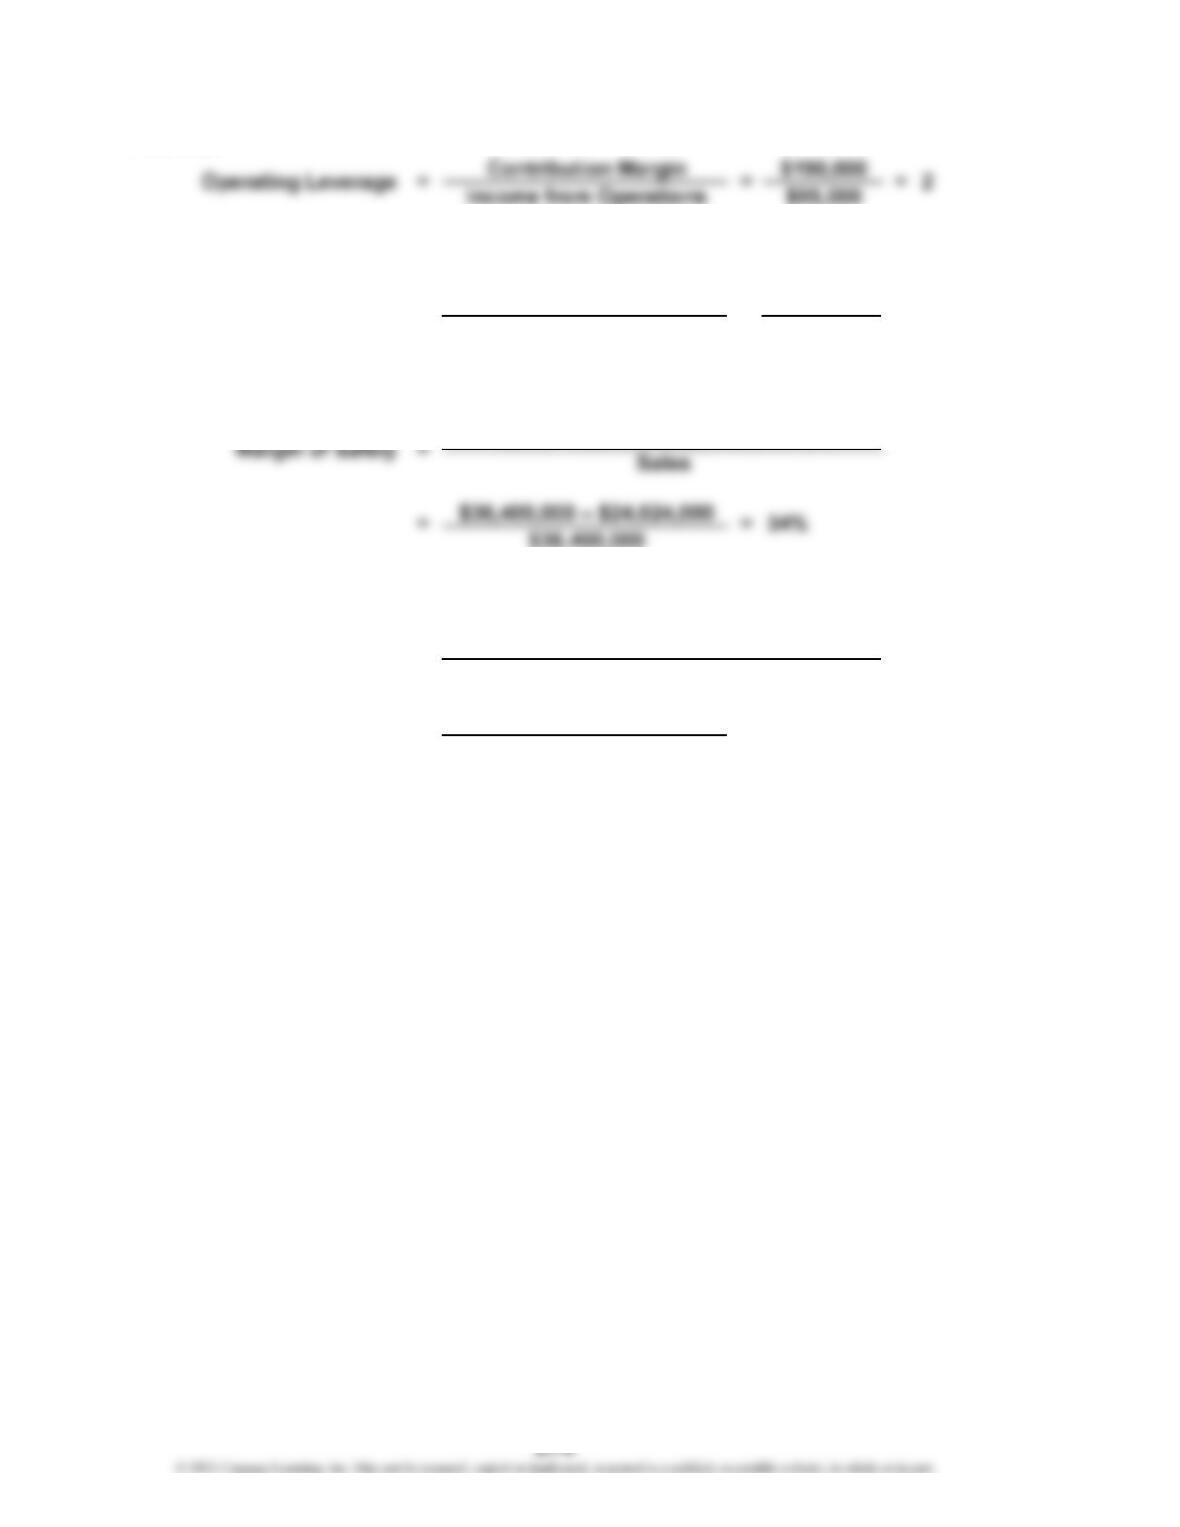
= $740,000 – $547,600
$740,000 = 26%
Operating Leverage
Margin of Safety = Sales – Sales at Break-Even Point
Sales
= = = 1.6
CHAPTER 21 Cost-Volume-Profit Analysis
Ex. 21-1
1. Variable 9. Variable
2. Fixed 10. Variable
3. Variable 11. Mixed
4. Variable 12. Mixed
Ex. 21-2
a. Cost Graph Four d. Cost Graph One
Ex. 21-3
1. a 4. f
2. c 5. b
3. e 6. d
Ex. 21-4
1. e
2. f
EXERCISES
CHAPTER 21 Cost-Volume-Profit Analysis
Ex. 21-5
a. Variable f. Fixed
b. Variable g. Fixed*
c. Fixed h. Fixed
Ex. 21-6
Components produced……………
…
45,000 60,000 75,000
Total costs:
Total variable costs……………
…
$1,350,000 (d) $1,800,000 (j) $2,250,000
Total fixed costs………………… 810,000 (e) 810,000 (k) 810,000
Total costs………………………
…
$2,160,000 (f) $2,610,000 (l) $3,060,000
Cost per unit:
V
ariable cost per unit…………
…
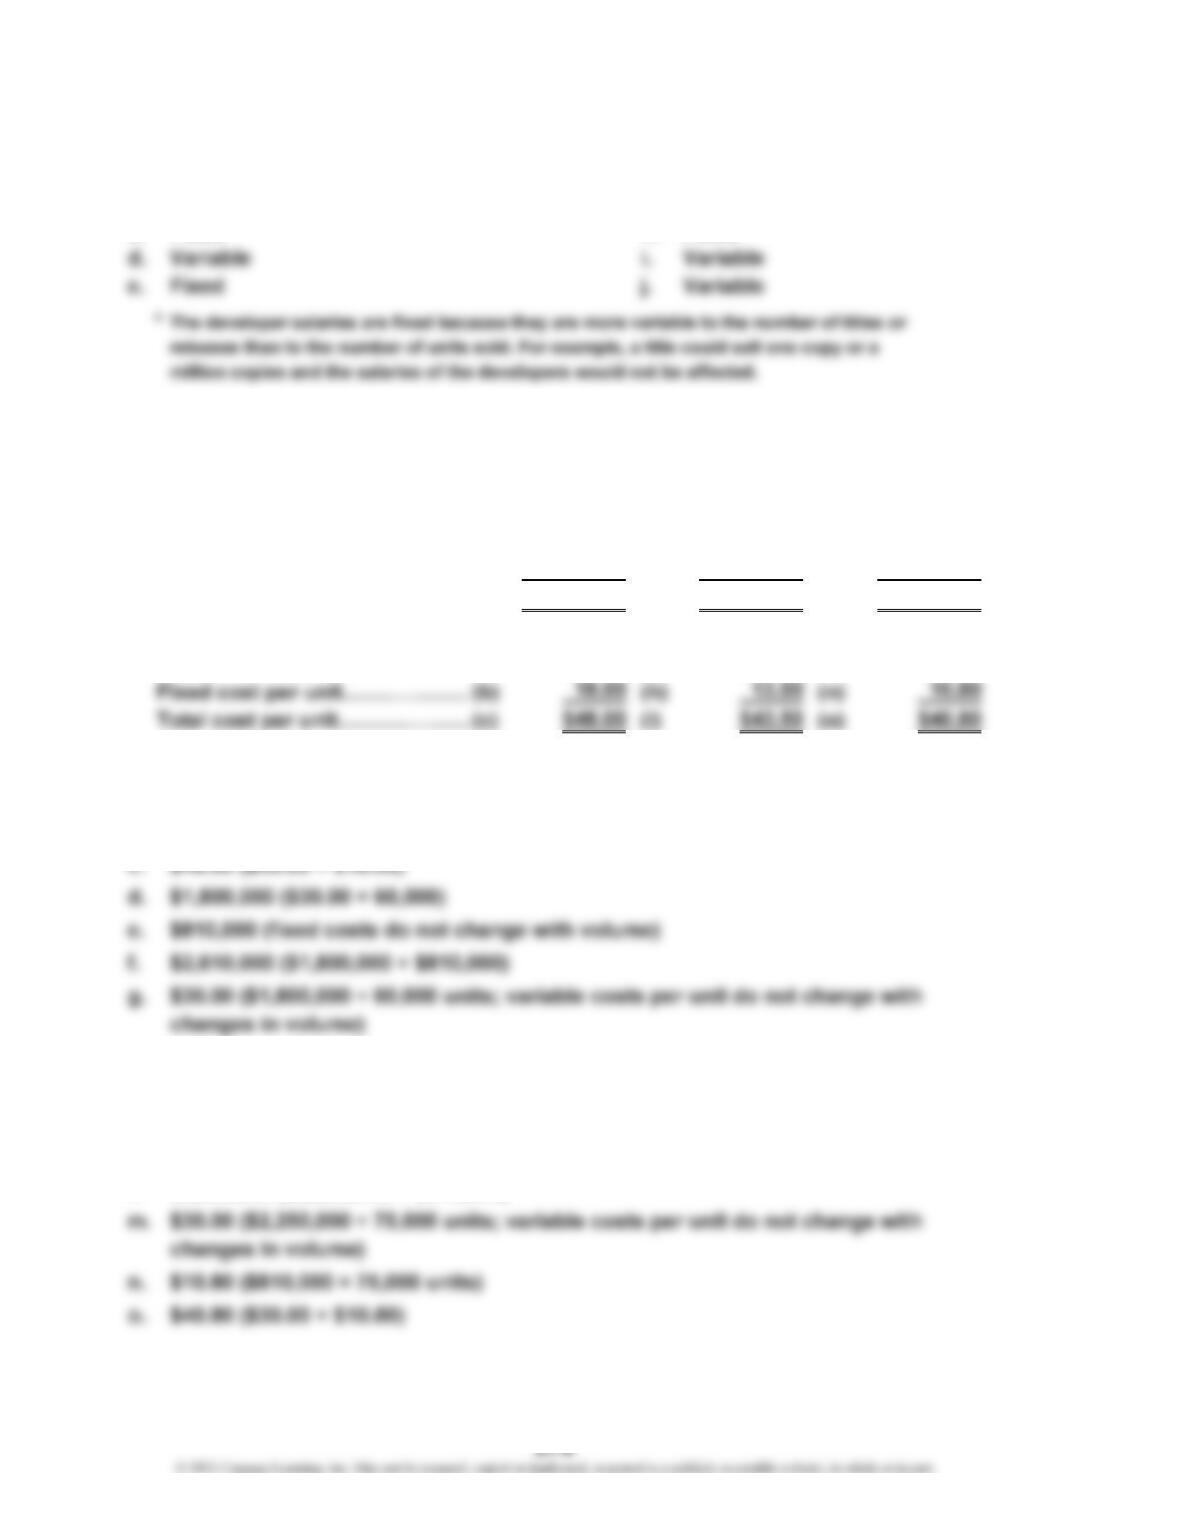
(a) $30.00 (g) $30.00 (m) $30.00
Supporting calculations:
a. $30.00 ($1,350,000 ÷ 45,000 units)
b. $18.00 ($810,000 ÷ 45,000 units)
h. $13.50 ($810,000 ÷ 60,000 units)
i.
j. $2,250,000 ($30.00 × 75,000 units)
k. $810,000 (fixed costs do not change with volume)
l.
$43.50 ($30.00 + $13.50)
$3,060,000 ($2,250,000 + $810,000)
CHAPTER 21 Cost-Volume-Profit Analysis
Ex. 21-7
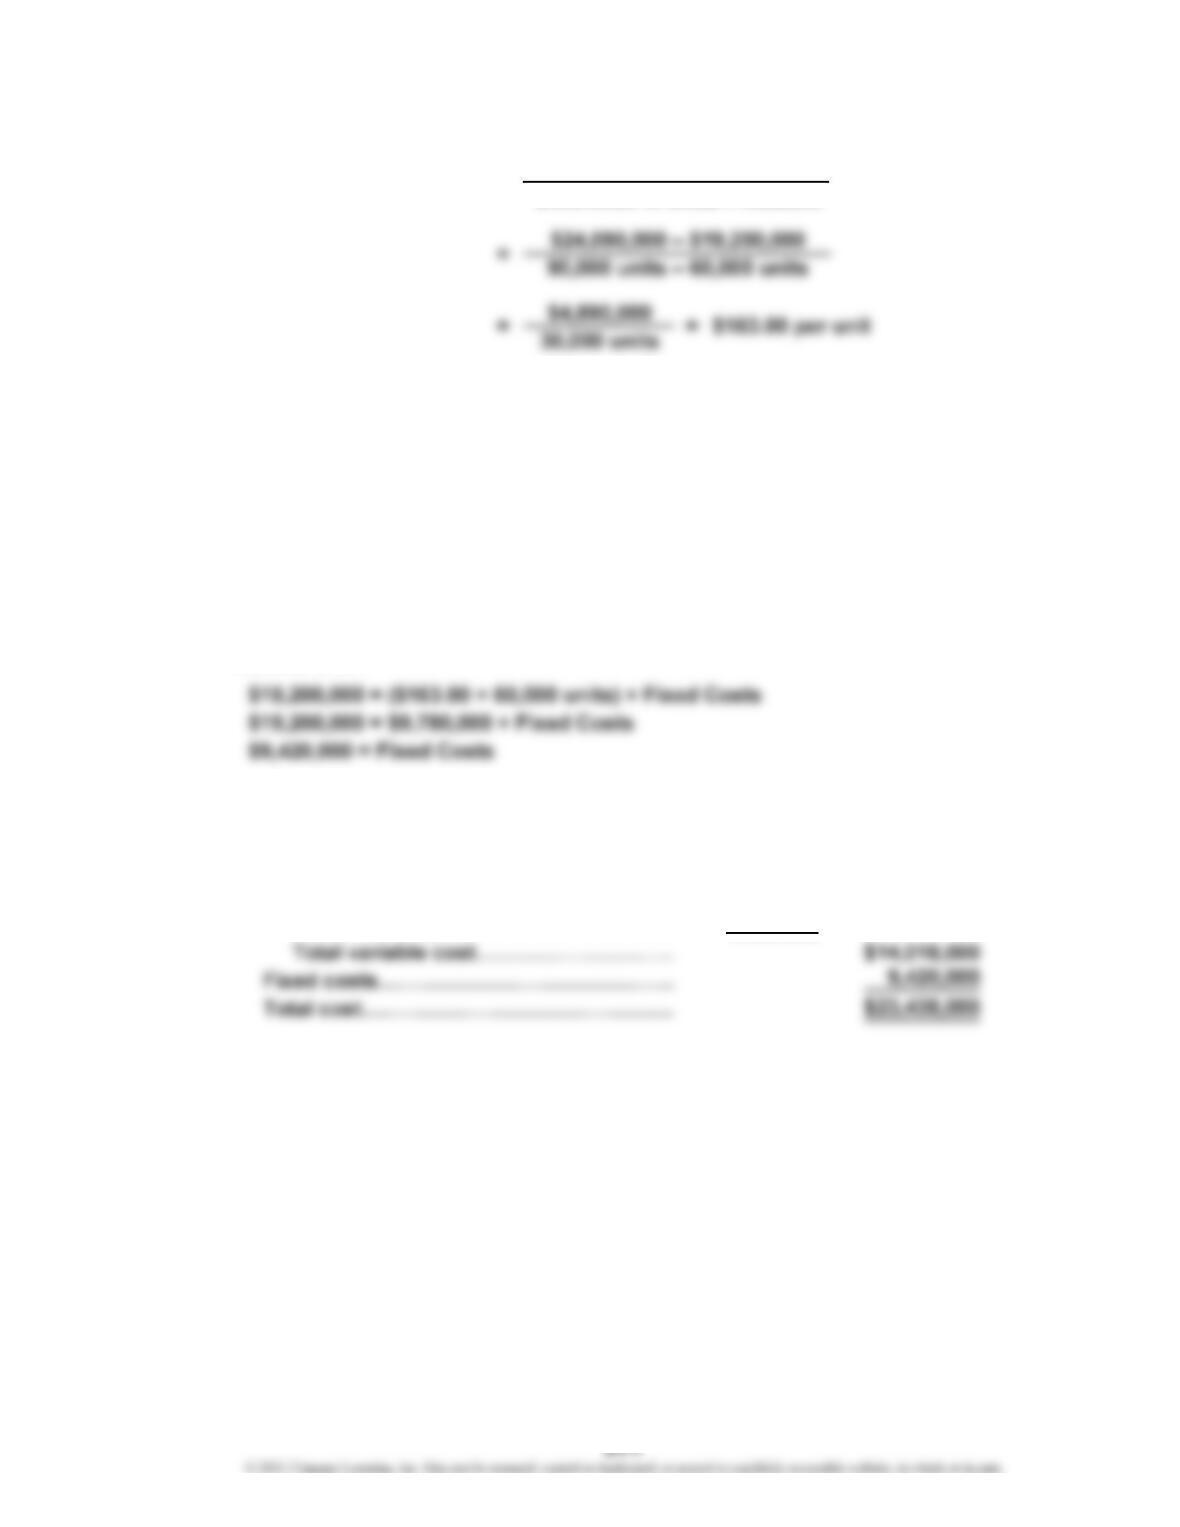
The fixed cost can be determined by subtracting the estimated total variable
cost from the total cost at either the highest or lowest level of production, as
follows:
Total Cost = (Variable Cost per Unit × Units Produced) + Fixed Costs
Highest level:
$24,090,000 = ($163.00 × 90,000 units) + Fixed Costs
$24,090,000 = $14,670,000 + Fixed Costs
$9,420,000 = Fixed Costs
Lowest level:
b. Total Cost = (Variable Cost per Unit × Units Produced) + Fixed Costs
Total cost for 86,000 units:
Variable cost:
Units………………………………………
…
86,000
V
ariable cost per unit……………………
…
$163.00
=Variable Cost per Unita.
Difference in Total Costs
Difference in Units Produced
×
CHAPTER 21 Cost-Volume-Profit Analysis
Ex. 21-8
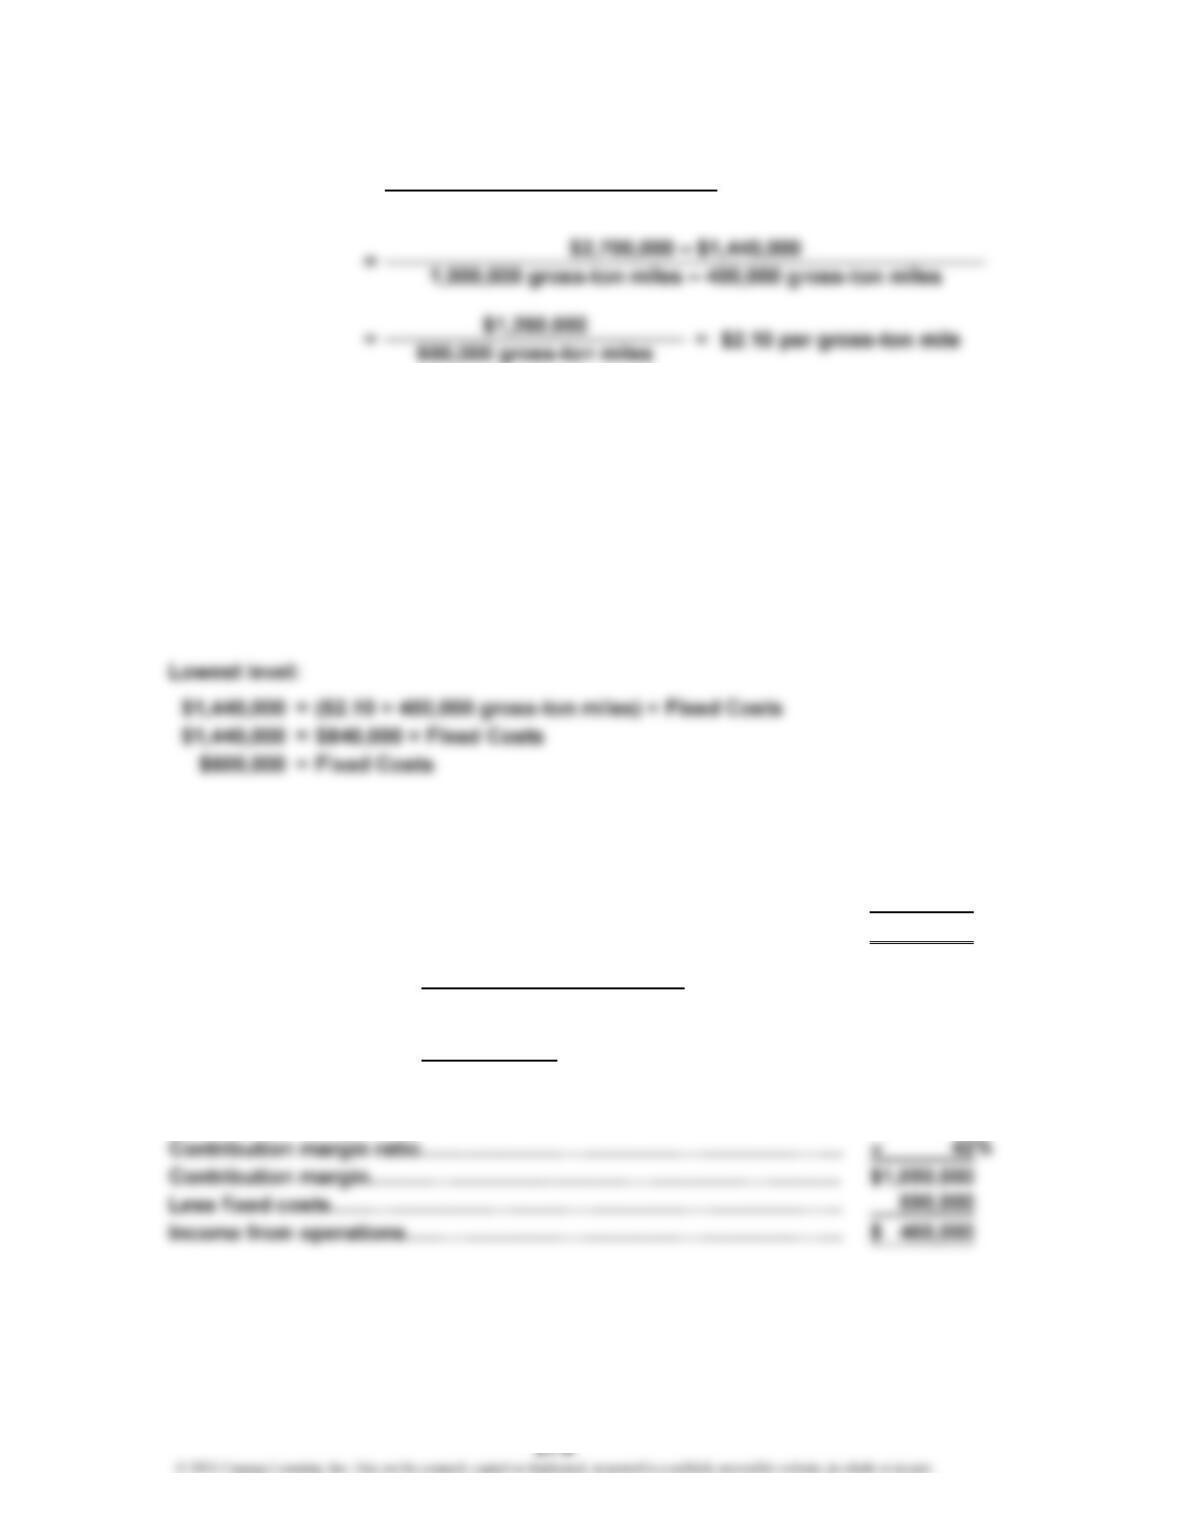
The fixed costs can be determined by subtracting the estimated total variable
cost from the total cost at either the highest or lowest level of gross-ton mile,
as follows:
Total Cost = (Variable Cost per Gross-Ton Mile × Gross-Ton Miles) + Fixed Costs
Highest level:
= ($2.10 × 1,000,000 gross-ton miles) + Fixed Costs
= $2,100,000 + Fixed Costs
= Fixed Costs
Ex. 21-9
a. Sales…………………………………………………………………………….. $1,800,000
V
ariable costs…………………………………………………………………
…
1,116,000
Contribution margin…………………………………………………………
…
$ 684,000
b. Sales…………………………………………………………………………….. $2,500,000
…
…
Sales – Variable Costs
Sales
Difference in Gross-Ton Miles
=
=$684,000
$1,800,000 = 38%
Contribution
Margin Ratio
$2,700,000
$2,700,000
$600,000
Difference in Total Costs
=
Variable Cost per
Gross-Ton Mile
CHAPTER 21 Cost-Volume-Profit Analysis
Ex. 21-10
a. Sales (in millions)…………………………………………………………………
…
$12,718.9
Variable costs (in millions):
Food and packaging…………………………………………………………
…
$ 4,033.5
$4,264.4 million
$12,718.9 million
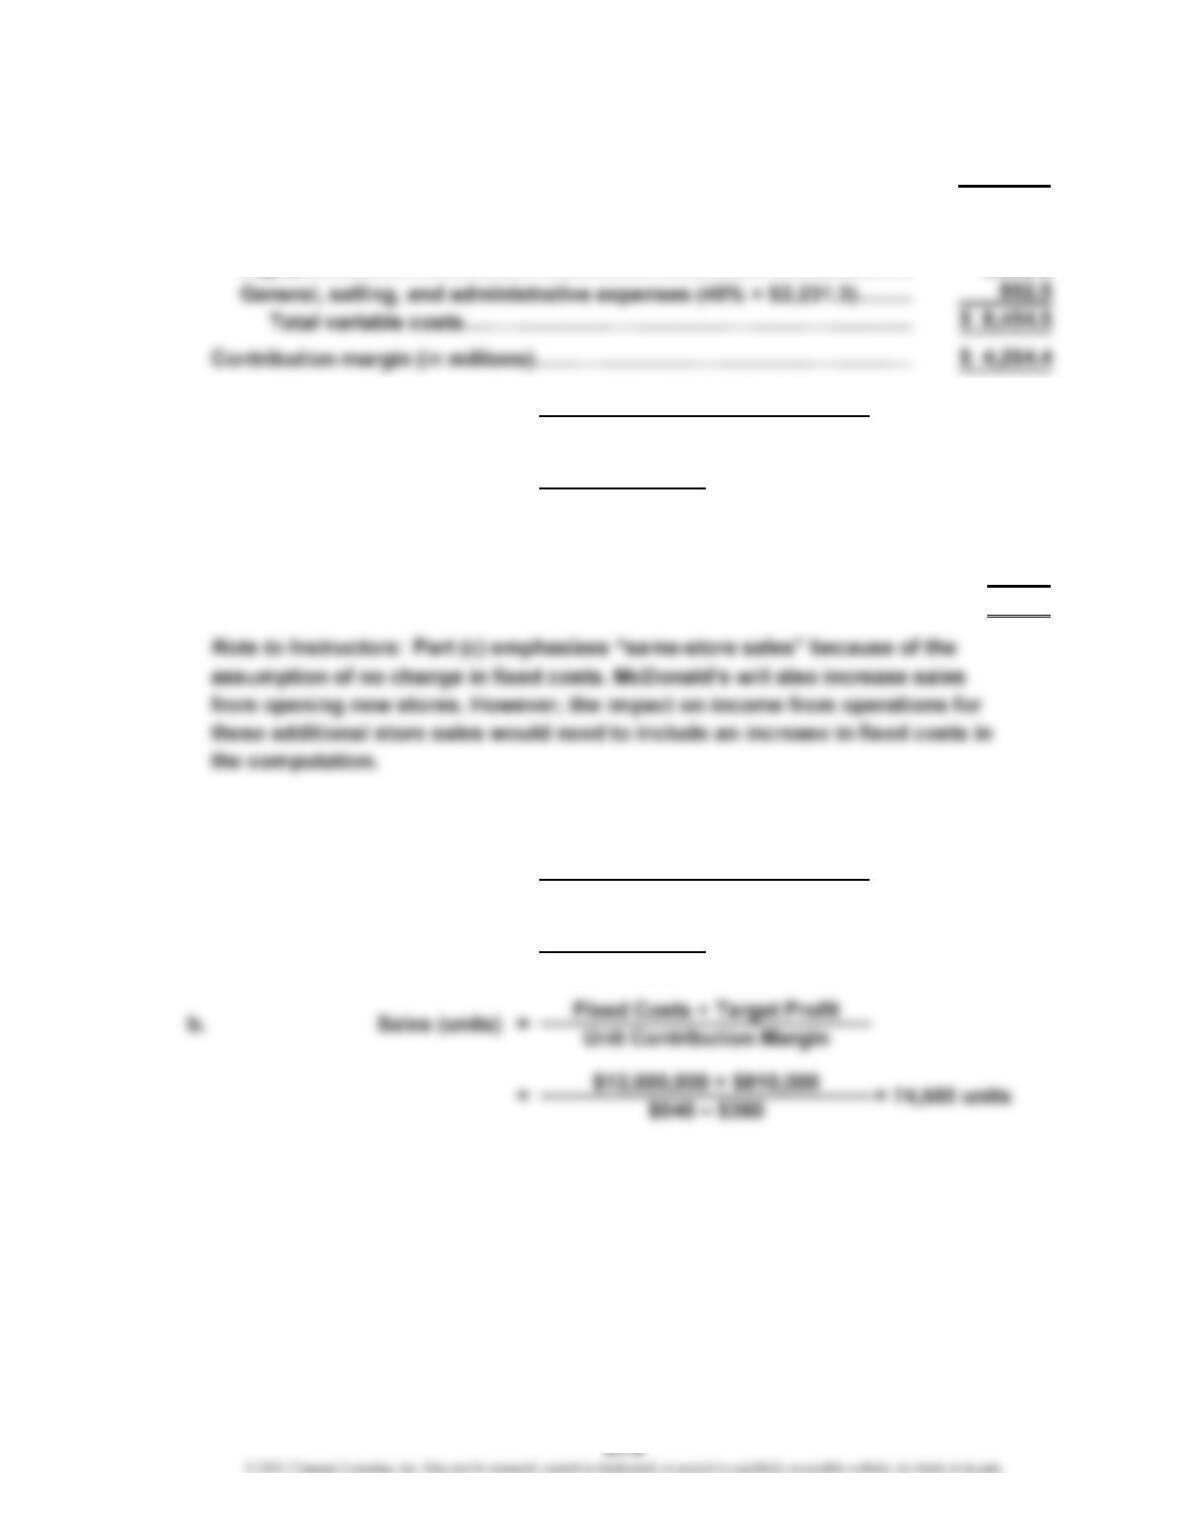
c. Same-store sales increase (in millions)………………………………………
…
$500.0
Contribution margin ratio [from part (b)]……………………………………
…
33.5
Increase in income from operations (in millions)…………………………
…
$167.5
Ex. 21-11
$12,600,000
$540 – $360
Sales – Variable Costs
Sales
b. =Contribution Margin Ratio
= = 33.5%
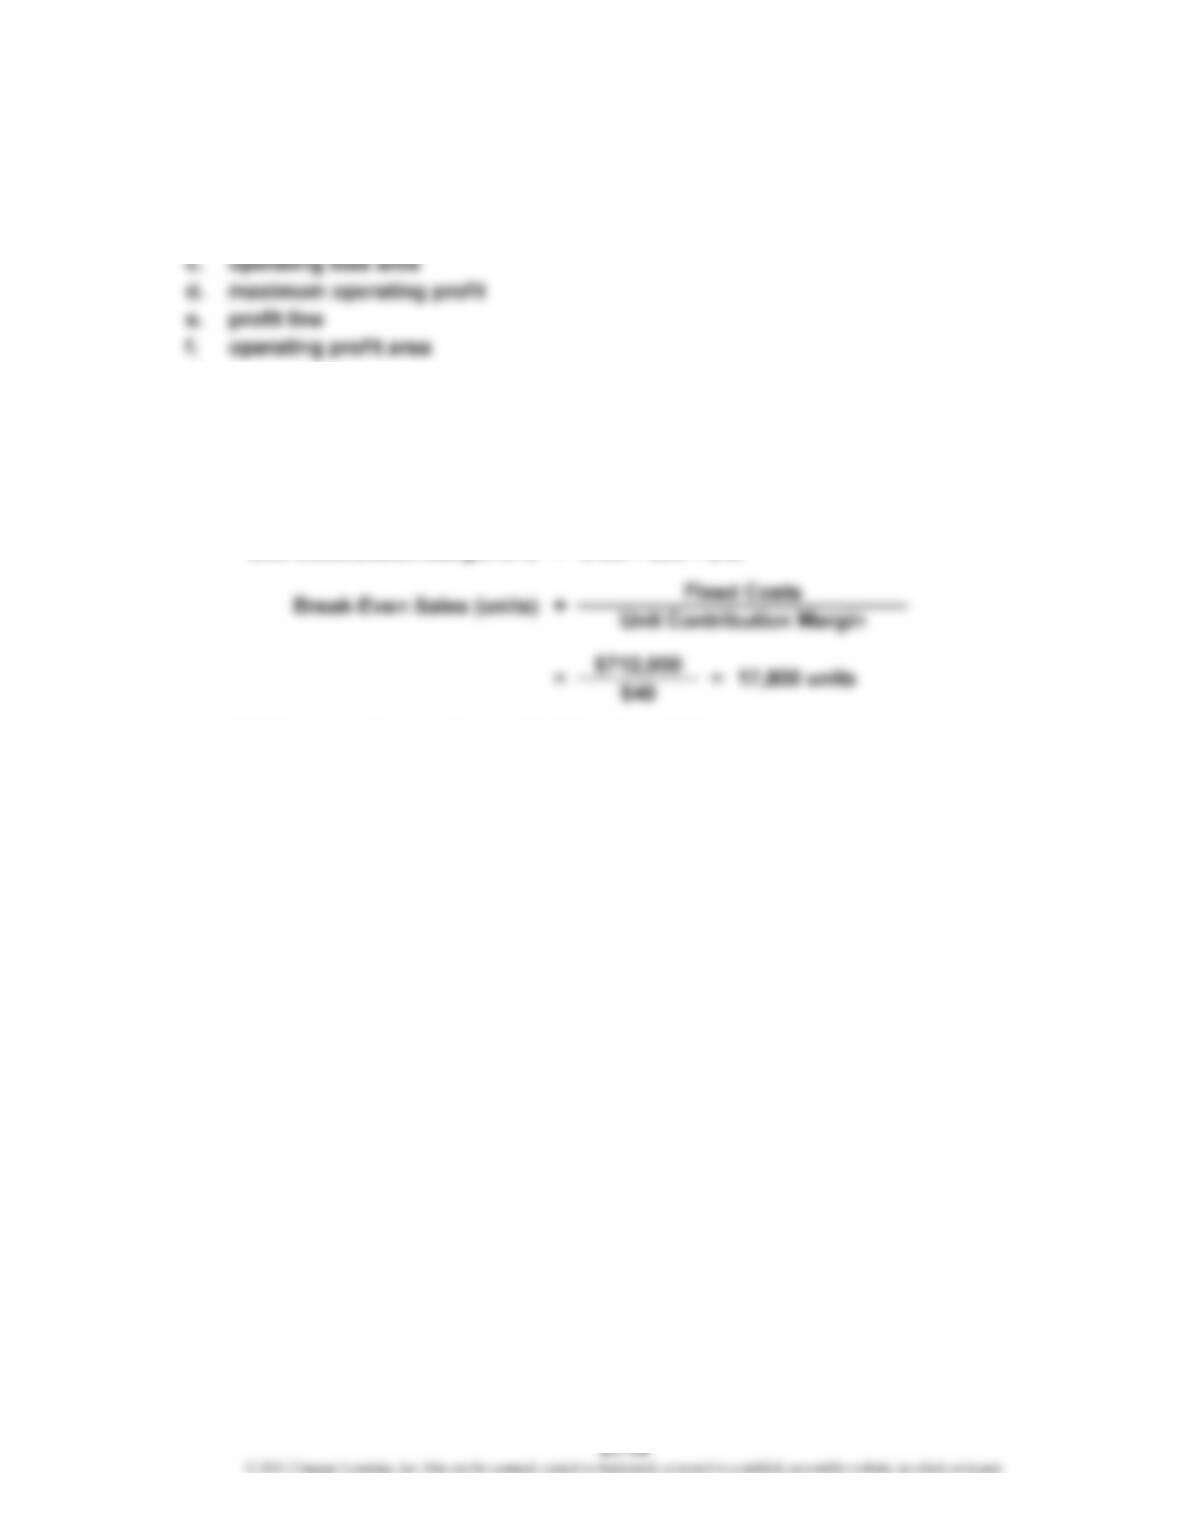
a. Break-Even Sales (units) = Fixed Costs
Unit Contribution Margin
= = 70,000 units
×%
×%
…
CHAPTER 21 Cost-Volume-Profit Analysis
Ex. 21-12
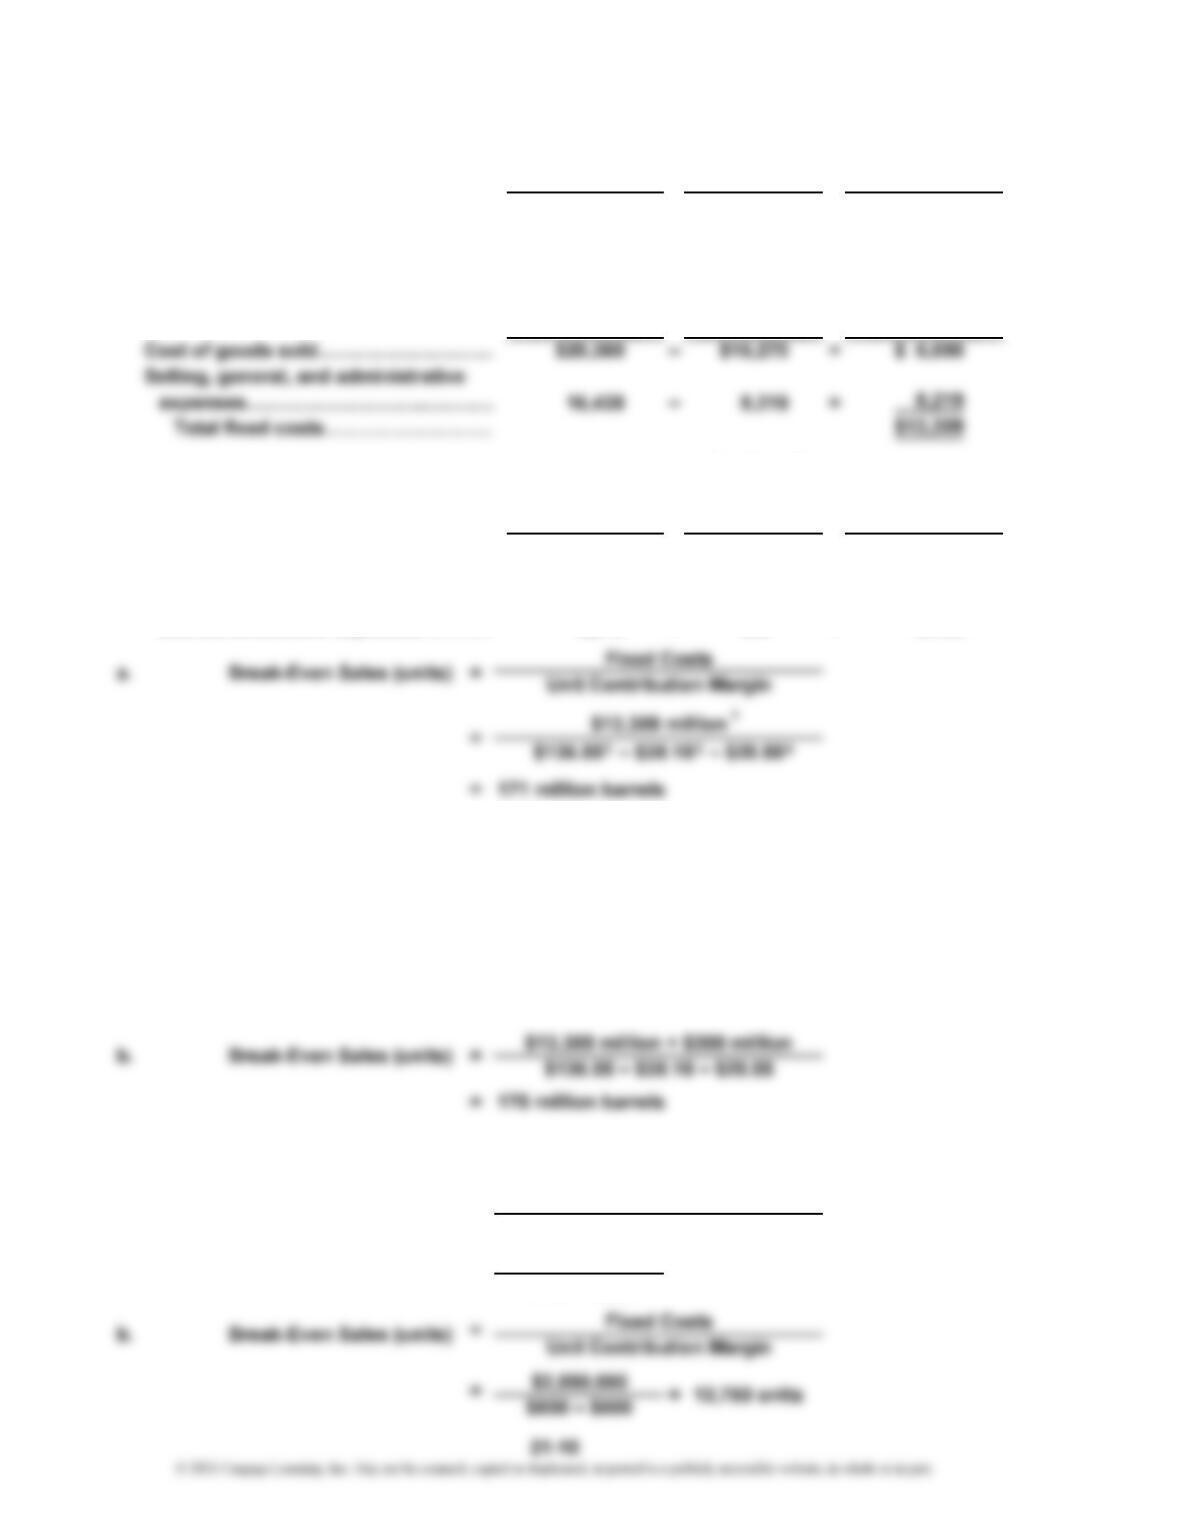
Total Cost Variable Cost Variable Cost
(in millions) Percentage (in millions)
Cost of goods sold………………………
…
$20,360 × 75% = $15,270
Selling, general, and administrative
expenses……………………….………
…
16,438 × 50% = 8,219
Total Cost Variable Cost Fixed Cost
(in millions) (in millions) (in millions)
Number of
Total Amount Barrels
(in millions) (in millions) Per-Unit Amount
Net sales…………………………………
…
$54,619 ÷ 400 = $136.55
V
ariable cost of goods sold……………
…
15,270 ÷ 400 = 38.18
Variable selling, general,
and administrative expenses………
…
8,219 ÷ 400 = 20.55
The variable costs per unit are determined by multiplying the total amount of each cost by the
variable cost percentage (75% for cost of goods sold and 50% for selling, general, and
administrative expenses), then dividing by the number of barrels.
1
($20,360,000,000 × 25%) + ($16,438,000,000 × 50%)
2
$54,619,000,000 ÷ 400,000,000
3
($20,360,000,000 × 75%) ÷ 400,000,000
4
($16,438,000,000 × 50%) ÷ 400,000,000
Ex. 21-13
=
Fixed Costs
Unit Contribution Margin
= 17,000 units
$750 – $600
$2,550,000
a.
=
Break-Even Sales (units)
…
…
CHAPTER 21 Cost-Volume-Profit Analysis
Ex. 21-14
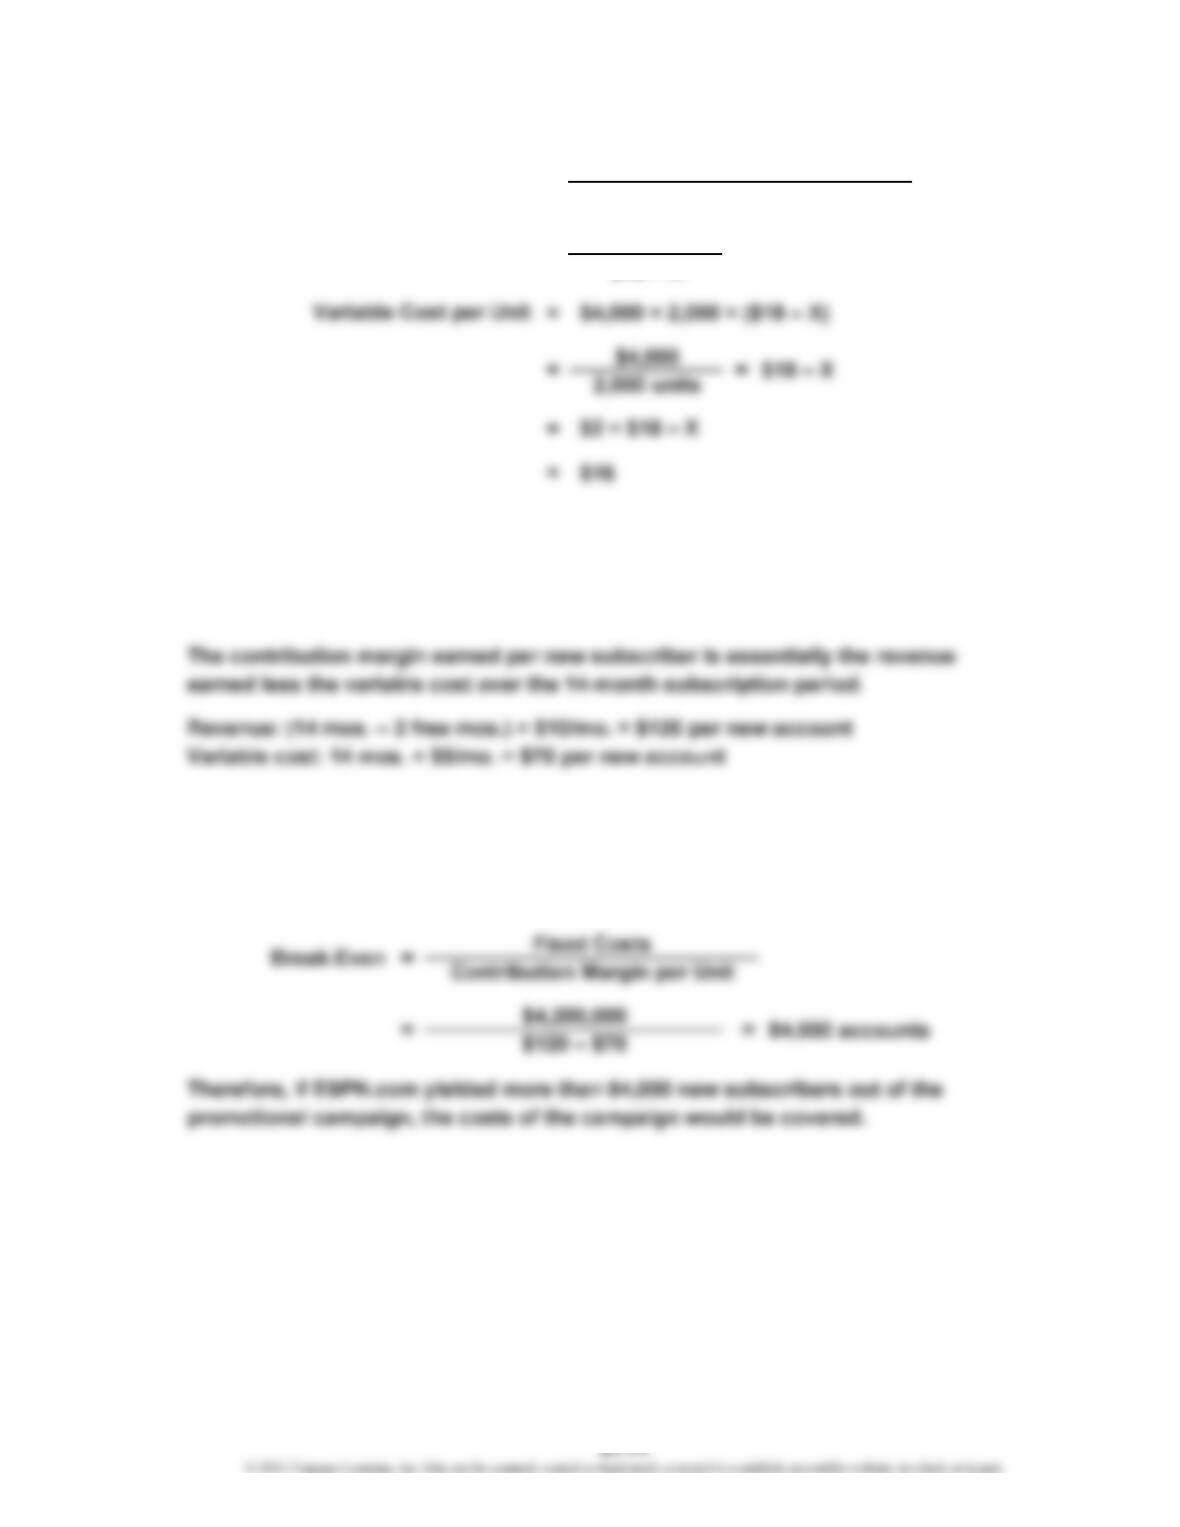
$4,000
Ex. 21-15
The cost of the promotional campaign is the fixed cost in this analysis because
we’re trying to determine the break-even adoption rate of the campaign.
Note: The variable cost is for 14 months because the costs are incurred, even during
the free months.
The break-even number of subscribers necessary to cover the fixed cost of the
promotion is computed as follows:
=Break-Even Sales (units)
Fixed Costs
= 2,000 units
Unit Contribution Margin
=
CHAPTER 21 Cost-Volume-Profit Analysis
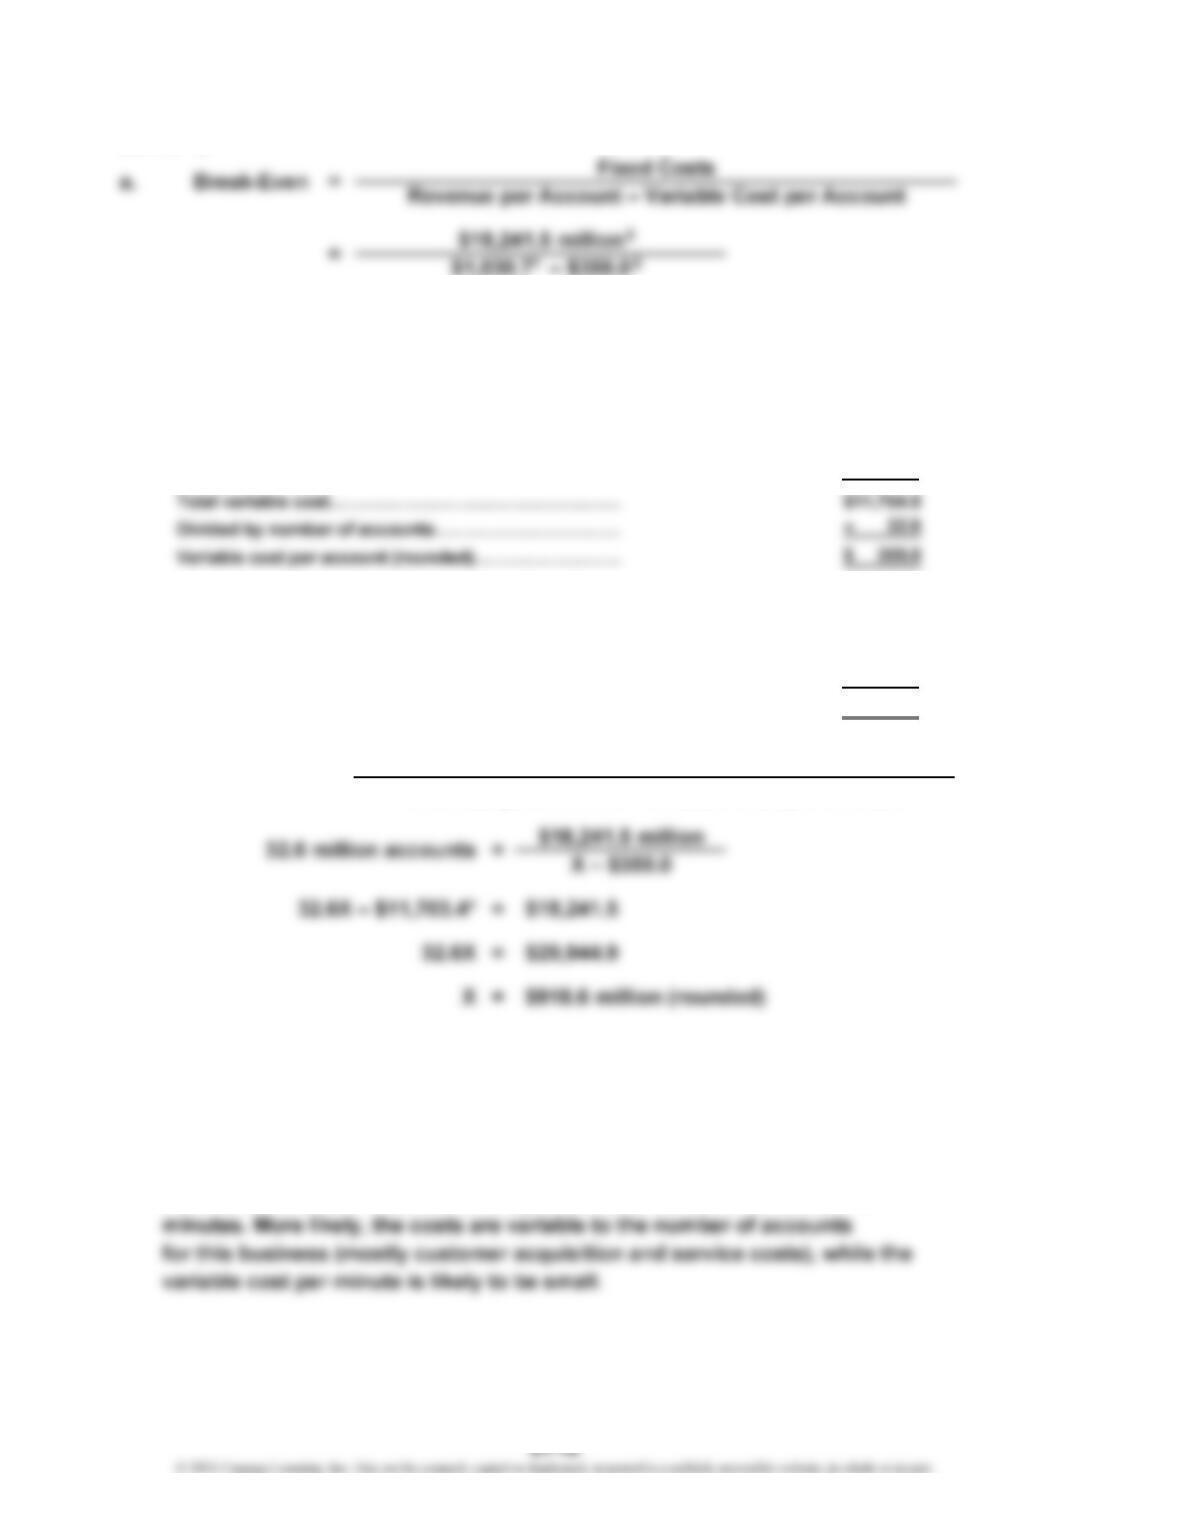
Ex. 21-16
=27.2 million (rounded) accounts
1
Revenue per account (in millions):
$33,600 million ÷ 32.6 million = $1,030.7 (rounded)
2
Variable cost per account (in millions, except variable cost per account):
Cost of revenue……………………………………………… $13,389 × 70% = $ 9,372.3
Selling, general, and administrative expenses………… 7,774 × 30% =2,332.2
3
Fixed costs (in millions):
Cost of revenue……………………………………………… $13,389 × 30% = $ 4,016.7
Selling, general, and administrative expenses………… 7,774 × 70% =5,441.8
Depreciation…………………………………………………
…
8,783 × 100% =8,783.0
Total fixed costs……………………………………………
…
$18,241.5
*
Difference between $11,704.5 in Part (a) and $11,703.4 is due to rounding.
Note to Instructors: The rate charged per minute and the number of average
minutes of digital service influence the revenue per account. An interesting
question is whether the costs are variable to the number of minutes or
number of accounts. If we assume that the costs are variable to the number
of minutes, then the break-even analysis revolves around the number of
b. Break-Even =
Fixed Cost
Revenue per Account – Variable Cost per Account
…
CHAPTER 21 Cost-Volume-Profit Analysis
Ex. 21-17
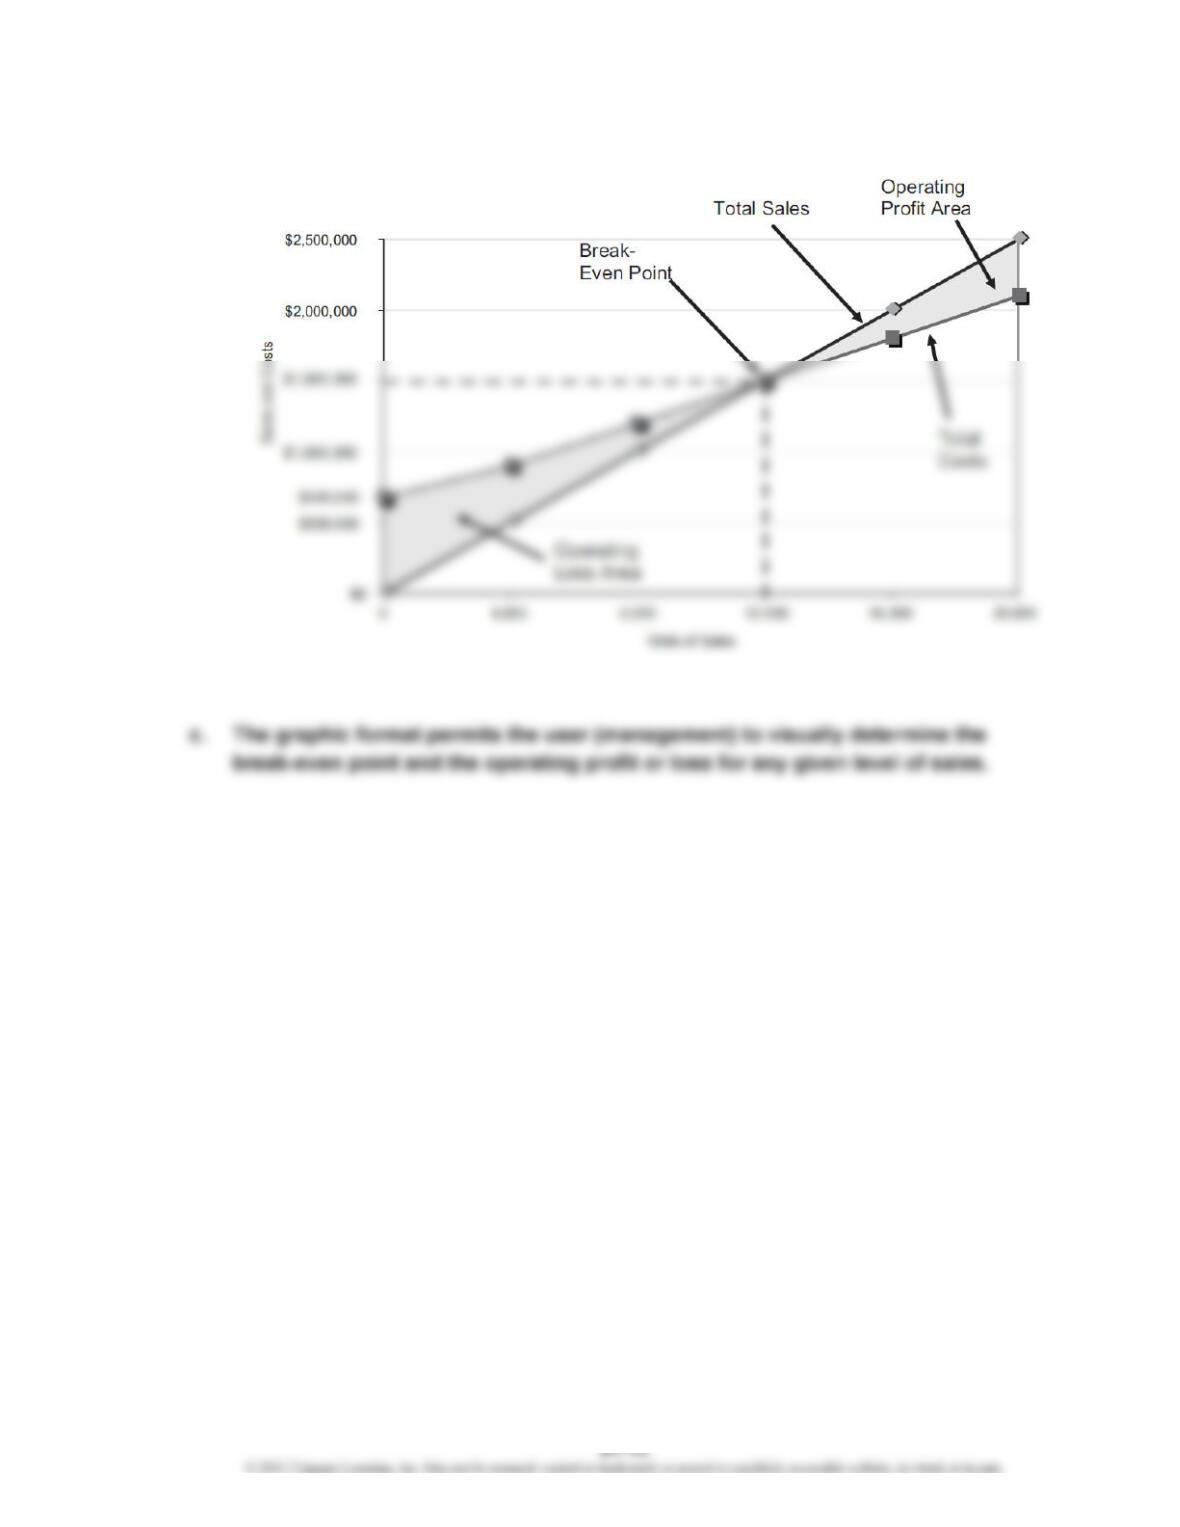
a.
b. $1,500,000 (the intersection of the total sales line and the total costs line)
CHAPTER 21 Cost-Volume-Profit Analysis
b. Sales (20,000 units × $125)……………………………
…
$2,500,000
Fixed costs………………………………………………… $ 600,000
V
ariable costs (20,000 units × $75)……………………
…
1,500,000 2,100,000
Income from operations…………………………………
…
$ 400,000
*20,000 units = $2,500,000 maximum sales ÷
$125 unit selling price
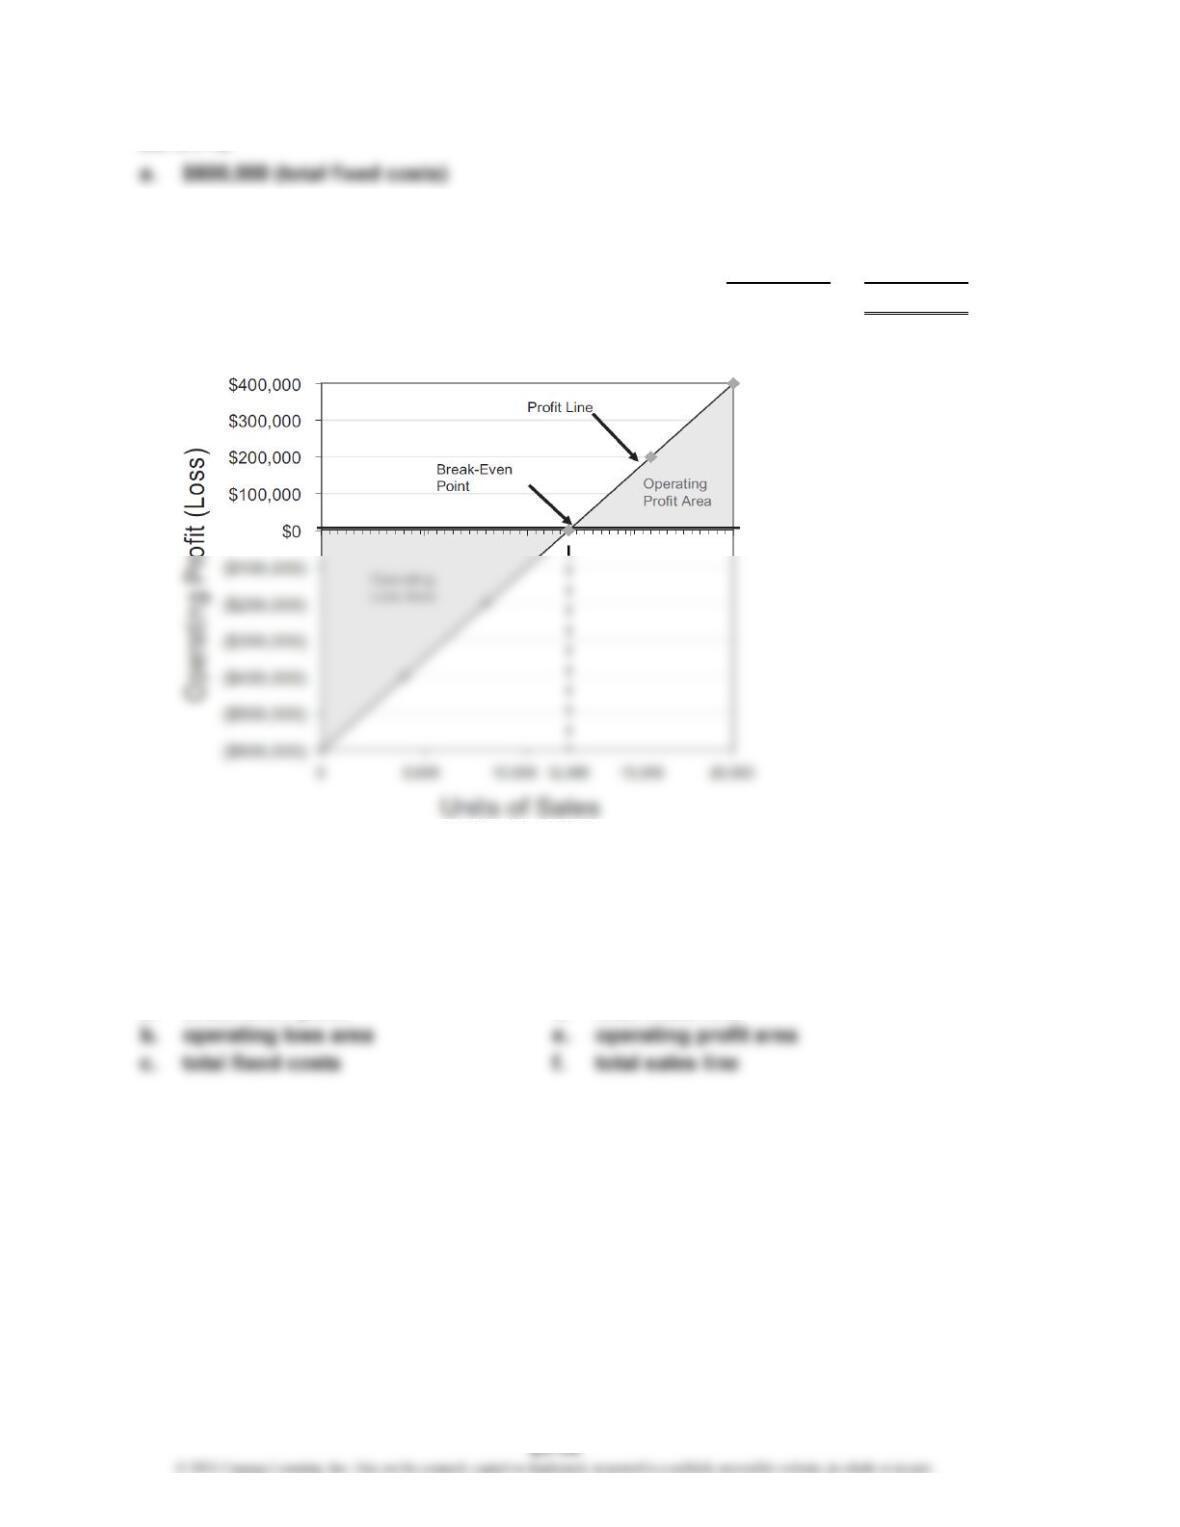
c.
d. 12,000 units (the intersection of the profit line and the horizontal axis)
Ex. 21-19
Cost-volume-profit chart
a. break-even point d. total costs line
*
CHAPTER 21 Cost-Volume-Profit Analysis
Ex. 21-20
Profit-volume chart
a. break-even point
b. total fixed costs
Ex. 21-21
a. Unit Selling Price of E = ($95 × 60%) + ($115 × 40%)
= $57 + $46 = $103
Unit Variable Cost of E = ($55 × 60%) + ($75 × 40%)
= $33 + $30 = $63
b. 10,680 units of baseball bats (17,800 units × 60%)
7,120 units of baseball gloves (17,800 units × 40%)
CHAPTER 21 Cost-Volume-Profit Analysis
Ex. 21-22
a. Unit contribution margin of overall product (E):
Unit selling price of E [(10% × $800) + (90% × $300)]……………………
…
$350
Unit variable cost of E [(10% × $140) + (90% × $120)]…………………… 122
Unit contribution margin of E………………………………………………
…
$228
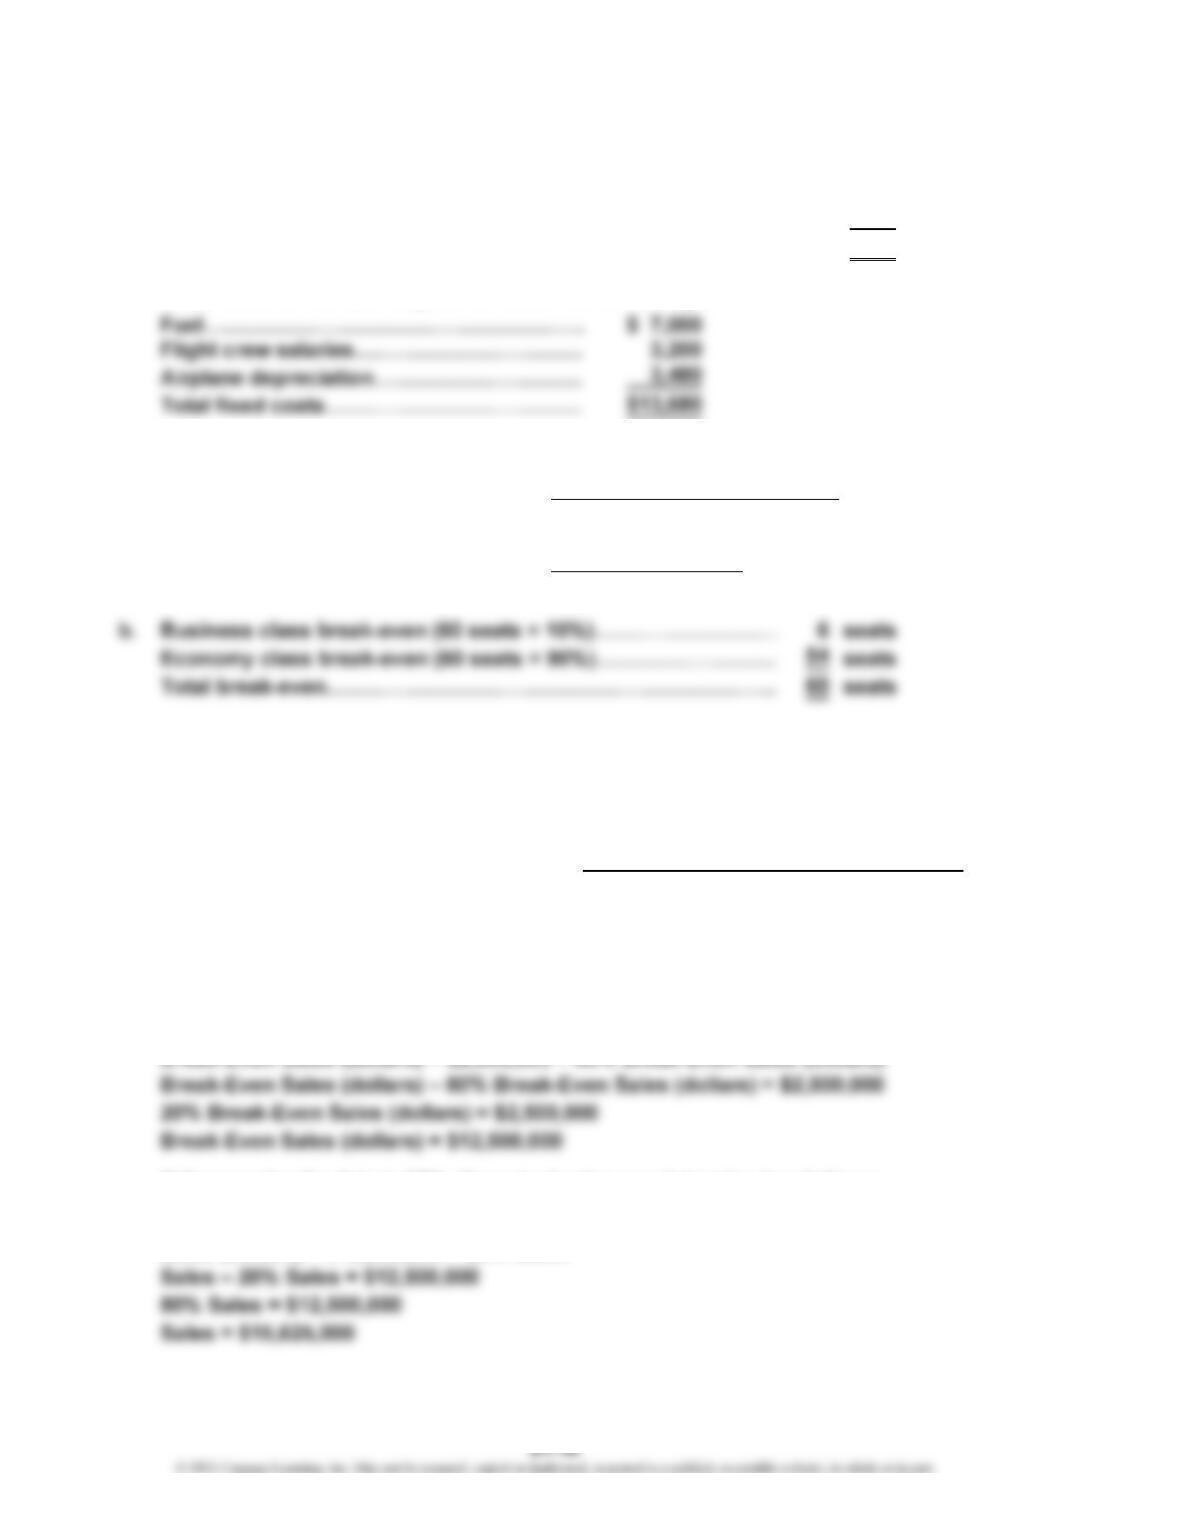
Fixed costs of the Los Angeles to Kona round-trip flight:
Break-even sales (units) of overall product:
Ex. 21-23
a. (1) = Sales – Sales at Break-Even Point
= $1,450,000 – $1,160,000 = $290,000
= $290,000 ÷ $1,450,000 = 20%
b. The break-even point (S) is determined as follows:
Break-Even Sales (dollars) = Total Fixed Costs + Total Variable Costs (at Break-Even)
Break-Even Sales (dollars) = Total Fixed Costs + 80% Break-Even Sales (dollars)
If the margin of safety is 20%, the actual sales are determined as follows:
Sales = Break-Even Sales (dollars) + (Sales × Margin of Safety)
Sales (dollars) = $12,500,000 + 20% Sales
=
=Break-Even Sales (units)
(2)
= = 60 seats (tickets)
Fixed Costs
$13,680
$228 per seat
Unit Contribution Margin
Margin of Safety (percentage)
Margin of Safety (dollars)
Sales – Sales at Break-Even Point
Sales
CHAPTER 21 Cost-Volume-Profit Analysis
Ex. 21-24
If 420,000 units are sold and sales at the break-even point are 472,500 units,
there is no margin of safety.
Ex. 21-25
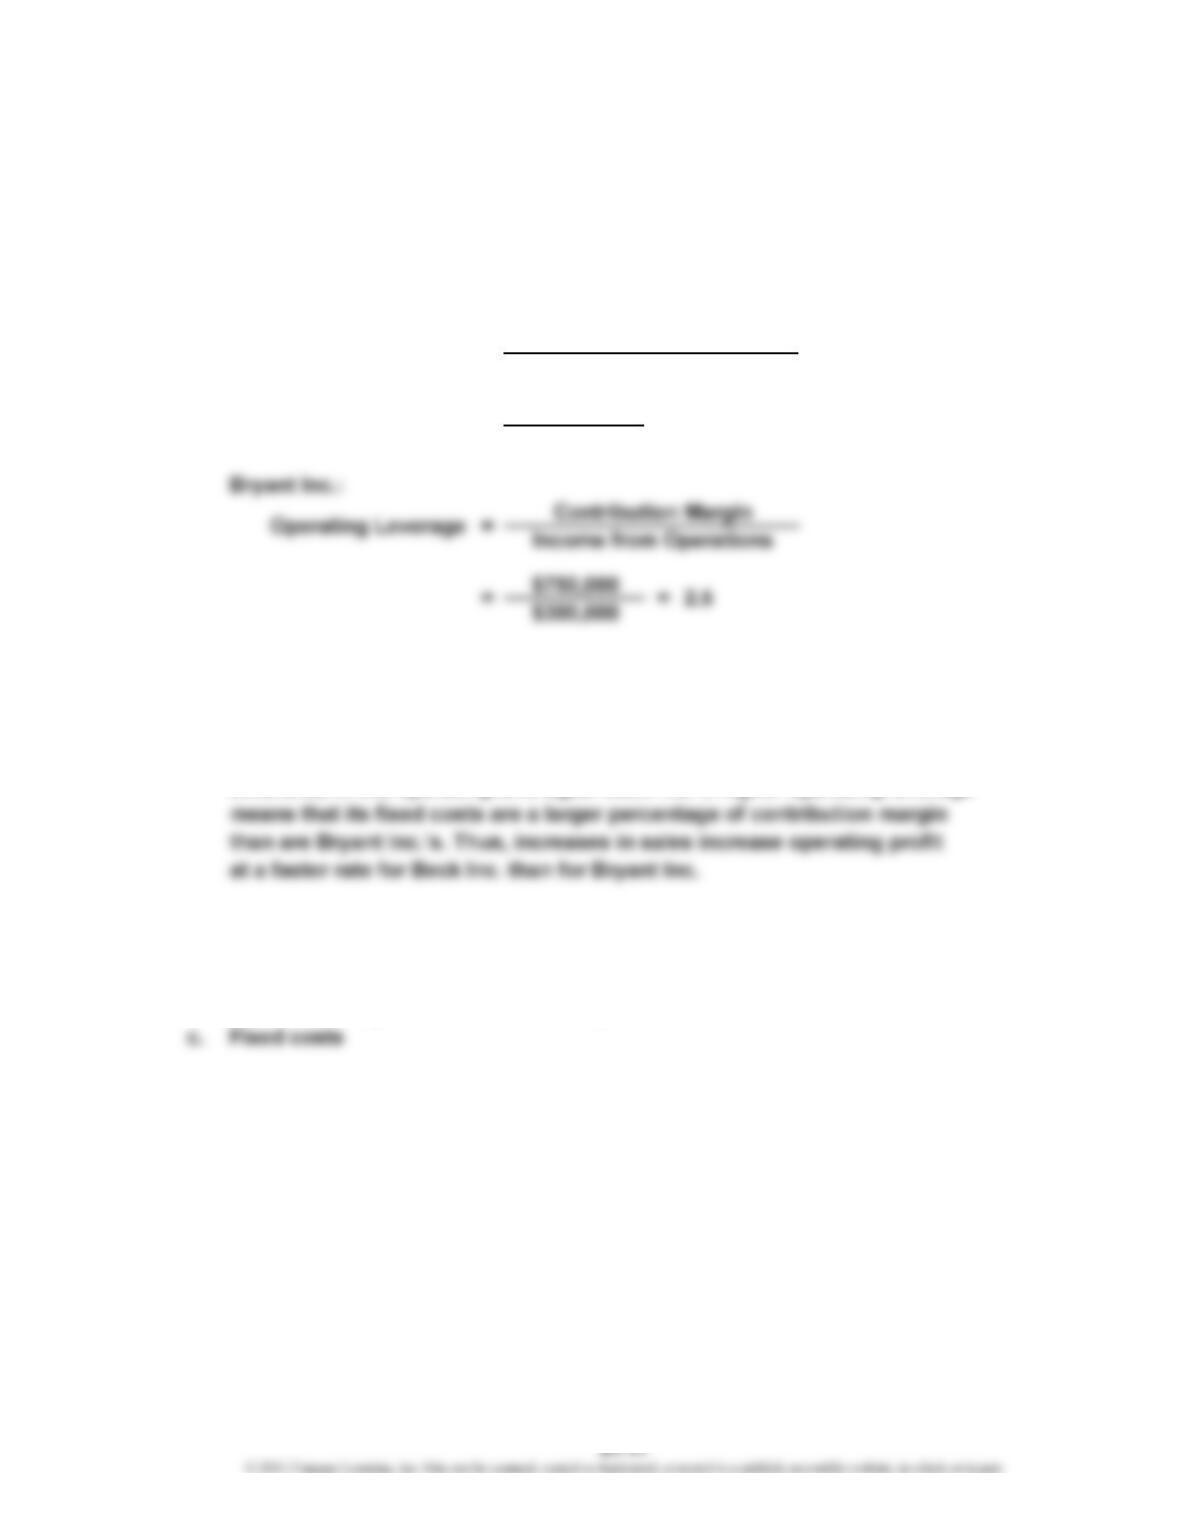
a. Beck Inc.:
$500,000
$100,000
b. Beck Inc.’s income from operations would increase by 100% (5.0 × 20%),
or $100,000 (100% × $100,000), and Bryant Inc.’s income from operations
would increase by 50% (2.5 × 20%), or $150,000 (50% × $300,000).
c. The difference in the increases of income from operations is due to the
Appendix Ex. 21-26
a. Variable cost of goods sold
b. Variable selling and administrative expenses
Operating Leverage
= 5.0
=
=
Contribution Margin
Income from Operations
CHAPTER 21 Cost-Volume-Profit Analysis
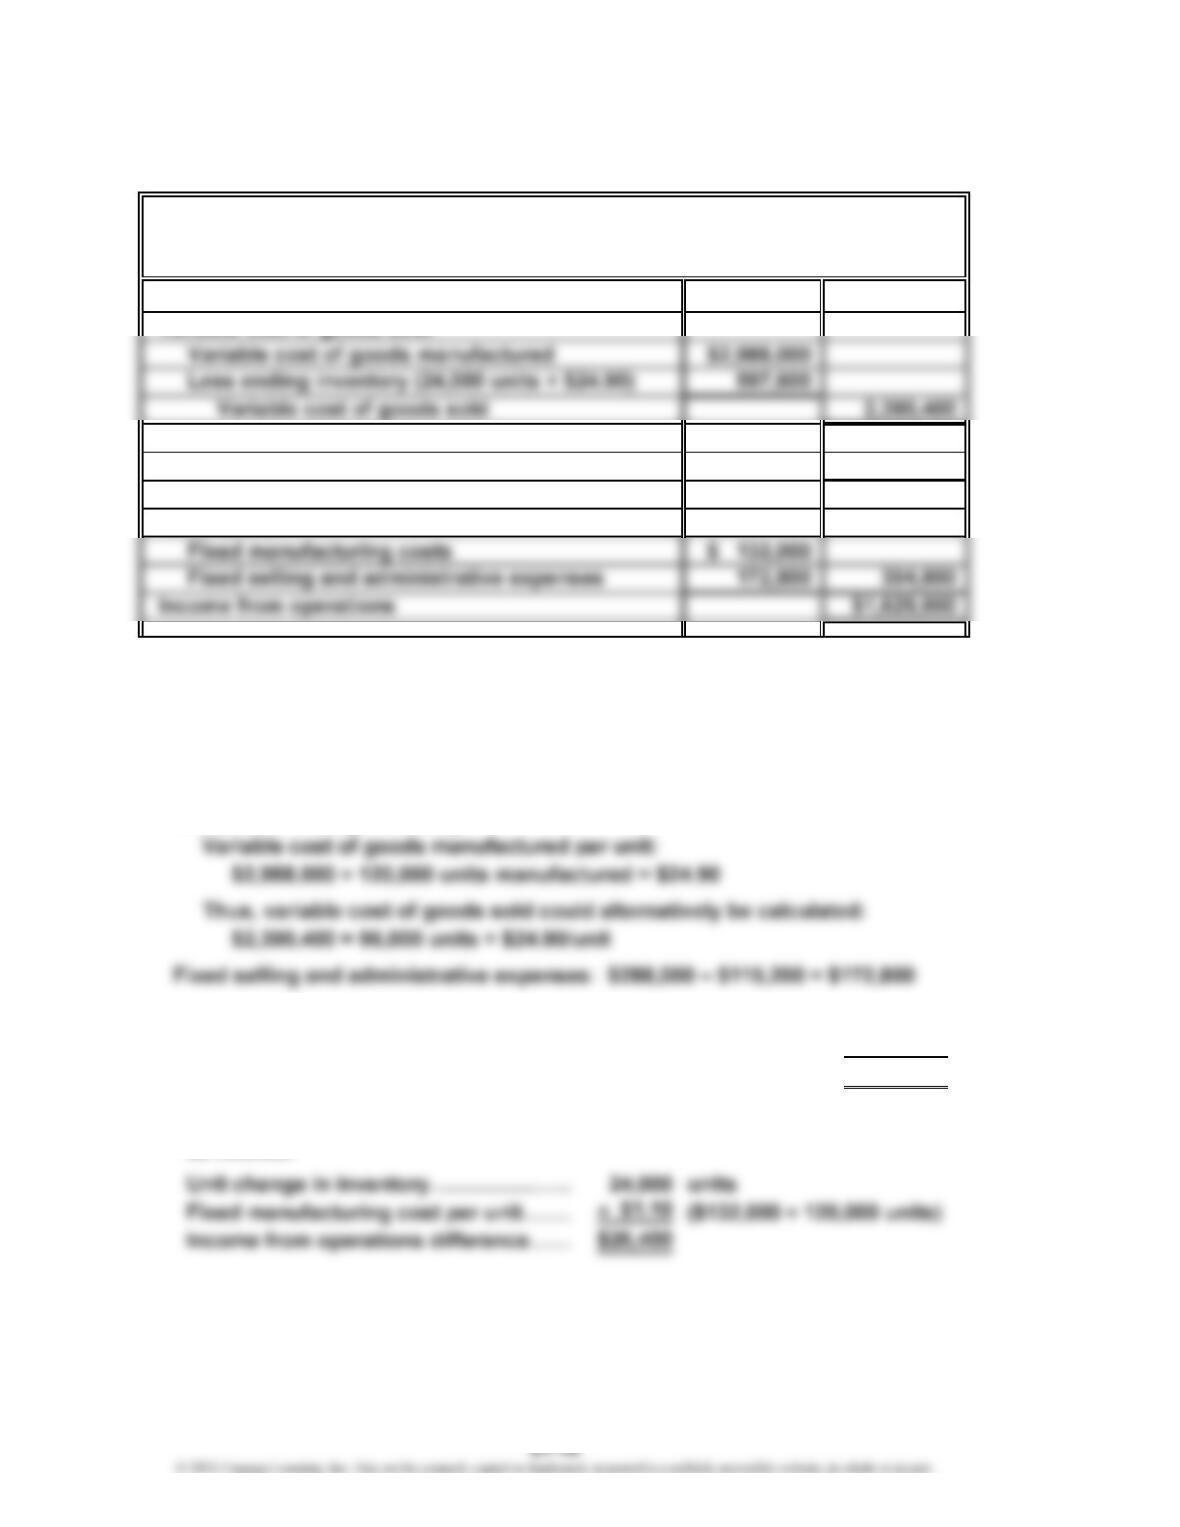
Appendix Ex. 21-27
a.
Sales $4,440,000
Manufacturing margin $2,049,600
V
ariable selling and administrative expenses 115,200
Contribution margin $1,934,400
Fixed costs:
Computations:
Variable cost of goods manufactured: $3,120,000 – $132,000 = $2,988,000
Units Sold = Units Manufactured – Units in Ending Inventory
96,000 = Units Manufactured – 24,000
120,000 = Units Manufactured
Unit cost of ending inventory:
b. Absorption costing income from operations………………………
…
$1,656,000
V
ariable costing income from operations…………………………… 1,629,600
Difference……………………………………………………………….…
…
$ 26,400
Note: The difference between the two income numbers can be reconciled
Rhys Company
Income Statement—Variable Costing
For the Month Ended July 31
V
CHAPTER 21 Cost-Volume-Profit Analysis
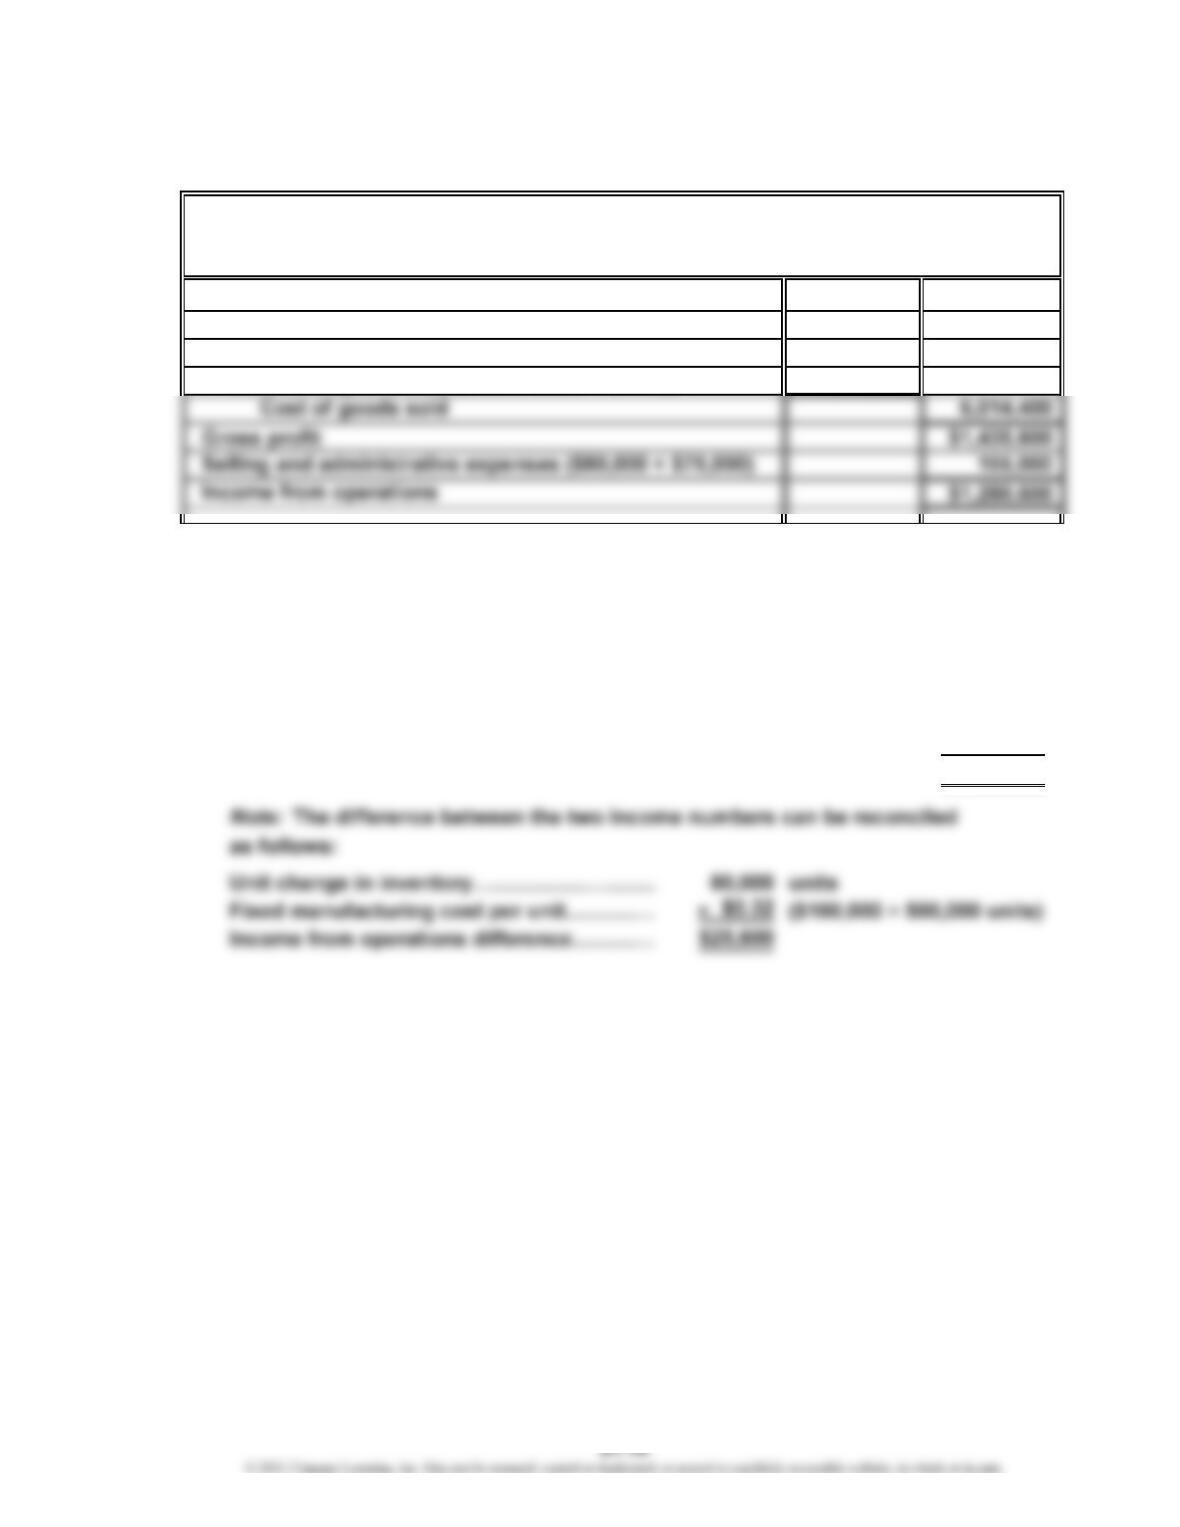
Appendix Ex. 21-28
a.
Sales $7,450,000
Cost of goods sold:
Cost of goods manufactured (500,000 units × $14.32) $7,160,000
Less ending inventory (80,000 units × $14.32) 1,145,600
Computations:
Cost of goods manufactured: $7,000,000 + $160,000 = $7,160,000
Unit cost of ending inventory:
Total cost of goods manufactured:
$7,160,000 ÷ 500,000 units manufactured = $14.32
b.
V
ariable costing income from operations…………………………………
…
$1,255,000
Absorption costing income from operations………………………………
…
1,280,600
Difference…………………………………………………………………………
…
$ 25,600
Tudor Manufacturing Co.
Income Statement—Absorption Costing
For the Month Ended June 30
CHAPTER 21 Cost-Volume-Profit Analysis
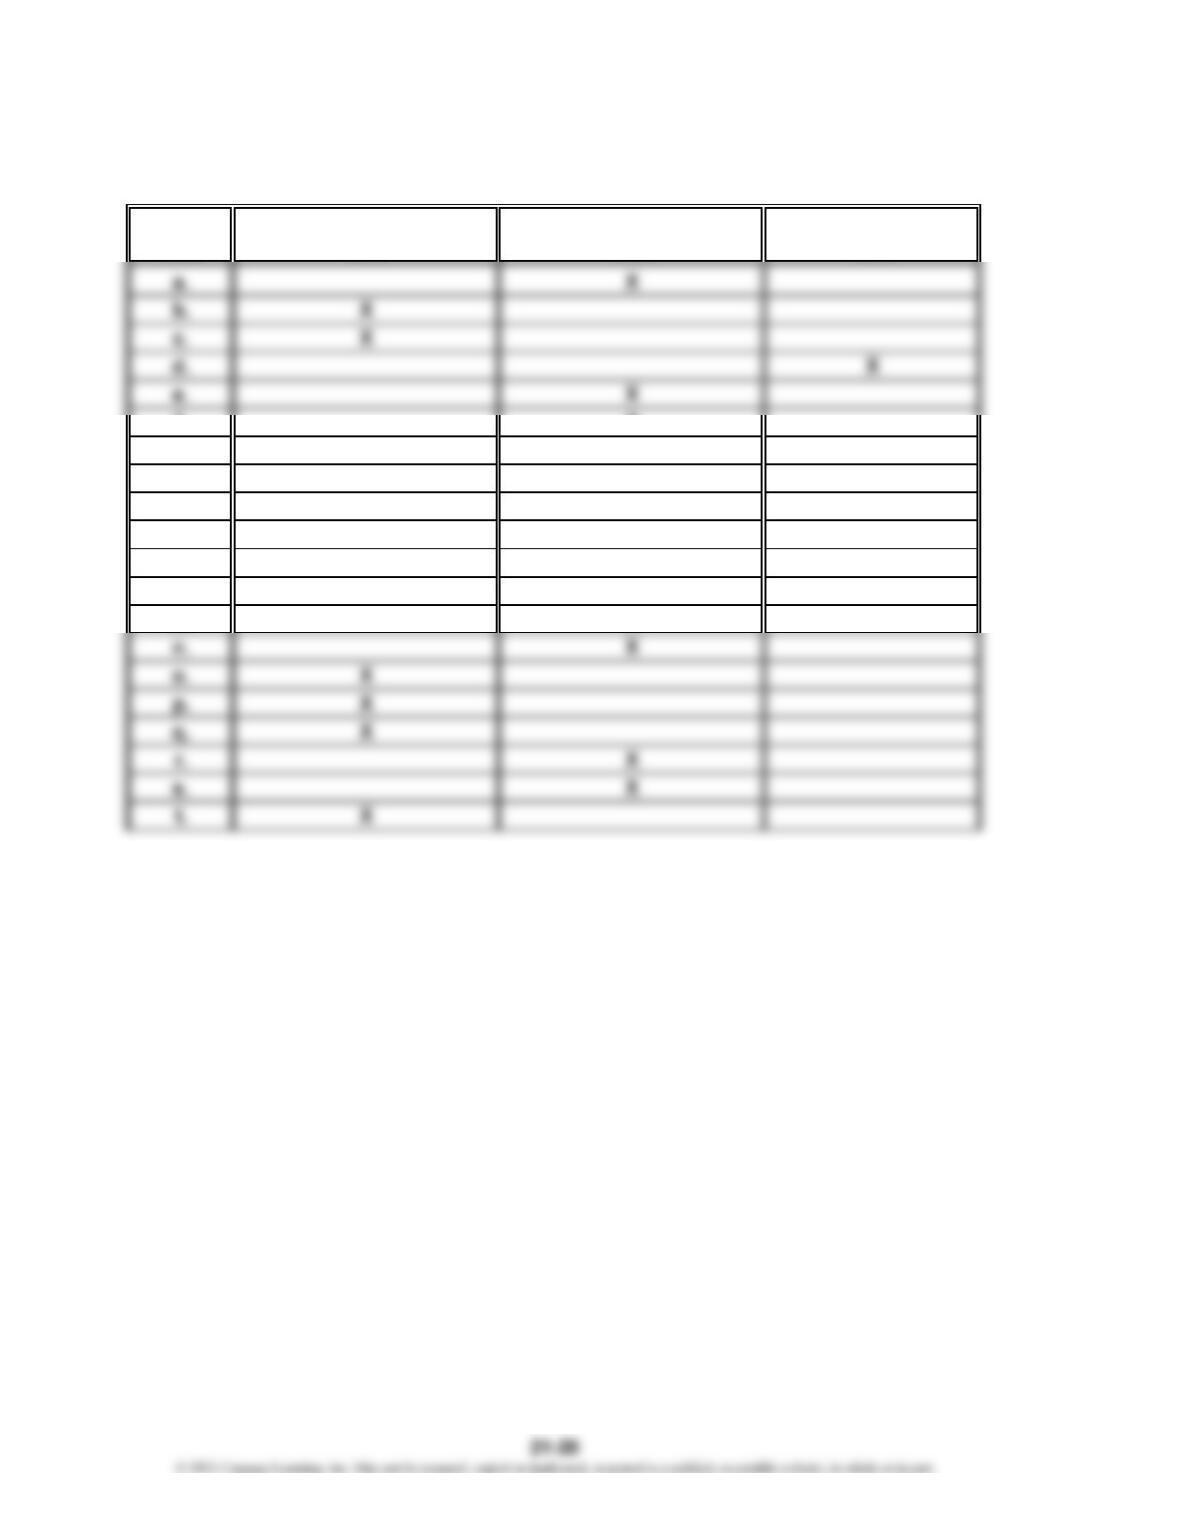
Prob. 21-1A
Fixed Variable Mixed
Cost Cost Cost Cost
f. X
g. X
h. X
i. X
j. X
k. X
l. X
m. X
PROBLEMS