CHAPTER 20 Process Cost Systems
Prob. 20-3B (Concluded)
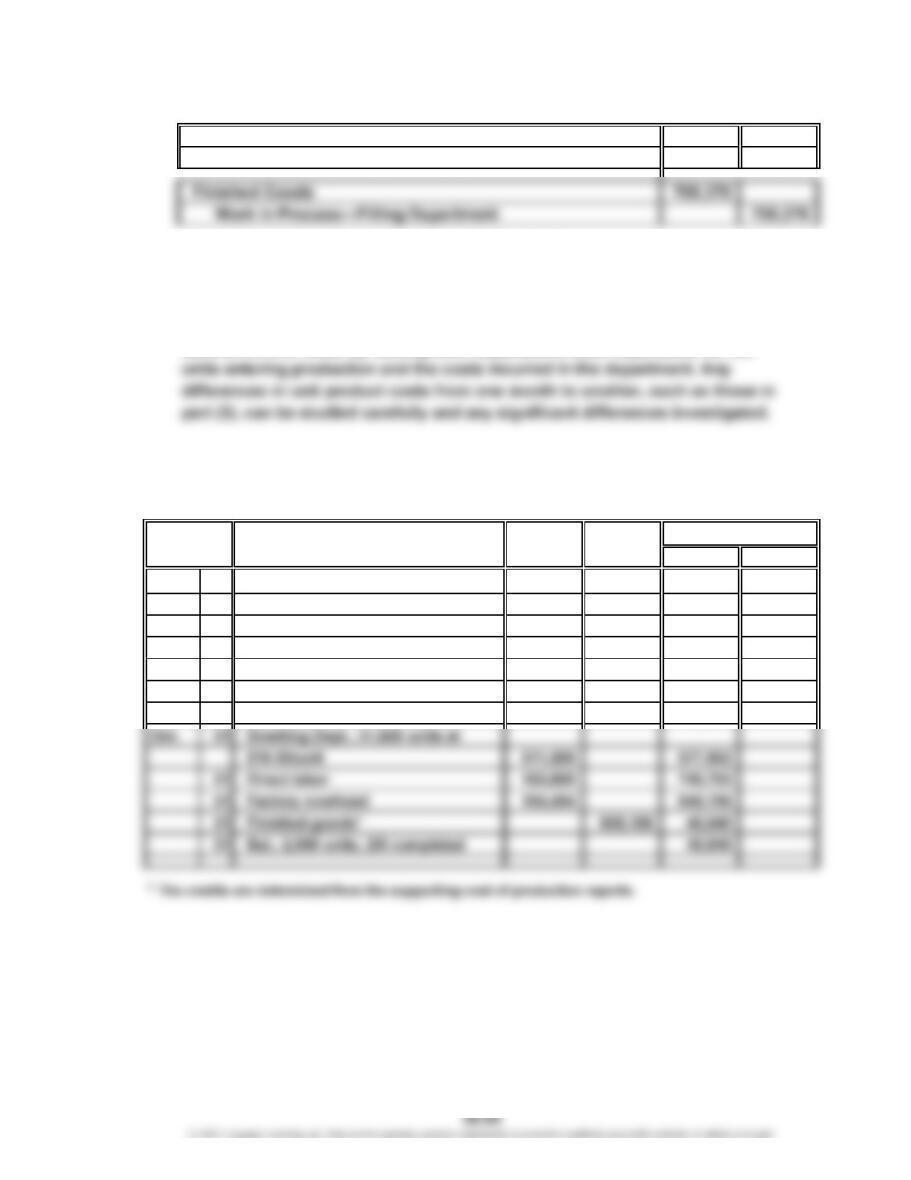
2. Work in Process—Filling Department 496,850
Work in Process—Reaction Department 496,850
3. Direct materials: –$0.08 decrease ($9.50 – $9.58)
Conversion: –$0.10 decrease ($3.80 – $3.90)
4. The cost of production report may be used as the basis for allocating product
costs between Work in Process and Finished Goods. The report can also be
Prob. 20-4B
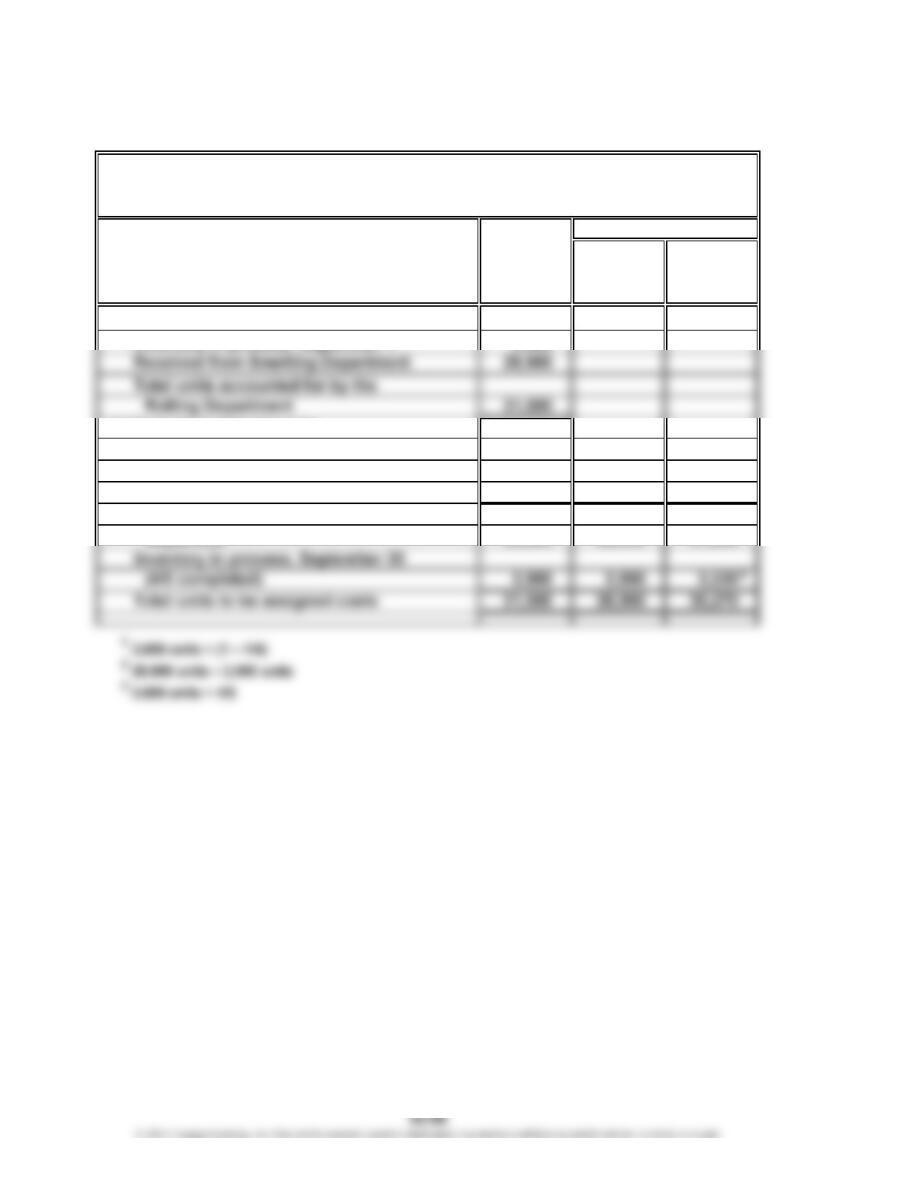
1. and 2.
Item Dr. Cr. Dr. Cr.
Sept. 1 Bal., 2,600 units, 1/4 completed 45,825
30 Smelting Dept., 28,900 units at
$16.00/unit 462,400 508,225
30 Direct labor 158,920 667,145
30 Factory overhead 101,402 768,547
30 Finished goods* 702,195 66,352
30 Bal., 2,900 units, 4/5 completed 66,352
Date
Balance
Work in Process—Rolling
CHAPTER 20 Process Cost Systems
Prob. 20-4B (Continued)
1.
Direct
Whole Materials Conversion
UNITS Units (a) (a)
Units charged to production:
Units to be assigned costs:
Inventory in process, September 1
(1/4 completed) 2,600 01,950
Started and completed in Septembe
r
26,000 26,000 26,000
Transferred to finished goods in
Pittsburgh Aluminum Company
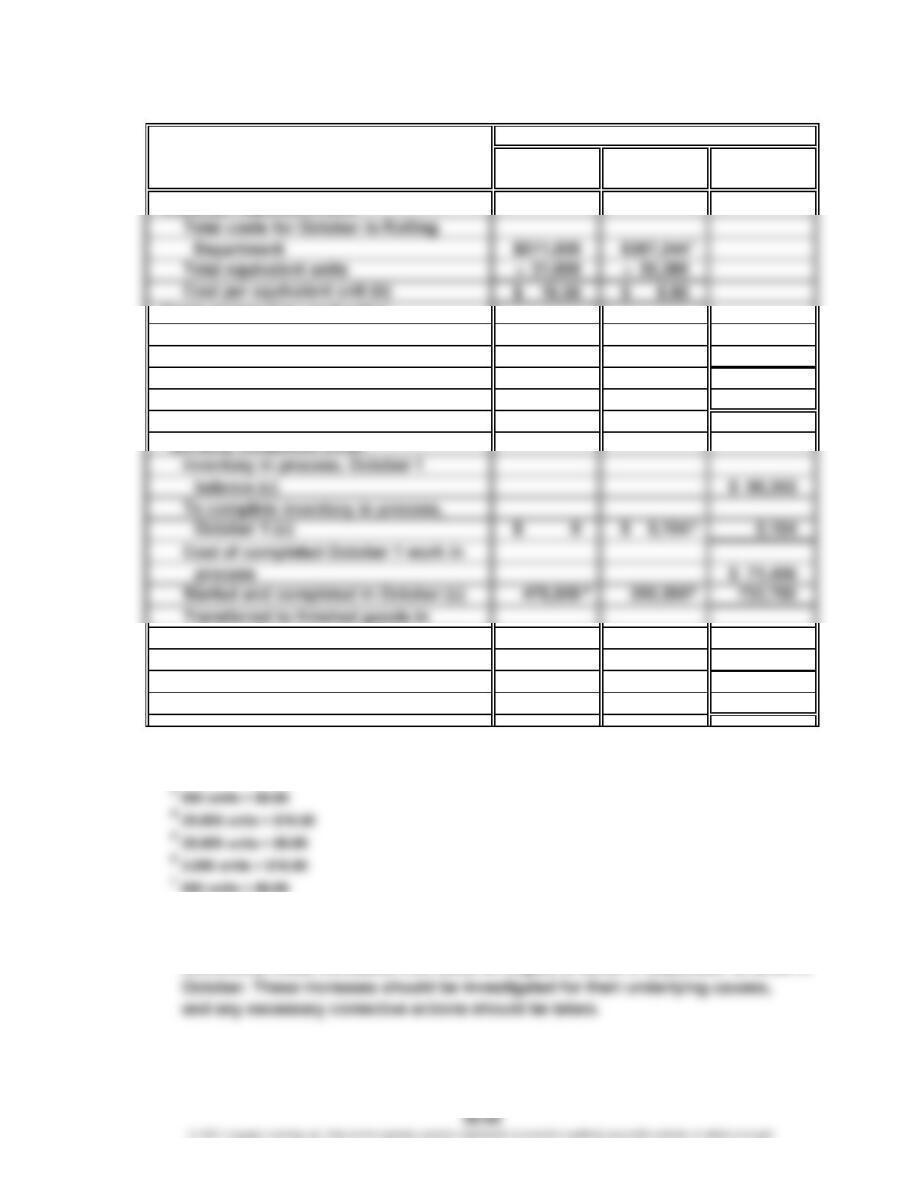
Cost of Production Report—Rolling Department
For the Month Ended September 30
Equivalent Units
1
2
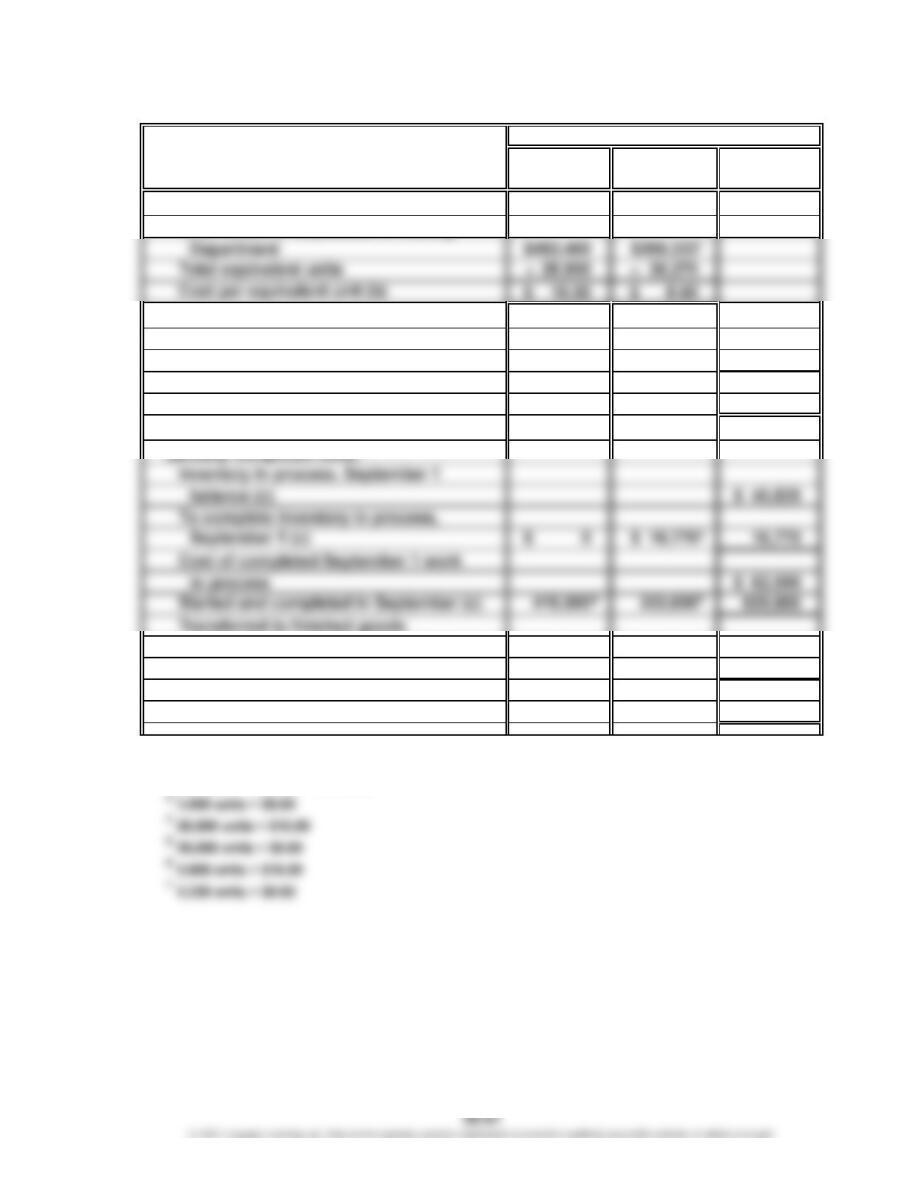
CHAPTER 20 Process Cost Systems
Prob. 20-4B (Continued)
Direct
COSTS Materials Conversion Total
Costs per equivalent unit:
Total costs for September in Rolling
Costs assigned to production:
Inventory in process, September 1 $ 45,825
Costs incurred in Septembe
r
722,722
Total costs accounted for by the
Rolling Department $768,547
Cost allocated to completed and
in September (c) $702,195
Inventory in process, September 30 (d) 46,400 19,952 66,352
Total costs assigned by the Rolling
Department $768,547
1
$158,920 + $101,402
2
$462,400 + $158,920 + $101,402
Costs
2
67
CHAPTER 20 Process Cost Systems
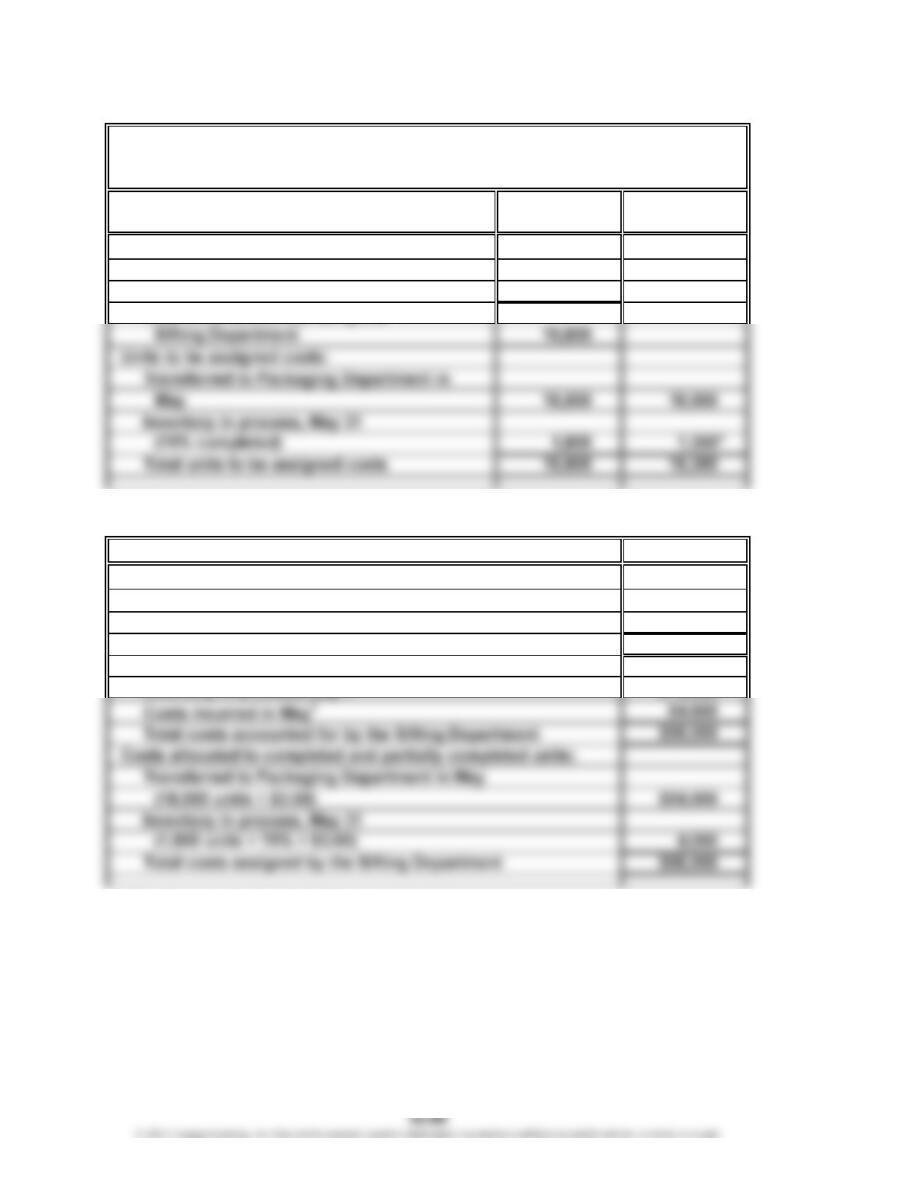
Prob. 20-4B (Continued)
2.
Direct
Whole Materials Conversion
UNITS Units (a) (a)
Units charged to production:
(4/5 completed) 2,900 0580
Started and completed in Octobe
r
29,000 29,000 29,000
Transferred to finished goods in
October 31,900 29,000 29,580
Pittsburgh Aluminum Company
Cost of Production Report—Rolling Department
For the Month Ended October 31
Equivalent Units
1
2
CHAPTER 20 Process Cost Systems
Prob. 20-4B (Concluded)
Direct
COSTS Materials Conversion Total
Costs assigned to production:
Inventory in process, October 1 $ 66,352
Costs incurred in Octobe
r
778,844
Total costs accounted for by the
Rolling Department $845,196
Cost allocated to completed and
October (c) $805,156
Inventory in process, October 31 (d) 33,000 7,040 40,040
Total costs assigned by the Rolling
Department $845,196
1
$162,850 + $104,494
2
$511,500 + $162,850 + $104,494
800 units × $8.80
3. The cost per equivalent unit for direct materials increased from $15.50 in August
to $16.00 in September to $16.50 in October. The cost per equivalent unit for
Costs
2
67
CHAPTER 20 Process Cost Systems
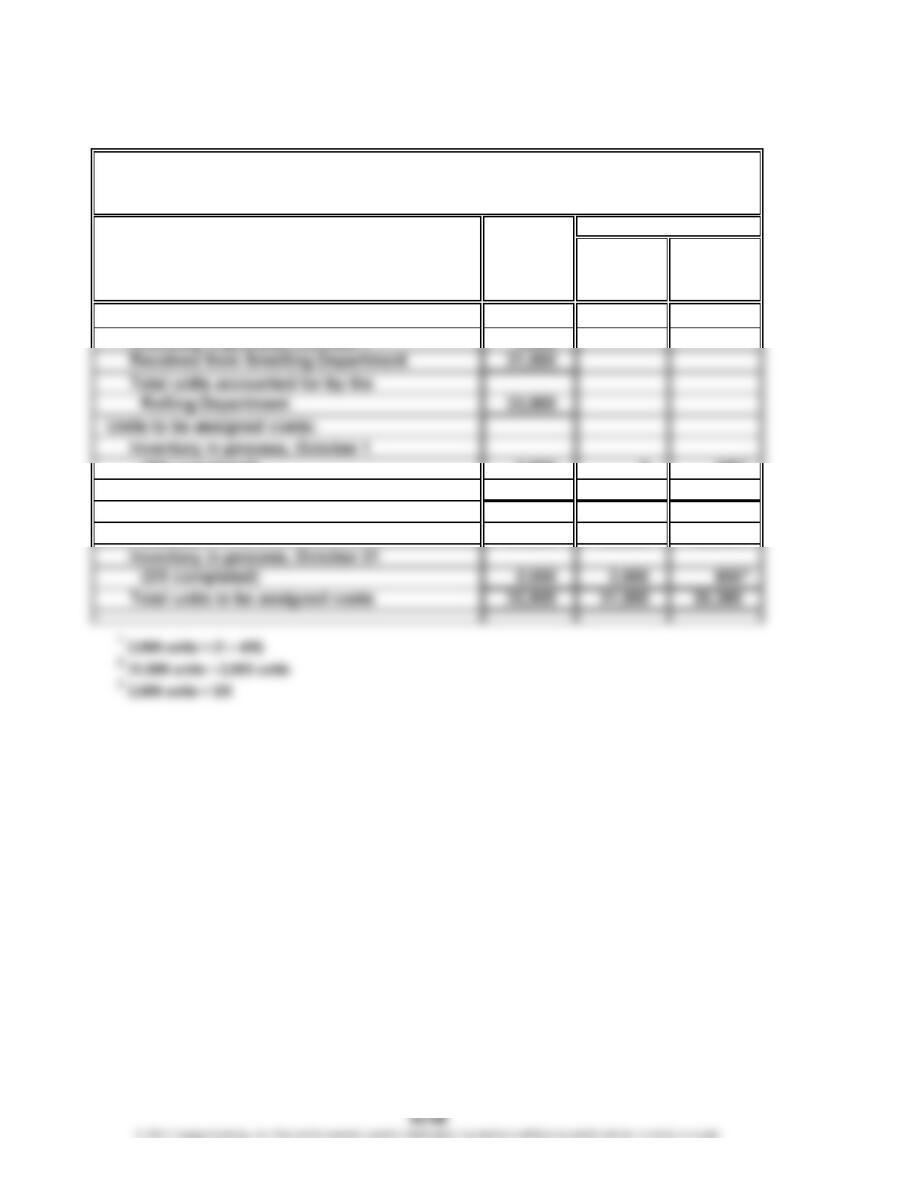
Appendix Prob. 20-5B
Whole Equivalent Units
UNITS Units of Production
Units charged to production:
Inventory in process, May 1 1,500
Received from Milling Department 18,300
*
75% units × 1,800 units
COSTS Costs
Costs per equivalent unit:
Total costs for May in Sifting Department
1
$58,050
Total equivalent units 19,350
Cost per equivalent unit $ 3.00
Costs assigned to production:
1
$3,400 + $32,600 + $14,560 + $7,490
2
$32,600 + $14,560 + $7,490
Blue Ribbon Flour Company
Cost of Production Report—Sifting Department
For the Month Ended May 31
÷
CHAPTER 20 Process Cost Systems
CP 20-1
This case comes from a real story. In that story, the first reduction in chips had
no impact on the marketplace. The manager was promoted, and the next manager
attempted the same strategy—reduce chips by 10%. Again, it worked. The next
manager did the same thing. All of a sudden, the market demand dropped for the
cookie. A threshold was reached, and the cookie was in trouble in the marketplace.
The current cookie was nothing like the original recipe. The cookie’s integrity was
slowly eroded until it wasn’t “Full of Chips.” Senior management had no idea this was
happening because it occurred slowly over a period of many years. Now with respect
to the controller, there are a number of options.
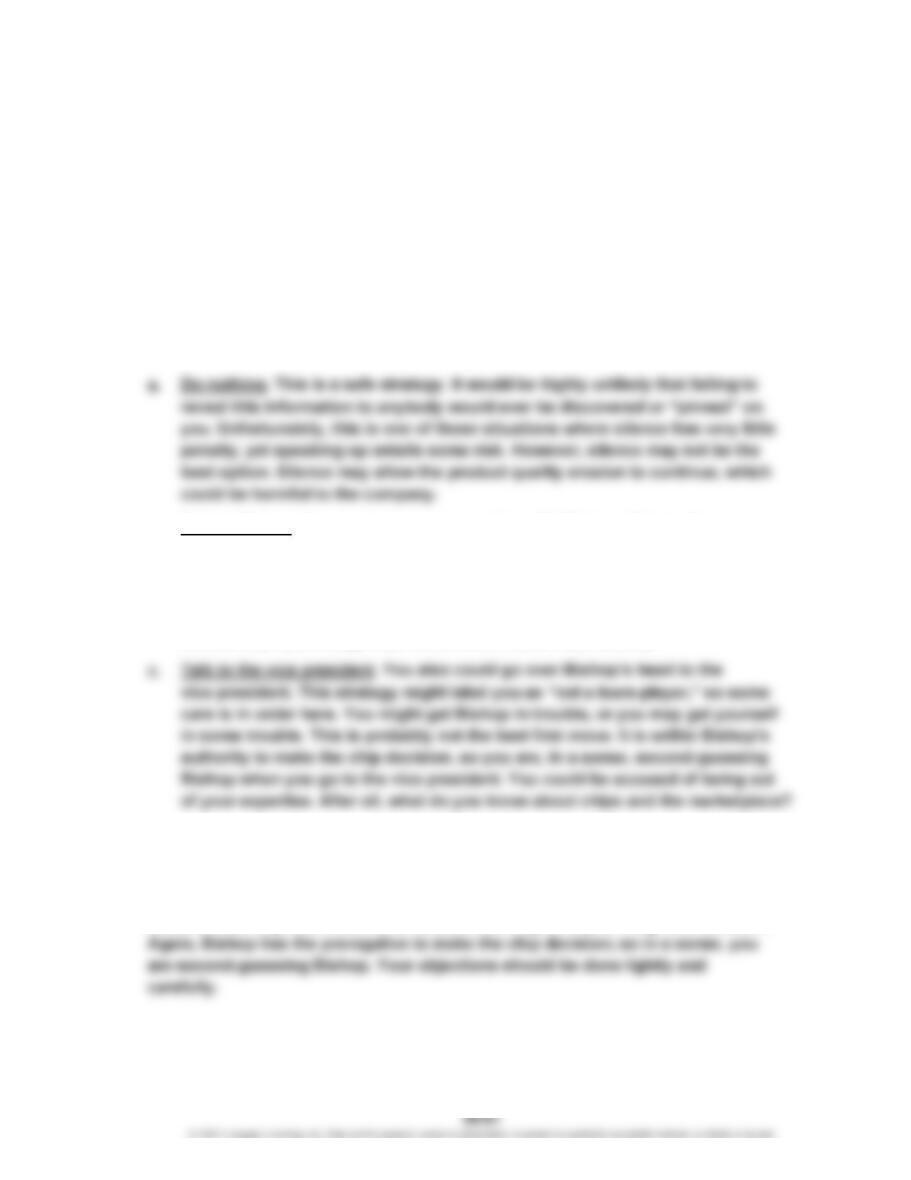
b. Talk to Bishop. You can have a conversation with Bishop. This is also a
reasonably safe strategy and probably the best start. For example, you may
discover that the reduction in chips was okayed by the vice president or that
there was a market study that revealed that the market thought the cookie had
too many chips. This kind of information could be discovered very easily and
without any risk through a personal conversation with Bishop.
Probably the best move is to talk to Bishop. If you discover that Bishop is acting
independently, with the primary motivation being to improve the “bottom line,” then
you may need to talk to the vice president. This is a delicate situation. You would
need to make your case that the reduction in chips strikes you as a short-term
decision that may have short-term benefits but may be a poor long-term decision.
CASES & PROJECTS
CHAPTER 20 Process Cost Systems
CP 20-2
This activity can be accomplished with multiple groups assigned to one or more
of the industry categories. Assign at least one group to each industry category.
(Some are easier than others, so some groups may be assigned multiple categories.)
Have the groups report their research back to the class. The class’s final product
should be a table identifying a company, products, materials, and processes used
by these industries. The most difficult information to obtain is the processes and
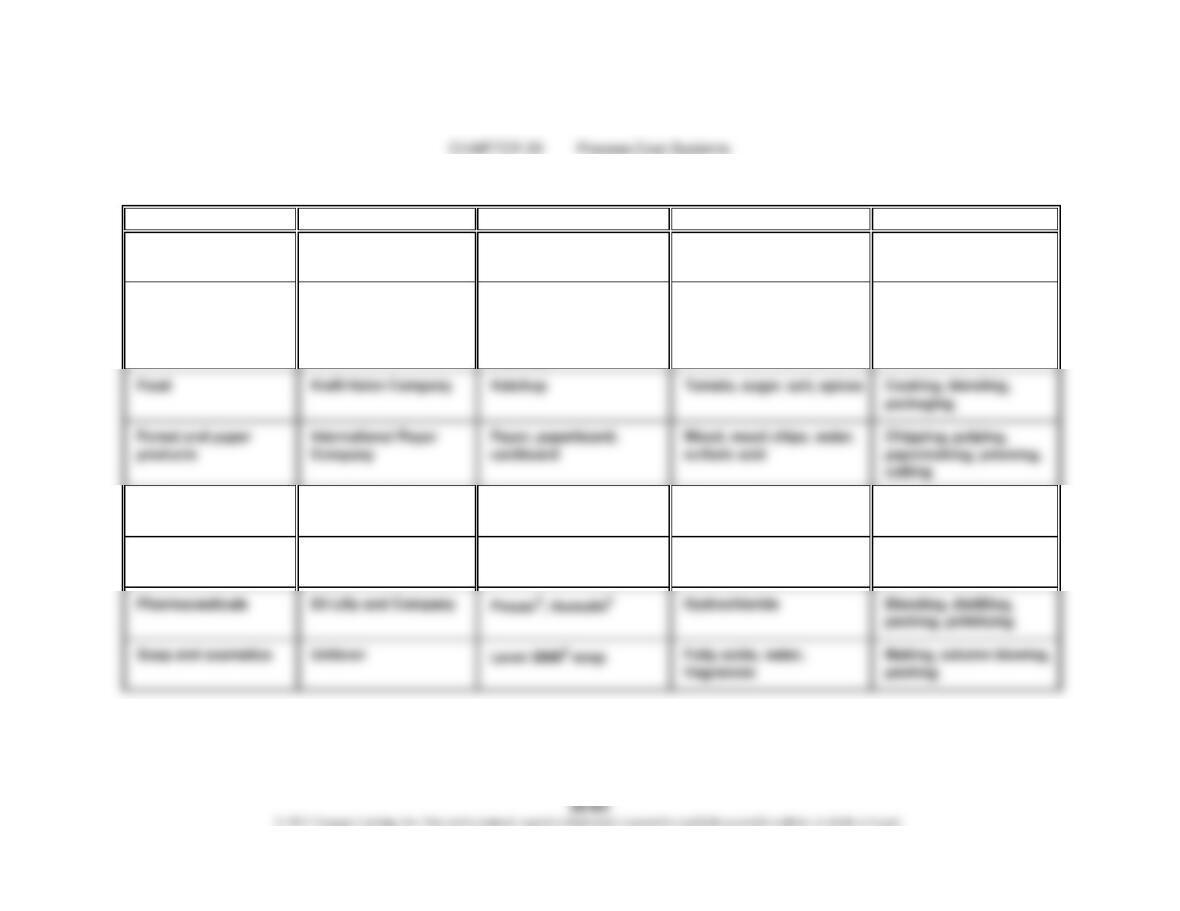
CP 20-2 (Concluded)
Industry Category Example Company Products Materials Processes
Beverages PepsiCo, Inc. Pepsi, Diet Pepsi Sugar, carbonated water,
concentrate
Mixing, bottling
Chemicals E. I. du Pont de
Nemours and Company
Stainmaster®, Kevlar®,
Lycra®, Teflon®,
refrigerants, electronic
materials
Petroleum and petroleum-
based intermediates
(esters and olefins)
Reaction, blending,
distilling, extruding
Metals AK Steel Holding
Corporation
Steel Iron ore, coke Melting, casting, rolling
Petroleum refining BP Gasoline, diesel, kerosene Oil Catalytic converting,
distilling
CHAPTER 20 Process Cost Systems
CP 20-3
To: Jamarcus Bradshaw
From: Student Name
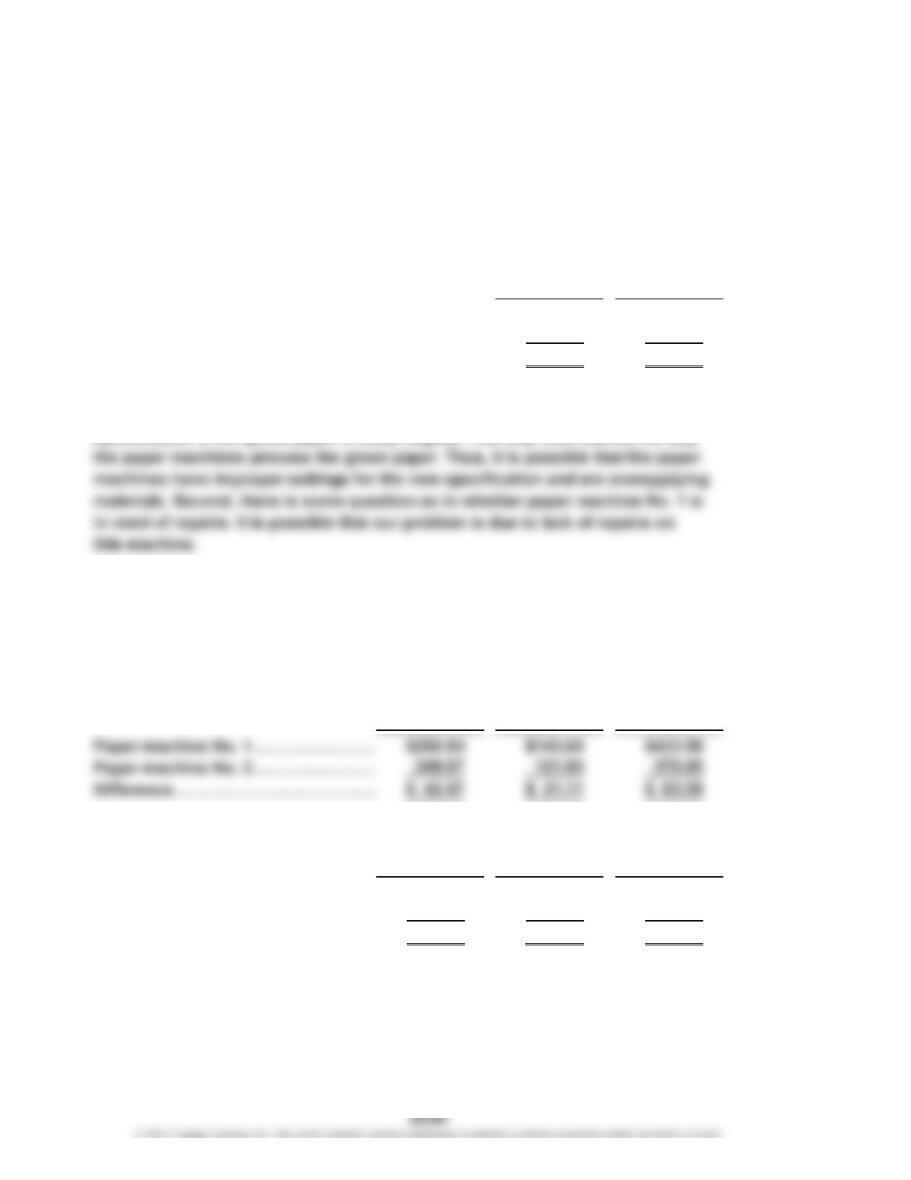
Re: Analysis of August Increase in Unit Costs for Papermaking Department
The increase in the unit costs from July to August occurred for both the
conversion and materials (pulp and chemicals) costs in the Papermaking
Department, as indicated in the table below.
July August
Materials cost per ton……………………………………
…
$246.33 $269.12
Conversion cost per ton…………………………………
…
121.67 132.39
Total…………………………………………………………
…
$368.00 $401.51
An analysis was done to isolate the cause of the increased cost per ton. My
interviews indicated that there were two possible causes. First, we changed the
Fortunately, we run both colors on paper machine No. 1. Thus, we can separate
the analysis between these two possible explanations. I have provided the
following cost per ton data for the two paper machines and the two product
colors:
Paper machine analysis:
Materials Conversion
Cost per Ton Cost per Ton Total
…
…
…
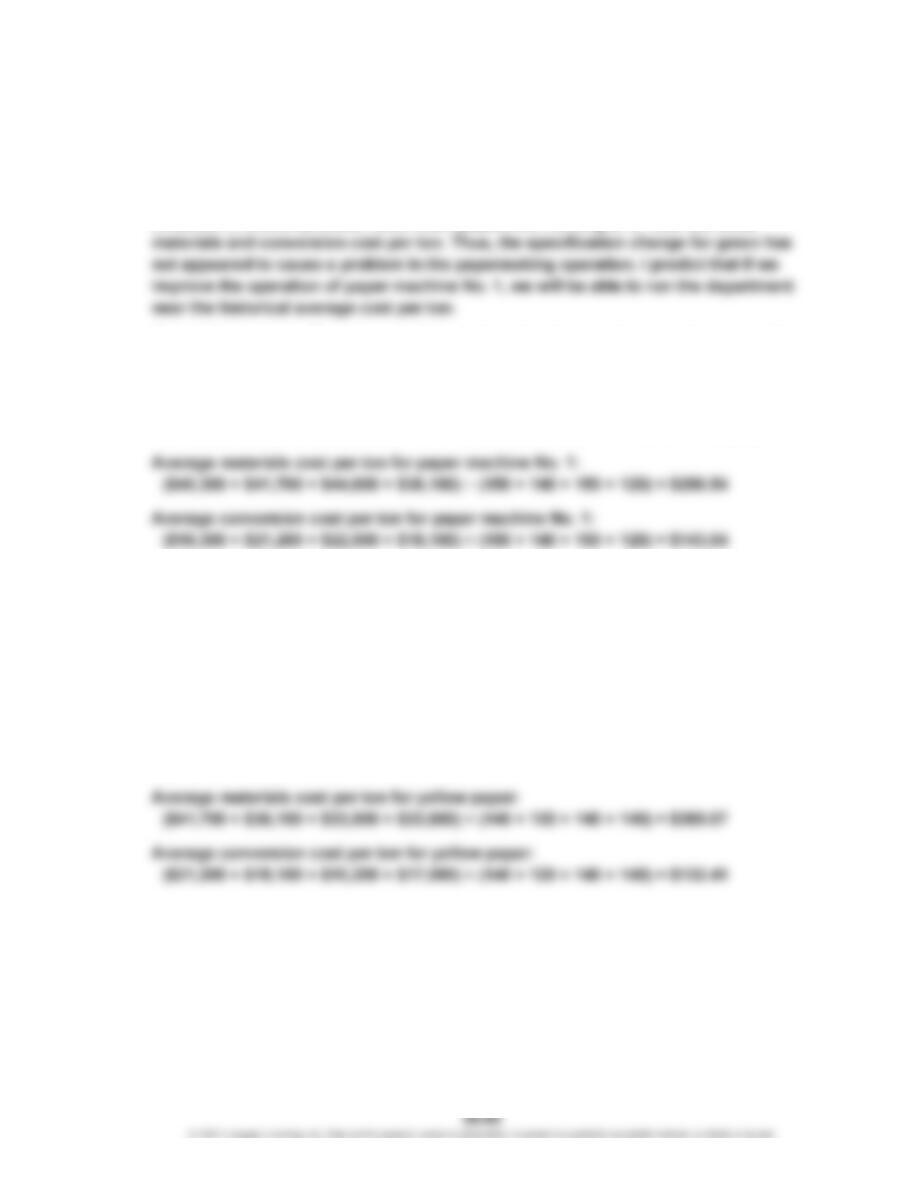
Product color analysis:
Materials Conversion
Cost per Ton Cost per Ton Total
Green……………………………………
…
$269.15 $132.37 $401.52
Yellow……………………………………
…
269.07 132.41 401.48
Difference………………………………
…
$ 0.08 $ (0.04) $ 0.04
CHAPTER 20 Process Cost Systems
CP 20-3 (Concluded)
The results are clear. Paper machine 1 has a much higher materials and conversion
cost per ton in August. Apparently, the paper machine is overapplying pulp. This is
resulting in an increase in both the materials and conversion cost per ton. Paper
machine No. 2 is running at a cost near our historical cost per ton. There is no
Note to Instructors: The paper machine and product line analysis are determined by
summarizing the data from the computer run provided in the problem. Students
must divide costs by ton-volume for each paper machine and then do the same
thing for each product color. The tables in the memo show the results of the
following analysis (a spreadsheet is recommended for performing this analysis):
Average materials cost per ton for paper machine No. 2:
($38,300 + $33,900 + $35,600 + $33,600) ÷ (160 + 140 + 130 + 140) = $248.07
Average conversion cost per ton for paper machine No. 2:
($18,900 + $15,200 + $18,400 + $17,000) ÷ (160 + 140 + 130 + 140) = $121.93
Average materials cost per ton for green paper:
($40,300 + $44,600 + $38,300 + $35,600) ÷ (150 + 150 + 160 + 130) = $269.15
Average conversion cost per ton for green paper:
($18,300 + $22,500 + $18,900 + $18,400) ÷ (150 + 150 + 160 + 130) = $132.37
CHAPTER 20 Process Cost Systems
CP 20-4
a. This accounting procedure has the effect of rewarding the production of
broke. In essence, the procedure communicates to operating personnel that
broke is a normal part of doing business. In fact, besides broke being a normal
b. The accounting for broke that is typical in the industry fails to account for the
total impact of broke. It is true that the use of recycled materials may reduce the
direct materials cost to the operation. However, such a view is very limited. For
example, the production of broke has a cost. Machine capacity was used to
produce the broke in the first place. Therefore, broke has an original materials
cost and a machine cost. Both of these together are likely to be greater than the
cost of virgin material. One mill manager once commented, “There is a free
paper machine out there.” What he was implying is that if all the machine
capacity used to produce broke could be harnessed for good production, it
would have been equal to a “free” paper machine. The cost of misused capacity
CHAPTER 20 Process Cost Systems
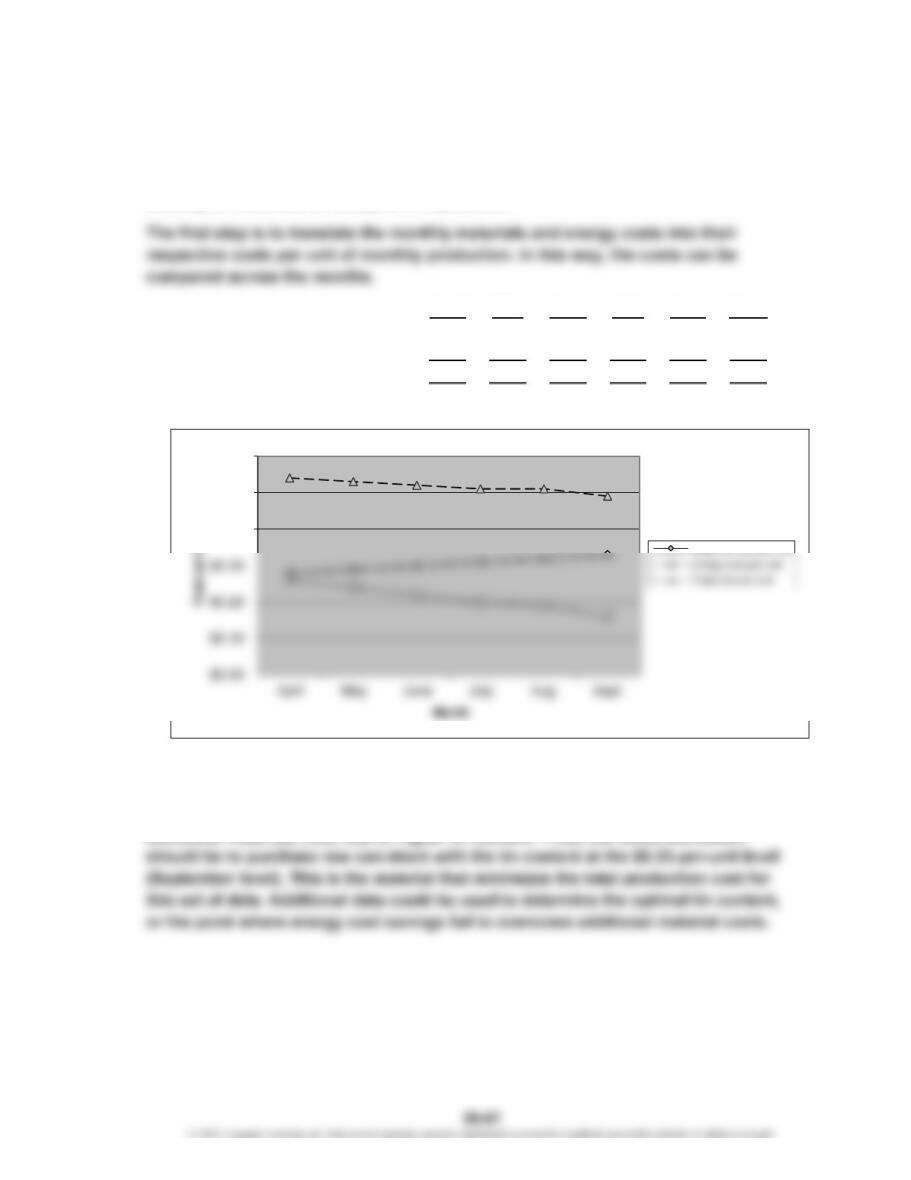
CP 20-5
This case is abstracted from a real situation, where higher raw materials costs due
to tin content were more than offset by lower energy costs. The cost system used
in the real situation was a sophisticated “real-time” expense tracking system. The
subtlety of this trade-off analysis is impressive.
April May June July Aug. Sept.
Materials cost per unit………………
…
$0.28 $0.29 $0.30 $0.31 $0.32 $0.33
Energy cost per unit…………………
…
0.26 0.24 0.22 0.20 0.19 0.16
Total cost per unit……………………
…
$0.54 $0.53 $0.52 $0.51 $0.51 $0.49
The graph below shows the total unit cost data for each month.
The graph reveals that the tin content and energy costs are inversely related. That
is, as the materials cost increased due to higher tin content, the energy costs
dropped. In fact, the total cost line shows that the energy savings exceeds the
$0.40
$0.50
$0.60