
Chapter 20—Cost-Volume-Profit Analysis
Financial and Managerial Accounting, 18e 20-1
20 COST-VOLUME-PROFIT ANALYSIS
Chapter Summary
The relationship between costs and revenue and the level of business activity is the
foundation of profit planning. We begin our presentation of cost-volume-profit analysis
with an introduction to cost behavior relationships. Fixed, variable and semivariable cost
functions are illustrated graphically and numerically. The distinction between the behavior
of total and unit costs is explained and graphically illustrated as well.
With the various cost behavior patterns established, the chapter turns to the
development of the basic CVP model. This analysis is initially presented graphically.
Following discussion of the contribution margin concept the same results are established
numerically. The model is solved for target levels of operating income and the margin of
safety. A number of comparative static experiments illustrate the usefulness of the CVP
model in a realistic planning situation. This example is developed from the point of view
of managers of several different functional areas.
The chapter concludes with an examination of the significance of sales mix and the
high-low method of estimating fixed and variable components of mixed costs.
Learning Objectives
1. Explain how fixed, variable, and semivariable costs respond to changes in the volume
of business activity.
2. Explain how economies of scale can reduce unit costs.
3. Prepare a cost-volume-profit graph.
4. Compute contribution margin and explain its usefulness.
5. Determine the sales volume required to earn a desired level of operating income.
6. Use the contribution margin ratio to estimate the change in operating income caused
by a change in sales volume.
7. Use CVP relationships to evaluate a new marketing strategy.
8. Use CVP when a company sells multiple products.
9. Determine semivariable cost elements.

Chapter 20 – Cost-Volume-Profit Analysis
20-2 Instructor’s Resource Manual
Brief Topical Outline
A. Cost-volume relationships
1. Fixed costs (and fixed expenses)
a. Variable costs (and variable expenses)
b. Semivariable costs (and semivariable expenses) – see Case in Point
(page 883)
2. Cost-volume relationships: a graphic analysis
3. The behavior of per-unit costs – see Your Turn (page 886)
4. Economies of scale – see Case in Point (page 886)
5. Additional cost behavior patterns
B. Cost behavior and operating income
6. Cost-volume-profit analysis: an illustration
7. Preparing and using a cost-volume-profit graph
8. Contribution margin: a key relationship
a. Contribution margin ratio
9. How many units must we sell?
10. How many dollars in sales must we generate?
11. What is our margin of safety?
12. What change in operating income do we anticipate?
13. Business applications of CVP
a. Director of advertising
b. Analysis
c. Plant manager – see Your Turn (page 894)
d. Analysis
e. Vice president of sales
f. Analysis
14. Additional considerations in CVP
15. CVP analysis when a company sells many products
a. Improving the “quality” of the sales mix
16. Determining semivariable cost elements: the high-low method
17. Assumptions underlying cost-volume-profit relationships
18. Summary of basic cost-volume-profit relationships – see Ethics, Fraud
& Corporate Governance (page 898)
C. Concluding remarks

Chapter 20—Cost-Volume-Profit Analysis
Financial and Managerial Accounting, 18e 20-3
Topical Coverage and Suggested Assignment
Class
Meetings on
Chapter
Topical
Outline
Coverage
Discussion
Questions*
Brief
Exercises*
Exercises*
Problems*
Critical
Thinking
Cases*
1
A
1, 3, 5
1, 2, 9
2
B
7, 8, 9
4, 5, 6
3, 4, 5
1
2
3
B – C
13, 14, 15
10
6, 11, 14
5
*Homework assignment (to be completed prior to class)
Comments and Observations
Teaching Objectives for Chapter 20
In this chapter, we explain the patterns of cost behavior and cost-volume-profit
relationships. In discussing cost behavior patterns and cost-volume-profit analysis, our
teaching objectives are to:
10. Explain the importance of understanding cost-volume-profit relationships in planning
and controlling business operations.
11. Define and provide examples of fixed costs, variable costs, and semivariable costs.
12. Contrast the behavior of a cost expressed on per-unit basis with that of the total cost.
13. Explain that cost behavior patterns (and cost-volume-profit analysis) serve only as
useful approximations. (As part of this discussion, explore other cost behavior
patterns and introduce the concept of the relevant volume range.)
14. Illustrate the preparation of a break-even graph, and explain its usefulness.
15. Define contribution margin, contribution margin ratio, and contribution margin
per unit. (Stress that these concepts form the cornerstone of cost-volume-profit
analysis, and also will be used extensively in later chapters.)
16. Show how contribution margin ratio and/or contribution margin per unit are used
to determine the sales volume necessary to earn a specified level of operating income.
17. Illustrate the importance of sales mix and the relative contribution margin ratios of
different products.
18. Illustrate and explain the high-low method of determining the fixed and variable
components of a semivariable cost.
19. Review the assumptions underlying cost-volume-profit analysis.
20. Review the summary of basic cost-volume-profit relationships.

Chapter 20 – Cost-Volume-Profit Analysis
20-4 Instructor’s Resource Manual
General Comments
We find that the challenge in successfully presenting cost-volume-profit analysis is
to get students to understand the significance of contribution margin, rather than to
commit numerous formulas to memory. Memorizing formulas serves little purpose beyond
the next exam; an understanding of the concept of contribution margin, however, can serve
students well through a lifetime of managerial and personal financial decisions.
Contribution margin is merely that portion of revenue that “contributes” to fixed
costs and (after covering the fixed costs) to operating income. In short, all revenue except
for the contribution margin is consumed by the variable costs relating to the revenue. Once
students grasp the fact that only the contribution margin “contributes” to covering fixed
costs and to providing a profit, most of the formulas presented in this chapter will “fall into
place.”
Supplemental Exercises
Group Exercise
Suppose a company faces two technologies for manufacturing its single product.
The first requires significantly higher fixed costs but much smaller unit variable costs than
does the second. As a group, decide the product that your company is producing.
Additionally, reach a consensus on the figures that will be used for the fixed costs as well
as the changes that will occur to variable costs under the first and second technology
options. Enter this information into Excel and prepare a cost-volume-profit graph for each
of the technologies. Using the graphs, discuss the economic circumstances that would lead
to a choice of one technology over the other.
Internet Exercise
Read the article, The Cost of Manufacturing Disruptions, published by the Institute
of Management Accountants. Discuss the process proposed for measuring disruption costs.
Do you agree or disagree with the author’s final conclusions? Why?

Chapter 20—Cost-Volume-Profit Analysis
Financial and Managerial Accounting, 18e 20-5
CHAPTER 20 NAME #
10-MINUTE QUIZ A SECTION
Information regarding a product manufactured and sold by Schiffman is shown below:
Maximum capacity with existing facilities 4,000 units
Total fixed costs per month ……………………………………………………………….. $50,000
Variable cost per unit ……………………………………………………………………….. $42.00
Sales price per unit …………………………………………………………………………… $56.00
1. Refer to the above data. The contribution margin ratio for this product is:
a 20%. c 30%.
b 25%. d 40%.
2. Refer to the above data. The number of units Schiffman must sell to break even is: (rounded)
a 3,927. c 4,823.
b 3572. d 5,140.
3. Refer to the above data. The dollar sales volume necessary to produce monthly operating
income of $12,000 before taxes is:
a $188,000. c $288,000.
b $186,000. d $248,000.
Use the following data for questions 4 and 5.
The monthly high and low levels of units and total manufacturing overhead for Ratnere Company
are shown below:
Manufacturing
Units
Overhead
Highest observed level ……………………………………………. 117,000 $306,000
Lowest observed level ……………………………………………. 81,000 234,000
4. Refer to the above data. The cost formula for Ratnere’s monthly overhead cost can be
expressed as:
a $2.65 average cost per unit.
b $1.75 average cost per unit.
c $24,000 fixed cost plus $1.00 per unit.
d $72,000 fixed cost + $2.00 per unit.
5. Refer to the above data. In a month in which 30,000 equivalent full units are produced,
Ratnere’s manufacturing overhead should be approximately:
a $52,500. c $ 132,000.
b $79,500. d $ 90,500.

Chapter 20 – Cost-Volume-Profit Analysis
20-6 Instructor’s Resource Manual
CHAPTER 20 NAME #
10-MINUTE QUIZ B SECTION
6. Management predicts total sales for June to be $3,000,000, yielding a margin of safety of
$1,000,000 and a contribution margin ratio of 25%. Which of the following amounts is not
consistent with this information?
e a Fixed costs, $500,000.
f b Variable costs, $750,000.
g c Operating income, $250,000.
h d Break-even sales volume, $2,000,000.
Use the following data for questions 2 through 4.
The recent high and low levels of hours operated and monthly repair cost for heavy equipment for
Universal Mfg. are shown below:
Hours Operated Repair Cost
Highest observed level 24,000 $7,450
Lowest observed level ……………………………………………. 21,500 6,700
7. Refer to the above data. Using the high-low method, compute the variable element of repair
cost per hour of operation for Universal’s equipment:
a $750 c c $0.30.
b $3.33. d $0.34.
8. Refer to the above data. Using the high-low method, compute the fixed element of
Universal’s monthly repair cost:
a $150. c $6,300.
b $250. d $6,450.
9. Refer to the above data. The total estimated repair cost for a month in which Universal
operates equipment for 19,000 hours is:
a $5,950. c $6,450.
b $6,300. d $5,700.
10. Perkins Corporation manufactures two products; data are shown below:
Contribution Relative
Margin Ratio Sales Mix
Product A ……………………………………………………………… 40% 40%
Product B …………………………..………………………………….. 30% 60%
If Perkins’ monthly fixed costs average $425,000, what is its break-even point expressed
in sales dollars?
a $1,320,000. c $1,250,000.
b $1,400,000. d $990,000.

Chapter 20—Cost-Volume-Profit Analysis
Financial and Managerial Accounting, 18e 20-7
CHAPTER 20 NAME #
10-MINUTE QUIZ C SECTION
Paulsen Company sells only one product. The regular selling price is $50. Variable costs are 70%
of this selling price, and fixed costs are $7,500 per month.
Management decides to increase the selling price from $50 to $55 per unit. Assume that the cost
of the product and the fixed operating expenses are not changed by this pricing decision.
1. Refer to the above data. At the original selling price of $50 per unit, what is the
contribution margin ratio?
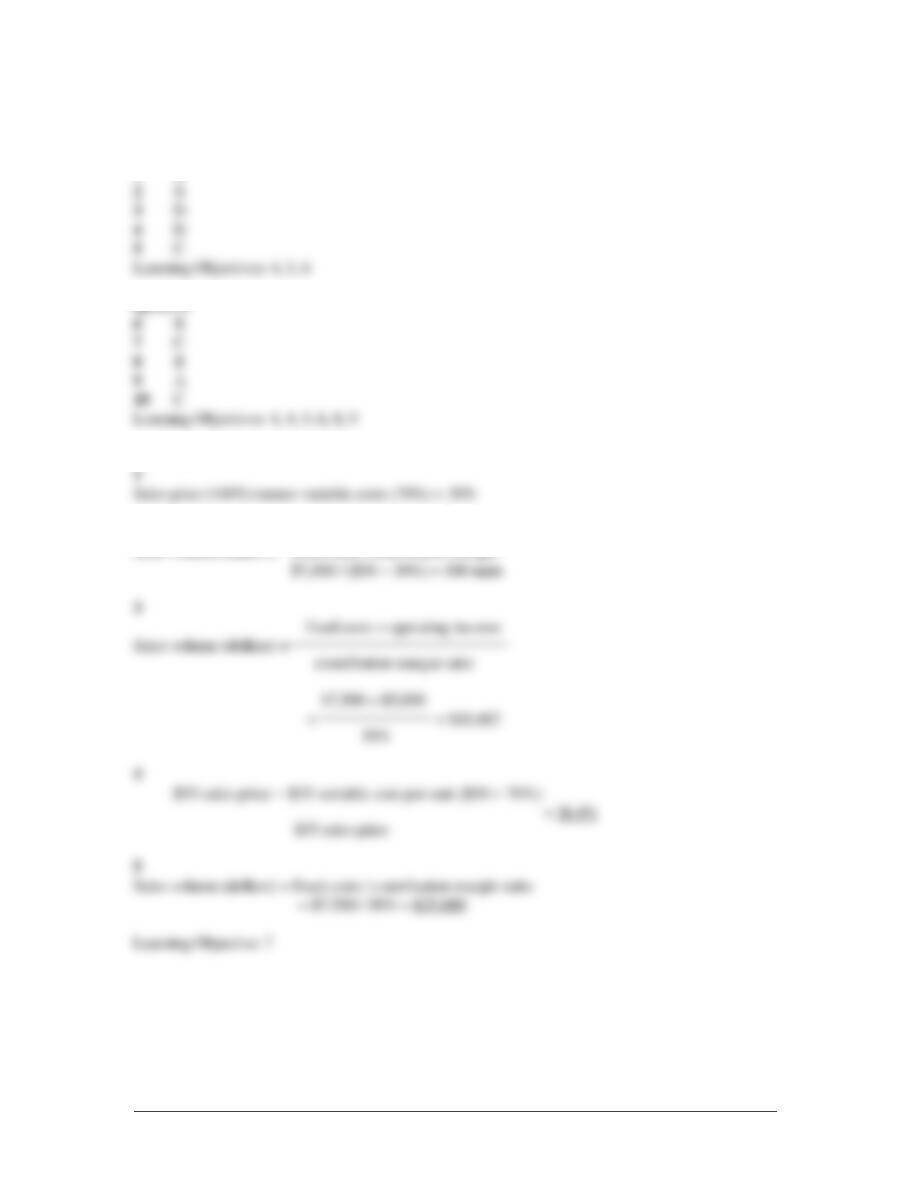
2. Refer to the above data. At the original selling price of $50 per unit, how many units must
Paulsen sell to break even?
3. Refer to the above data. At the original selling price of $50 per unit, what dollar volume of
sales per month is required for Paulsen to earn a monthly operating income of $5,000?
4. Refer to the above data. At the increased selling price of $55 per unit, what is the contribution
margin ratio?
5. Refer to the above data. At the increased selling price of $55 per unit, what dollar volume of
sales per month is required to break-even?

Chapter 20 – Cost-Volume-Profit Analysis
20-8 Instructor’s Resource Manual
CHAPTER 20 NAME #
10-MINUTE QUIZ D SECTION
Rhinefold brews reduced calorie beer and regular beer. Sales of its reduced calorie beer represent
25% of the company’s total revenue. Sales of regular beer represent the remaining 75%. Reduced
calorie beer has a contribution margin ratio of 80%, whereas the contribution margin ratio of regular
beer is only 60%. Rhinefold’s monthly fixed costs average $609,500.
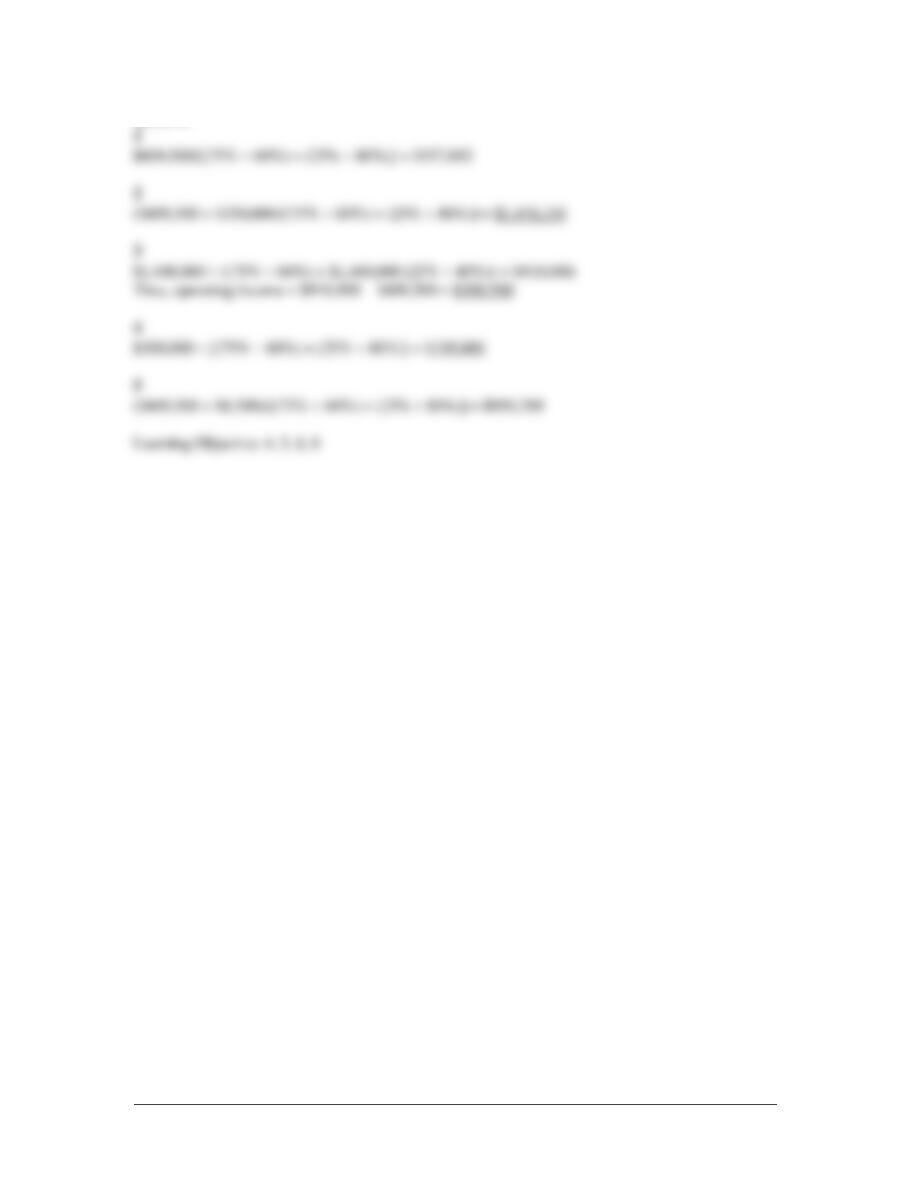
1. What is the company’s monthly break-even point expressed in sales dollars? $__________
2. What monthly sales level must be achieved for Rhinefold to earn a monthly operating income
of $350,000? $__________
3. If Rhinefold generates $1,400,000 in monthly sales, it will earn a monthly operating income
of $__________.
4. Assume Rhinefold’s margin of safety was $300,000 in May. What was the company’s
operating income in May? $__________.
5. If Rhinefold’s monthly fixed costs increase by $8,500, what level of monthly sales revenue
will be required to break-even? $__________.
Chapter 20—Cost-Volume-Profit Analysis
Financial and Managerial Accounting, 18e 20-9
SOLUTIONS TO CHAPTER 20 10-MINUTE QUIZZES
QUIZ A
1 B
QUIZ B
QUIZ C
2
Sales volume (units) = fixed costs / contribution margin
Chapter 20 – Cost-Volume-Profit Analysis
20-10 Instructor’s Resource Manual
QUIZ D
Chapter 20 – Cost-Volume-Profit Analysis
Financial and Managerial Accounting, 18e 20-11
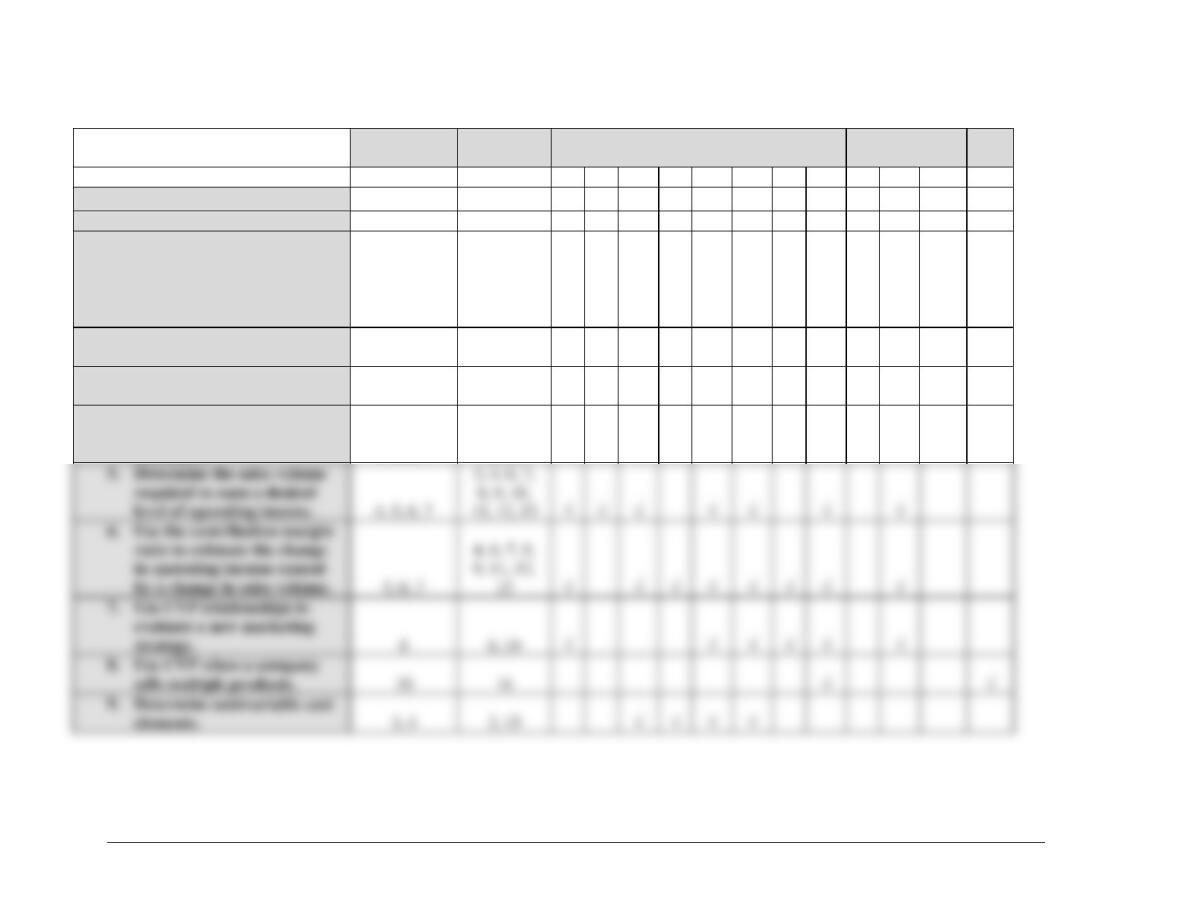
Assignment Guide to Chapter 20
Brief
Exercises
Exercises
Problems
Cases
Net
Item number
1 – 10
1 – 15
1
2
3
4
5
6
7
8
1
2
3
4
Time estimate (in minutes)
< 15
< 15
25
25
30
30
40
30
35
35
20
40
10
15
Difficulty rating
E
E
M
M
M
M
S
S
S
S
M
S
E
E
Learning Objectives:
1, 2, 3, 4, 7, 9
1, 2, 5, 9,
11, 13
1. Explain how fixed, variable,
and semivariable costs
respond to changes in the
volume of business activity.
2. Explain how economies of
scale can reduce unit costs.
1, 9, 11
3. Prepare a cost-volume-profit
graph.
4. Compute contribution
margin and explain its
usefulness.
4, 5, 6, 7
1, 3, 4, 5,
7, 8, 9, 10,
11, 13
required to earn a desired
level of operating income.
in operating income caused
by a change in sales volume.
5, 6, 7
4, 6, 7, 8,
9, 11, 12,
7. Use CVP relationships to
evaluate a new marketing
strategy.
sells multiple products.
9. Determine semivariable cost
elements.
3, 4