25 Minutes, Medium PROBLEM 20.2B
SNUG-AS-A-BUG
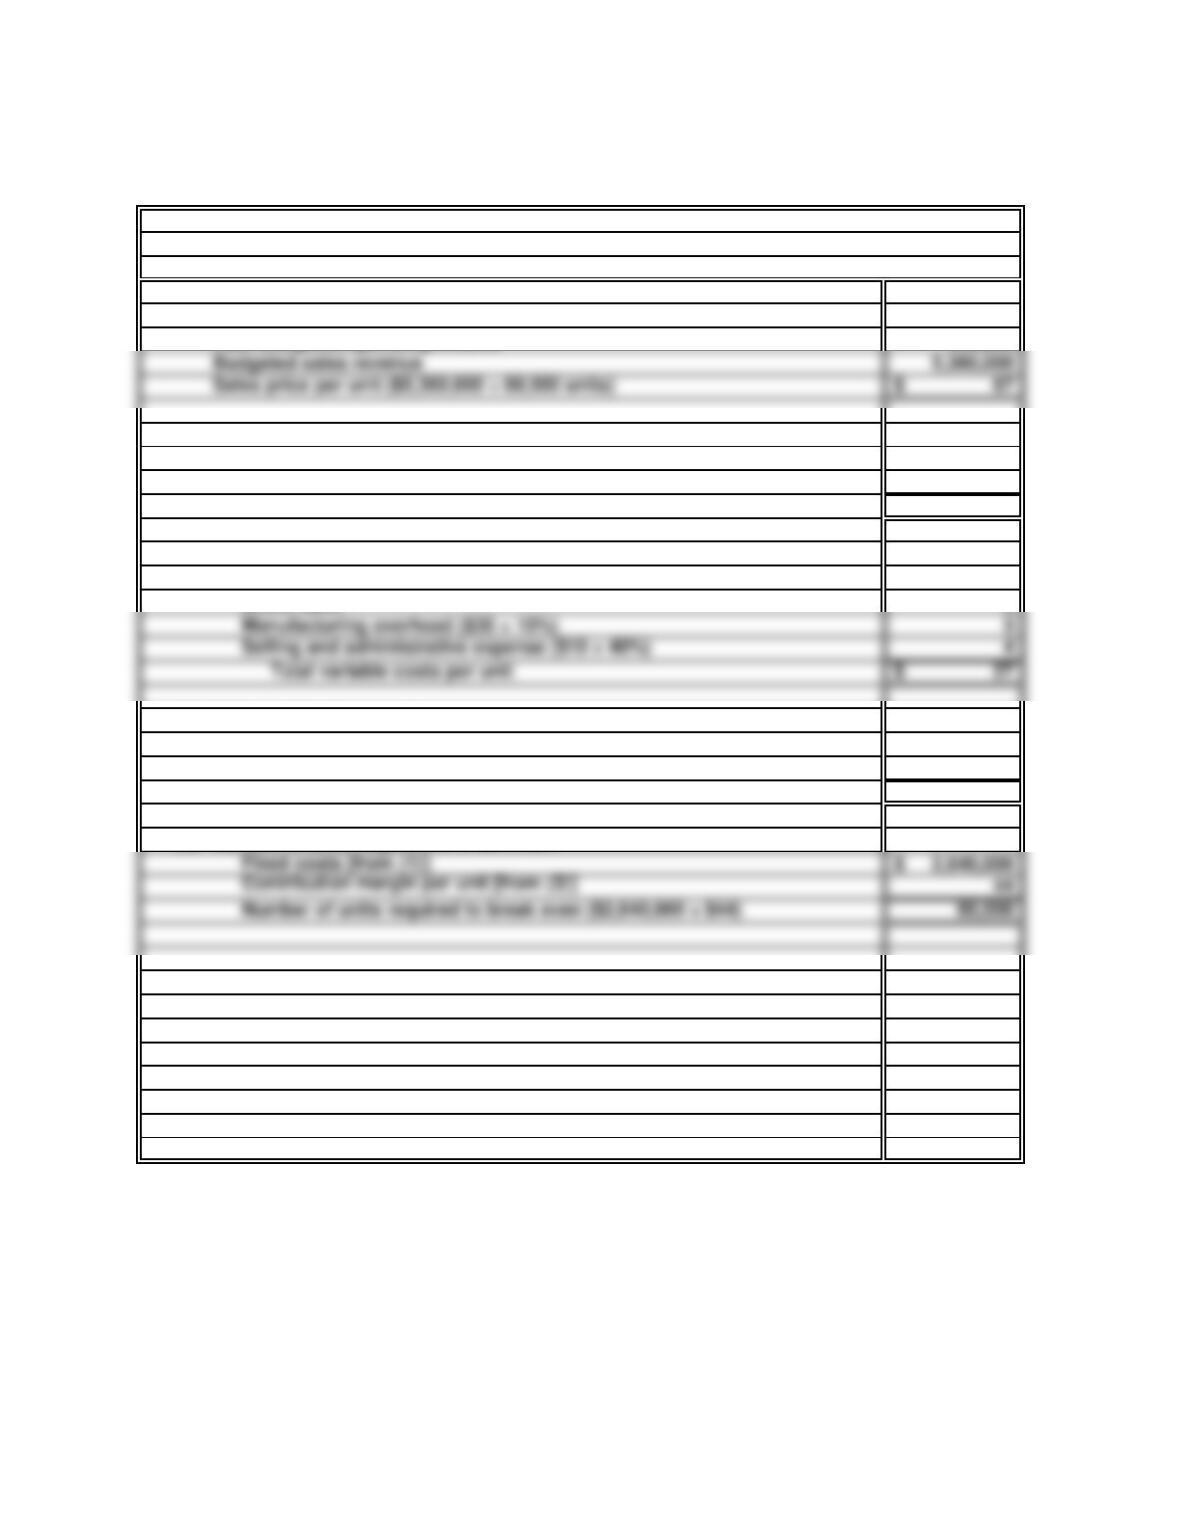
a. Sales price per unit:
Budgeted costs 4,800,000$
Add: Budgeted operating income 560,000
b. (1) Total fixed costs:
Manufacturing overhead ($2,400,000 × 90%) 2,160,000$
Selling and administrative expenses ($800,000 × 60%) 480,000
Total fixed costs 2,640,000$
Selling and administrative expense ($10 × 40%) 4
Total variable costs per unit 27$
(2) Variable costs and expenses per unit:
Direct materials 18$
Direct labor 2
(3) Unit contribution margin:
Sales price per unit 71$
Less: Variable costs per unit [from (2) ]27
Unit contribution margin 44$
(4) Number of units required to break even:
Contribution margin per unit [from (3) ]44
Number of units required to break even ($2,640,000 ÷ $44) 60,000
a.
30 Minutes, Medium
MOOR-N-MORE
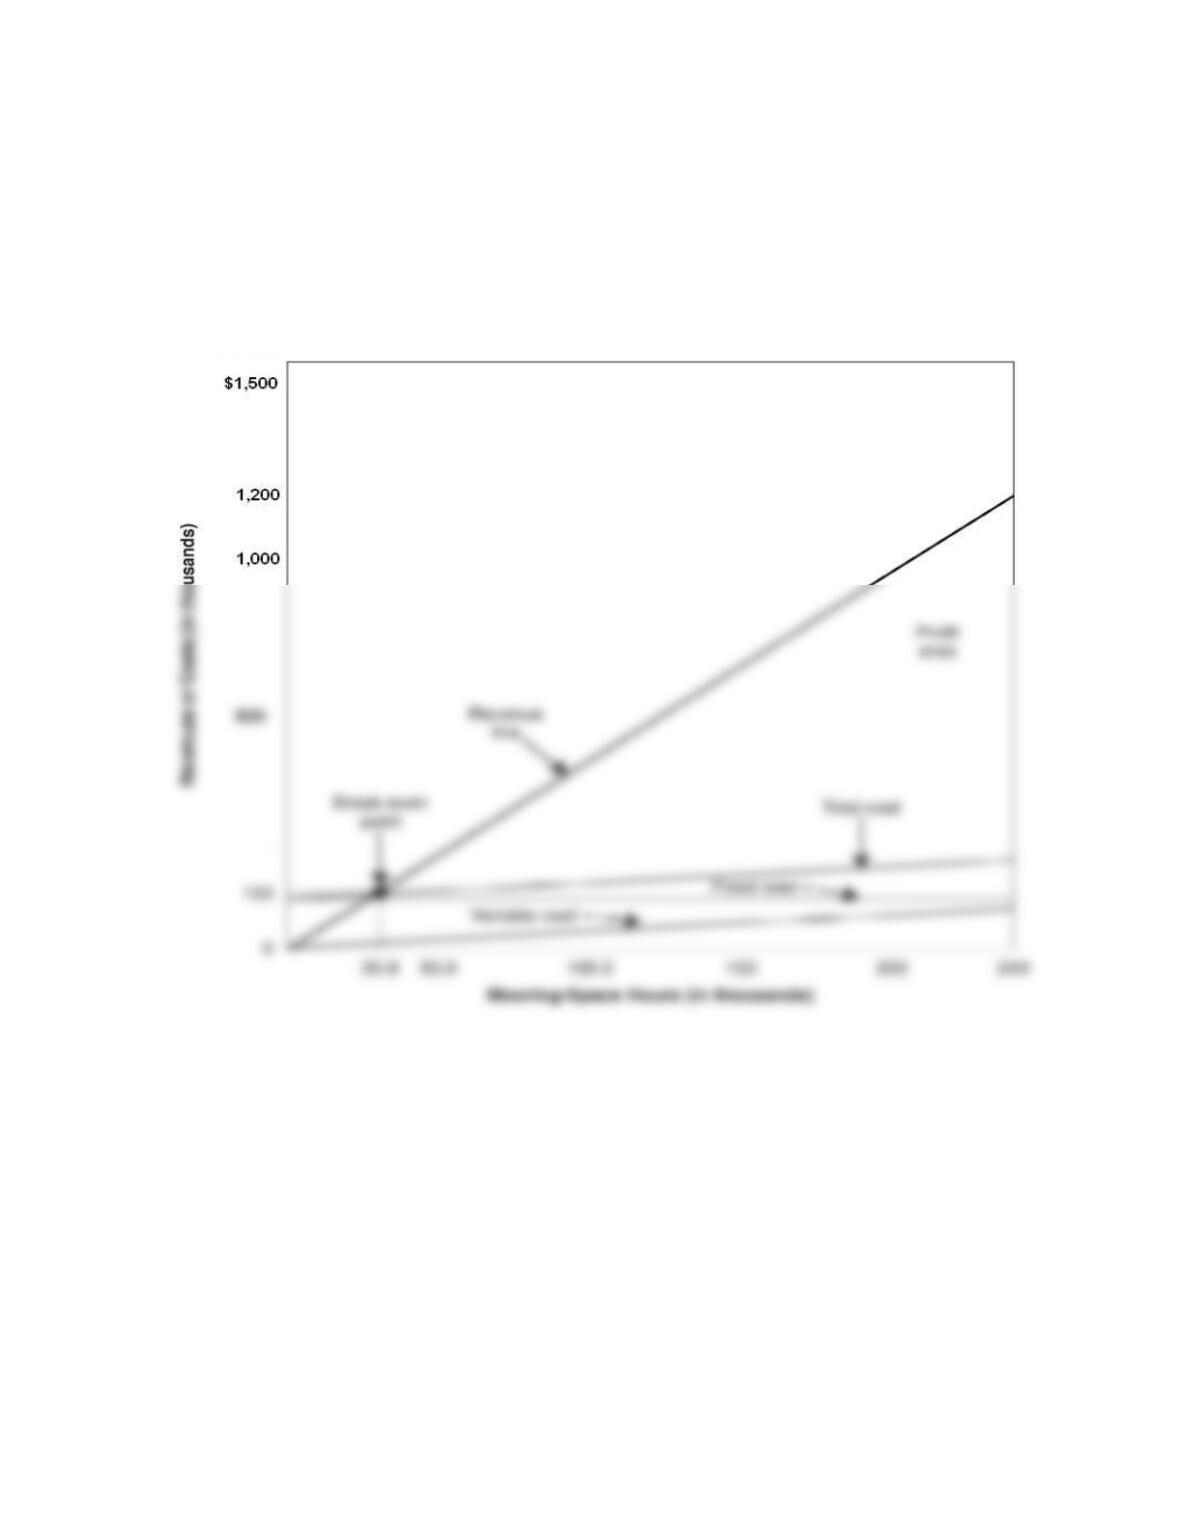
Cost-Volume-Profit Graph
Annual Basis
PROBLEM 20.3B
MOOR-N-MORE
PROBLEM 20.3B
MOOR-N-MORE (continued)
The following information is used for parts b. and c. of this problem.
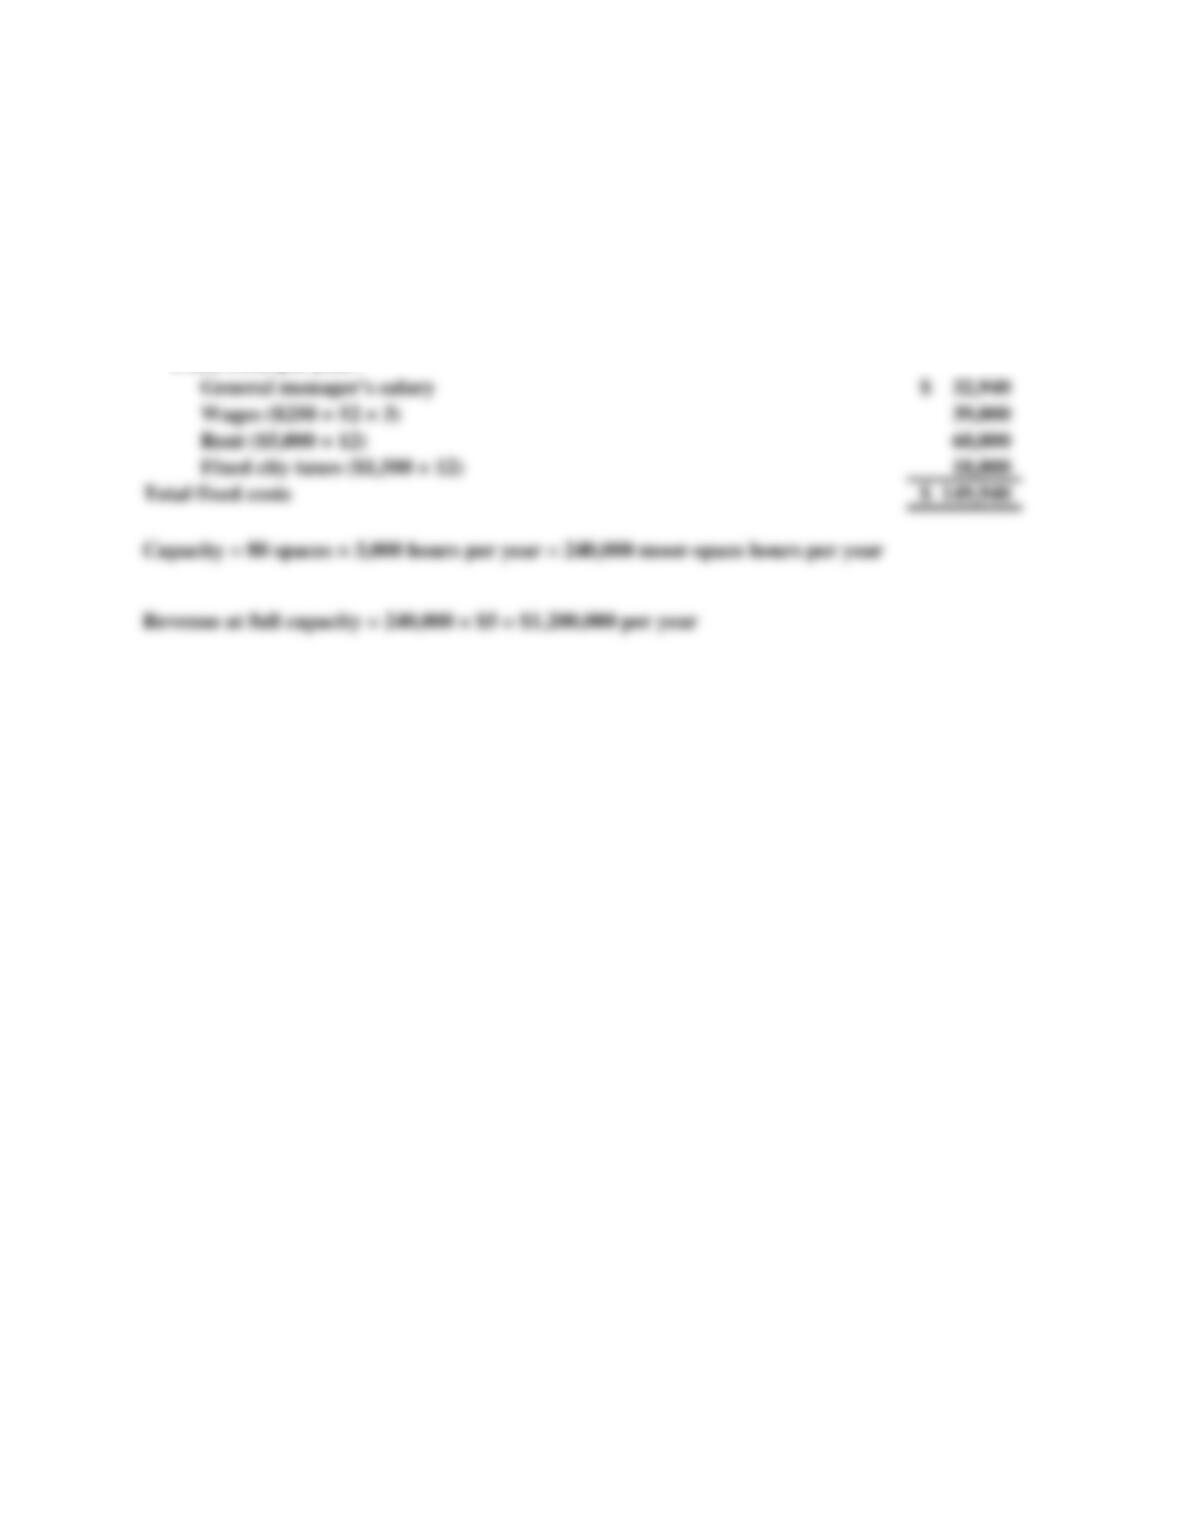
Operating data:
Revenue per mooring-space hour 5$
Variable costs per mooring-space hour 10 cents
Fixed costs per year:
PROBLEM 20.3B
MOOR-N-MORE (concluded)
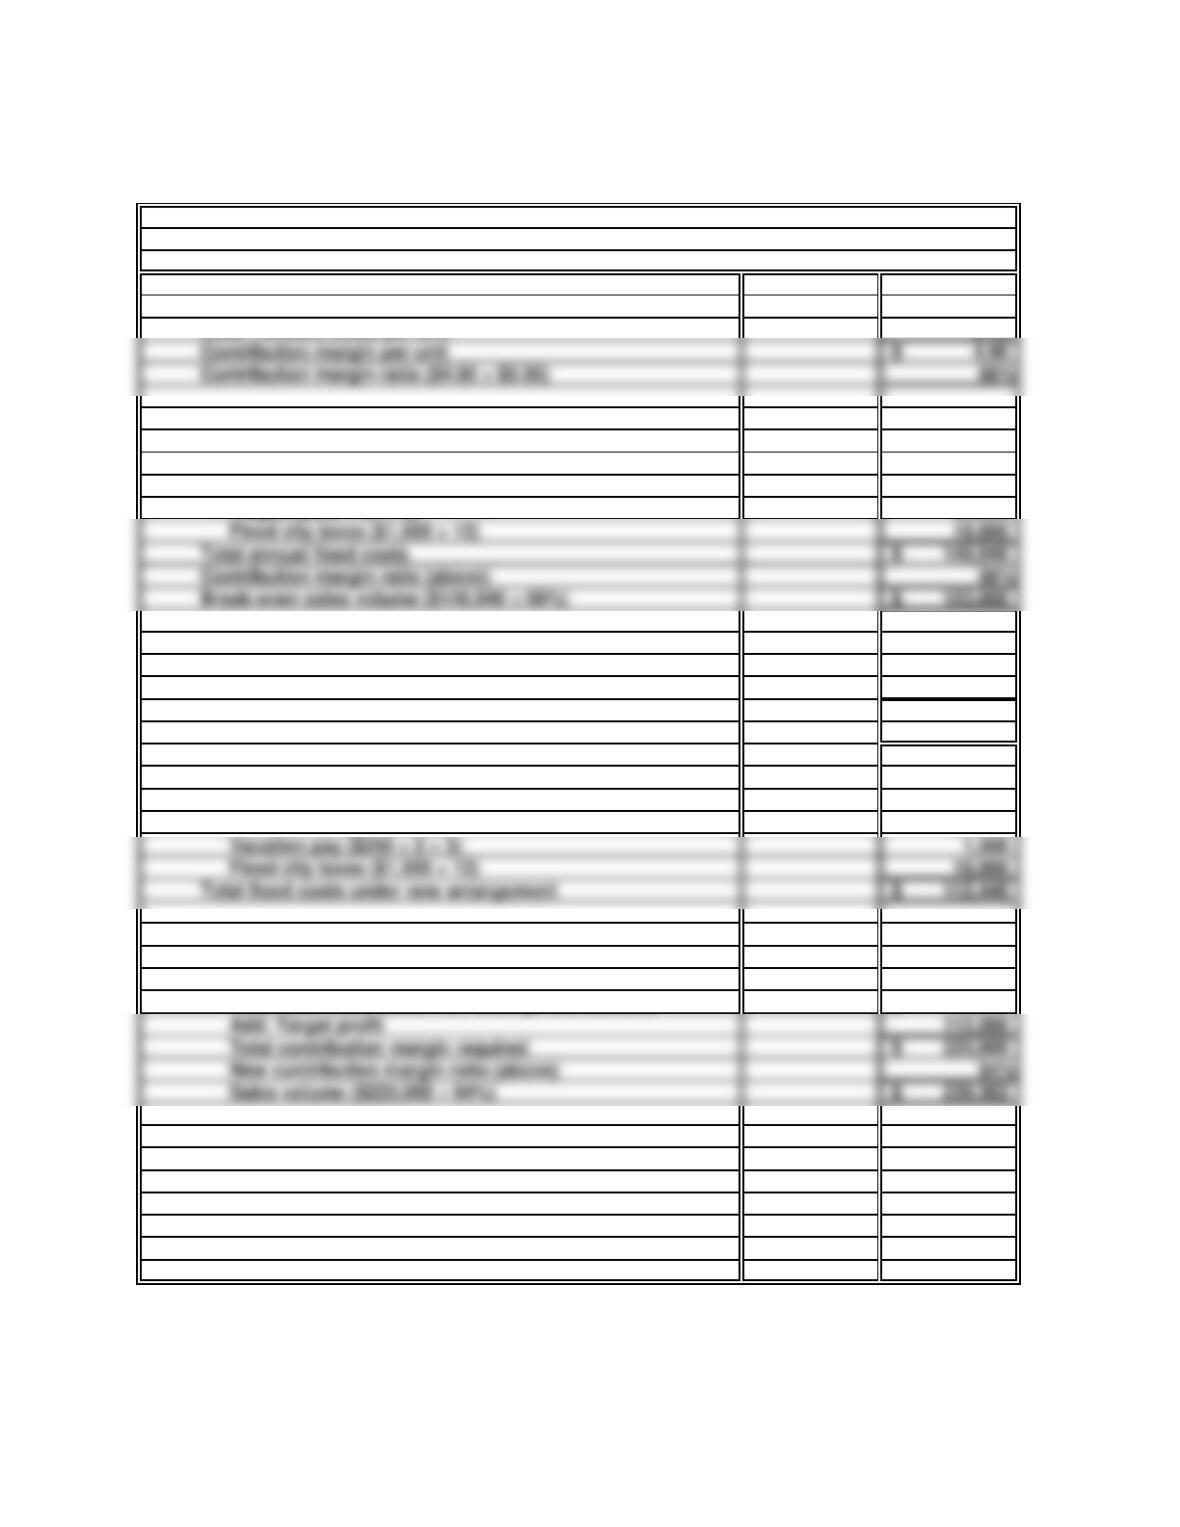
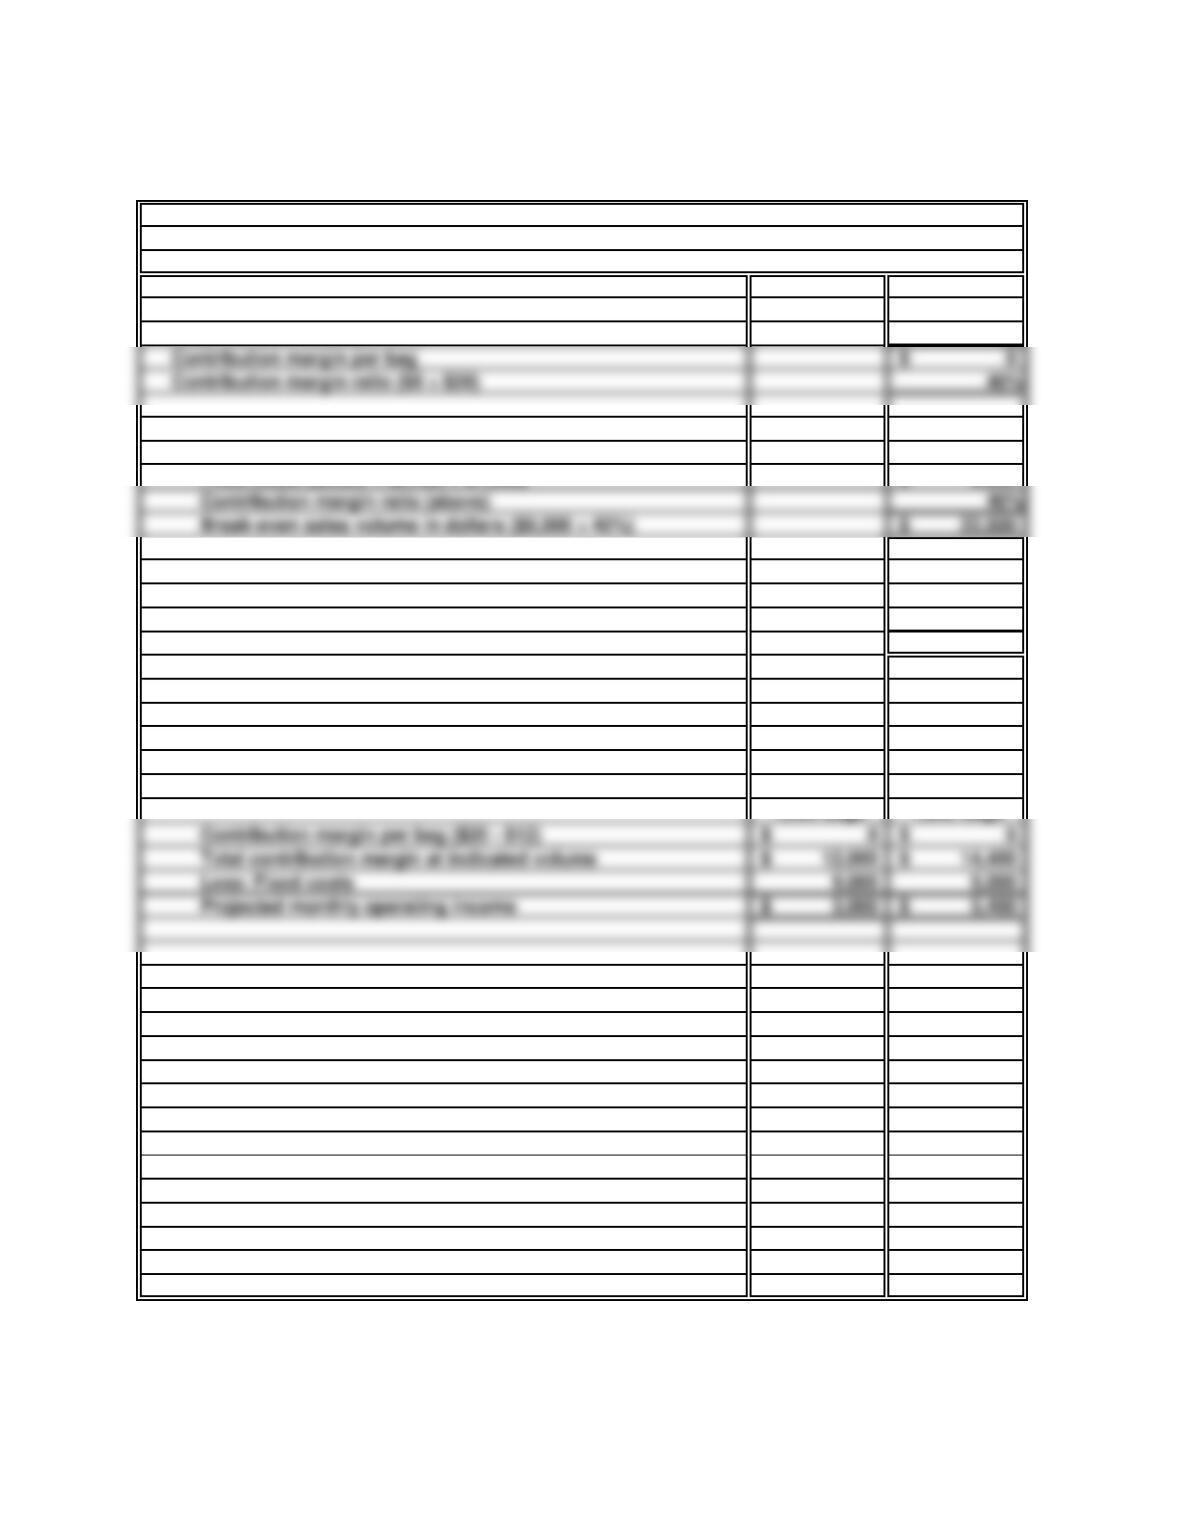
b. Contribution margin ratio:
Mooring charge per hour 5.00$
Less: Variable costs per unit 0.10
Break-even sales volume:
Fixed costs:
Rent ($5,000 × 12) 60,000$
General Manager’s salary 32,940
Wages ($250 × 52 × 3) 39,000
Fixed city taxes ($1,500 × 12) 18,000
Total annual fixed costs 149,940$
Contribution margin ratio (above) 98%
Break-even sales volume ($149,940 ÷ 98%) 153,000$
c. (1) New contribution margin ratio per parking-space hour:
Mooring charge per hour 5.00$
Less: Variable costs ($0.10 + $0.20) 0.30
Contribution margin per unit 4.70$
New contribution margin ratio ($4.70 ÷ $5.00) 94%
New level of fixed costs:
Rent ($5,000 × 12) 60,000$
General Manager’s salary 32,940
Vacation pay ($250 × 2 × 3) 1,500
Fixed city taxes ($1,500 × 12) 18,000
Total fixed costs under new arrangement 112,440$
(2) Required sales revenue to produce desired
operating income:
Total fixed costs under new arrangement (above) 112,440$
Add: Target profit 112,560
Total contribution margin required 225,000$
New contribution margin ratio (above) 94%
Sales volume ($225,000 ÷ 94%) 239,362$
Contribution margin per unit 4.90$
Contribution margin ratio ($4.90 ÷ $5.00) 98%
30 Minutes, Medium
PROBLEM 20.4B
GREEN THUMB
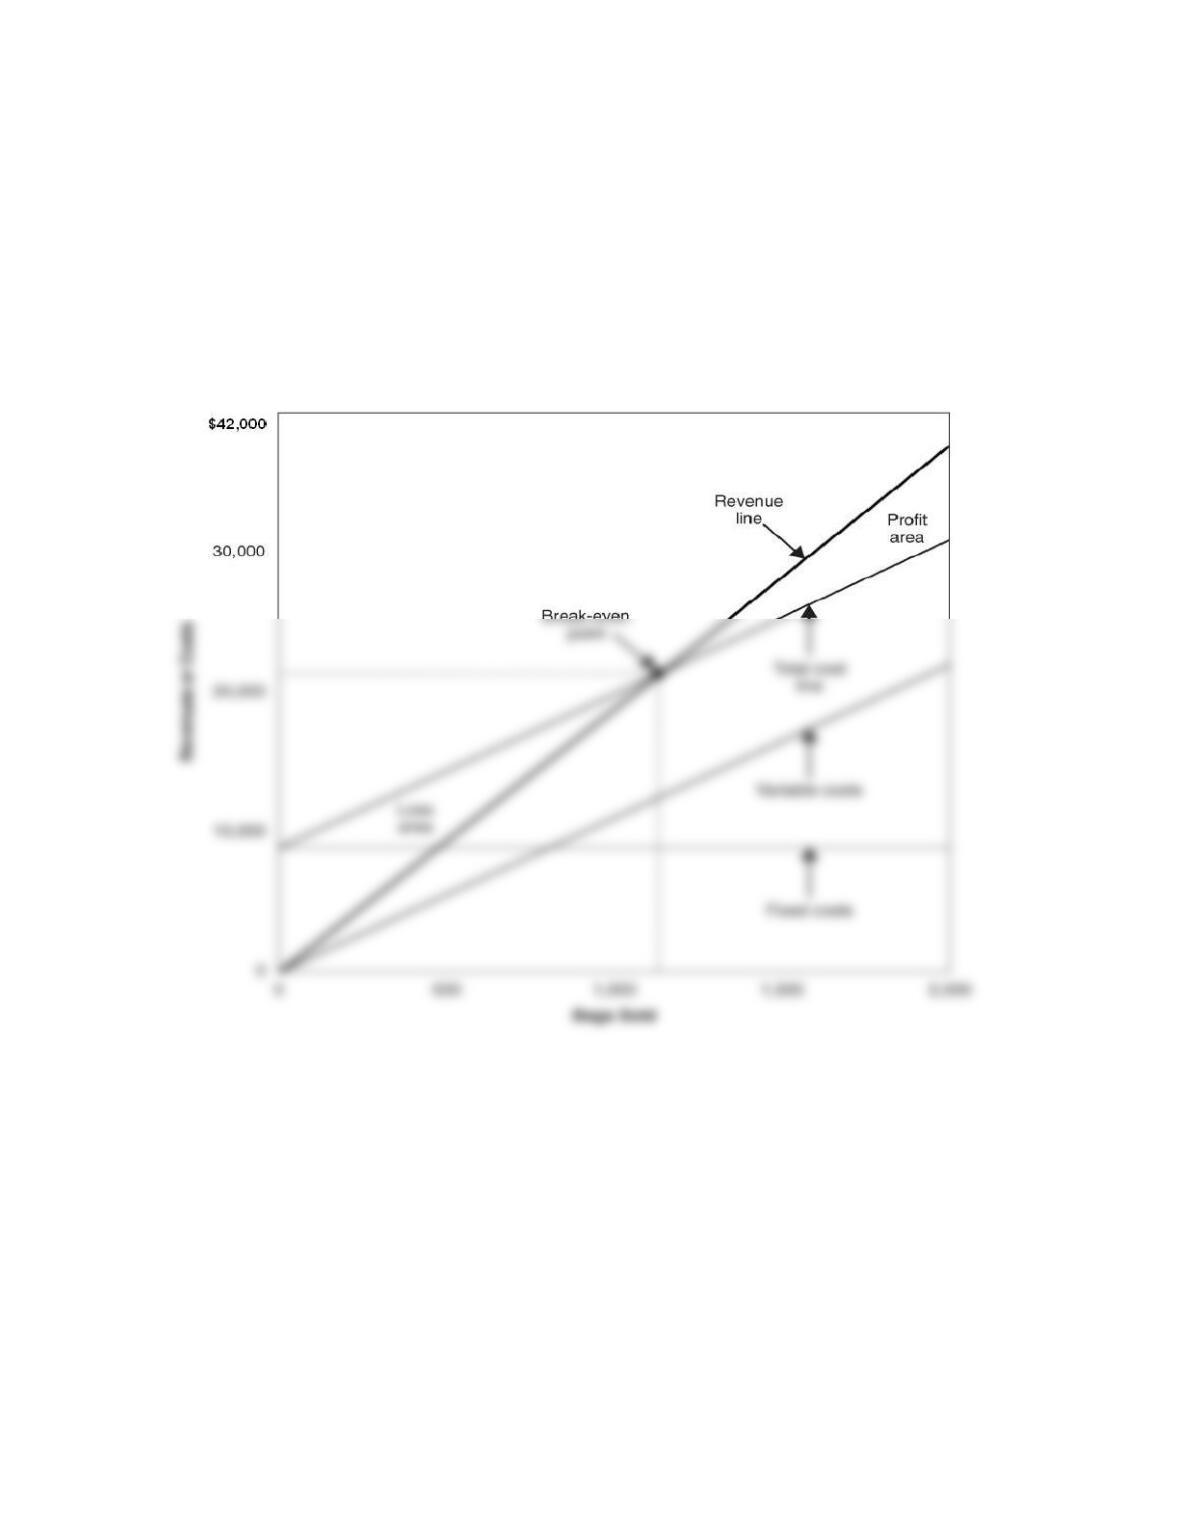
a. Contribution margin ratio:
Unit sales price 20$
Less: Variable costs per unit 12
Break-even sales volume in dollars:
Fixed costs ($5,000 + $2,400 + $1,600) 9,000$
Contribution margin ratio (above) 40%
Break-even sales volume in dollars ($9,000 ÷ 40%) 22,500$
Break-even sales volume in bags:
Break-even sales volume in dollars (above) 22,500$
Unit sales price 20$
Break-even sales volume in bags ($22,500 ÷ $20) 1,125
Less: Fixed costs 9,000 9,000
Projected monthly operating income 3,000$ 5,400$
b. On the following page.
c. Projected operating income at various levels:
1,500 bags 1,800 bags
Contribution margin ratio ($8 ÷ $20) 40%
PROBLEM 20.4B
GREEN THUMB (concluded)
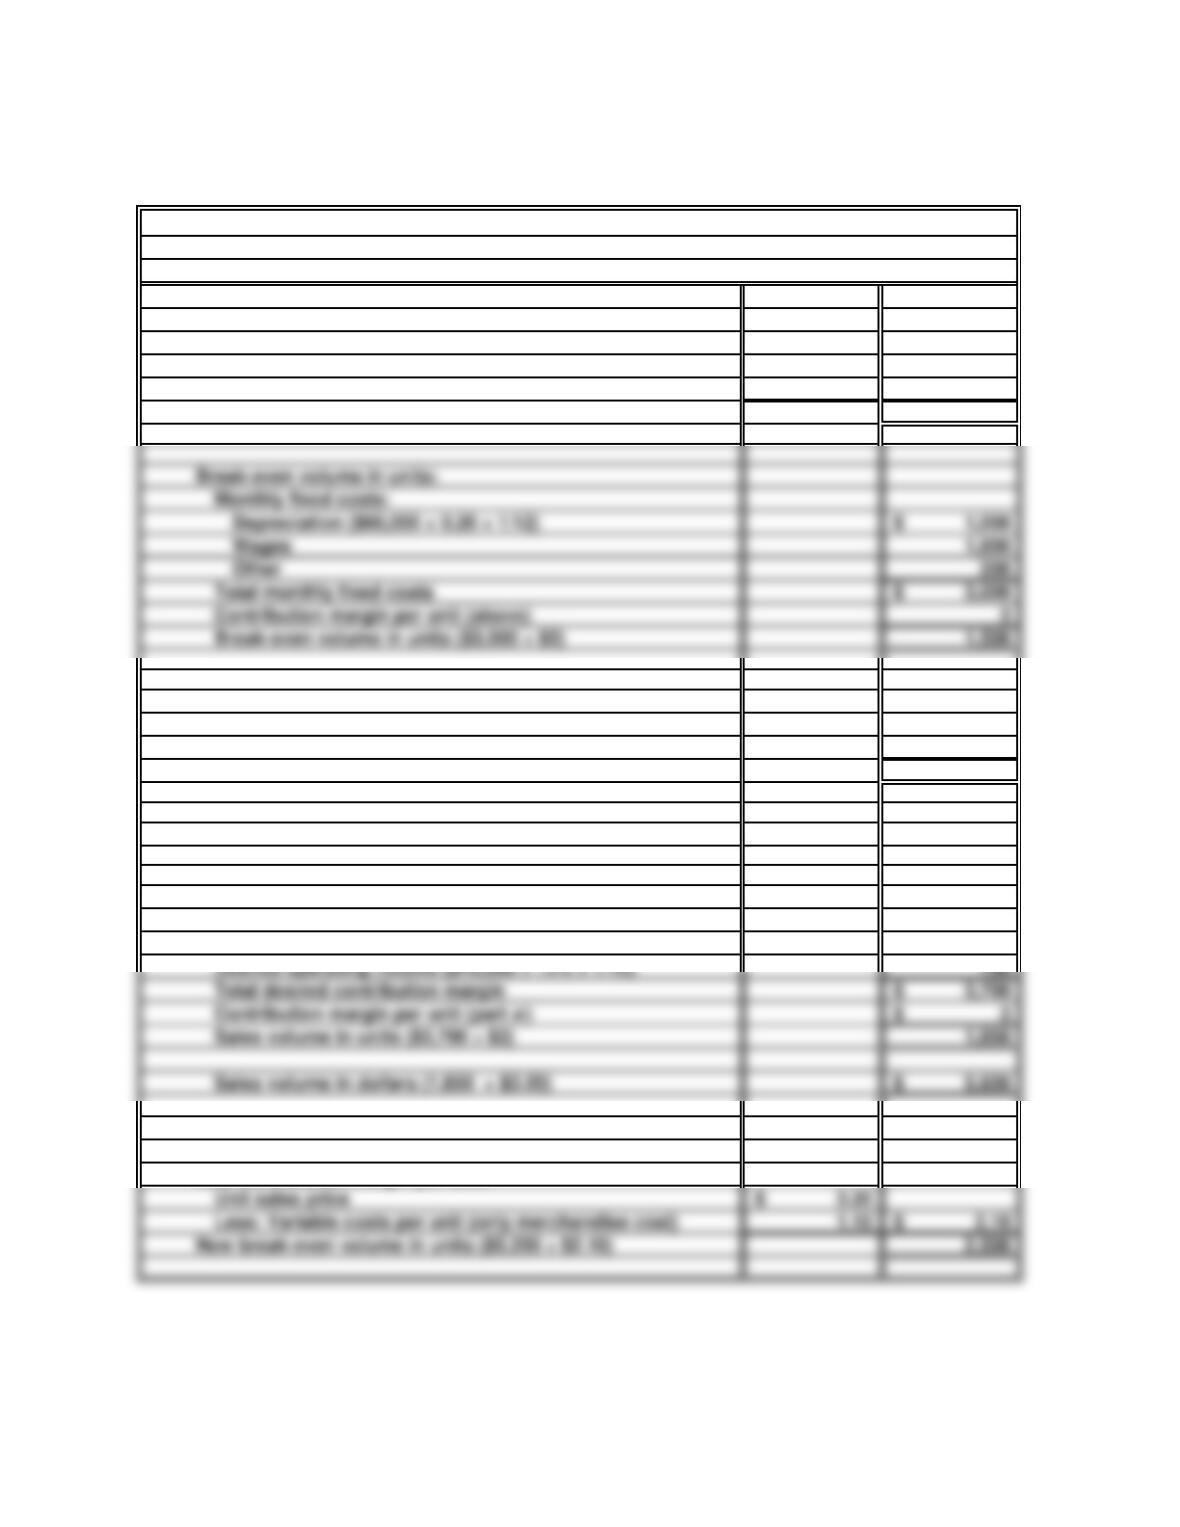
b.
GREEN THUMB
Cost-Volume-Profit Graph
Monthly Basis
40 Minutes, Strong
PROBLEM 20.5B
ED WINSLOW
a. Unit contribution margin:
Sales price per unit 3.20$
Less: Variable costs per unit:
Merchandise 1.10$
Rental commission 0.10 1.20
Unit contribution margin 2.00$
Break-even volume in dollars:
Break-even volume in units (above) 1,500
Unit sales price 3.20$
Break-even volume in dollars (1,500 units × $3.20) 4,800$
b. See following page.
c. Sales volume to produce operating income equal to 12%
return on investment:
Total monthly fixed costs (part a)3,000$
Desired operating income ($70,000 × 12% × 1/12) 700
Total desired contribution margin 3,700$
Contribution margin per unit (part a)2$
Sales volume in units ($3,700 ÷ $2) 1,850
Sales volume in dollars (1,850 × $3.20) 5,920$
d. New monthly fixed costs [$3,000 + ($45 × 50)] 5,250$
New contribution margin per unit:
Unit sales price 3.20$
Less: Variable costs per unit (only merchandise cost) 1.10 2.10$
New break-even volume in units ($5,250 ÷ $2.10) 2,500
Monthly fixed costs:
Total monthly fixed costs 3,000$
Contribution margin per unit (above) 2
Break-even volume in units ($3,000 ÷ $2) 1,500
PROBLEM 20.5B
ED WINSLOW (concluded)
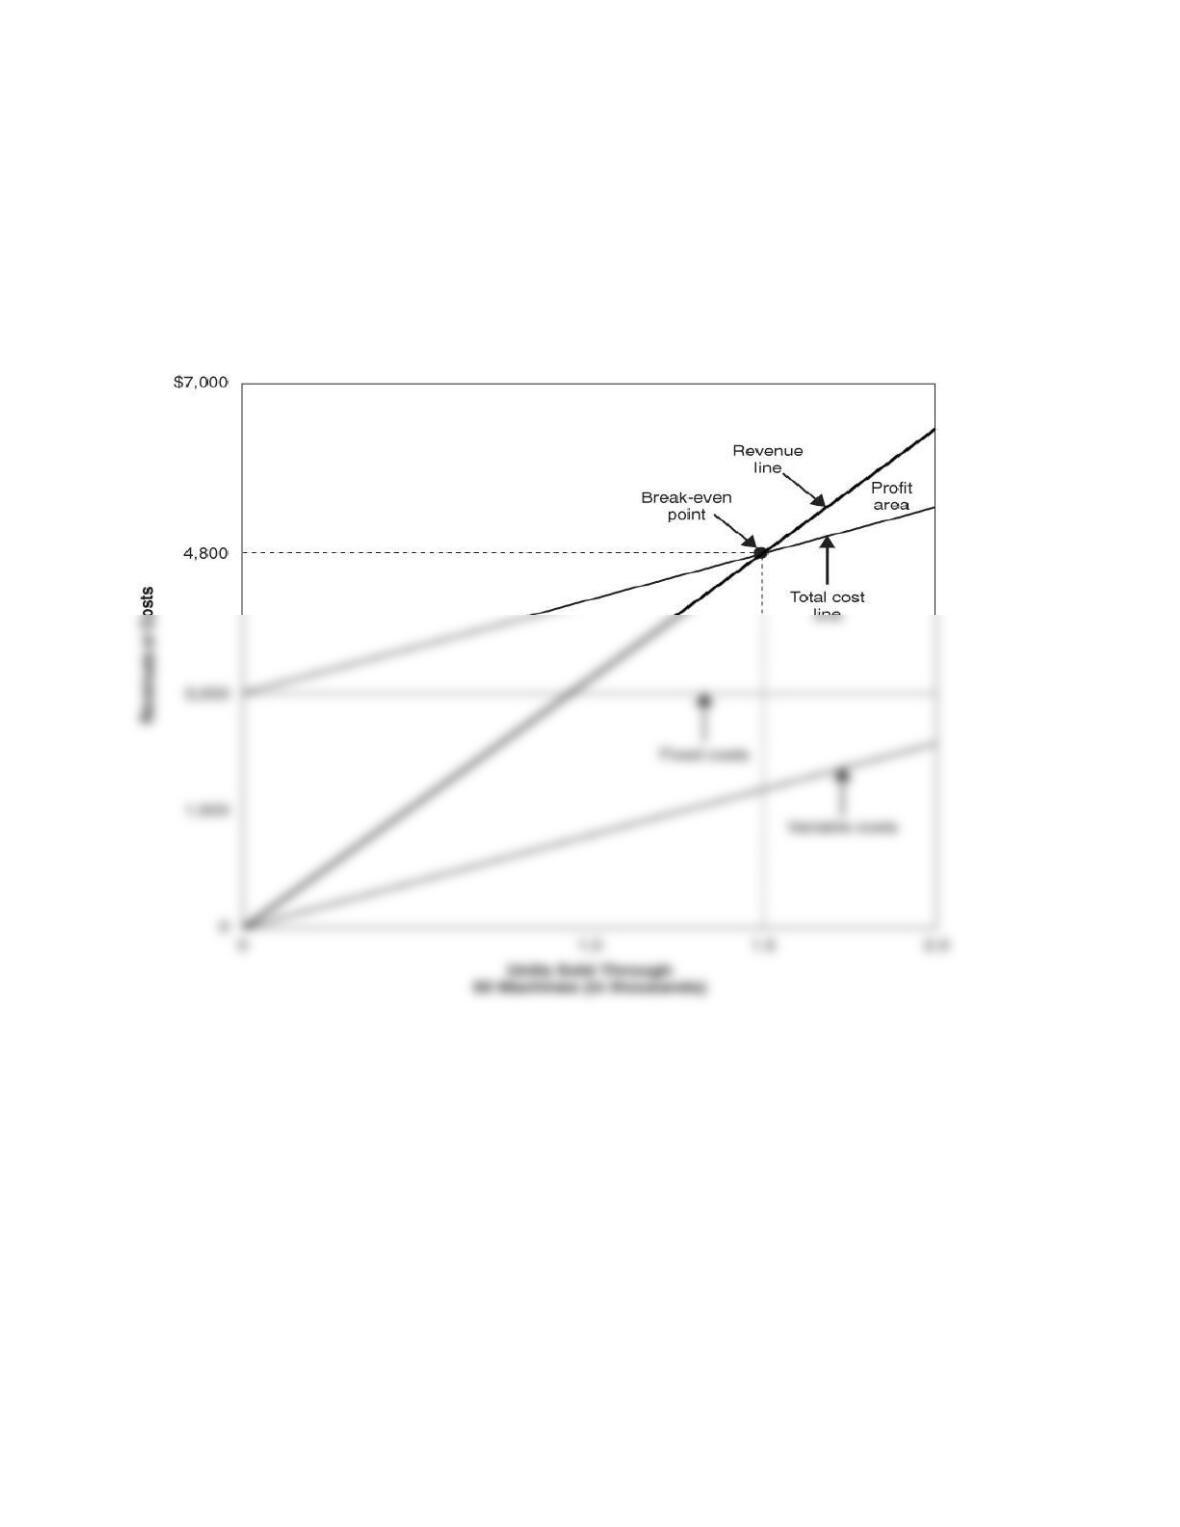
b.
ED WINSLOW
Cost-Volume-Profit Chart
Monthly Basis
30 Minutes, Strong PROBLEM 20.6B
ELECTRO SYSTEMS
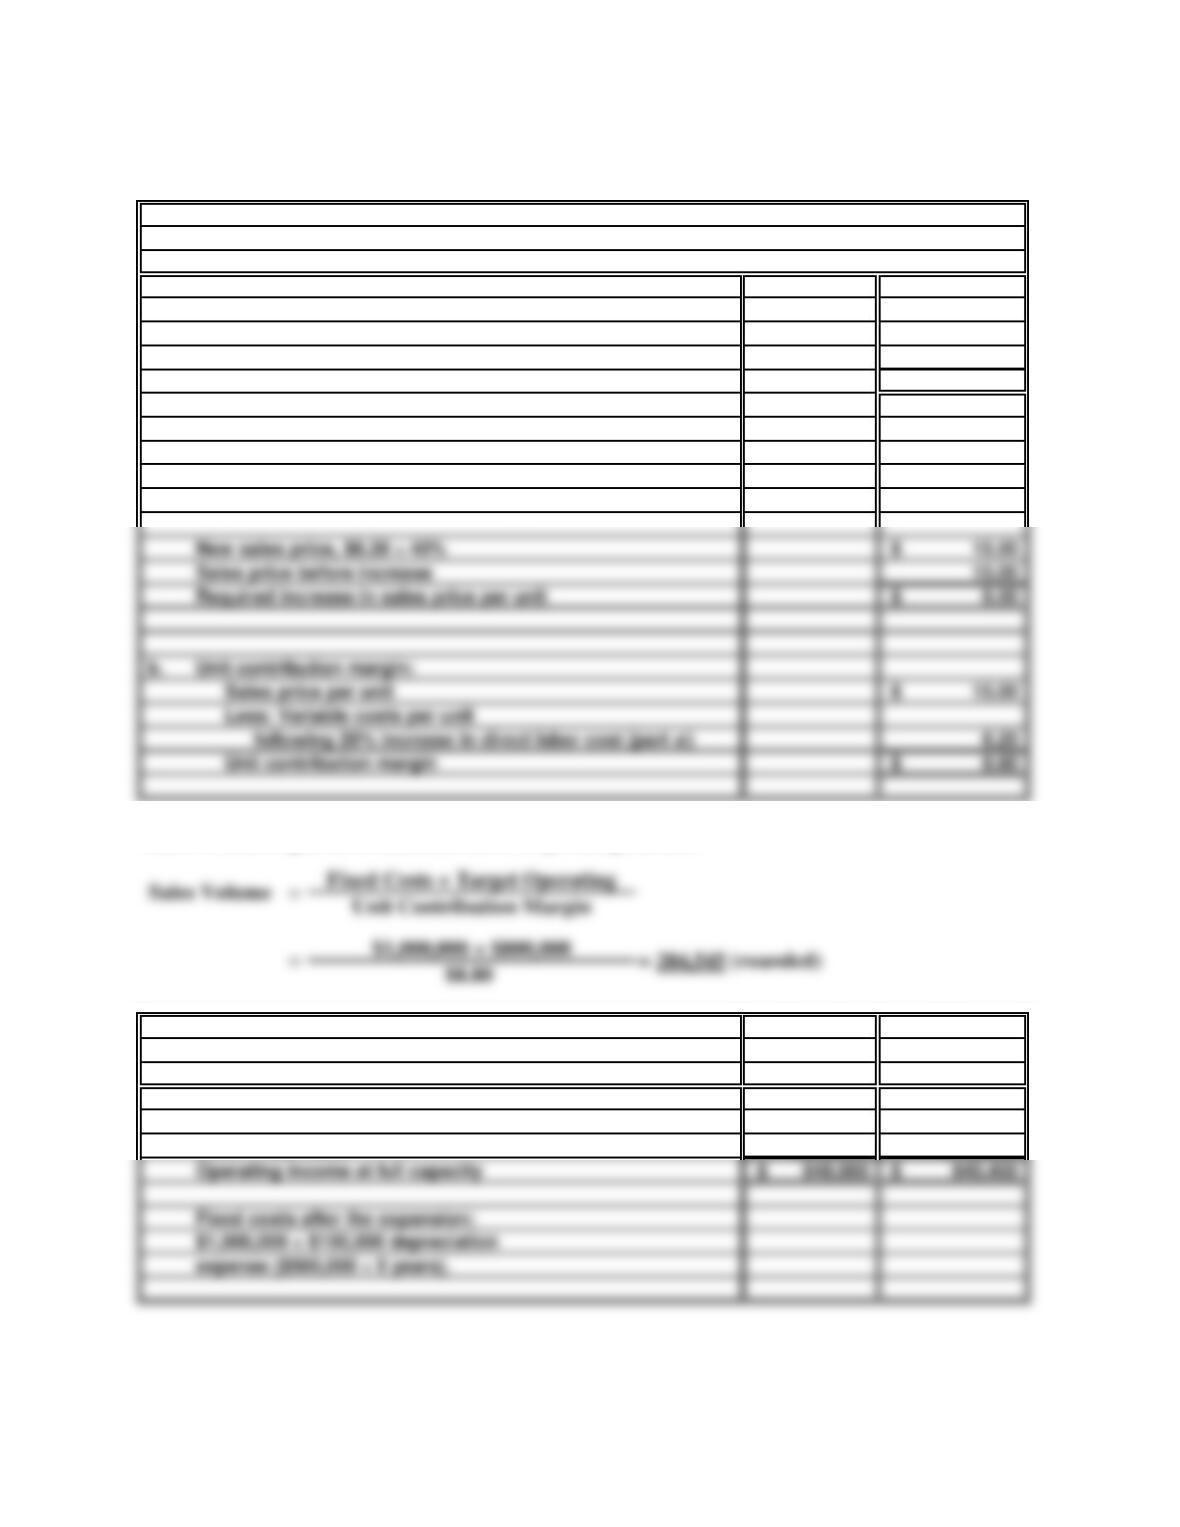
a. Variable costs per unit before 20% increase in the cost
of direct labor 6.00$
Increase in cost of direct labor, 20% of $1.00 0.20
Variable costs and expenses per unit
after 20% increase in the cost of direct labor 6.20$
Because the contribution margin ratio of 60% is
required, the variable costs of $6.20 per unit must
equal 40% of sales price after the wage increase.
c. Current After
Capacity Expansion
210,000 Units 220,500 Units
Total contribution margin ($8.80 per unit) 1,848,000$ 1,940,400$
Less: Fixed costs 1,000,000 1,100,000
Operating income at full capacity 848,000$ 840,400$
Sales volume required to maintain current operating income:
Sales price before increase 15.00
Required increase in sales price per unit 0.50$
Unit contribution margin 8.80$
35 Minutes, Strong PROBLEM 20.7B
DORSAL RANCH
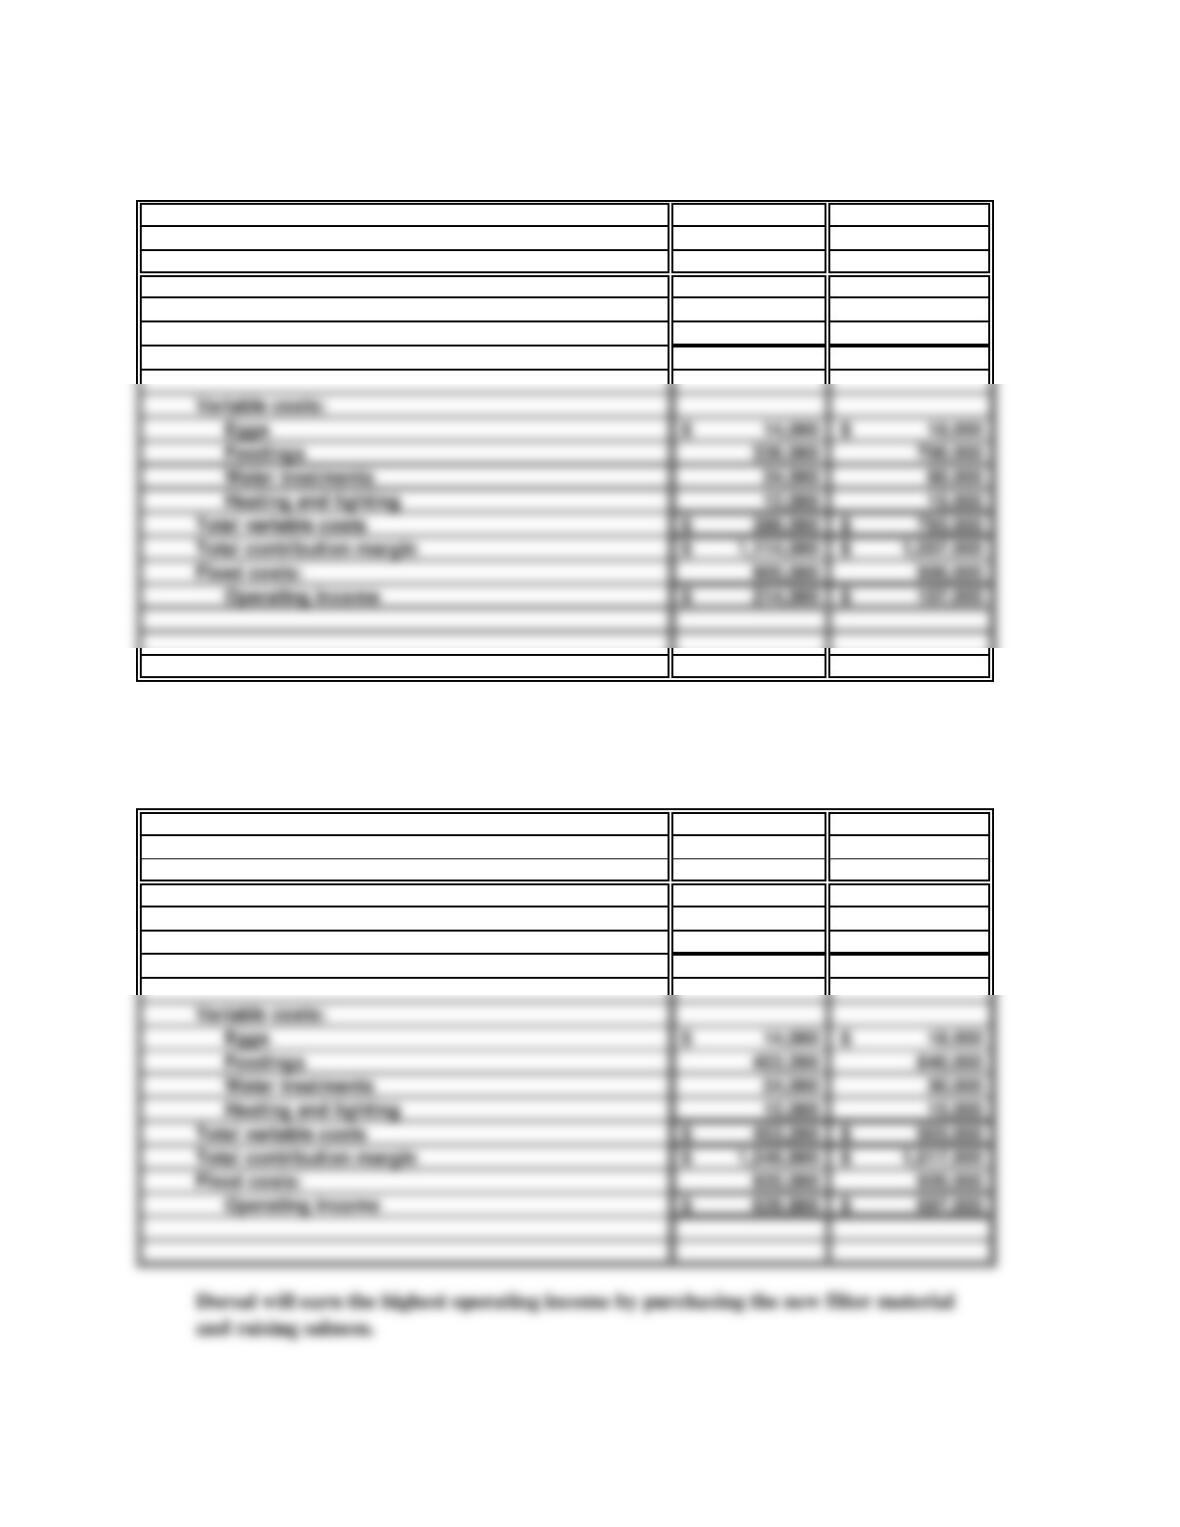
a. Raising cod will result in the highest
operating income.
Cod Salmon
Number of salable fish 300,000 200,000
× sale price 5$ 9$
Total revenue 1,500,000$ 1,800,000$
b.
c. and d.
Operating income with new filter material:
Cod Salmon
Number of salable fish 400,000 280,000
× sale price 5$ 9$
Heating and lighting 12,000 15,000
Operating income 626,800$ 697,000$
Total revenue 2,000,000$ 2,520,000$
The most important factors in determining operating income are survival rates, and
the costs of feeding and water changes.
Heating and lighting 12,000 15,000
Operating income 214,000$ 107,000$
PROBLEM 20.7B
DORSAL RANCH (concluded)
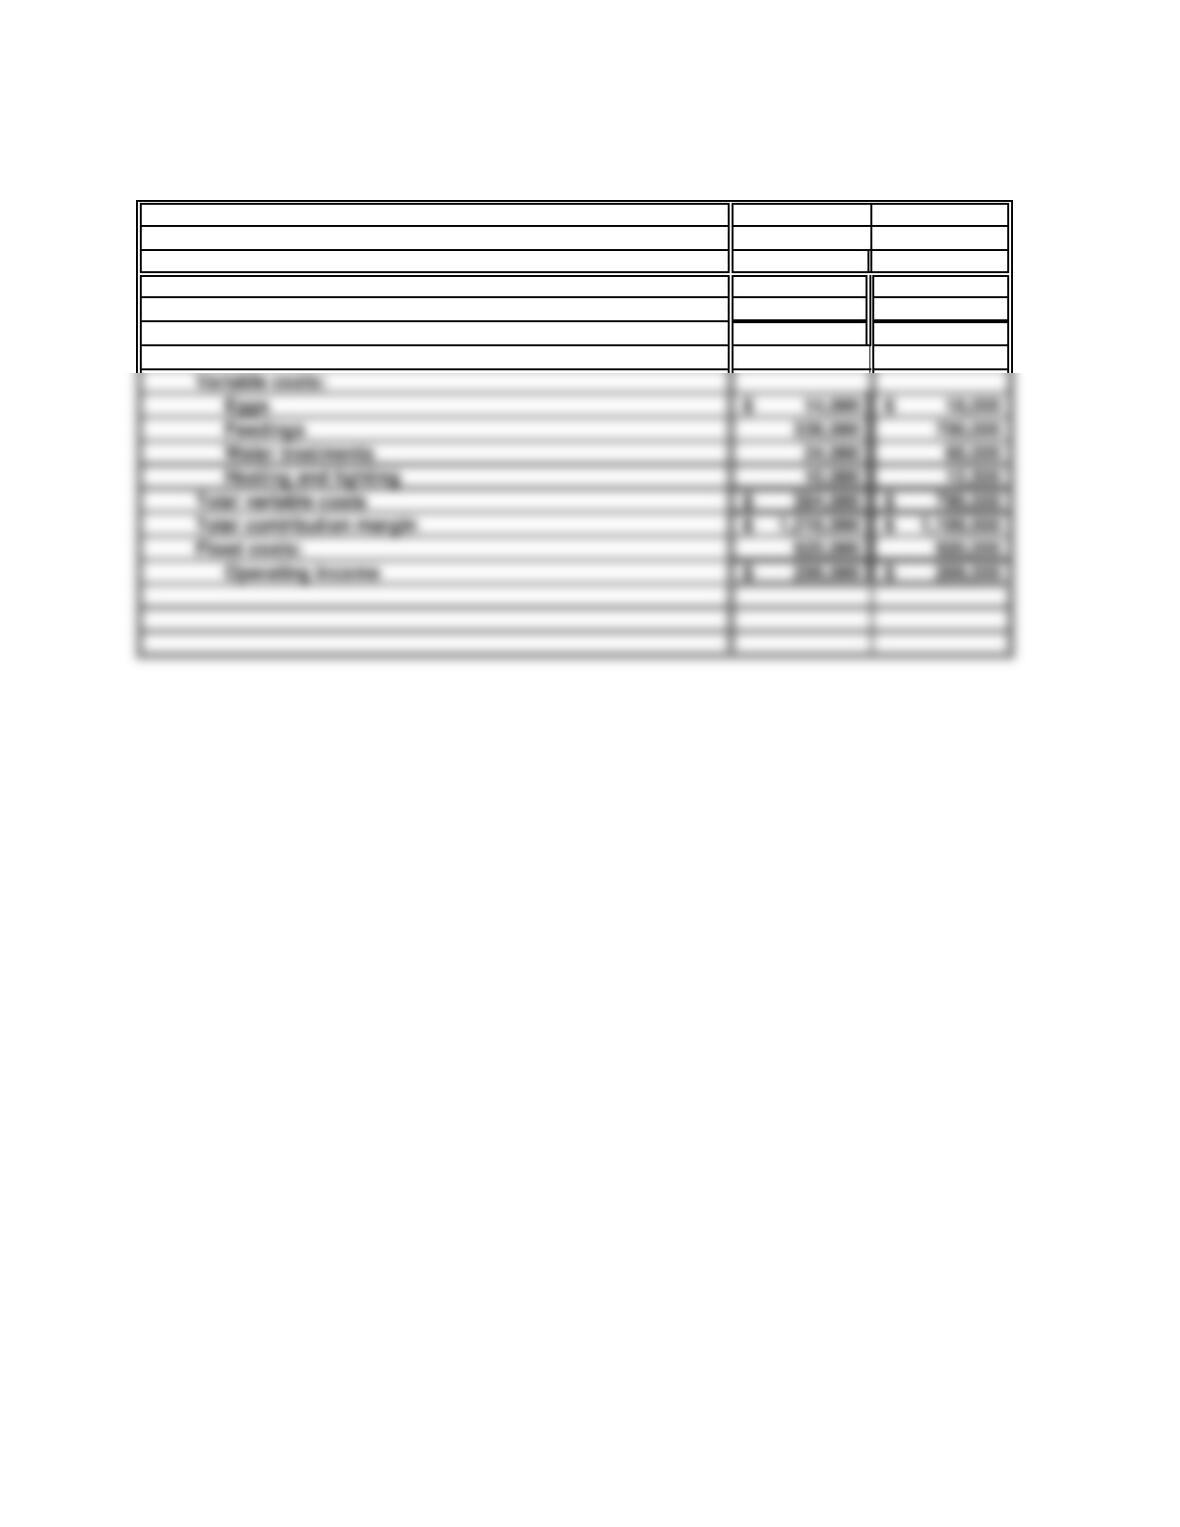
c. and d.
Operating income with new heating
and lighting equipment: Cod Salmon
Number of salable fish 320,000 220,000
× sale price 5$ 9$
Total revenue 1,600,000$ 1,980,000$
Total variable costs 384,000$ 790,500$
Fixed costs: 920,000 920,000
Operating income 296,000$ 269,500$
PROBLEM 20.8B
HOMETEAM SPORTS
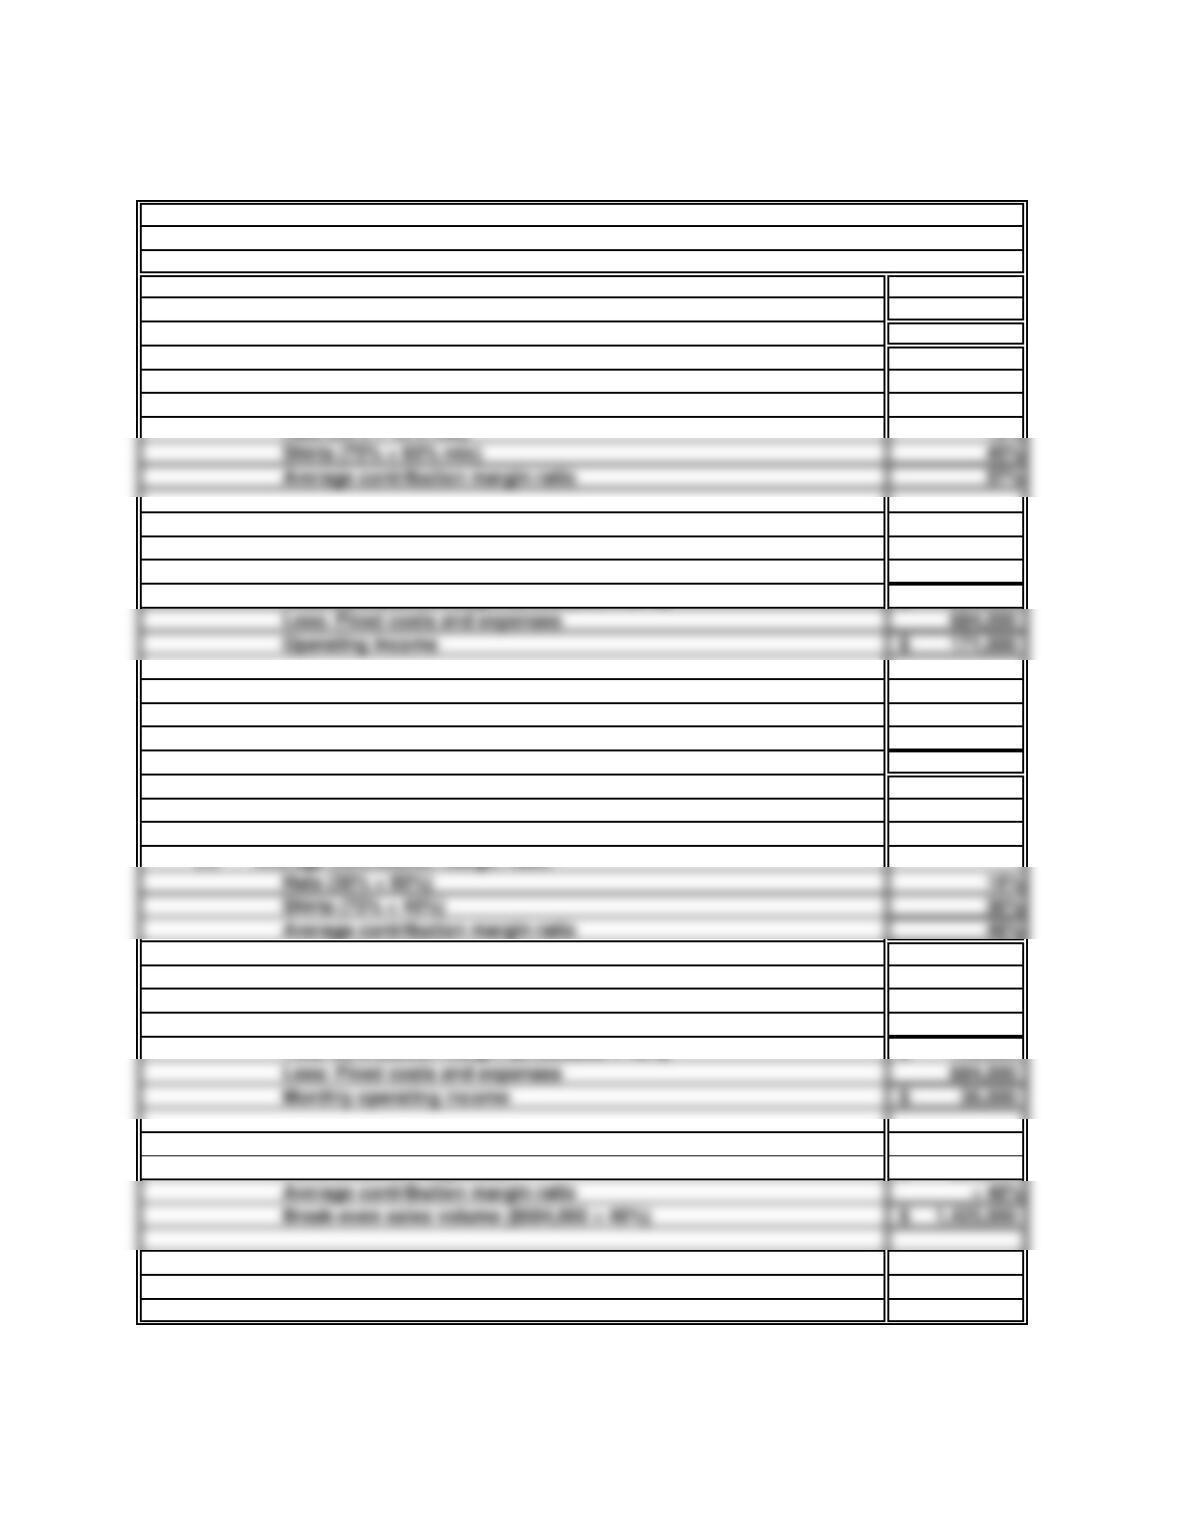
a. Contribution margins of product lines:
Hats ($6 ÷ $20) 30%
Shirts ($21 ÷ $28) 75%
b. (1) Average contribution margin ratio:
Hats (30% × 40% mix) 12%
(2) Monthly operating income:
Total sales 1,500,000$
Average contribution margin ratio × 57%
Total contribution margin ($1,500,000 × 57%) 855,000$
Less: Fixed costs and expenses 684,000
Operating income 171,000$
(3) Monthly break-even sales volume (in dollars):
Fixed costs and expenses 684,000$
Average contribution margin ratio ÷ 57%
Break-even sales volume ($684,000 ÷ 57%) 1,200,000$
Shirts (75% × 40%) 30%
Average contribution margin ratio 48%
c. Assuming new sales mix (shirts, 40%; hats, 60%)
(1) Average contribution margin ratio:
(2) Monthly operating income:
Total sales 1,500,000$
Average contribution margin ratio × 48%
Total contribution margin ($1,500,000 × 48%) 720,000$
Less: Fixed costs and expenses 684,000
Monthly operating income 36,000$
(3) Monthly break-even sales volume (in dollars):
Fixed costs and expenses 684,000$
Average contribution margin ratio ÷ 48%
Break-even sales volume ($684,000 ÷ 48%) 1,425,000$
35 Minutes, Strong
Shirts (75% × 60% mix) 45%
PROBLEM 20.8B
HOMETEAM SPORTS (concluded)
d.
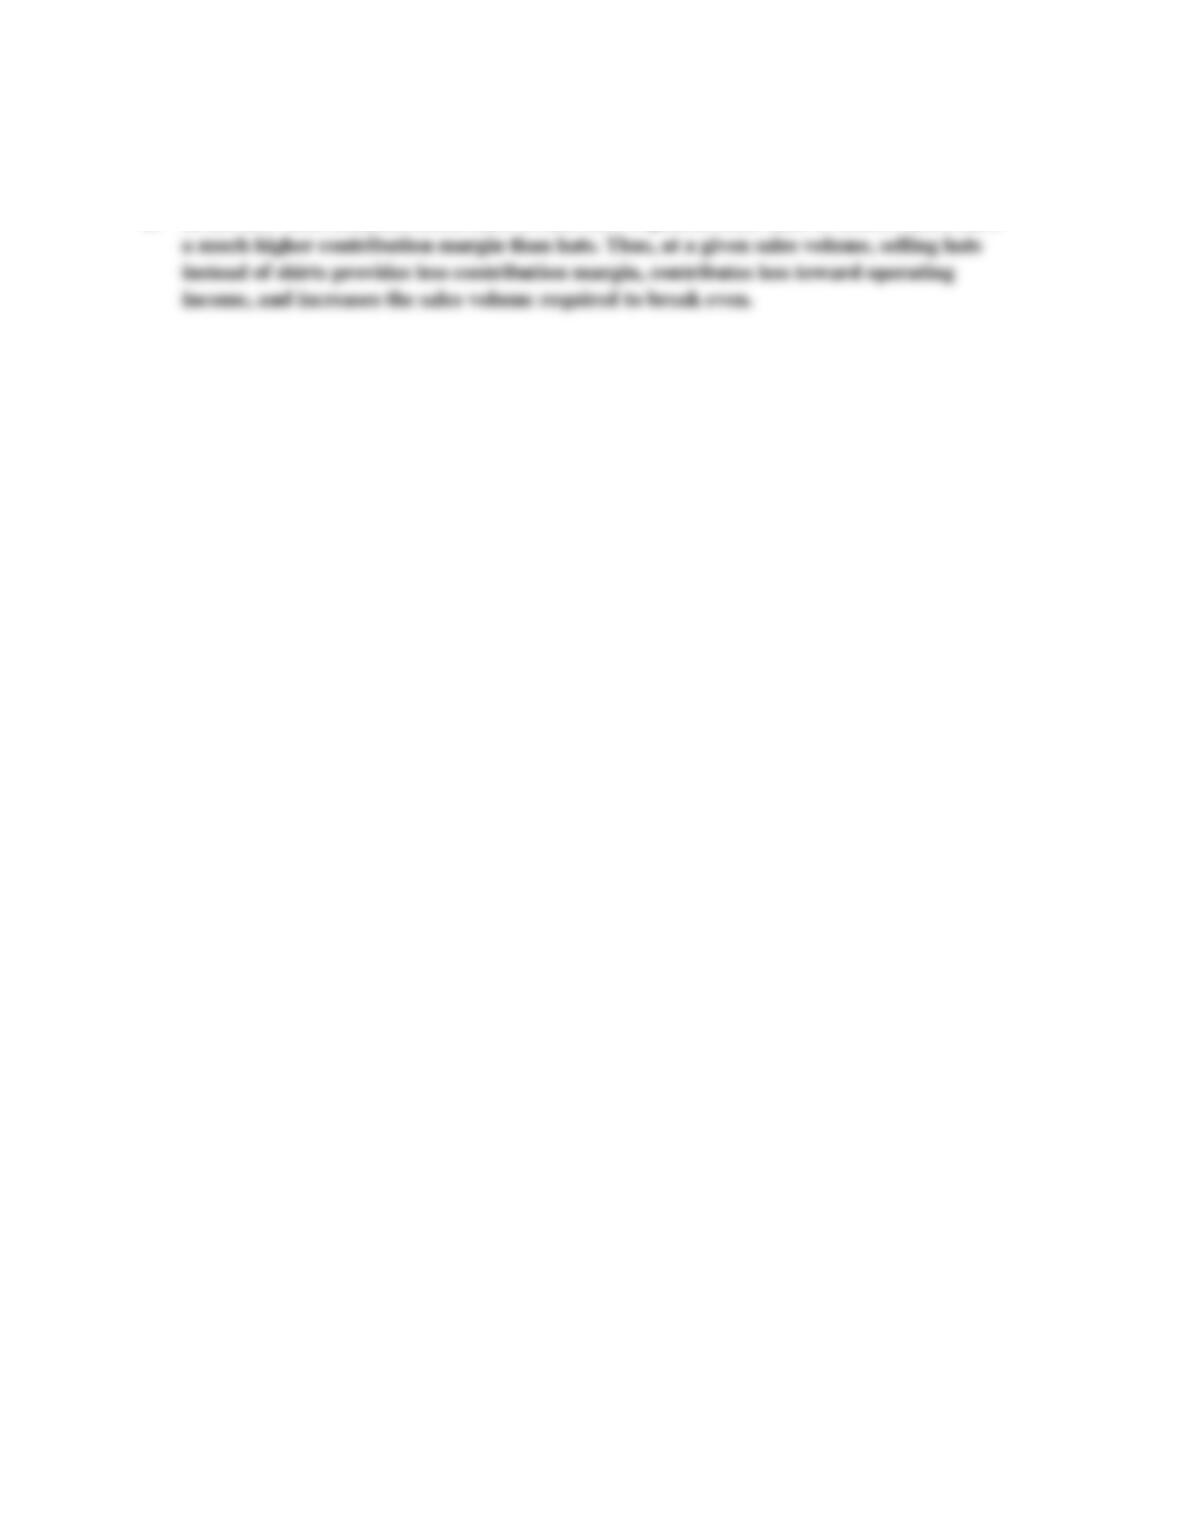
In the new sales mix, increased sales of hats have replaced some sales of shirts. Shirts have
SOLUTIONS TO CRITICAL THINKING CASES
CASE 20.1
MULTIPLE PERSPECTIVES—
ATTEND OUR SEMINAR
The vice president of sales for a large automobile company
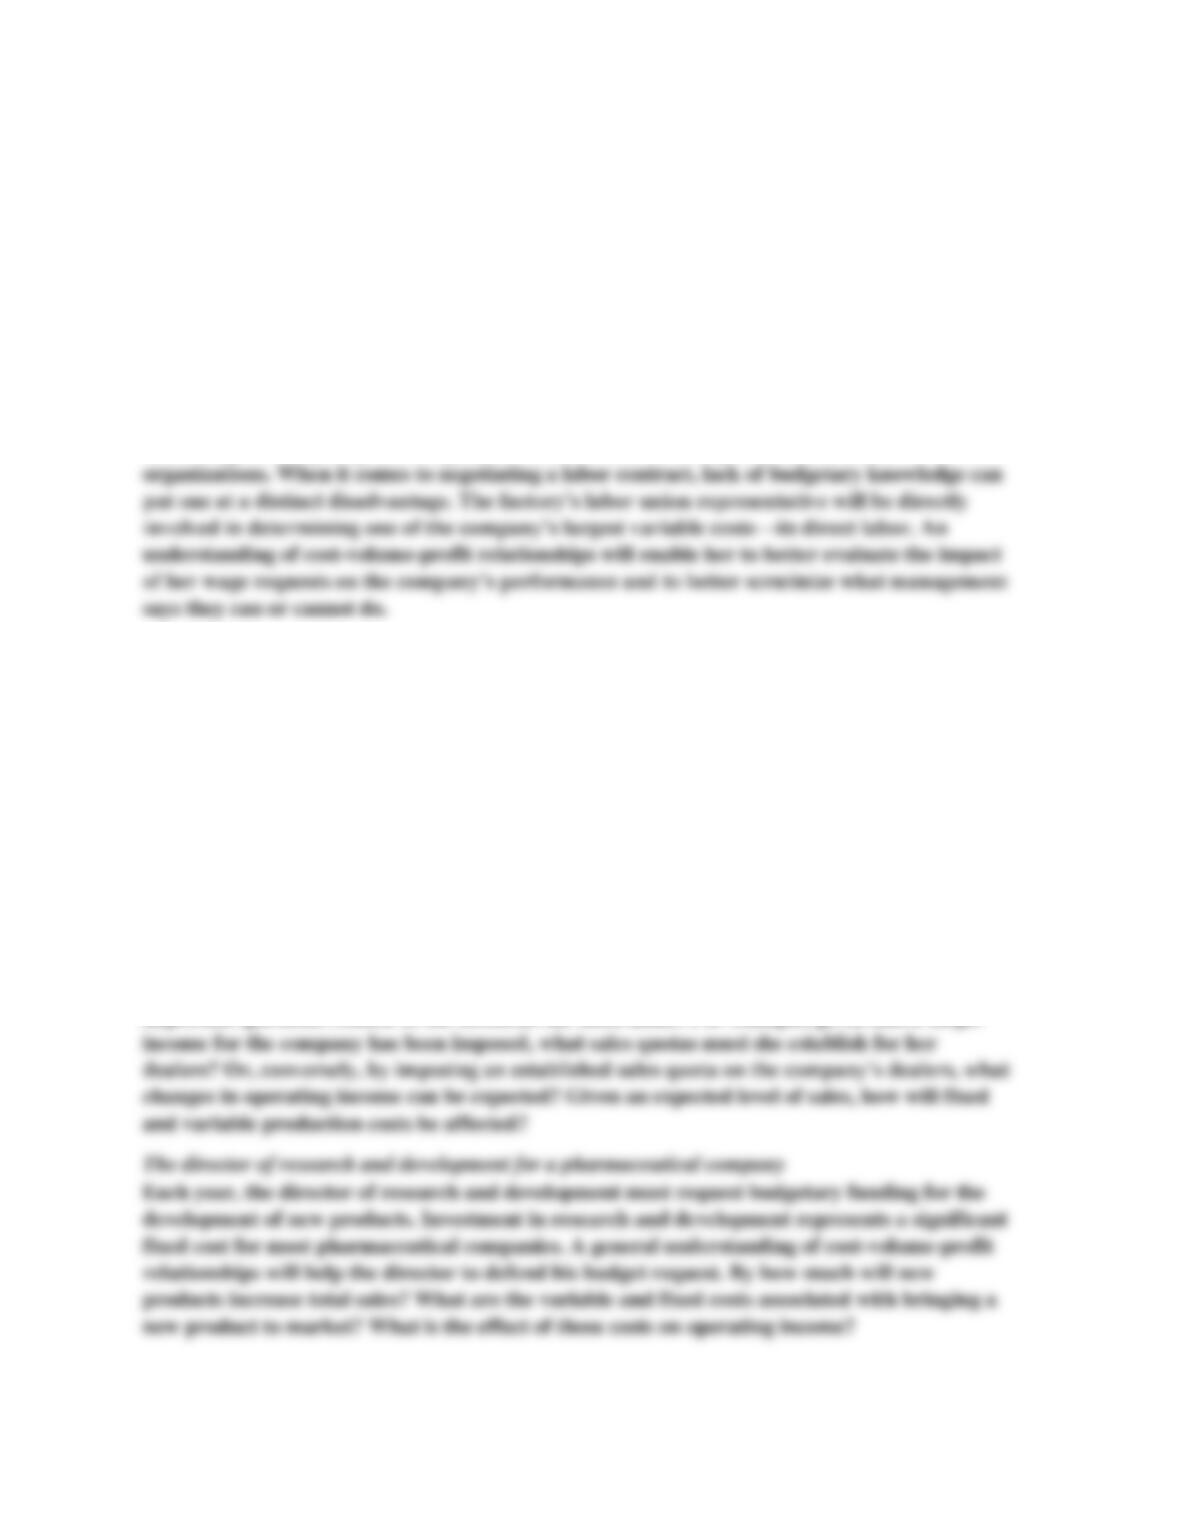
The vice president of sales plays a critical role in determining her company’s operating
performance. A knowledge of cost-volume-profit relationships will help her to evaluate
important questions related to the decisions she must make. For example, given that a target
20 Minutes, Medium
The following are possible reasons you could give each of the individuals to motivate them to
come to your seminar:
The factory worker who serves as her company’s labor union representative in charge of contract
negotiations
Knowledge of budgeting and budget processes is a source of empowerment in most
The purchasing agent in charge of ordering raw materials for a large manufacturing company
The purchasing agent is also directly involved with one of the company’s largest variable
costs—raw materials inventory. Having a general knowledge of cost-volume-profit relationships
will help him to better understand the impact of his actions on company performance. For
example, what is the impact on operating income of receiving large quantity discounts from a
major supplier? What is the effect of receiving purchase discounts for prompt payment to all
vendors? What is the effect on operating income of selecting one supplier over another? What is
the net effect of paying a premium for high-quality raw materials given a resulting reduction in
waste and scrap?
The director of research and development for a pharmaceutical company
CASE 20.2
DON’T MESS WITH THE PURPLE COW
a.
1,500
(1) (2)
Reduce Increase
Selling Advertising
Price Expense
$ 12.80 $ 14.80
6.80 6.80
$ 6.00 $ 8.00
$ 21,600 $ 26,400
$ 12,000 $ 15,000
$ 6 $ 8
Contribution margin per gallon
Estimated sales (gallons):
If selling price is reduced, 3,000 × 120%
Monthly break-even point (total fixed costs ÷
Contribution margin per gallon
Total fixed costs per month
Monthly break-even point (in gallons):
If selling price is not reduced, 3,000 × 110%
Total contribution margin earned
c.
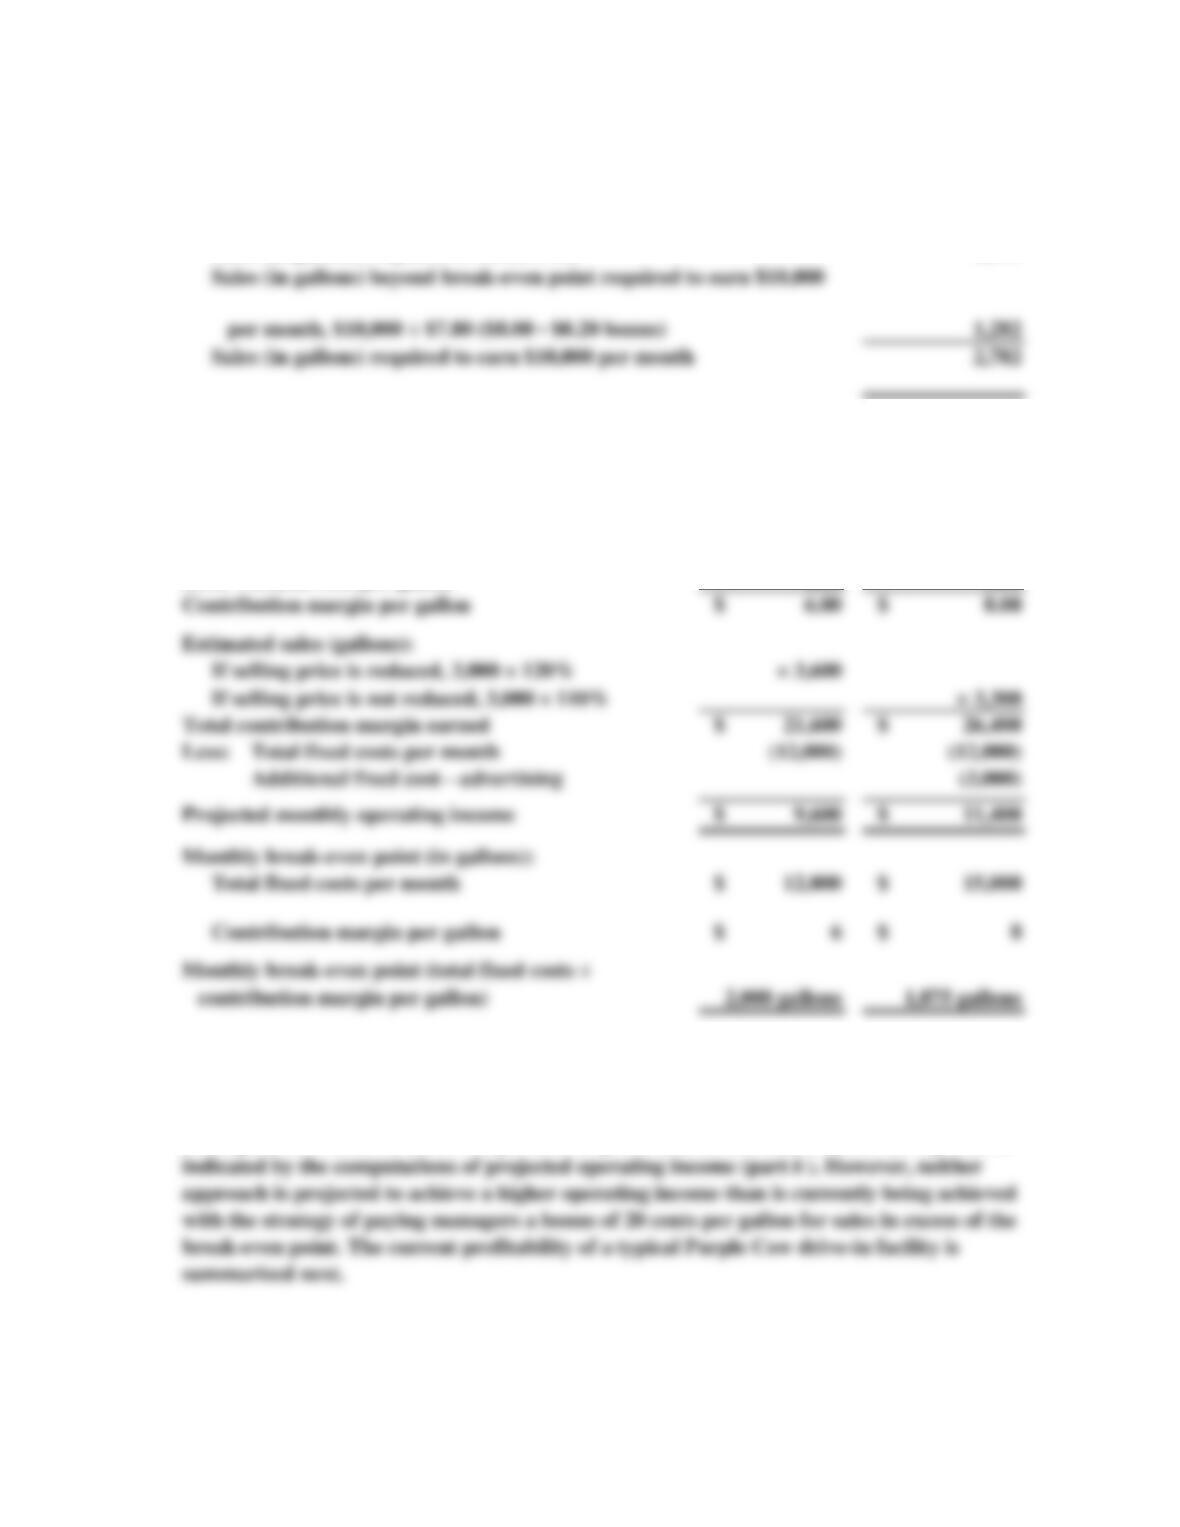
The Purple Cow should adopt neither of the two proposed marketing strategies. Of these
strategies, the increased advertising would be preferable to the reductions in sales prices, as
Memo to Management:
RE: Alternative marketing proposals: price reductions or additional advertising
Less: Variable cost per gallon
40 Minutes, Strong
Average selling price per gallon
b.
Sales (in gallons) required to earn $10,000 per month:
Sales (in gallons) required to break even
Projected monthly results for typical drive-in store:
1,282
CASE 20.2
DON’T MESS WITH THE PURPLE COW (concluded)
1,500
Contribution margin per unit of sales over the break-even point
($14.80 sales price, less $6.80 variable costs,
Sales volume in excess of break-even point (in gallons)
(3,000 gallons, less 1,500-gallon break-even point)
$ 7.80
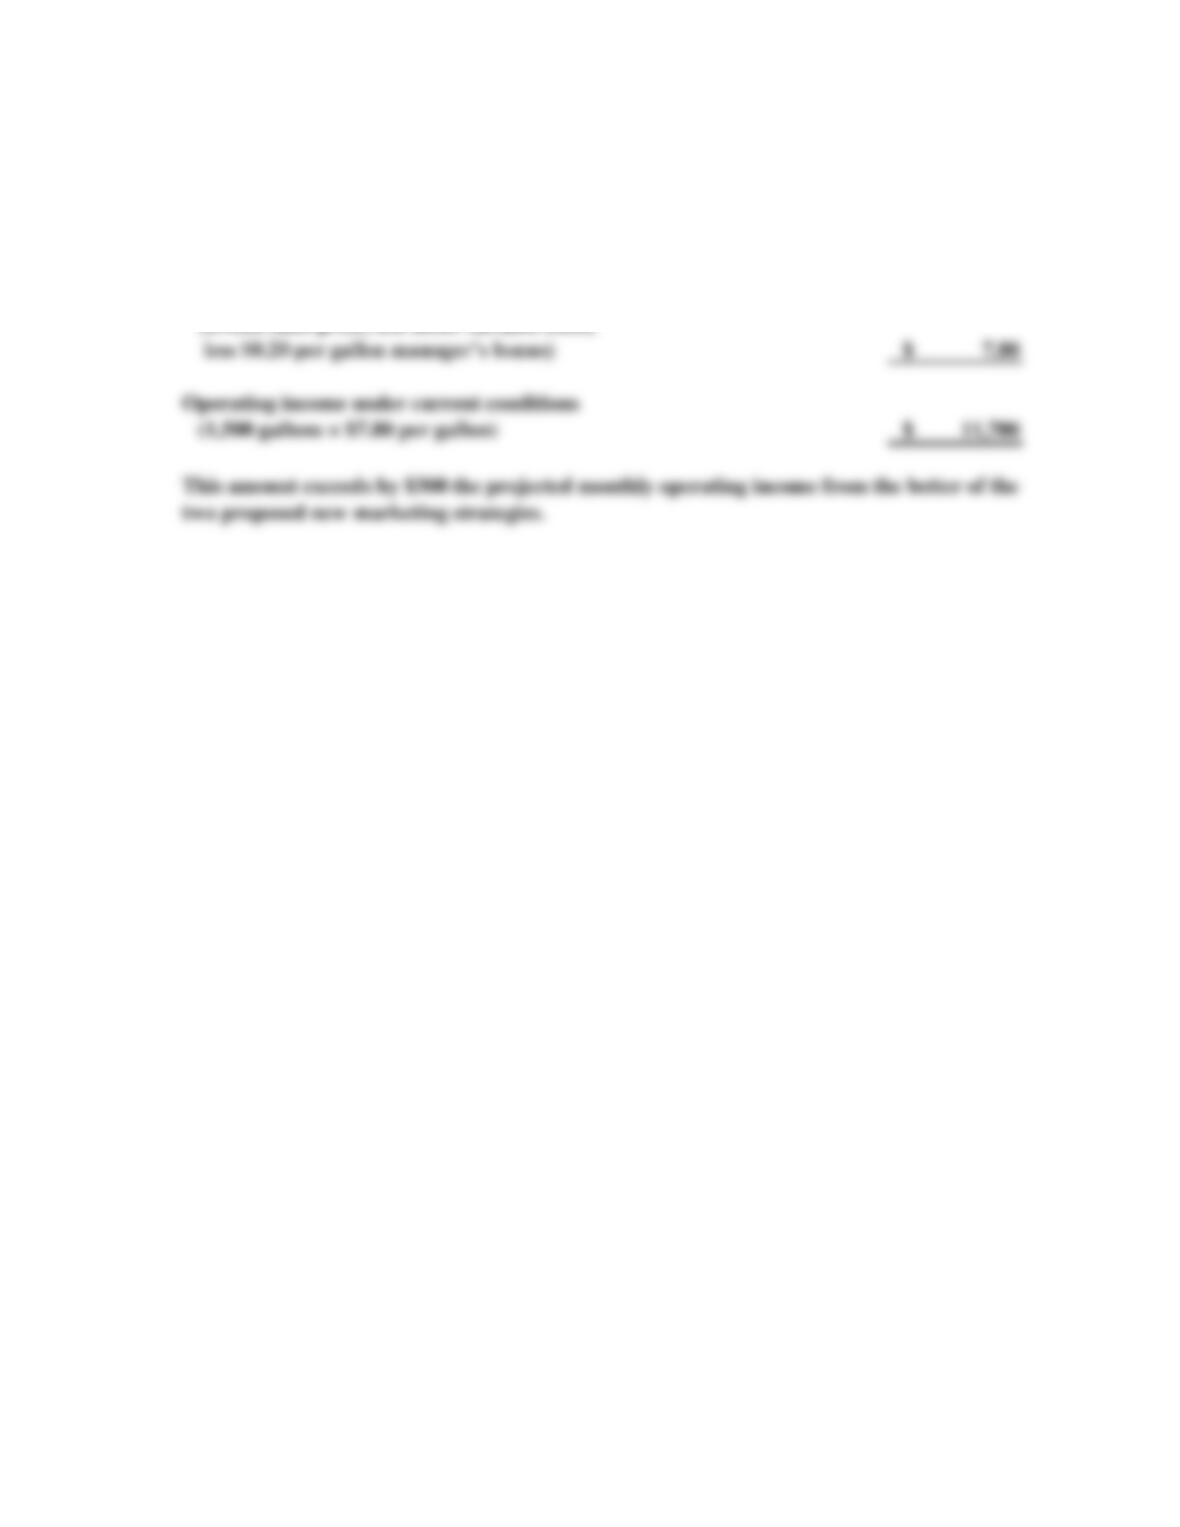
Operating income under current conditions
CASE 20.3
SEC FORM 8-K
ETHICS, FRAUD AND CORPORATE GOVERNANCE
a.
c.
Given the company has been struggling in recent years to break-even, large charges
10 Minutes, Easy
Section 409 of the Sarbanes-Oxley Act (SOX) requires public companies disclose certain
material events within four business days after they occur. Such events include
The charge to income that was disclosed in the Form 8-K by the CFO probably related to
CASE 20.4
FORD MOTOR COMPANY
INTERNET
a.
c.
Products with the highest contribution margins contribute most to the bottom line. Thus,
by shifting its sales mix to include more products with high contribution margins, a
15 Minutes, Easy
Approximately 6% of the company’s total revenue is generated by its Financial Services