
CHAPTER 20
COST-VOLUME-PROFIT ANALYSIS
Brief Learning
Exercises Topic Objectives Skills
B. Ex. 20.1 Cost behavior patterns 20-1 Analysis
B. Ex. 20.2 Cost classifications 20-1 Analysis
B. Ex. 20.3 Using a cost formula 20-1, 20-9 Analysis
B. Ex. 20.4 Using a cost formula
20-1, 20-4,
20-5, 20-9
Analysis
B. Ex. 20.5 Computing required sales volumes 20-4–20-6 Analysis
B. Ex. 20.6 Computing required sales volumes 20-4–20-6 Analysis
B. Ex. 20.7 Contribution margins and selling prices
20-1, 20-4 –
20-6
Analysis
B. Ex. 20.8 Evaluating marketing strategies 20-7 Analysis
B. Ex. 20.9 Selecting an activity base 20-1 Judgment, analysis
B. Ex. 20.10 CVP with multiple products 20-8 Analysis
Learning
Exercises Topic Objectives Skills
20.1 Accounting terminology
20-1, 20-2,
20-4
Analysis
20.2 High-low method of cost estimation 20-1, 20-9 Analysis
20.3 Determining required sales volumes 20-4, 20-5 Analysis
20.4 Computing break-even points 20-4–20-6 Analysis
20.5 Solving for missing information 20-1, 20-4 Analysis
20.6 Ethical implications of CVP 20-5–20-7 Judgment, communication
20.7 Using CVP 20-4–20-6 Analysis
20.8 Using CVP 20-4–20-6 Analysis
20.9 Understanding break-even relationships
20-1, 20-2,
20-4–20-6
Analysis
20.10 Margin of safety 20-4, 20-5 Analysis
20.11 Applying CVP
20-1, 20-2,
20-4–20-6
Analysis
20.12 Solving for missing information 20-5, 20-6 Analysis
20.13 Formulating bid prices using CVP
20-1, 20-4 –
20-6
Analysis
20.14 CVP with multiple products 20-7, 20-8 Analysis
20.15 Estimating semivariable costs 20-9 Analysis
OVERVIEW OF BRIEF EXERCISES, EXERCISES, PROBLEMS, AND CRITICAL
THINKING CASES

Learning
Topic Objectives Skills
20.1 A,B Establishing selling prices 20-4–20-7 Analysis, communication
20.2 A,B Estimating costs and profitability
20-1, 20-4,
20-5
Analysis
20.3 A,B Preparing a break-even graph
20-3–20-6,
20-9
Analysis, communication
20.4 A,B Preparing a break-even graph
20-3, 20-4,
20-6, 20-9
Analysis, communication
20.5 A,B CVP analysis
20-3–20-7,
20-9
Analysis, communication
20.6 A,B Cost analysis
20-4–20-7,
20-9
Analysis, communication
20.7 A,B Cost analysis
20-4, 20-6,
20-7
Analysis, communication
20.8 A,B CVP with multiple products 20-4–20-8 Analysis, communication
CRITICAL THINKING CASES
20.1 CVP from differing perspectives 20-1 Judgment, communication
20.2
Evaluating marketing strategies costing
information
20-1, 20-4,
20-5, 20-6,
20-7
Communication, analysis
20.3 Deciding whether to file a Form 8-K 20-1 Analysis, judgment,
Ethics, Fraud & Corporate Governance communication
20.4 Real World: Ford Motor Company 20-8 Communication,
Internet technology, research
Sets A, B
Problems

DESCRIPTIONS OF PROBLEMS AND CRITICAL THINKING CASES
Problems (Sets A and B)
Ionic Charge/Nathe, Inc. Medium
Use of cost-volume-profit relationships in a pricing decision. Student
is to compute the unit sales prices necessary to achieve a target
operating income. Also determine whether the company can break
even if sales price is reduced to achieve market penetration.
Blaster Corporation/Snug-As-A-Bug Medium
Illustrates a pricing decision: compute the unit sales price necessary
to achieve a target income at a given unit sales volume. Also
compute the number of units that must be sold annually to break
even at an alternative unit sales price.
Stop-n-Shop/Moor-n-More 30 Medium
A profit-volume problem requiring an annual profit graph. Draw a
profit-volume graph on an annual basis. Compute the contribution
margin and break-even point. Consider the effect of a change in
employee compensation and determine sales necessary to produce a
given income.
20.4 A,B Rainbow Paints/Green Thumb 30 Medium
Create a cost-volume-profit graph for a retail business. Compute the
break-even sales volume and the operating income likely to result at
the highest and lowest expected sales volume.
20.5 A,B Simon Teguh/Ed Winslow 40 Strong
Draw a monthly cost-volume-profit graph for a vending machine
business. Determine the break-even point and the sales volume
needed to provide the owner with a given return on investment. Also
consider the effect of a change in costs upon the break-even point.
20.6 A,B Precision Systems/Electro Systems 30 Strong
Compute the increase in selling price necessary to maintain
contribution margin ratio after increase in direct labor cost. Compute
sales volume after wage increase in order to earn a given net income.
Consider the effect of expansion on maximum income that can be
earned.
Below are brief descriptions of each problem, case, and the first Internet assignment. These
descriptions are accompanied by the estimated time (in minutes) required for completion and by a
difficulty rating. The time estimates assume use of the partially filled-in working papers.
20.2 A,B
25
20.3 A,B
20.1 A,B
25
20.7 A,B Percula Farms/Dorsal Ranch 35 Strong
Students must analyze two alternative production strategies and
determine which factors or costs have the greatest influence on
operating income. Given two investment options, students must first
intuitively decide which should result in the greatest increase to
operating income, and then perform calculations to confirm their
answer.
20.8 A,B Lifefit Products/HomeTeam Sports 35 Strong
Calculate break-even in dollars and in units for a multiple product
company. Determine operating income required for a desired margin of
safety. Determine sales level required for a desired level of income if
fixed costs are reduced.

CRITICAL THINKING CASES
20.1 Multiple Perspectives—Attend Our Seminar 20 Medium
Students play the role of a cost-volume-profit seminar leader. They
are asked to motivate individuals to attend their seminar by showing
them how the information can be of benefit. This is a good group
problem that encourages students to think beyond the mechanics of
cost-volume-profit analysis.
20.2 Don’t Mess with the Purple Cow 40 Strong
Students are asked to evaluate two alternative marketing proposals
and make a recommendation to management. The problem contains
an interesting twist: neither proposal is as profitable as the status
quo—but students’ attention is not specifically directed toward this
vital issue. A lesson in the fact that real-life problems do not come
with “instructions” that make the answers clear.
20.3 Filing Form 8-K 10 Easy
Ethics, Fraud and Corporate Governance
Students are asked to determine whether a company should file a
Form 8-K and whether it is legal and/or ethical to withhold certain
information.
20.4 Ford Motor Company 15 Easy
Internet
Using information contained the company’s 10-K, students are asked
to analyze Ford’s income statement and discuss how the company’s
sales mix might influence its profitability.
SUGGESTED ANSWERS TO DISCUSSION QUESTIONS
1.
2.
3.
a. Total variable costs increase in approximate proportion to an increase in activity.
4.
5.
6.
a.
Under the high-low method, the levels of a semivariable cost and of the related activity base
are observed at the highest and lowest points of activity within the relevant range. The
It is important for management to understand cost-volume-profit relationships in order to do a
An activity base is a measure of a type of business activity that “drives” variable costs. The
activity base allows us to quantify the expected relationships between variable costs and the
Two factors make the simplifying assumption of straight-line cost-volume relationships useful.
First, unusual patterns of cost behavior (stair-step or curvilinear) tend to offset one another when
The relevant range represents the operating levels (for example, between 40% and 80% of full
7.
a.
8.
9.
11.
The contribution margin is the dollar amount by which revenue exceeds variable costs.
Thus, it is the amount of revenue that is available to cover fixed costs and to contribute to
operating income. Unit contribution margin = unit sales prices – variable costs per unit.
A change in product (sales) mix to a higher proportion of export sales may result in a lower level
of net income if the contribution margin ratio on export sales is lower than the average
contribution margin ratio on all sales. This is often the case with export sales made by American
At the break-even point, a company earns a total contribution margin exactly equal to its fixed
The important relationships shown in a cost-volume-profit graph are changes in revenue, costs,
and operating income in relation to changes in the volume of business activity. The point at
14.
15.
The regional airline will probably have a higher break-even point than a furniture manufacturer
Basic assumptions underlying cost-volume-profit analysis include: (1) a constant selling price
SOLUTIONS TO BRIEF EXERCISES
B. Ex. 20.1 a.
Total variable costs increase approximately in proportion to an increase in the
volume of activity.
e.
Semivariable costs include both fixed and variable cost elements. Because of
f.
On a per-unit basis, the fixed elements of a semivariable cost decline as the
B. Ex. 20.2 a.
Variable. The cost of goods sold normally rises and falls in almost direct
b.
As described in this exercise, the salaries to salespeople are semivariable with
B. Ex. 20.2
(continued)
c.
e.
f.
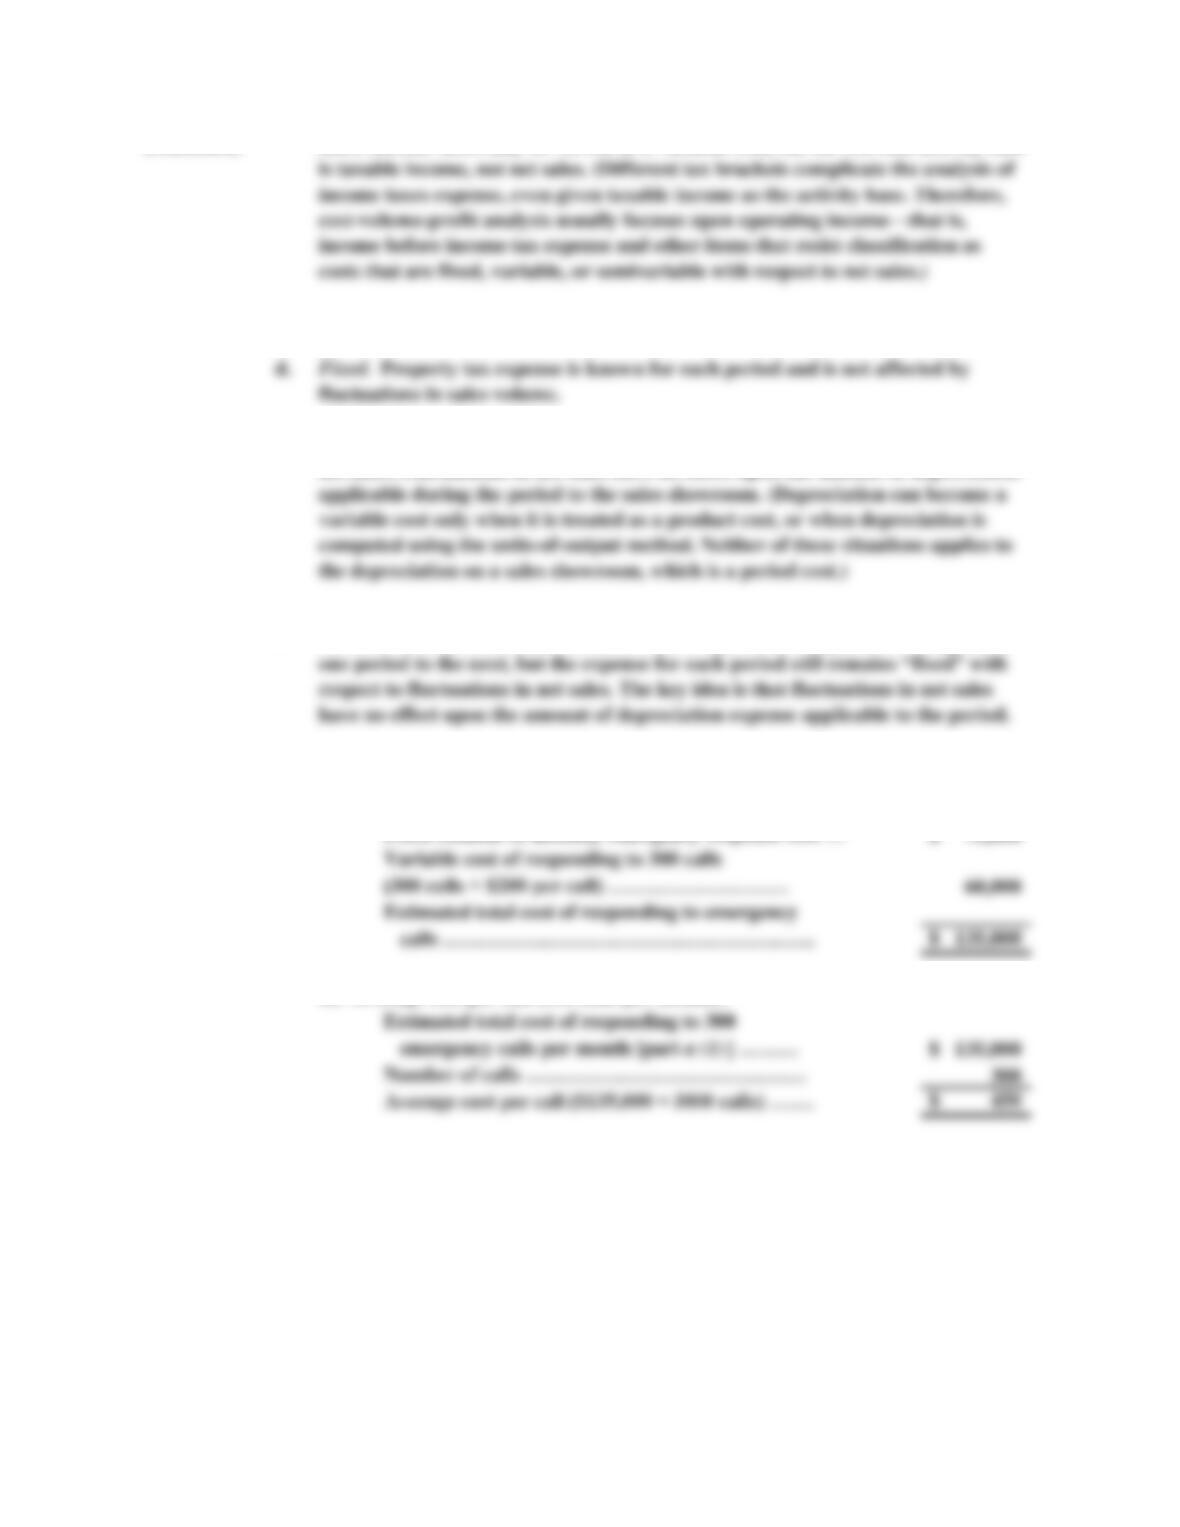
B. Ex. 20.3 a. (1)
$ 75,000
(300 calls × $200 per call) ………………………
(2)
$ 135,000
Number of calls ……………………………………
Fixed. Use of an accelerated method causes depreciation expense to change from
Fixed element of monthly emergency response cost …
Average cost per call (300 calls per month):
Income taxes are not a fixed, variable, or semivariable cost with respect to net
sales. Income taxes may be viewed as a variable cost, but the relevant activity base
Estimated cost of responding to 300 emergency calls in one
month:
Fixed. Depreciation expense on a sales showroom is independent of the level of
net sales. Fluctuations in net sales have no effect upon the amount of depreciation
B. Ex. 20.3
b.
c. $ 12,000
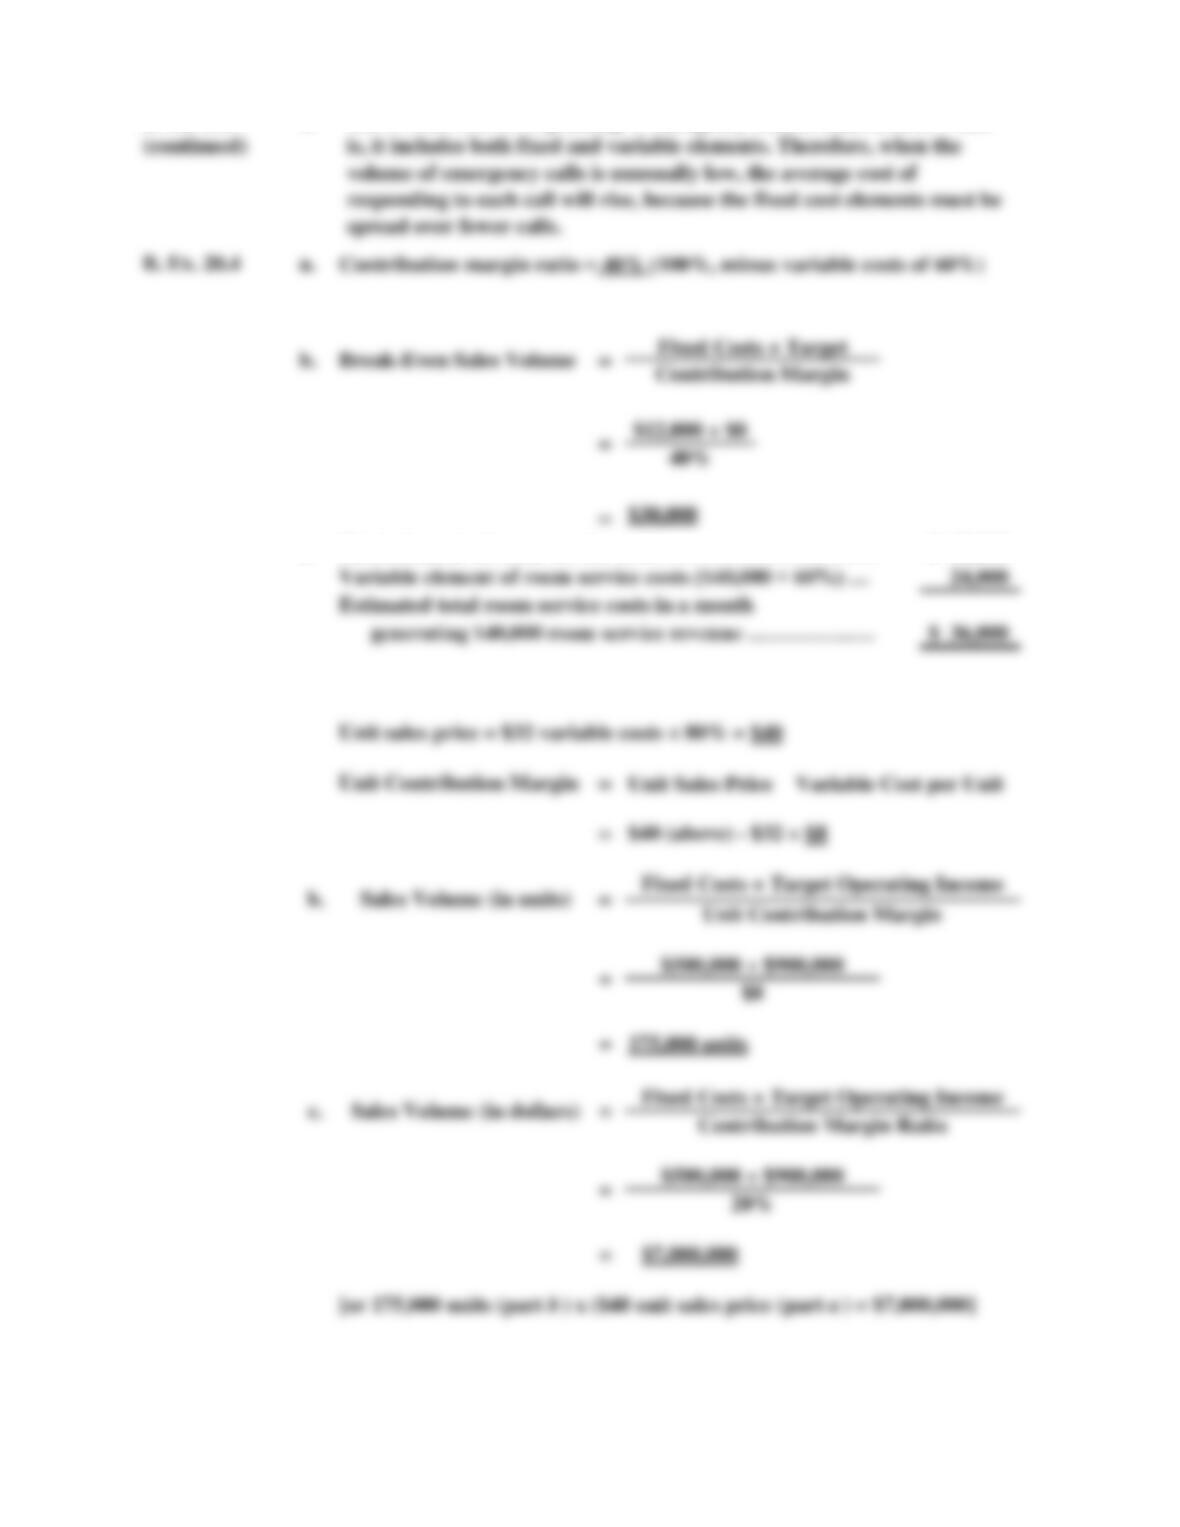
Variable element of room service costs ($40,000 × 60%) …
B. Ex. 20.5 a.
Fixed element of room service costs …………………………
If the contribution margin ratio is 20%, variable costs must be 80% of
The overall cost of responding to emergency calls is semivariable—that
B. Ex. 20.6 a.
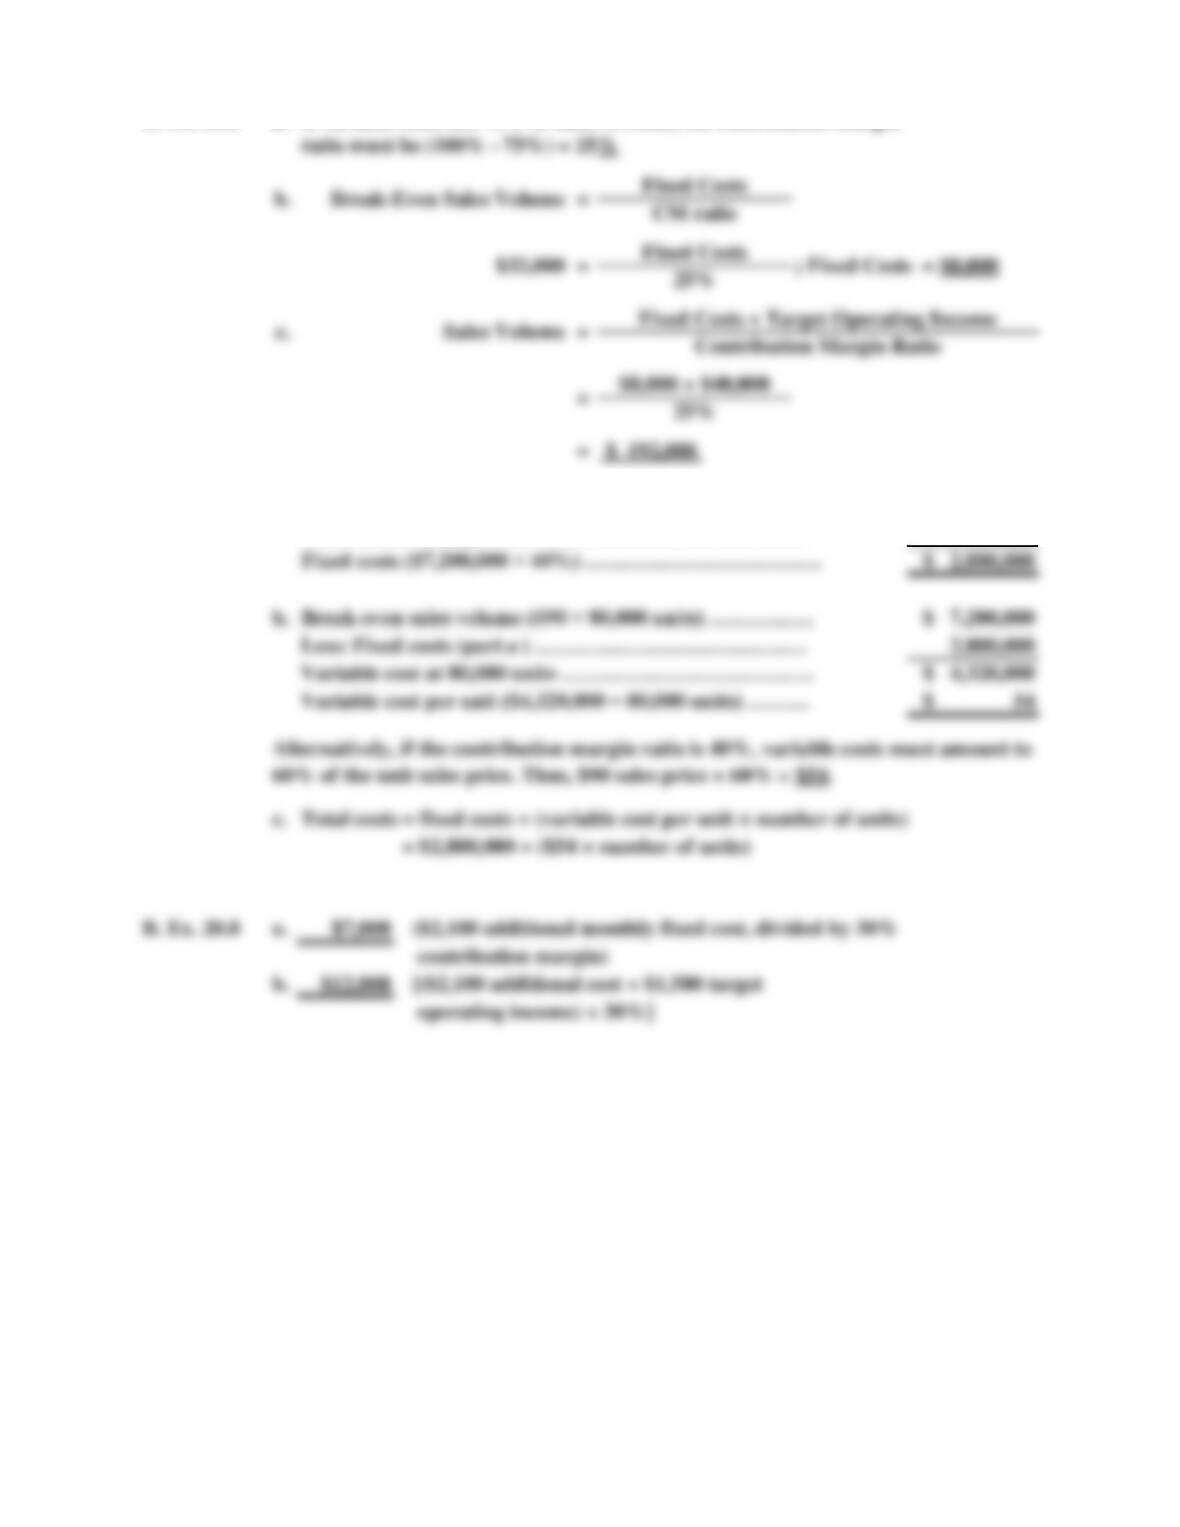
B. Ex. 20.7 a. $ 7,200,000
40%
Break-even sales volume ($90 × 80,000 units) ……………
Variable cost per unit ($4,320,000 ÷ 80,000 units) ………
Fixed costs ($7,200,000 × 40%) …………………………….
Variable cost at 80,000 units ………………………………
B. Ex. 20.8 a. $7,000
Break-even sales volume ($90 × 80,000 units) …………
Contribution margin ratio ……………………………….
If variable costs are 75% of sales revenue, the contribution margin
B. Ex. 20.9
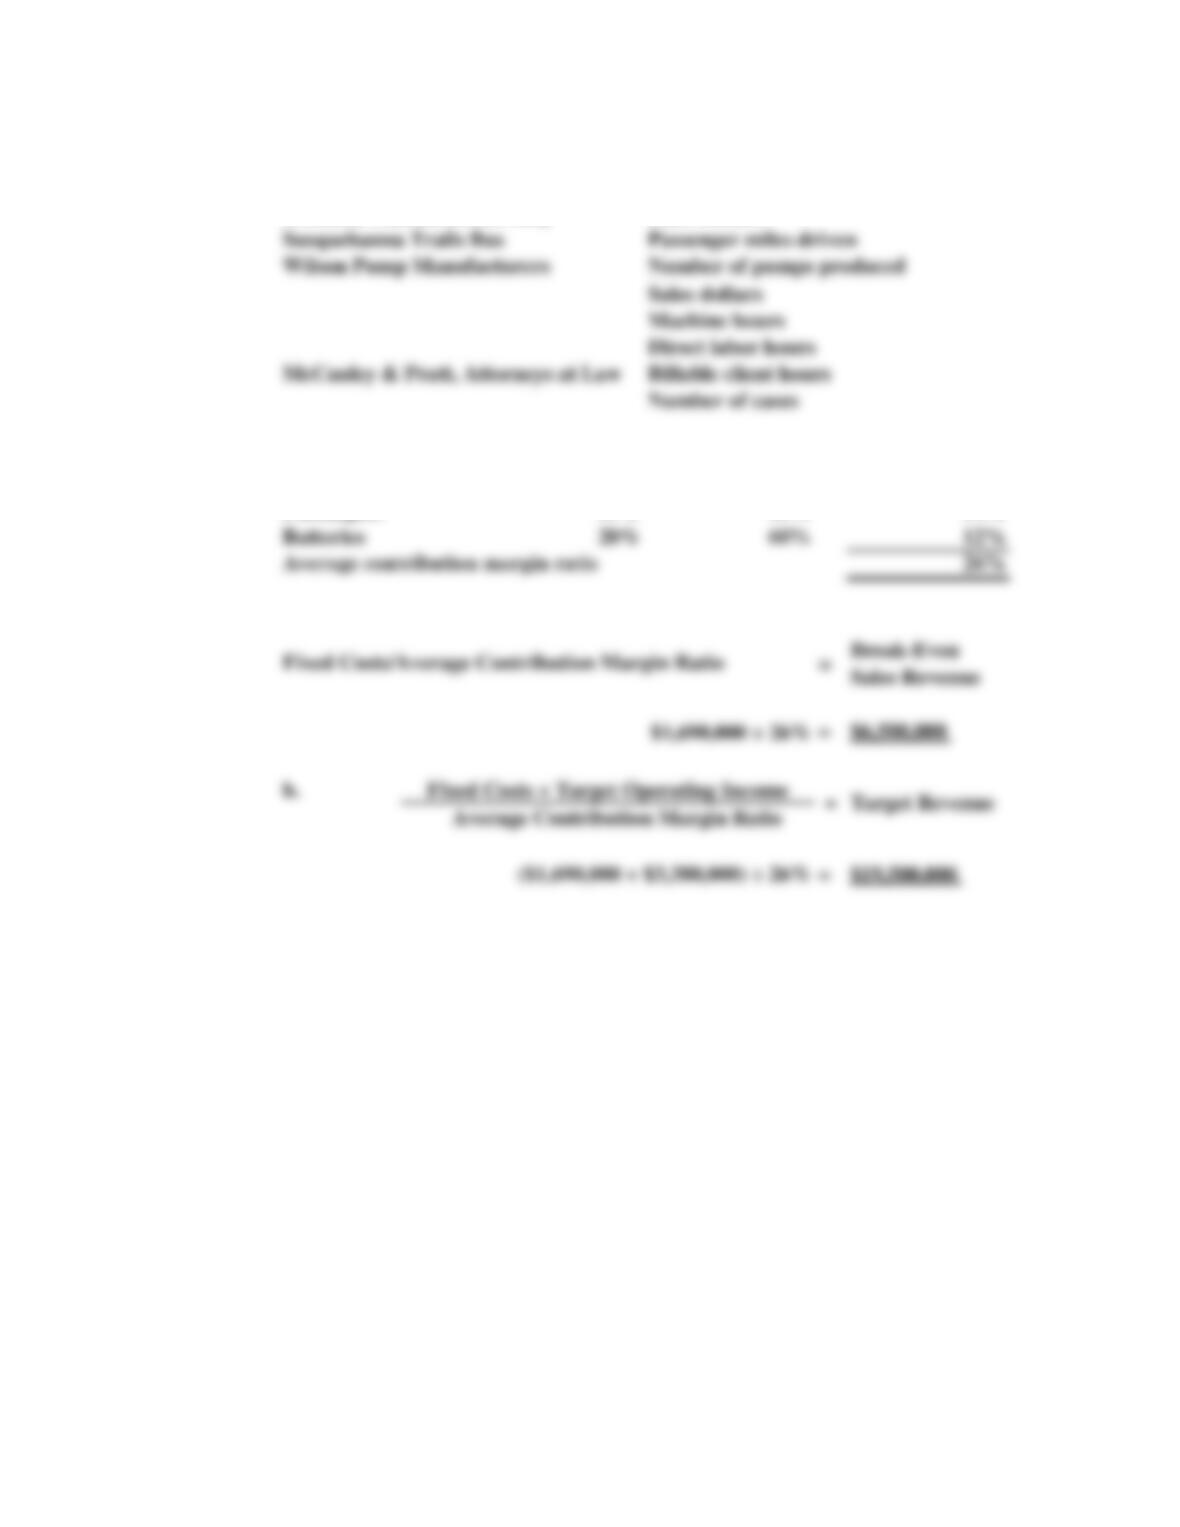
B. Ex. 20.10 a. Contribution Percentage of Average
Margin Ratio × Total Sales = Contribution
40% 14%
Flashlights
Passenger miles driven
Machine hours
Sales dollars
Number of cases
McCauley & Pratt, Attorneys at Law
Billable client hours
Susquehanna Trails Bus
Direct labor hours
35%
Freeman’s Retail Floral Shop
The following activity bases could be suggested to each of your clients:
Possible Activity Bases
Client
Sales dollars
20%
Batteries
SOLUTIONS TO EXERCISES
Ex. 20.1 a.
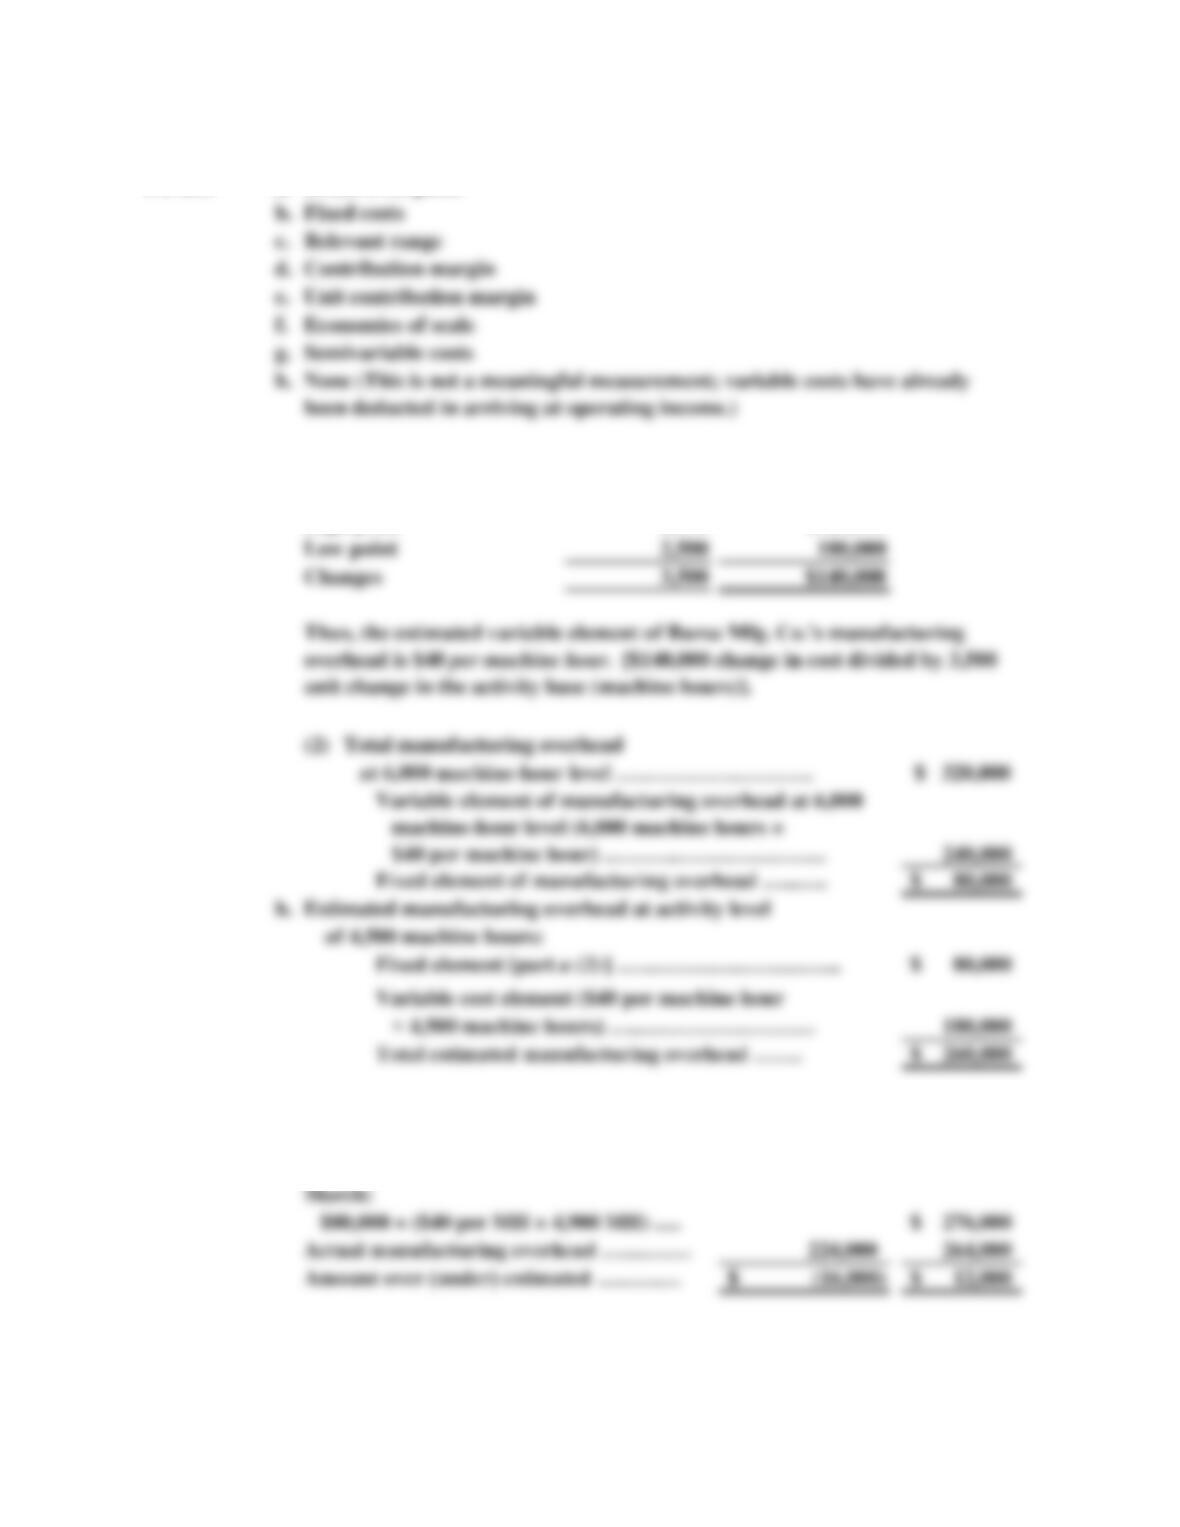
(1) Machine Manufacturing
Hours Overhead
6,000 $320,000
3,500 $140,000
Estimated manufacturing overhead at activity level
Low point
at 6,000 machine-hour level ……………………….
Changes
Total manufacturing overhead
c. February March
$ 208,000
224,000 264,000
$ (16,000) $ 12,000
Break-even point
Estimated manufacturing overhead:
High point
Ex. 20.2
a.
February:
$80,000 + ($40 per MH × 3,200 MH) …….
c.
e.
Economies of scale
Unit contribution margin
Fixed costs
Relevant range
Contribution margin
Semivariable costs
Ex. 20.3 a.
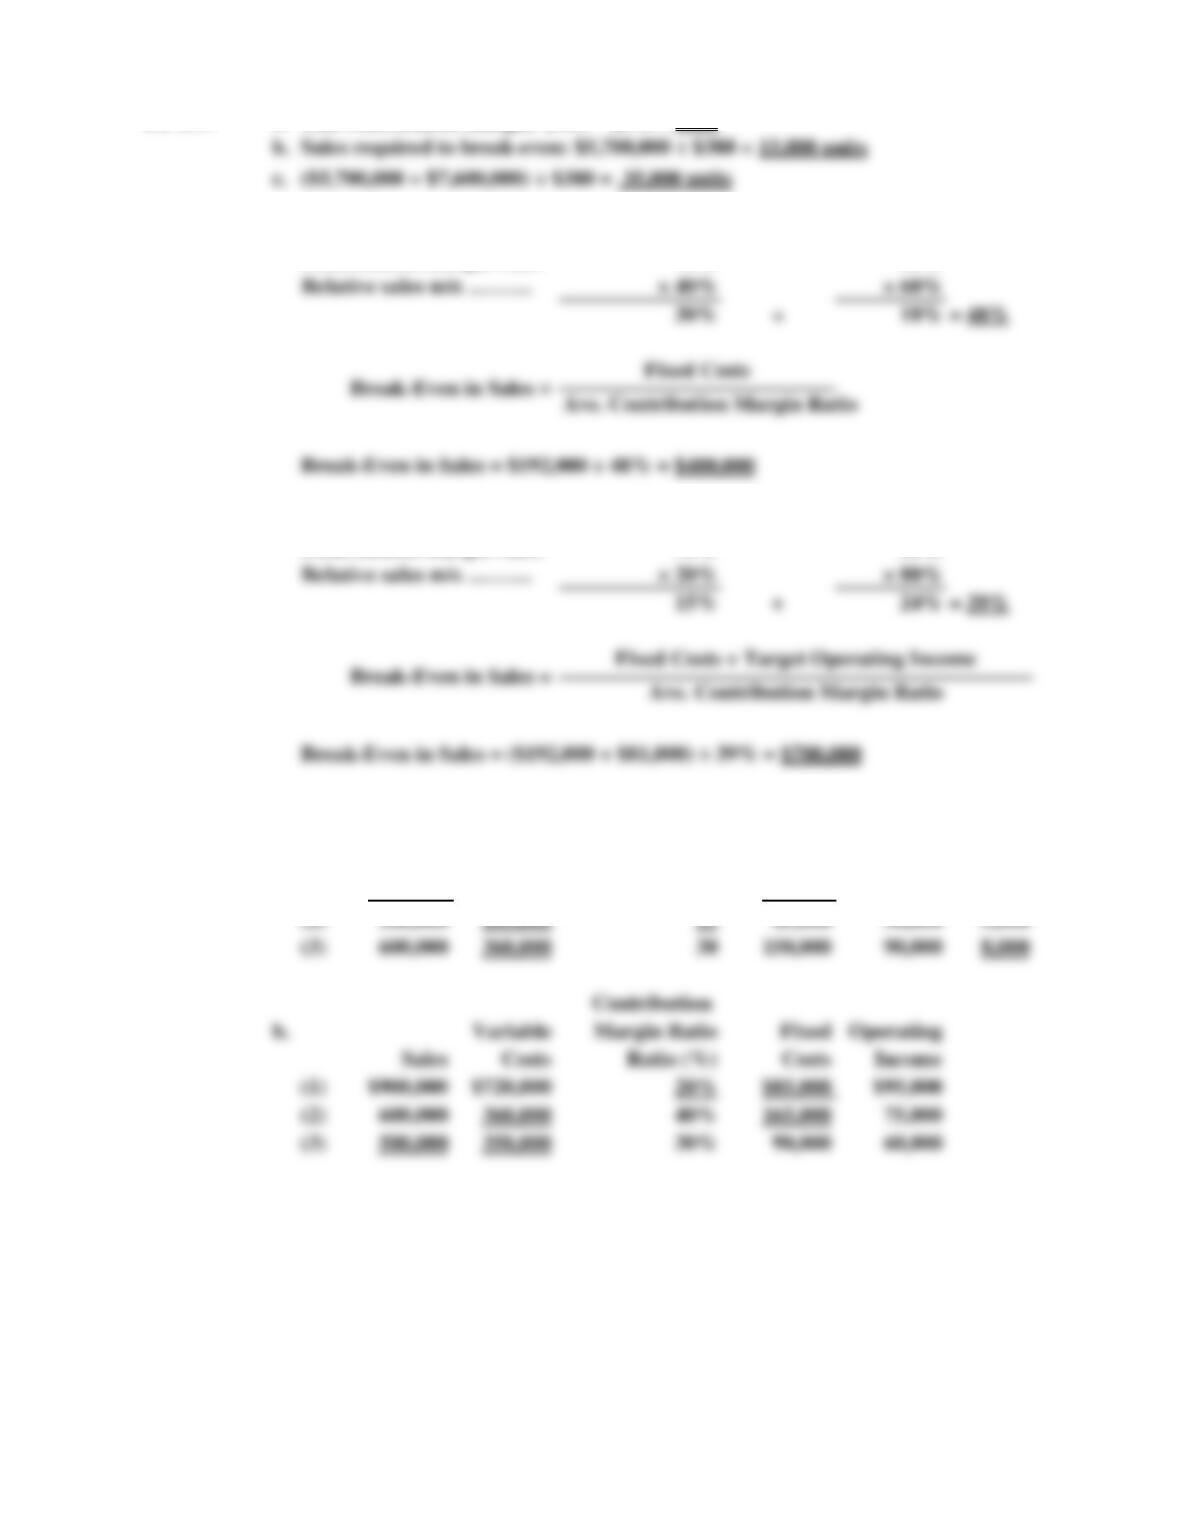
Ex. 20.4 a. Product 1 Product 2
75% 30%
b. Product 1 Product 2
75% 30%
Contribution
Variable
Margin Ratio
Fixed Operating Units
Sales Costs per Unit Costs Income Sold
(1) $200,000 $120,000 $20 $55,000 $25,000 4,000
Contribution
Variable
Margin Ratio
Fixed Operating
Sales Costs Ratio (%) Costs Income
(1) $900,000 $720,000 20% $85,000 $95,000
Unit contribution margin: $950 – $570 = $380
Contribution margin ratio
Contribution margin ratio
Ex. 20.5
a.
Ex. 20.6
Ex. 20.7
It is never ethical to lie to one’s employees. This type of behavior will only serve
=
a.
Contribution Margin Ratio
Unit Sales Price – Variable Cost per Unit
Unit Sales Price
=
=
=
=
$450,000
=
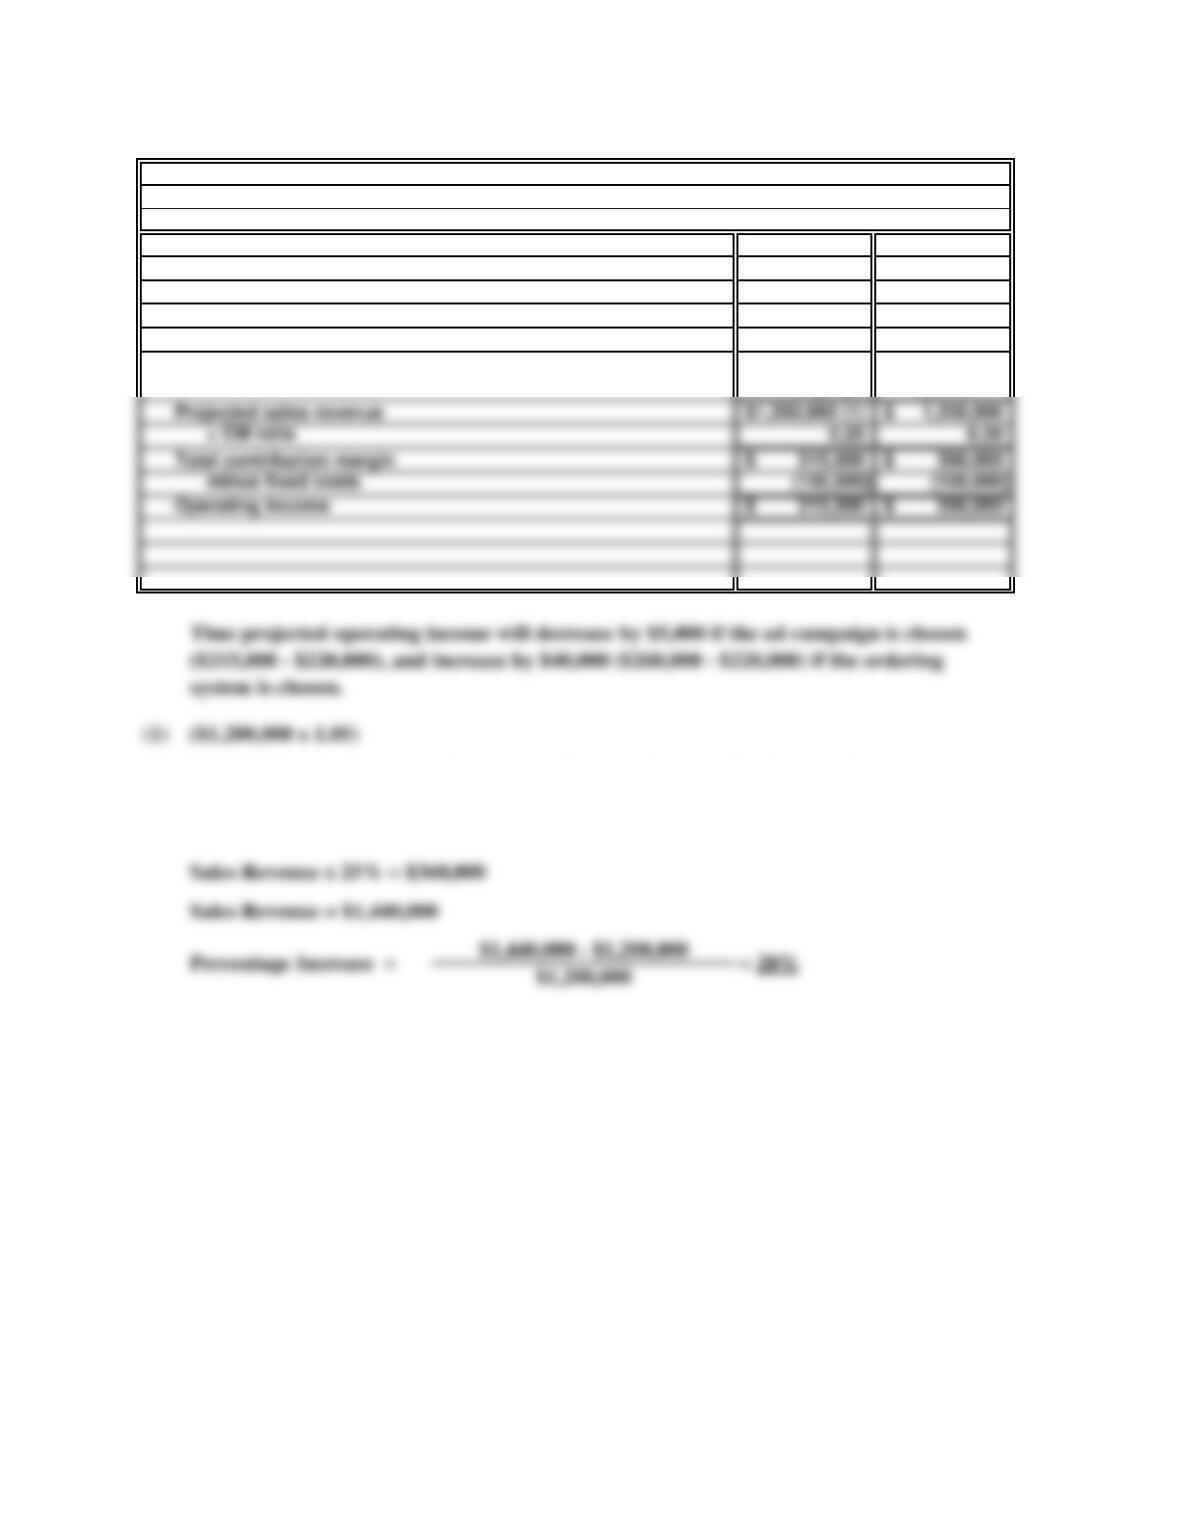
a.
220,000$
Ad Campaign
Ordering
System
b.
Ex. 20.8
For the ad campaign to result in an equal increase in operating income, the total
contribution margin produced must equal that of the ordering system ($360,000).
Projected operating Income without either investment:
($1,200,000 × 0.25) – $80,000
Total contribution margin
Projected sales revenue
a.
$ 1.75
1.25
Contribution margin per unit $ 0.50
d. (1) Unit cost at production level of 40,000 units:
Variable cost per unit $ 1.25
Fixed cost per unit ($20,000 ÷ 40,000 units) 0.50
Total unit cost $ 1.75
Fixed cost per unit ($20,000 ÷ 50,000 units) 0.40
Total unit cost 1.65$
Total cost per unit declines at higher production levels because the fixed manufacturing costs
are allocated over a greater number of units.
Ex. 20.9
Contribution margin per unit:
Unit sale price
Less: Variable cost per unit ($50,000 ÷ $40,000 units)
b.
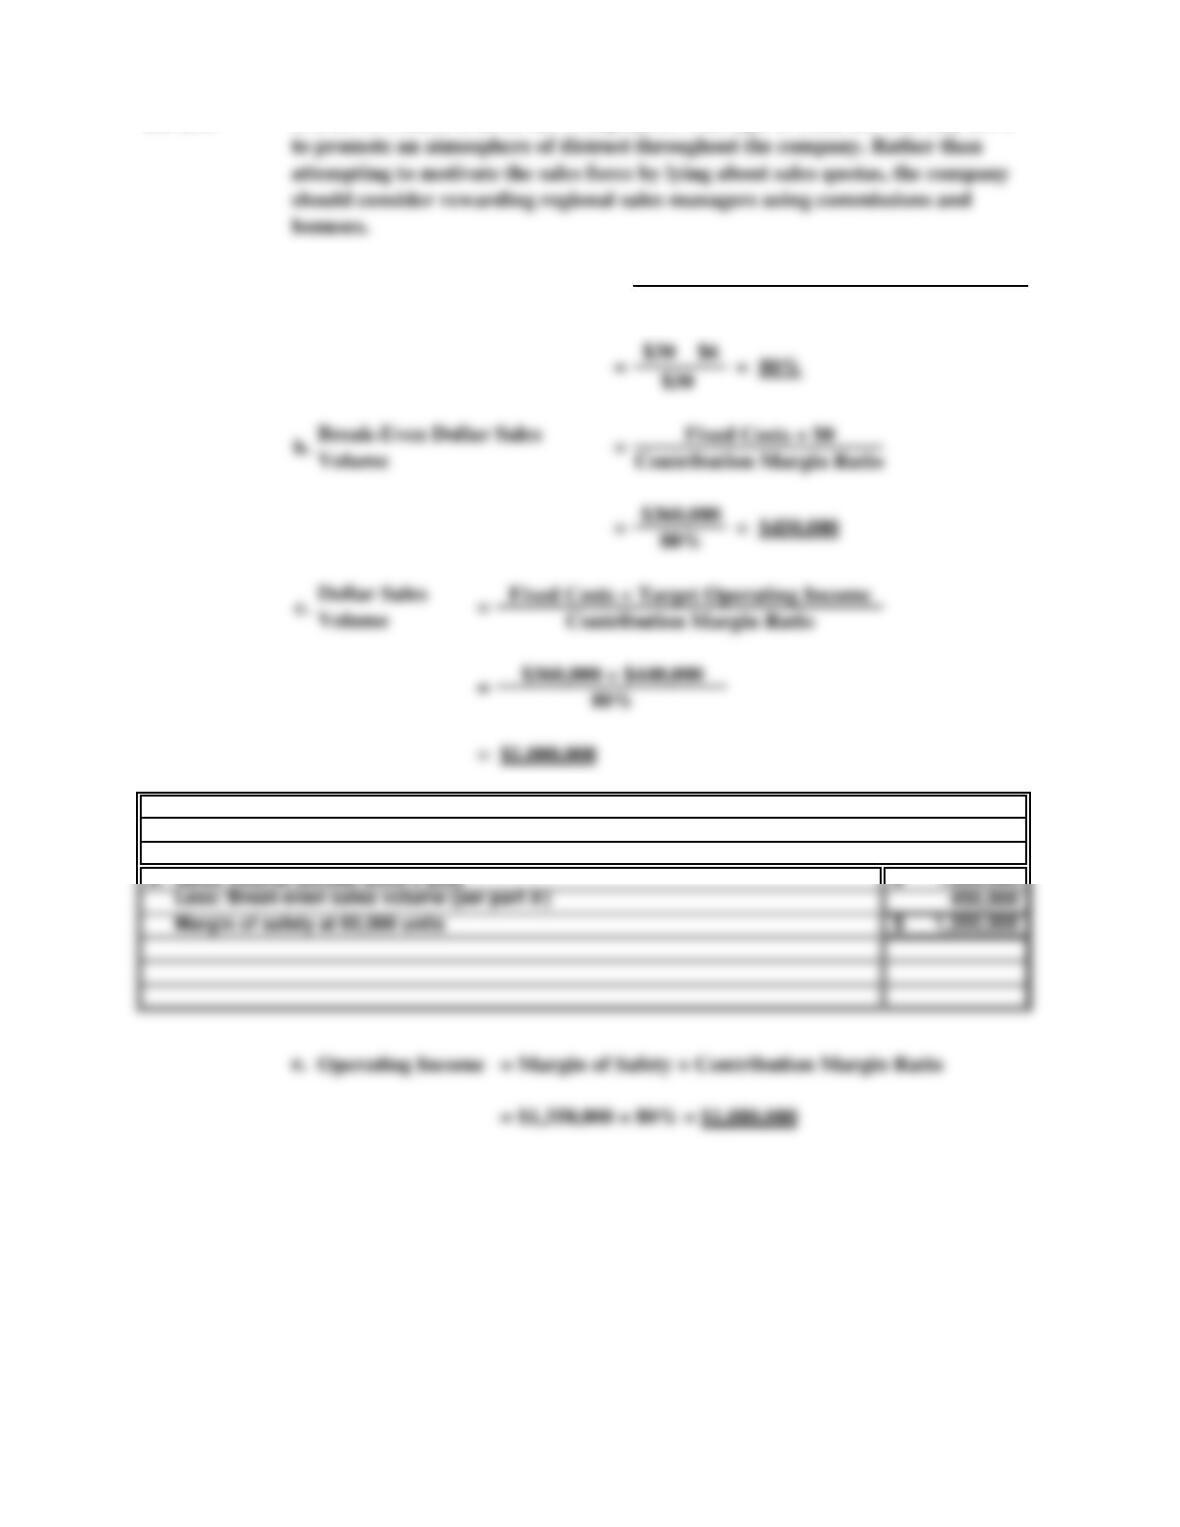
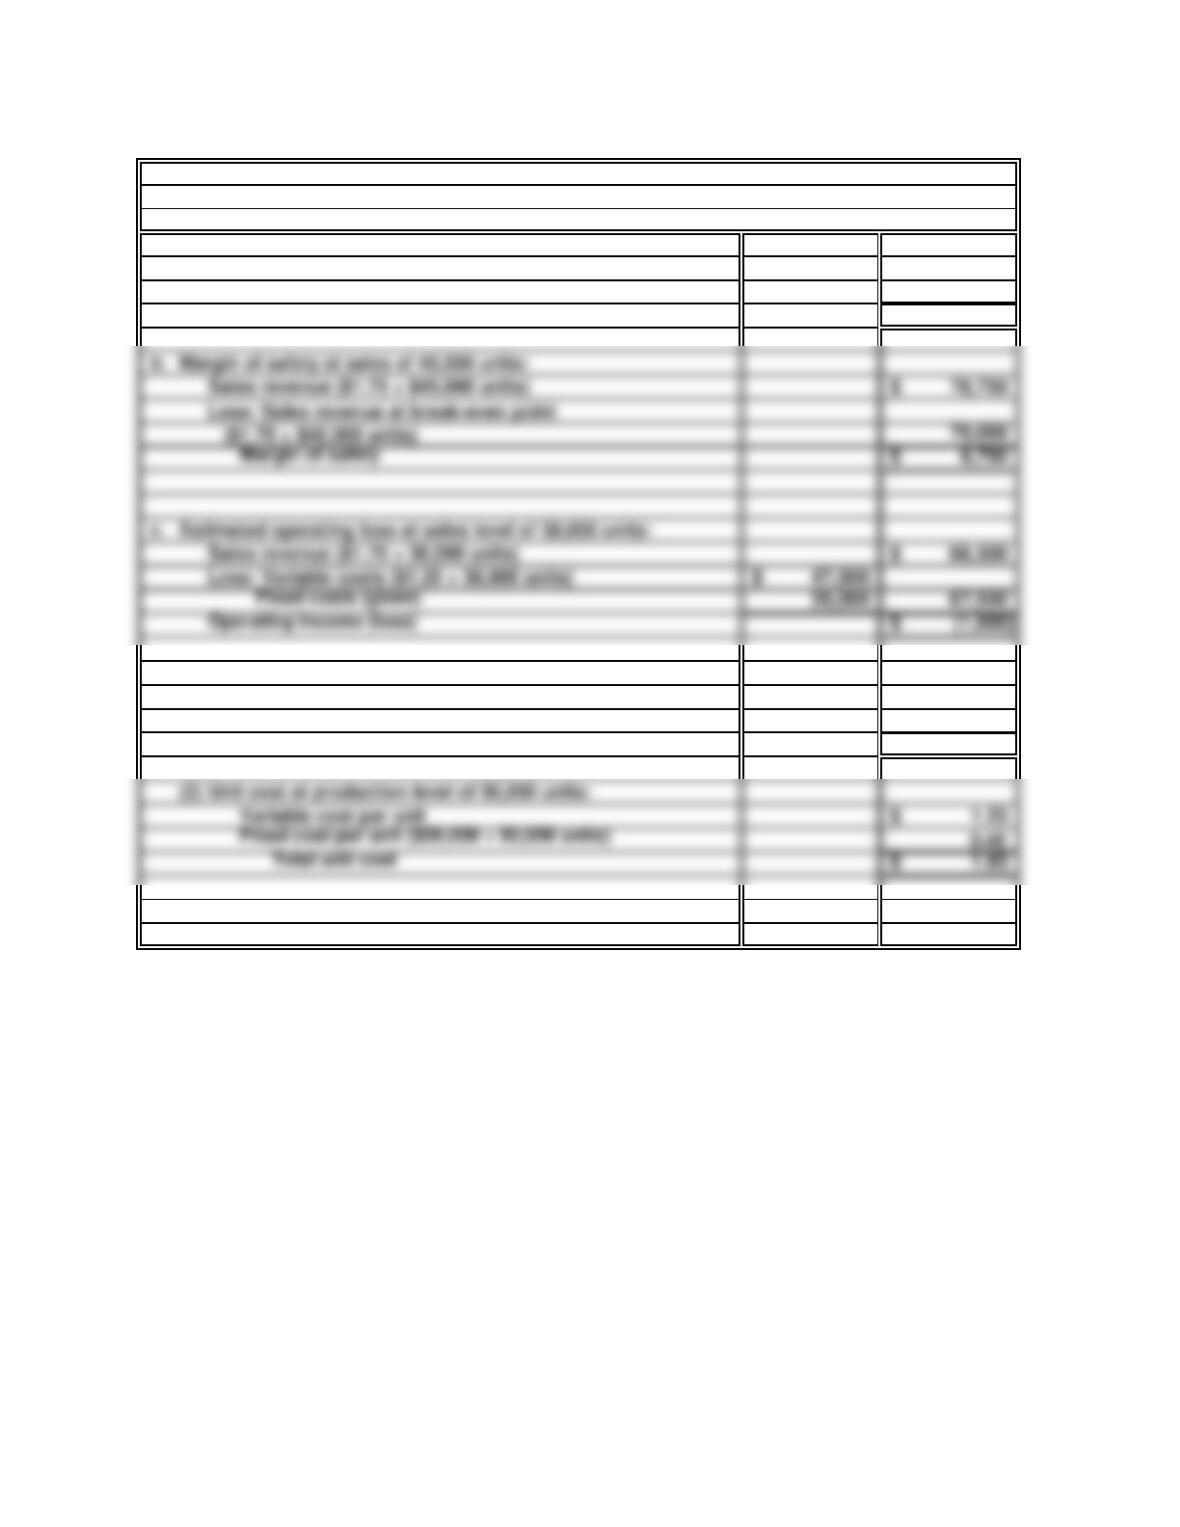
Margin of safety 8,750$
c.
Operating Income (loss) (1,000)$
Margin of safety at sales of 45,000 units:
Estimated operating loss at sales level of 38,000 units:
Divided by contribution margin per unit ………………………
Total fixed costs …………………………………………………
Variable selling and administrative costs per unit ……………
Fixed selling and administrative costs ………………………..
Fixed manufacturing costs ……………………………………..
Ex. 20.10 a.
Ex. 20.11 a. 20$
(6)
b.
60%
900,000$
Target monthly income …………………………………………
Divided by contribution margin ratio ………………………….
Current monthly sales level ……………………………………
c. 900,000$
÷ 60%
Total fixed costs …………………………………………………
Total fixed costs …………………………………………………
Contribution margin ratio ………………………………………
Contribution margin ratio (CM ÷ SP) …………………………..
Selling price per unit ……………………………………………
Variable manufacturing costs per unit………………………….
Contribution Margin
Ratio
Unit Sales Price – Variable Costs
Sales Price
=
=
=
=
=
=
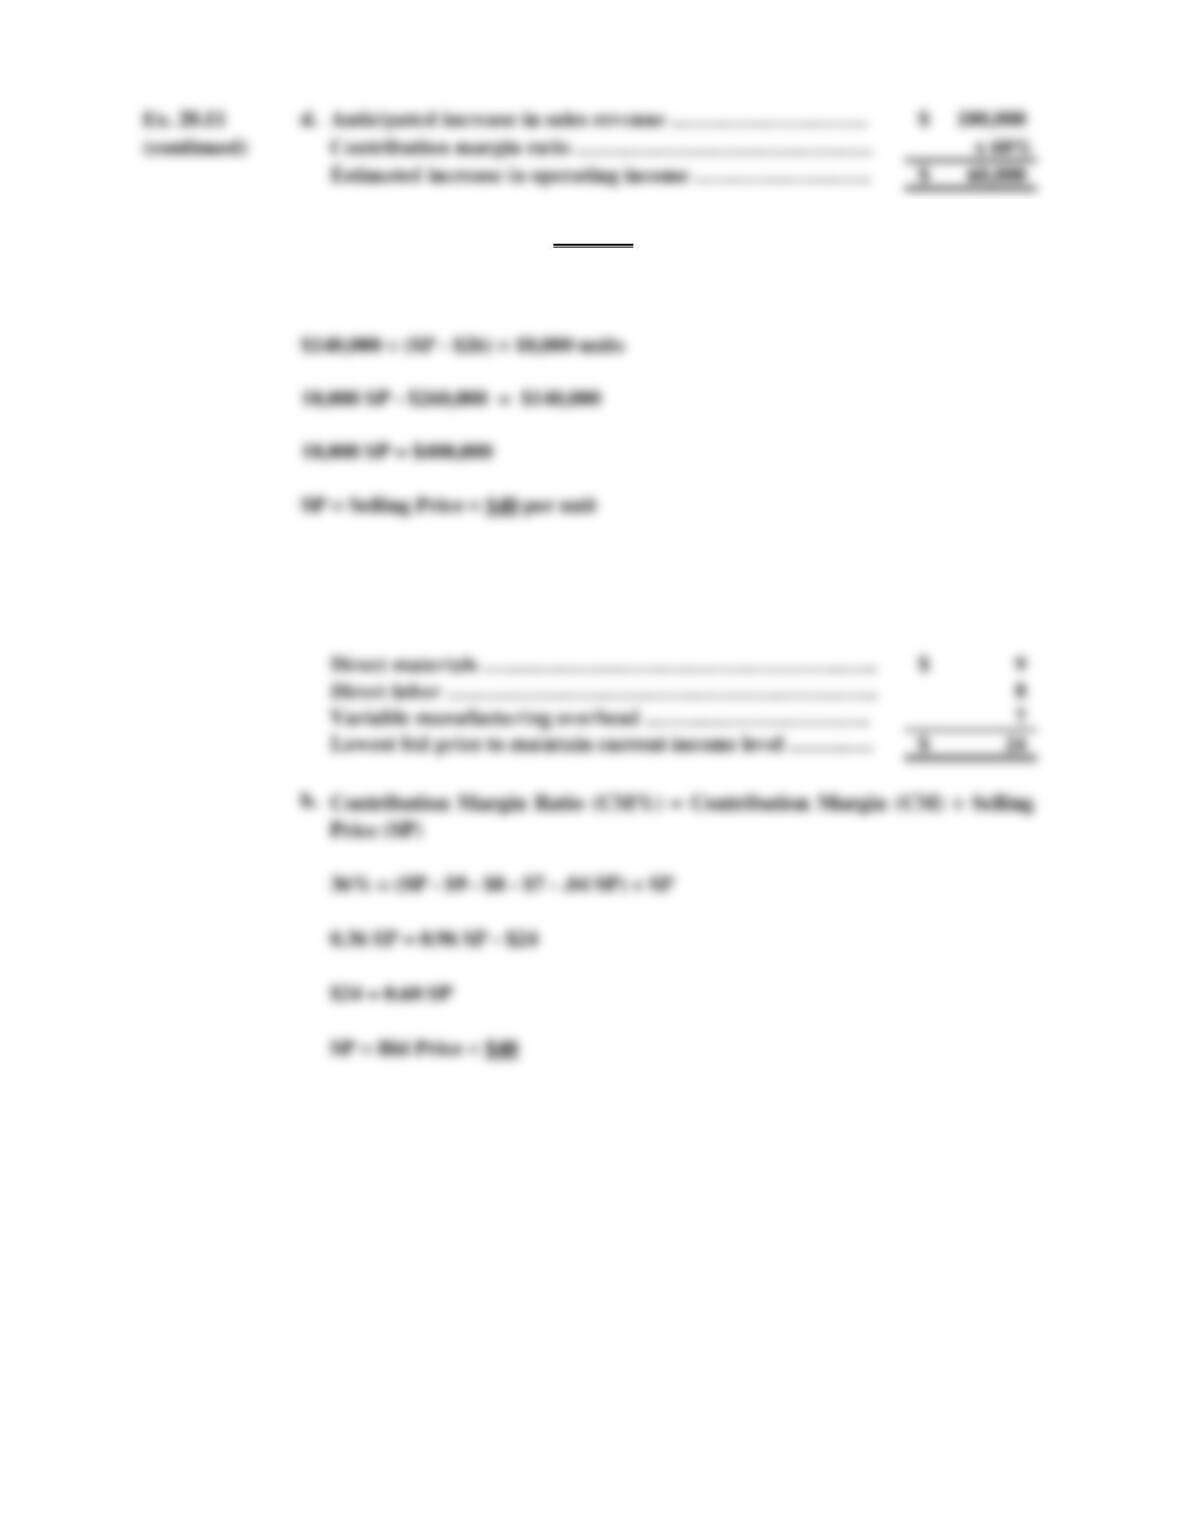
Ex. 20.12
20,000 units x $7 per unit = $140,000 total fixed costs
SP = Selling Price = $40 per unit
Fixed Costs ÷ Contribution Margin = Break-Even in Units
Ex. 20.13 a. The lowest bid price required to maintain the current
level of operating income equals total variable cost
per unit: